1. Introduction
Wind lidar can measure the line of sight (LOS) wind speed at distances from a few centimeters to several kilometers. Depending on their deployment, the LOS speed is obtained by means of lidar systems firmly sitting on the ground, floating in the water or orbiting around the Earth. The first commercial wind lidar systems targeted at wind energy applications appeared in the early 2000s [
1]. Because of their costs and ease of installation, lidar have become accepted as an alternative to the traditional mast-based wind sensors for site assessment and power performance testing, as evidenced by their inclusion in international standards (e.g., [
2]). They are popular offshore because they reduce the need for a fixed platform (e.g., [
3]). Additionally, because they can measure upwind of operating turbines, wind lidars are being used for feed-forward control of wind turbines [
4]. However, despite their advantages, wind lidars have not replaced traditional anemometry in everyday use.
IEA Wind Task 32 “Wind Lidar”—herein referred to as “Task 32”—was set up in 2011 to support the deployment of lidar for wind energy applications. Its members identify the barriers to the deployment of lidar for wind energy and develop roadmaps to removing those barriers that can then be implemented by the wind energy lidar community. Task 32 is one of several international collaborative research tasks that are enabled by the International Energy Agency (IEA) Technology Collaboration Programme (IEA Wind TCP). IEA Wind is a vehicle for member countries to exchange information on the planning and execution of large-scale wind system projects and to undertake co-operative research and development projects called Tasks or Annexes.
In 2015, participants in Task 32 identified four main application areas where an international collaboration between researchers, device manufacturers, end users and other stakeholders could mitigate barriers. These application areas include site assessment, wind turbine power performance, wind turbine controls, and the use of lidar to measure complex flow. The application areas are currently at different technology readiness levels: lidar systems are already used by industry for site assessment and power performance, and so the barriers are more related to implementation. For loads and control as well as for use in complex flow applications, there are still open research questions to solve (
Figure 1). This paper describes the barriers that Task 32 identified to the deployment of wind lidar in each of these application areas, and the steps that have been taken to confirm or mitigate the barriers.
The barriers identified in this paper are generally described in terms of specific “use cases”, for example for the use of nacelle-mounted, forward-looking lidar for wind turbine control. A use case has three elements:
Data requirements. A fundamental aspect of the “use case” approach is the articulation of the needs that are being fulfilled by the measurement campaign in advance, without reference to any assumptions about instrument capabilities, to ensure an outcome-driven approach to measurement and analysis campaign design is adopted. This contrasts with the constraint-driven approach previously adopted in response to the limitations of instruments that preceded lidar, such as met masts.
Measurement method. Given the diversity of methods that can be implemented using lidar, it is important that a technique is selected that both fulfills the data requirements and is amenable to complete documentation, such as risk assessments and method statements, to support repeatability and reproducibility of measurements.
Measurement situation. A given measurement method will perform with respect to accuracy in different ways under different sets of circumstances. It is important that the situation in which the lidar is operated is documented and its influence on lidar performance is understood. Assumptions entailed by wind flow reconstruction algorithms may be invalid under certain sets of circumstances. The result of a calibration of a lidar operated in accordance with a given method in a given situation is only transferable to situations (i.e., can be used later or elsewhere) that are similar in all important respects (those that influence lidar performance) where the same method is used.
The adoption of a use case approach to describing lidar operations ensures all the relevant information is captured to ensure lidar is operated in a consistent manner that is fit for purpose and supports calibrations and uncertainty evaluations that are transferable.
Readers are asked to note that, because of commercial considerations, it is not always possible to provide quantitative information on business practices within the wind energy industry. Therefore, some material in this text is by necessity qualitative. Unless otherwise stated, such material is based on anecdotal evidence or from presentations and discussions at IEA Wind Task 32 and other meetings.
2. Lidar for Site Assessment
Site assessment is the process of quantifying the wind and weather conditions on a potential wind farm site on land or offshore. The objective of a site assessment is to measure parameters such as wind speed, turbulence intensity, gusts, and wind direction at multiple heights, and also the temperature, pressure, and precipitation at the site. This information is used to derive the information needed to layout the plant (for example, wind shear or veer), help select suitable wind turbines, and estimate power production before a wind farm is built [
5,
6]. The basic value of such studies is in providing the data required for a wind energy development; further value can be added by reducing the uncertainty of the data, which reduces financing costs [
7,
8].
2.1. On Land
Wind lidar have many applications in wind energy project development. For example, profiling lidar can often measure wind speed and direction up to 300 m above ground and so can be used to confirm hub-height wind speeds based on vertical extrapolation from meteorological (met) tower measurements at lower heights above ground [
9]. Profiling wind lidar can also directly measure the wind speed at multiple heights across the potential turbine rotor disk [
10]. Scanning devices may measure up to 10 km away, enabling measurements across a site from one location (see, e.g., [
11,
12,
13]).
These applications require measuring LOS wind speed with the lidar and converting them in to a wind speed and direction. This process—known as wind field reconstruction—requires a model of the flow. In simple terrain, a very basic homogeneous flow model is assumed, thus a wind vector for the whole flow can be estimated by probing the wind field from different directions to give multiple different line of sight speed, azimuth and elevation data. The wind vector is derived by fitting the measured LOS wind speeds to a wind vector, assuming horizontal homogeneity [
14].
An initial barrier to the adoption of wind lidar was a lack of guidelines or standards for specific applications and situations. In order to support the adoption of wind lidar, Task 32 worked with IEA Wind Task 11 to develop recommended practices for the use of remote sensing for resource assessment in simple terrain [
15]. This internationally recognized, community-led recommended practice and other industry guidelines helped users gain confidence in lidar.
Another early barrier to the use of lidar was its purchase cost. Initially, manufacturers argued that the total cost of ownership of a lidar was comparable to two or more tall met masts [
8], and that value could be gained by reducing uncertainty. Since then, the purchase price of lidar hardware has come down. This may be related to the increasing availability of high-quality photonics and electronics at lower prices, better manufacturing processes, and competition between manufacturers. The cost of lidar is therefore no longer seen as a hard barrier to deployment, but even so a reduction in the lifetime cost of lidar would make it even more compelling for wind energy applications. Although Task 32 does not address cost directly, the Task helps users exchange ideas and experiences with wind lidars and thereby helps reduce the learning curve and increase the potential value that can be extracted from the lidar data.
Because of the way they obtain and process data, the turbulence information obtained from a lidar differ from those obtained by point measurements from a cup, or smaller volumes such as sonic anemometers [
16,
17]. Task 32 members produced a comprehensive report that summarized these issues and potential solutions in 2015 [
18]. The potential for differences between turbulence metrics obtained by lidar and other devices does not appear to have become a barrier to adoption.
As lidar has become more widely used and wind energy developments have moved into more complex terrain, questions have been raised around the use of lidar in complex terrain. This is because flow reconstruction in complex terrain is challenging because the flow is no longer homogeneous (e.g., [
19]). Furthermore, heterogeneity makes measurements from traditional anemometers less representative of an area as well. Early thoughts on the barriers to the use of lidar in complex terrain, and potential ways to mitigate its effect, were summarized in a 2015 Task 32 report [
11]. The most common approach currently to measuring in complex terrain conditions is to use lidar and mast measurements together with appropriate flow models (e.g., [
20]). Other mitigation methods that can be used with other types of complex flow are described in
Section 6.
A Task 32 workshop in November 2017 explored the current barriers to the use of lidar for site assessment in complex terrain. The workshop used a series of desktop planning studies around the use of wind lidar in complex terrain. Many of the barriers that were identified also hold for simpler terrain:
The role of flow models: One way to improve wind field reconstruction is to use flow models to fit measurements to a modelled wind field, especially in complex terrain. If this approach becomes common it would mean that the adoption of lidars is directly related to the validation and acceptance of flow models.
Unknown uncertainty: Current approaches quantify wind speed uncertainty as the root mean square difference between the wind speed measured by lidars, and that measured by cup anemometers. This requires either that a cup anemometer have no other sensitivity than to the wind speed, or that all external factors are known and can be accounted for especially if they change during a measurement. This uncertainty model may hold in simple, flat terrain with low turbulence and no precipitation, icing, or vertical flow component. However, in complex terrain or where there is significant variation in external conditions, the uncertainty of a lidar could be considered undefined as both the cup and lidar have unknown sensitivities outside of a narrow ideal range.
Lacking or misleading guidelines: Existing recommended practices and standards do not cover the whole range of potential applications and fail to explain what should be done to achieve satisfactory measurements in complex terrain.
Lack of experts: Deploying and operating wind lidar requires training and experience. There are simply not enough experienced users available to support the many possible uses of wind lidar. This delays its deployment and increases costs.
The November 2017 workshop and other events noted that complex terrain can make site access difficult and that complex terrain is often associated with a lack of access to reliable power. Because these issues are equally a problem for towers, they have not been a focus of Task 32 work. Importantly, the reliability and availability of the lidar itself was not identified as an issue, which reflects progress made in the last decade in developing lidar as a commercial product.
2.2. Offshore
Offshore lidar applications for site assessments can be subdivided into installations on fixed platforms (
Section 2.2.1) and on (or in) floating structures such as buoys (
Section 2.2.2).
2.2.1. Fixed Lidar Offshore
Wind lidars mounted on existing offshore platforms near to project sites can be a viable alternative to conventional offshore met towers (see, e.g., [
21]). Potential deployment locations include offshore meteorological stations as well as oil or natural gas rigs, whether disused or still in operation. Some modifications may be required to make the lidar system reliable in the offshore environment. Based on the review of an extensive body of onshore and offshore evidence, as reported from various industry stakeholders, the use of industry-proven ground-based lidars operated on an offshore stationary platform is considered a benign scenario, provided that no significant flow distortion from the platform or its components might affect the lidar measurements. Industry-proven lidars are lidar types that are commercially available and have an accepted track record onshore. An example of the steps required for a lidar type to be considered “industry-proven” is given in
Section 2.2.2 of [
22]. This benign scenario further increases the potential competitiveness of fixed lidar to conventional offshore met masts.
As with any use of lidars, it is best practice to carry out an appropriate pre- and post-deployment verification program onshore. Furthermore, a sufficient length of data set and data coverage rates are key objectives in wind resource measurement campaigns. Hence, lidar deployments should span a similar period as those undertaken with conventional anemometry. In addition, as with onshore deployments, it is crucial to deploy a lidar system offshore with a sufficient power supply and an appropriate operations and maintenance (O&M) program. If these conditions are met, it is anticipated that similar amounts and quality of wind data would be obtained from industry-proven lidars mounted on a stationary platform, as those from a classical offshore mast (see, e.g., [
21]).
Traditional offshore met masts have relatively complex structure and low porosity, which results in increased drag and flow distortion around the mast compared to guyed, land-based towers. Such effects are also poorly predicted using current standards [
23]. Although the platform itself may cause localized effects, these flow distortions rarely extend to the measurement height [
21], and thus lidar wind measurements may even be more accurate than a mast. This further adds to the advantages of a wind lidar in the offshore environment. The main barrier to adoption is to collect evidence for these advantages.
Lidar on fixed offshore platforms can also be used to calibrate floating lidar systems. This method was included in a IEA recommended practices document [
24].
2.2.2. Floating Lidar
Floating Lidar Systems (FLSs) are essentially lidar units mounted on buoys. The first FLS were developed and tested in the late 2000s to meet the wind industry’s needs for data for offshore wind resource assessment. They offered the potential for reduced costs compared to fixed met masts, similar data, and the ability to measure at the same or even greater heights above water. The first barrier to their adoption was a lack of experience with such systems and a question of whether or not such devices would survive and deliver the required data. Initial results were promising, which together with the potential cost savings helped drive their adoption [
25].
One early barrier to the adoption of floating lidar technology was the lack of objective measures of the performance and maturity of an FLS. To address this, the Carbon Trust Offshore Wind Accelerator programme (OWA) developed a “Roadmap for the commercial acceptance of floating lidar technology” [
22], which included key performance indicators (KPI). The Roadmap defined several objective maturity stages based on the FLS performance measured using the KPIs and respective acceptance criteria.
Another early challenge was how to effectively deploy and use an FLS for different use cases. Therefore, Task 32 started an initiative in 2012 to collect recommended practices (RP) for the application of FLSs. A first collection was published as a state-of-the-art report in early 2016, and then further developed with the support of the Carbon Trust as part of a project within the OWA programme. Finally, a new IEA Wind Recommended Practices document (RP 18, “Floating Lidar Systems”) that combined aspects of all of these documents was published in autumn 2017 [
24].
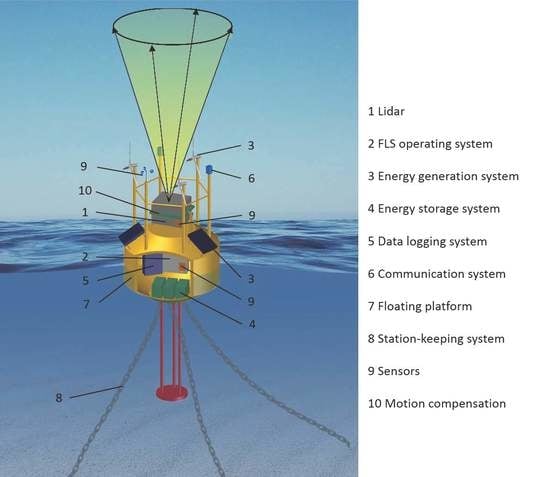
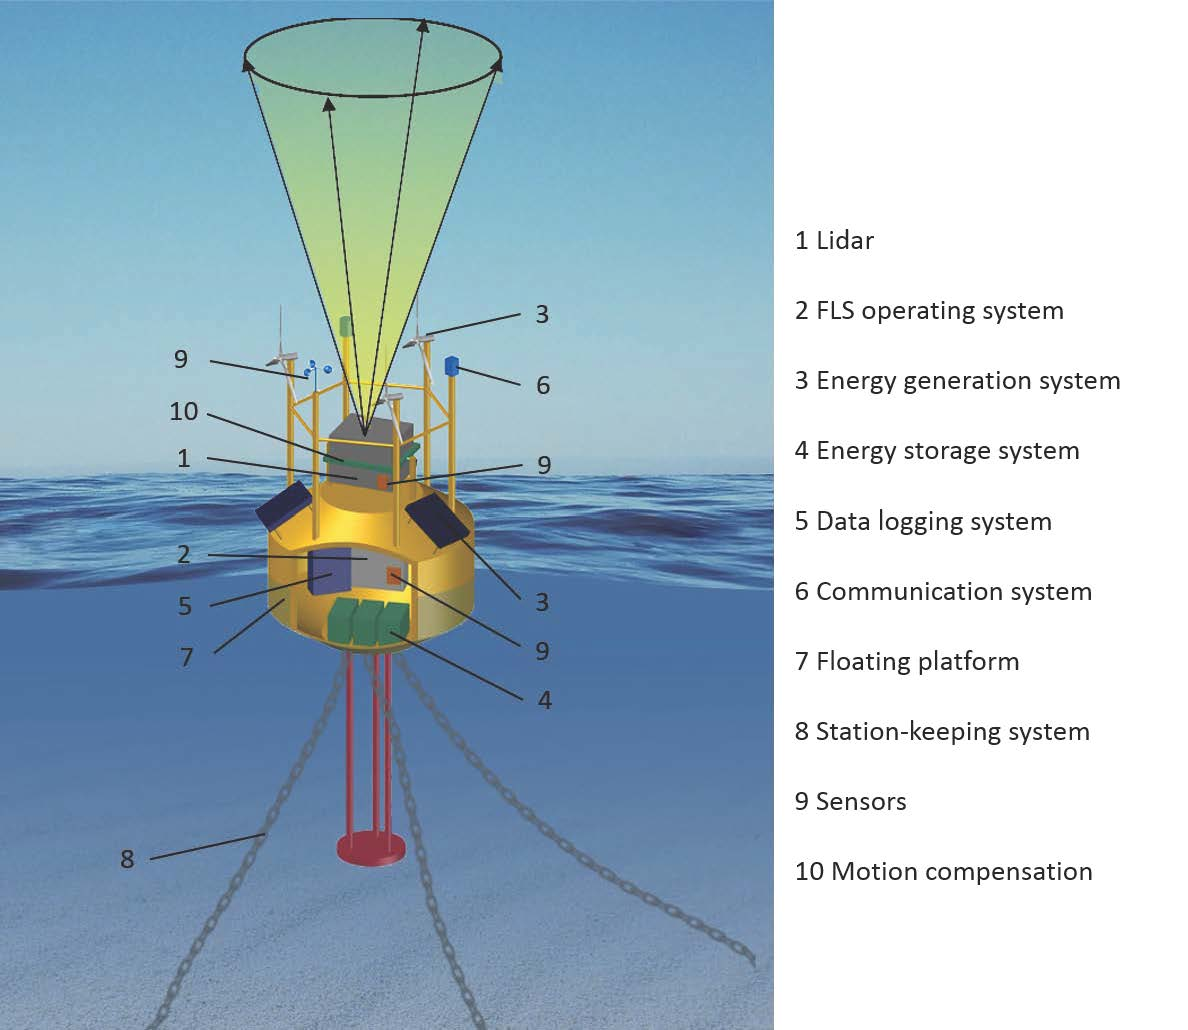
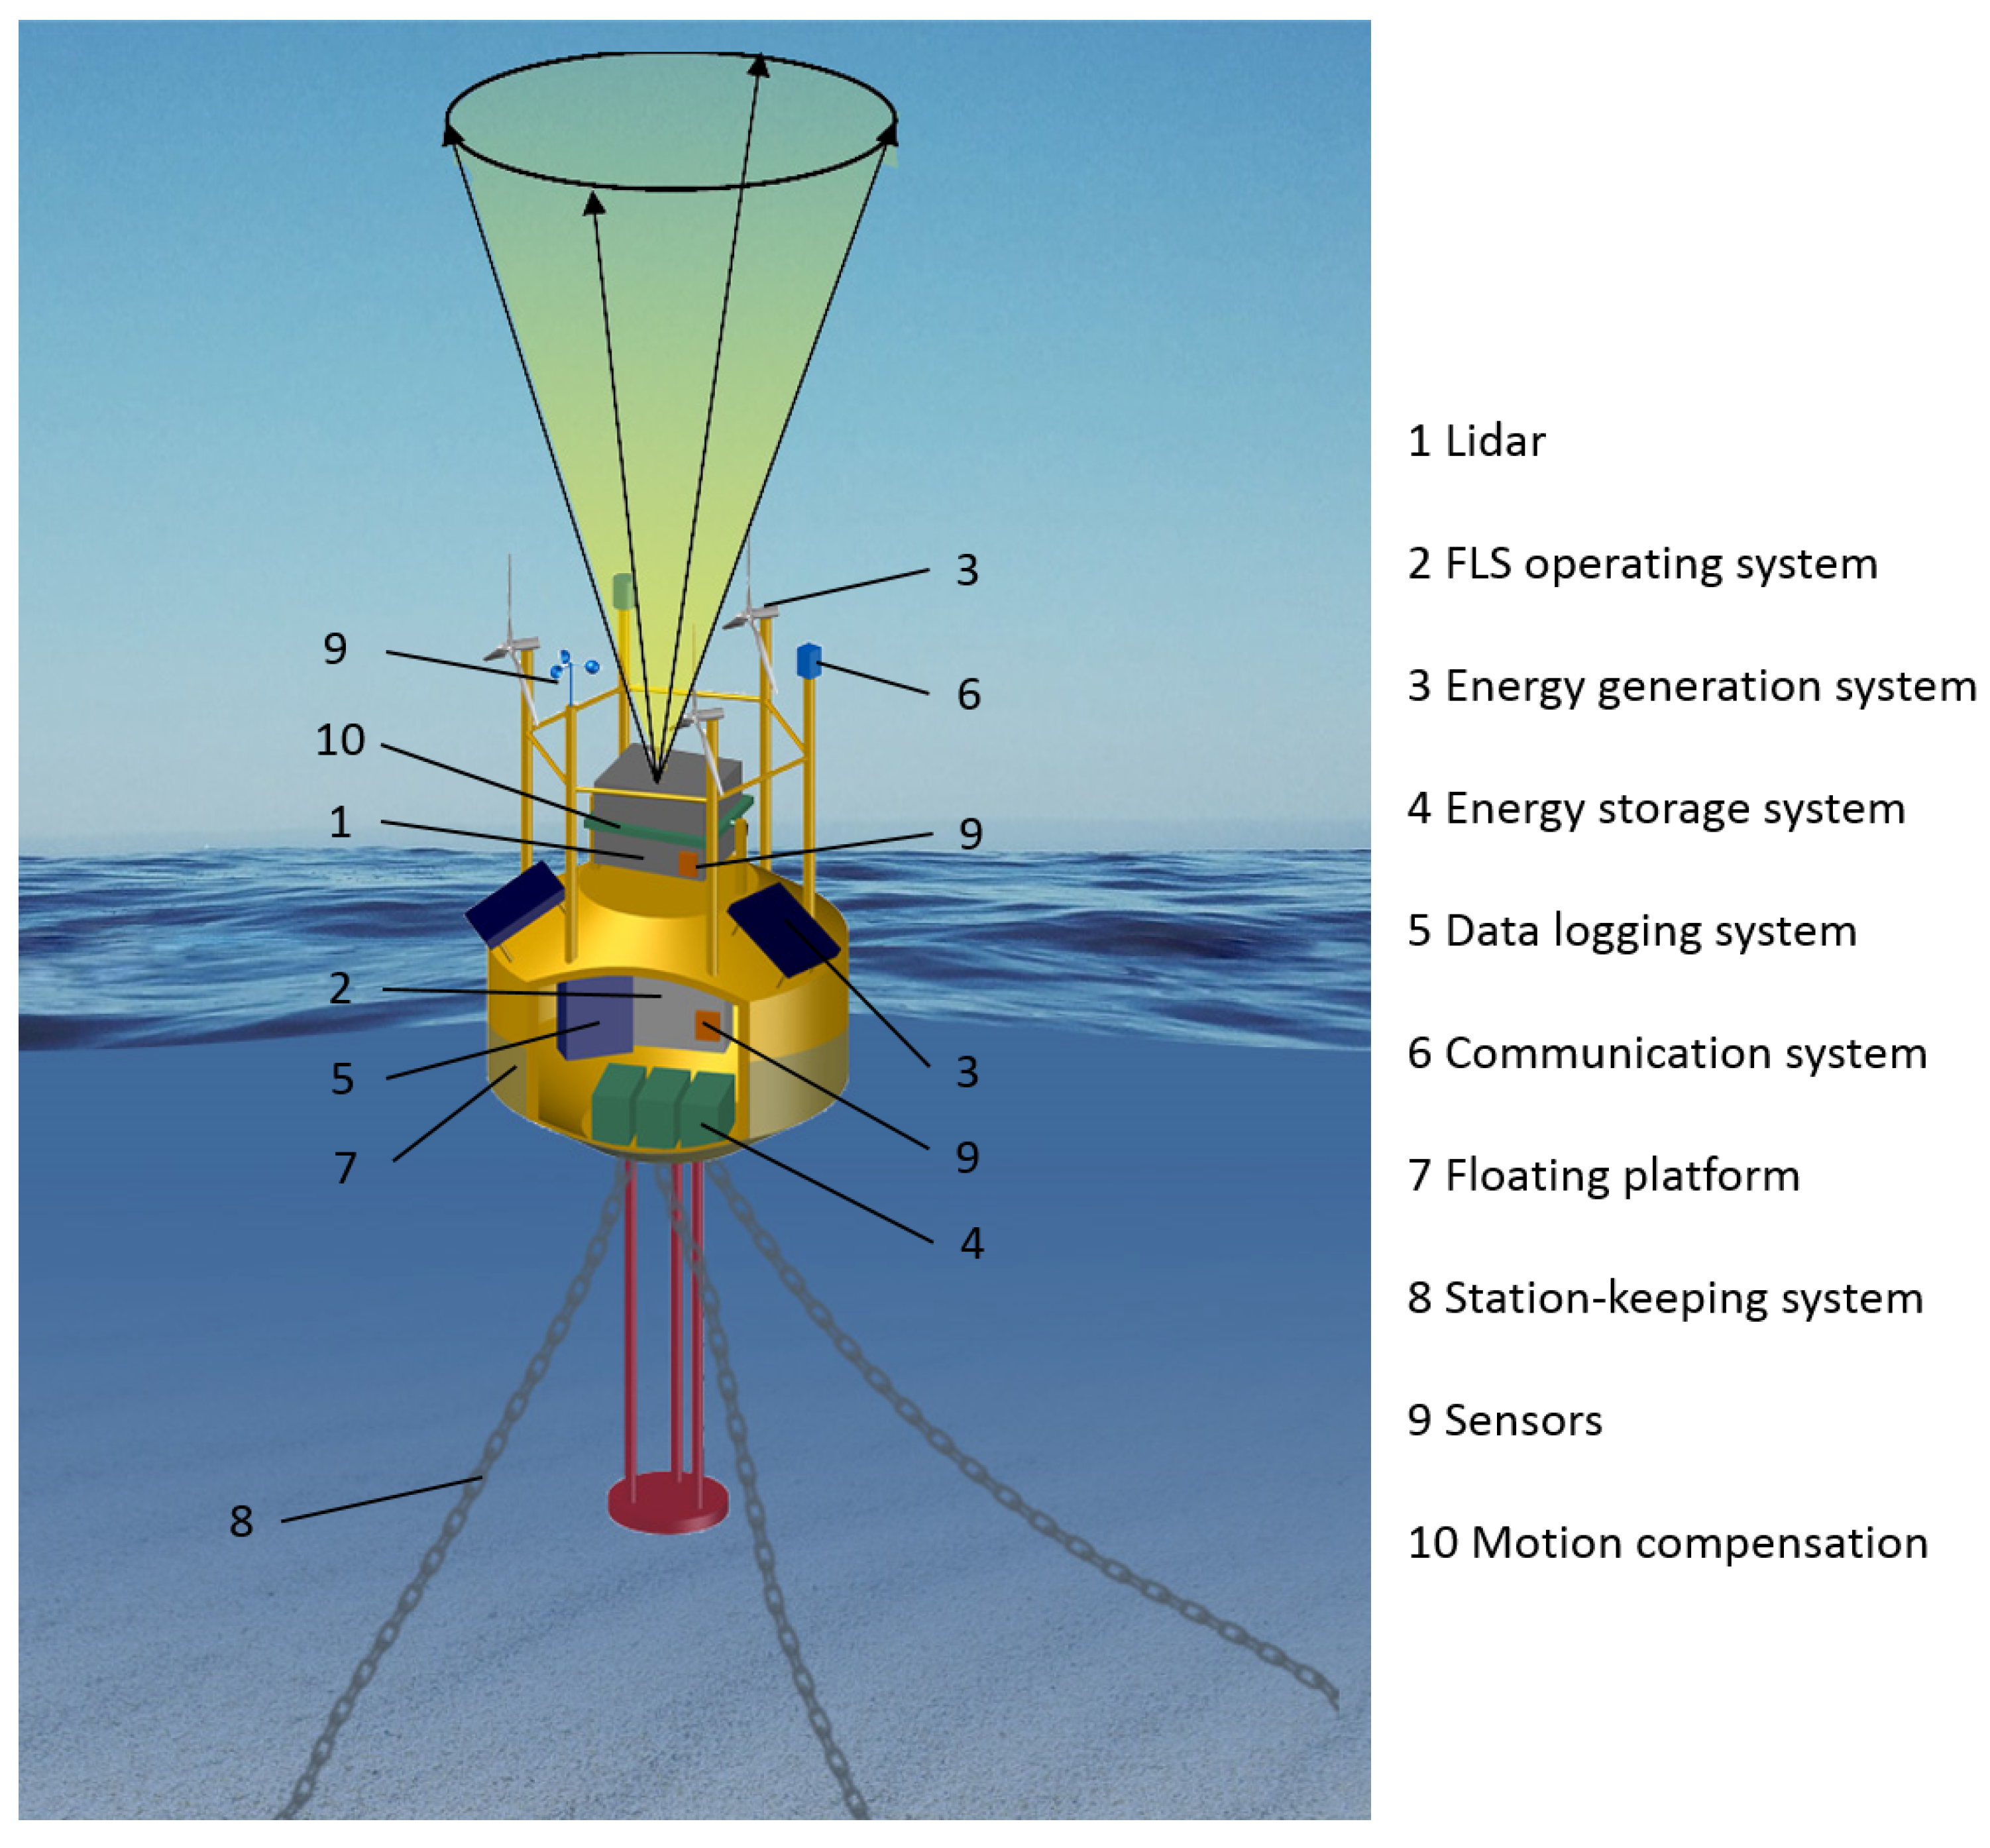
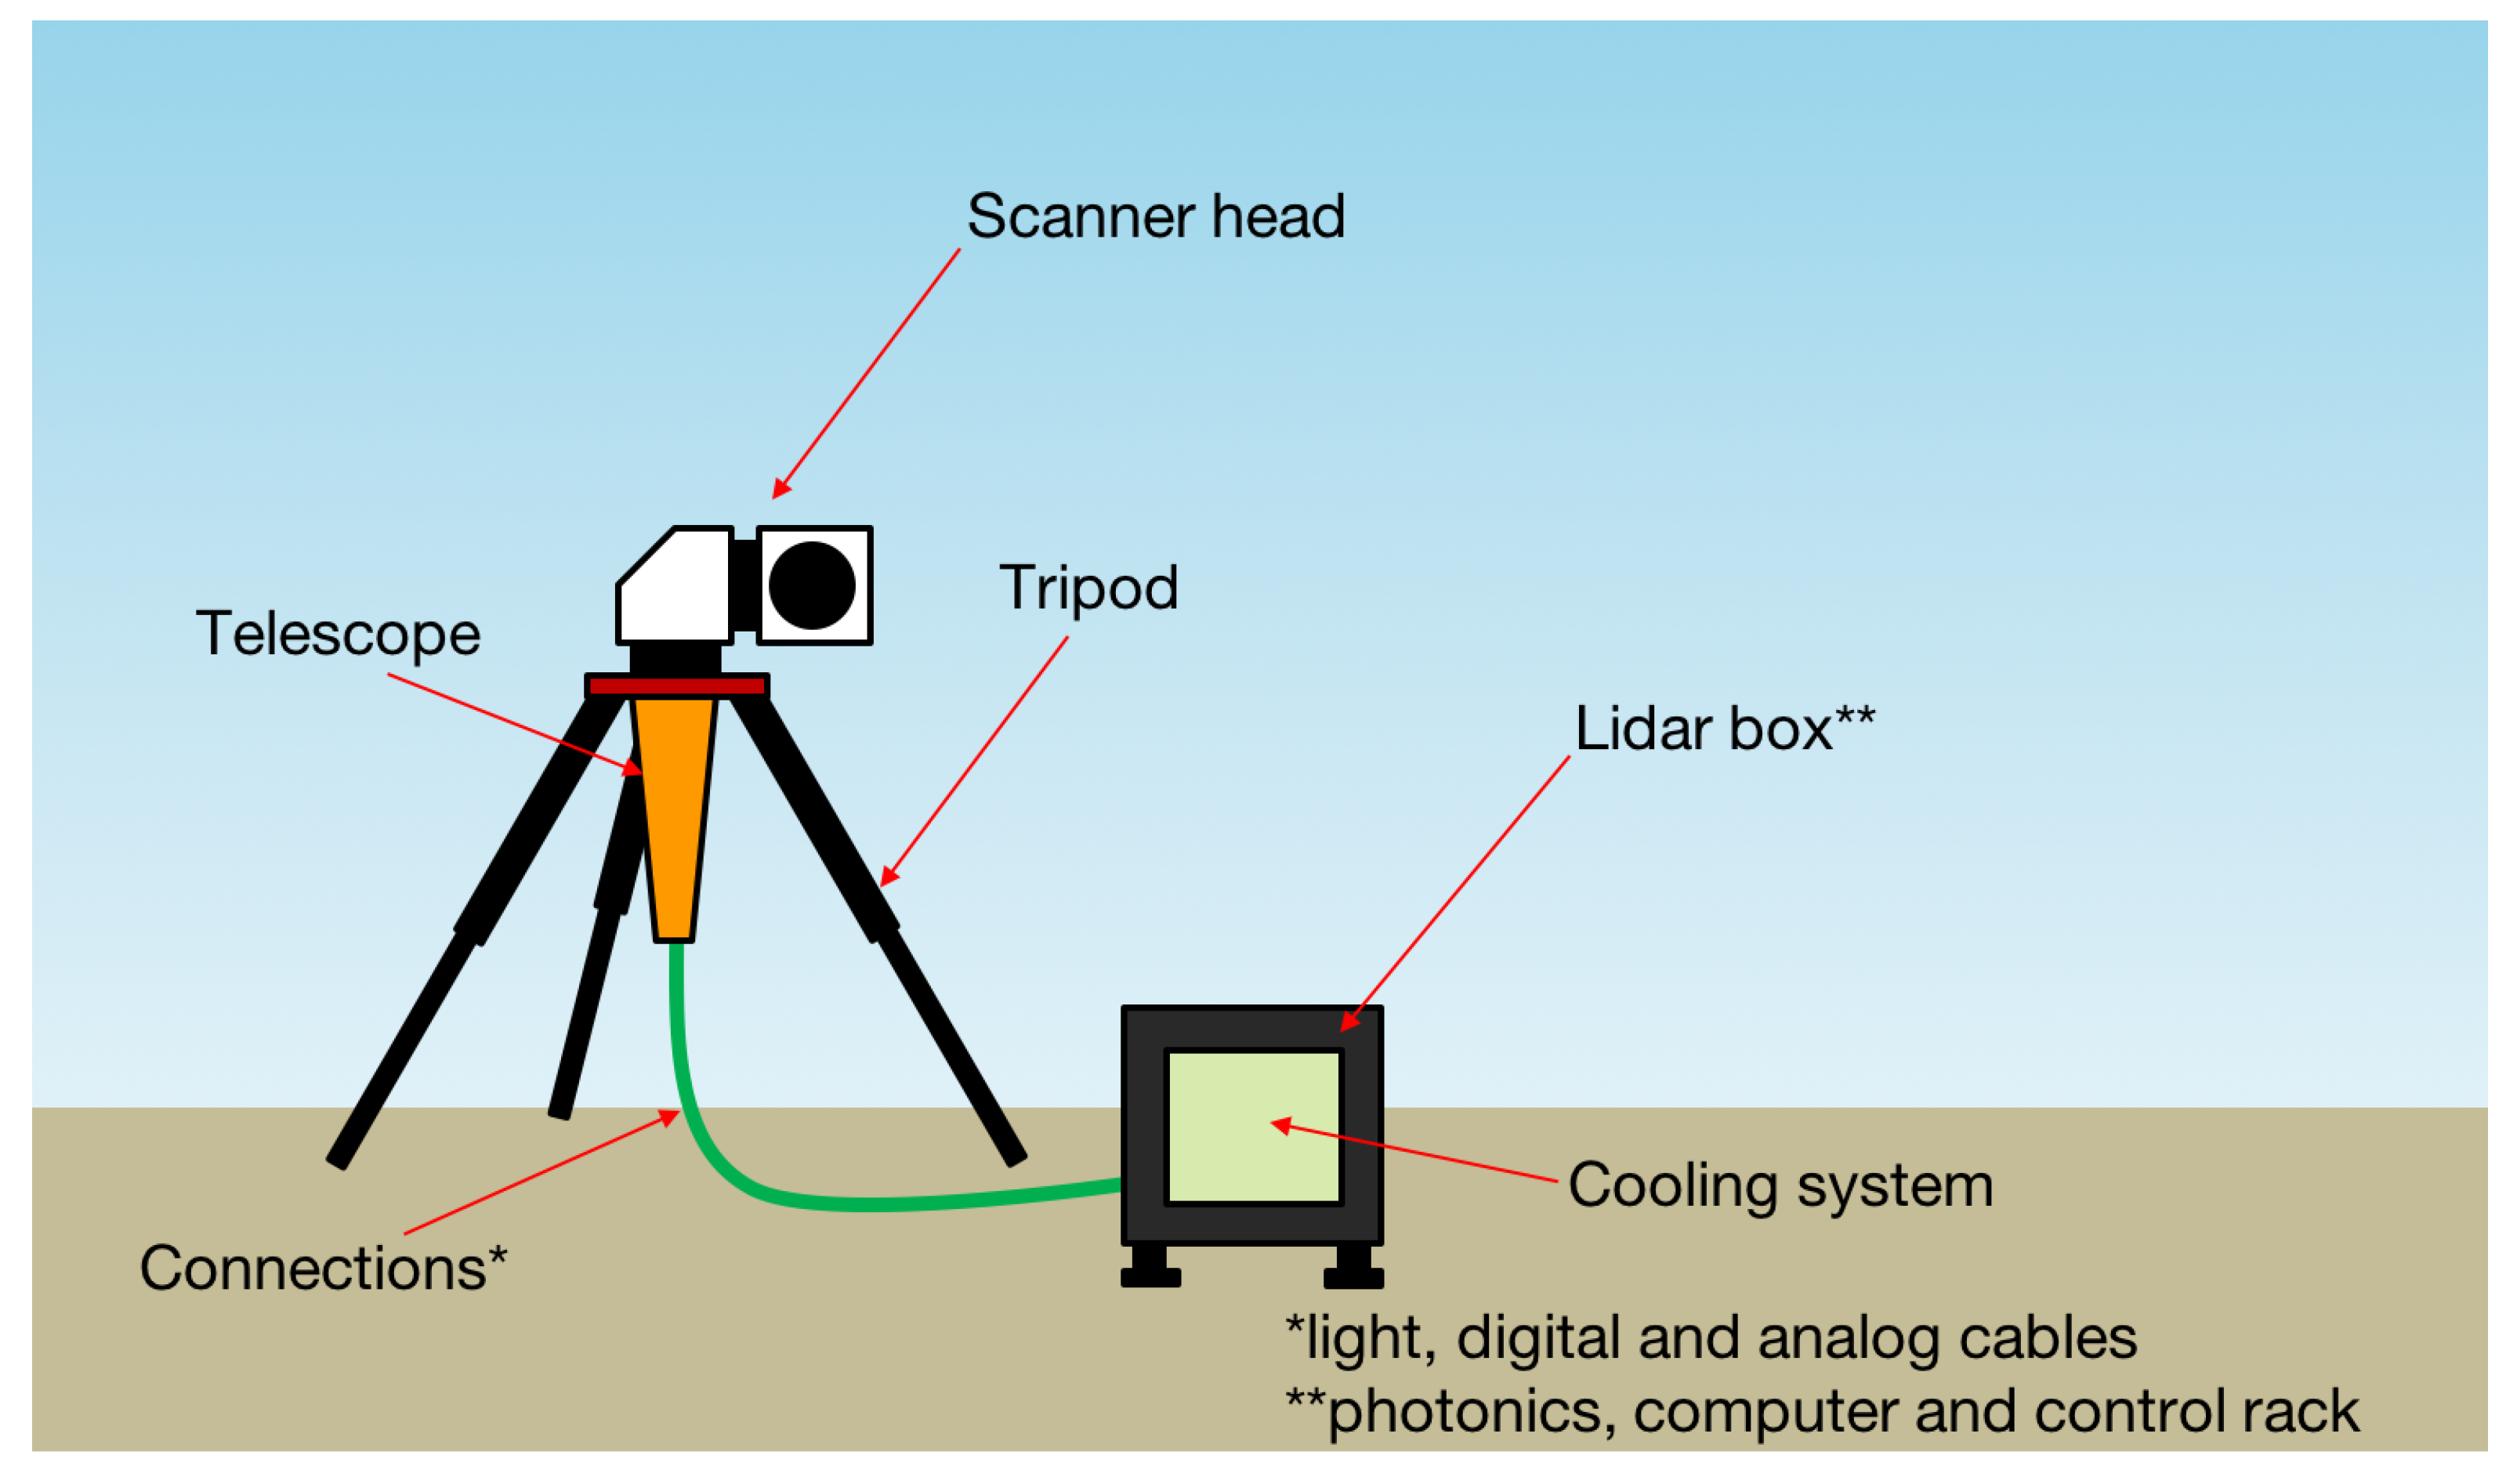
Today, there are about 10 different FLS providers, offering quite different designs. A schematic diagram of one design is shown in
Figure 2. Most current FLSs use industry-proven lidars that were originally designed for use on land. Experience has shown that these lidars can be deployed on floating platforms with minor adjustments such as an offshore-qualified casing or bird deterrents. At least six systems have so far reached the Carbon Trust’s “pre-commercial” maturity stage. KPIs for commercial maturity are not yet fully defined, but will be developed in 2018 as part of an ongoing Carbon Trust initiative.
Despite progress, some barriers remain to the adoption of FLSs. These include:
A common understanding is that future activities for the further promotion of floating lidar technology need to focus even more on the interests of the end-users. This is needed to reach full acceptance of the technology by demonstrating a validated performance with respect to the final wind resource estimates and at the most attractive costs. When these objectives are met, FLSs have the potential to serve a significant part of the market for offshore wind resource assessments.
2.3. Lidar Verifications
Given the importance of accurate wind measurements, it is industry best practice to verify a specific lidar device at an appropriate onshore flat terrain (or offshore) test site before and—should inconsistent behavior be observed during the measurement campaign—after the measurement campaign. The purpose of lidar wind data comparisons against co-located cup data from a met mast is to assess the capability of the lidar device to measure wind speed and direction to the same level of accuracy as what is obtained with conventional anemometry. This verification process ensures traceability back to classical anemometry, and provides a lidar unit specific standard uncertainty of wind measurements.
Current best practice is therefore to verify the lidar against anemometers on a tall conventional met mast. This mast should be documented as satisfying the guidelines of the International Electrotechnical Commission (IEC) standard 61400-12-1, Ed 2 [
2] for low uncertainty anemometry, which allows traceability and confidence in the results. Such a mast is often known as “IEC compliant”. While measurements from high quality cup anemometers are still seen as the norm against which any new measurement device should be judged, alternative reference data are seriously discussed and developed. For example, verification against a so-called “Golden Lidar” (a lidar unit of the same type that has repeatedly been calibrated against a more accurate reference) may also prove to be sufficient. However, the mechanical cup anemometer has been, and continues to be, the industry standard for measuring the wind speed at potential wind farm development sites.
The usually applied direct comparison of the readily reconstructed wind speed and direction (reconstructed from the line-of-sight measurements along the laser beams) with the corresponding reference quantity is called a Black Box verification. It is “black” as no insight into the wind data reconstruction process (i.e., neither of lidar geometry nor of algorithms) is needed. Only the final lidar wind data output is used for comparison to the reference measurements. In contrast to that, a White Box verification treats components of instrument function and reconstruction algorithm, individually. The White Box approach can be applied if assumptions entailed by the reconstruction algorithm (e.g., flow homogeneity within the lidar’s measurement volume) are valid for the test site (e.g., benign flow conditions over non-complex terrain), and by extension, for sites for which the test results are considered to be valid. Weaknesses of this approach are that these assumptions may not be valid, and that multiple reference instruments are used to verify the wind speed and direction (cups and vanes). Strengths of the white box approach include greater flexibility in the test setup: all the details of the final deployment are not replicated during the test of the system’s individual components and subsystems. However, if a feature of the final deployment is not adequately represented either in the test setup or the assumptions on which wind field reconstruction is based, an unanticipated bias or uncertainty can arise which cannot be observed without Black Box testing. There is a strong need in the wind industry to foster the acceptance of this technology by reducing the measurement uncertainty, as still too high uncertainties represent a barrier using lidar technology. It is often the reference uncertainty from the cup calibrations which dominates the overall uncertainty of the lidar verifications, compared to the uncertainty from the actual comparison. Thus, to mitigate this in the future, it is important to obtain a less conservative handle on reference uncertainties than that currently suggested by the IEC standard.
3. Lidar for Power Performance Testing of Wind Turbines
Wind lidars are attractive for power performance testing because they can be deployed temporarily on the ground or turbine nacelle to provide the required wind data, or they can be integrated into the turbine design and used to provide continuous performance monitoring. In addition, lidars have the ability to provide wind speed and direction data at multiple heights across the rotor to better characterize turbine response with respect to wind shear and wind veer. For nacelle or scanning lidars, there is potential for a single device to measure data over a range of horizontal positions which can allow modelling of turbine performance at any site and as subject to features (e.g., forest edges, buildings, etc.) in flat terrain. Task 32 has been active in the promotion and validation of new methods for defining wind speed for power performance using ground- and nacelle-based lidar.
3.1. Ground-Based Measurements
Ground-based lidar operation includes onshore applications where the lidar is situated on the ground or on a stable structure such as a building, and offshore operations where the lidar is situated on a fixed structure such as a met mast platform, a substation or an offshore wind turbine transition piece walkway. Task 32 has also supported validation of the uncertainty guidance published in Edition 2 (2017) of the IEC 61400-12-1 Standard [
2]. Several barriers have been identified for the use of ground based lidar in power performance measurements, including:
Calculation of a rotor equivalent wind speed (REWS) from lidar measurements
Reduction of lidar uncertainty compared to a cup anemometer
Application of lidar in complex terrain.
Task 32 has addressed these barriers in partnership with other groups. In 2014, Task 32 conducted a comparative exercise using common data to calculate REWS [
10]. The exercise helped show where discrepancies might exist in the interpretation of the draft standard and gave industry participants an opportunity to apply and refine the method. Feedback from the exercise was incorporated into Ed. 2 of IEC 61400-12-1 to facilitate use of the REWS.
In 2016, Task 32 organized a second comparative exercise and follow-up workshop with support from the Power Curve Working Group. The purpose of the exercise was to estimate the uncertainty in power performance measurements when using a lidar as a standalone device or to normalize the hub height wind speed for wind shear and wind veer across the rotor using a REWS. This exercise started by using a time series dataset of 10-minute average wind speeds and required participants to create the binned power curves and uncertainty values for power and annual energy production. The main takeaway of the exercise was that based on current methods for calibration and classification of lidar, there would be additional uncertainty when using only a lidar as the primary wind measurement equipment. This is a potential barrier for the adoption of lidar which can be most easily be mitigated by refining the calibration and classification methods. Having a common understanding of the potential magnitude of additional uncertainty related to using lidar when following the uncertainty guidance in the IEC Standard should help focus efforts towards the main uncertainty contributors. The workshop discussed the results of the exercise but also provided a forum for different sections of the industry to present their experiences in the application of lidar for power performance. The results of the exercise have been submitted for publication at the conference Torque 2018.
3.2. Nacelle-Based Measurements
Nacelle-based lidar is one possible solution for power performance verification both onshore and offshore. The IEC 61400-50-3 standard is currently being developed to provide guidance relevant for this application. This will describe a method for nacelle-based lidar measurements suitable for power performance measurements both offshore and onshore. This new IEC standard is expected to be published by 2020.
The application of nacelle-based lidar shares similar barriers and needs to ground-based lidar. These are:
Development of a common framework for wind field reconstruction.
Determination of the optimal methods to calibrate and classify nacelle lidars.
Quantification of the uncertainty.
Application in complex terrain.
In 2017, Task 32 organized a workshop around the application of nacelle lidar for power performance. The workshop covered wind field reconstruction methods and calibration methods. There were four main takeaways from the workshop:
The requirement to measure at 2.5D upstream for the coming wind turbines with very large rotor diameters (especially offshore) challenges the limitations of the measurement geometry of currently available nacelle lidars.
The use of measurements at shorter range (inside the turbine’s induction zone) that are then analyzed to find the freestream wind speed has been tested with good results [
28].
Nacelle lidars would also be a good solution for power performance testing in complex terrain, however several challenges need to be overcome.
The installation of the lidar on the nacelle should be facilitated by collaboration between the lidar manufacturer (to make smaller and lighter lidars) and turbine OEMs (to include a dedicated place/bracket for the nacelle lidars in their turbine design).
In 2018, Task 32 is planning an additional workshop to support development of a common framework around wind field reconstruction and the application of nacelle lidar in complex terrain. It is expected that the content of these workshops will directly support developments in IEC PT 50-3.
4. Lidar for Turbine Control
Although wind serves as the “fuel” for wind turbines, changes in the wind inflow act as disturbances to the wind turbine which must be compensated for by the turbine’s control system. Traditional feedback wind turbine control systems rely on measurements of generator speed to maximize or regulate power capture and reduce structural loads using pitch and torque control. Therefore, the controller can only react to wind disturbances after they impact the turbine. By using preview measurements of the approaching wind field from a nacelle-based lidar, pitch or torque commands from a “feedforward” controller can mitigate the impact of the wind disturbance on the turbine, improving power regulation and reducing loads.
Nacelle lidar systems were demonstrated in the field as early as 2003 [
29], while simulation-based studies of lidar-assisted feedforward control began in 2005 [
30]. Since then, lidar-assisted control (LAC) has been investigated for several applications including:
Collective pitch control, primarily targeting improvements in rotor speed regulation and reductions in tower base and blade root loads [
31,
32]
Individual pitch control, further improving blade and drive train component load reduction using lidar measurements of shear [
31,
33]
Torque control during below-rated operation to improve power capture [
31,
34]
Combined torque and pitch control to improve loads, especially during the transition between below-rated and above-rated operation [
35,
36]
Yaw control to improve power capture by improving rotor alignment with the wind direction [
37,
38].
Due to its simplicity and effectiveness at improving rotor speed regulation along with reducing tower and blade loads, lidar-assisted collective pitch control during above-rated operation has become one of the most popular categories of LAC investigated. Starting in 2012, successful field tests of lidar-assisted collective pitch controllers were performed, using the Controls Advanced Research Turbines (CART 2 and CART 3 turbines) at the National Renewable Energy Laboratory’s National Wind Technology Center in Colorado, USA [
39,
40,
41]. These field tests qualitatively verified many of the benefits observed in simulation by demonstrating improvements in rotor speed regulation [
39,
40,
41], tower base load reduction [
40,
41], and a reduction in pitch actuation [
41].
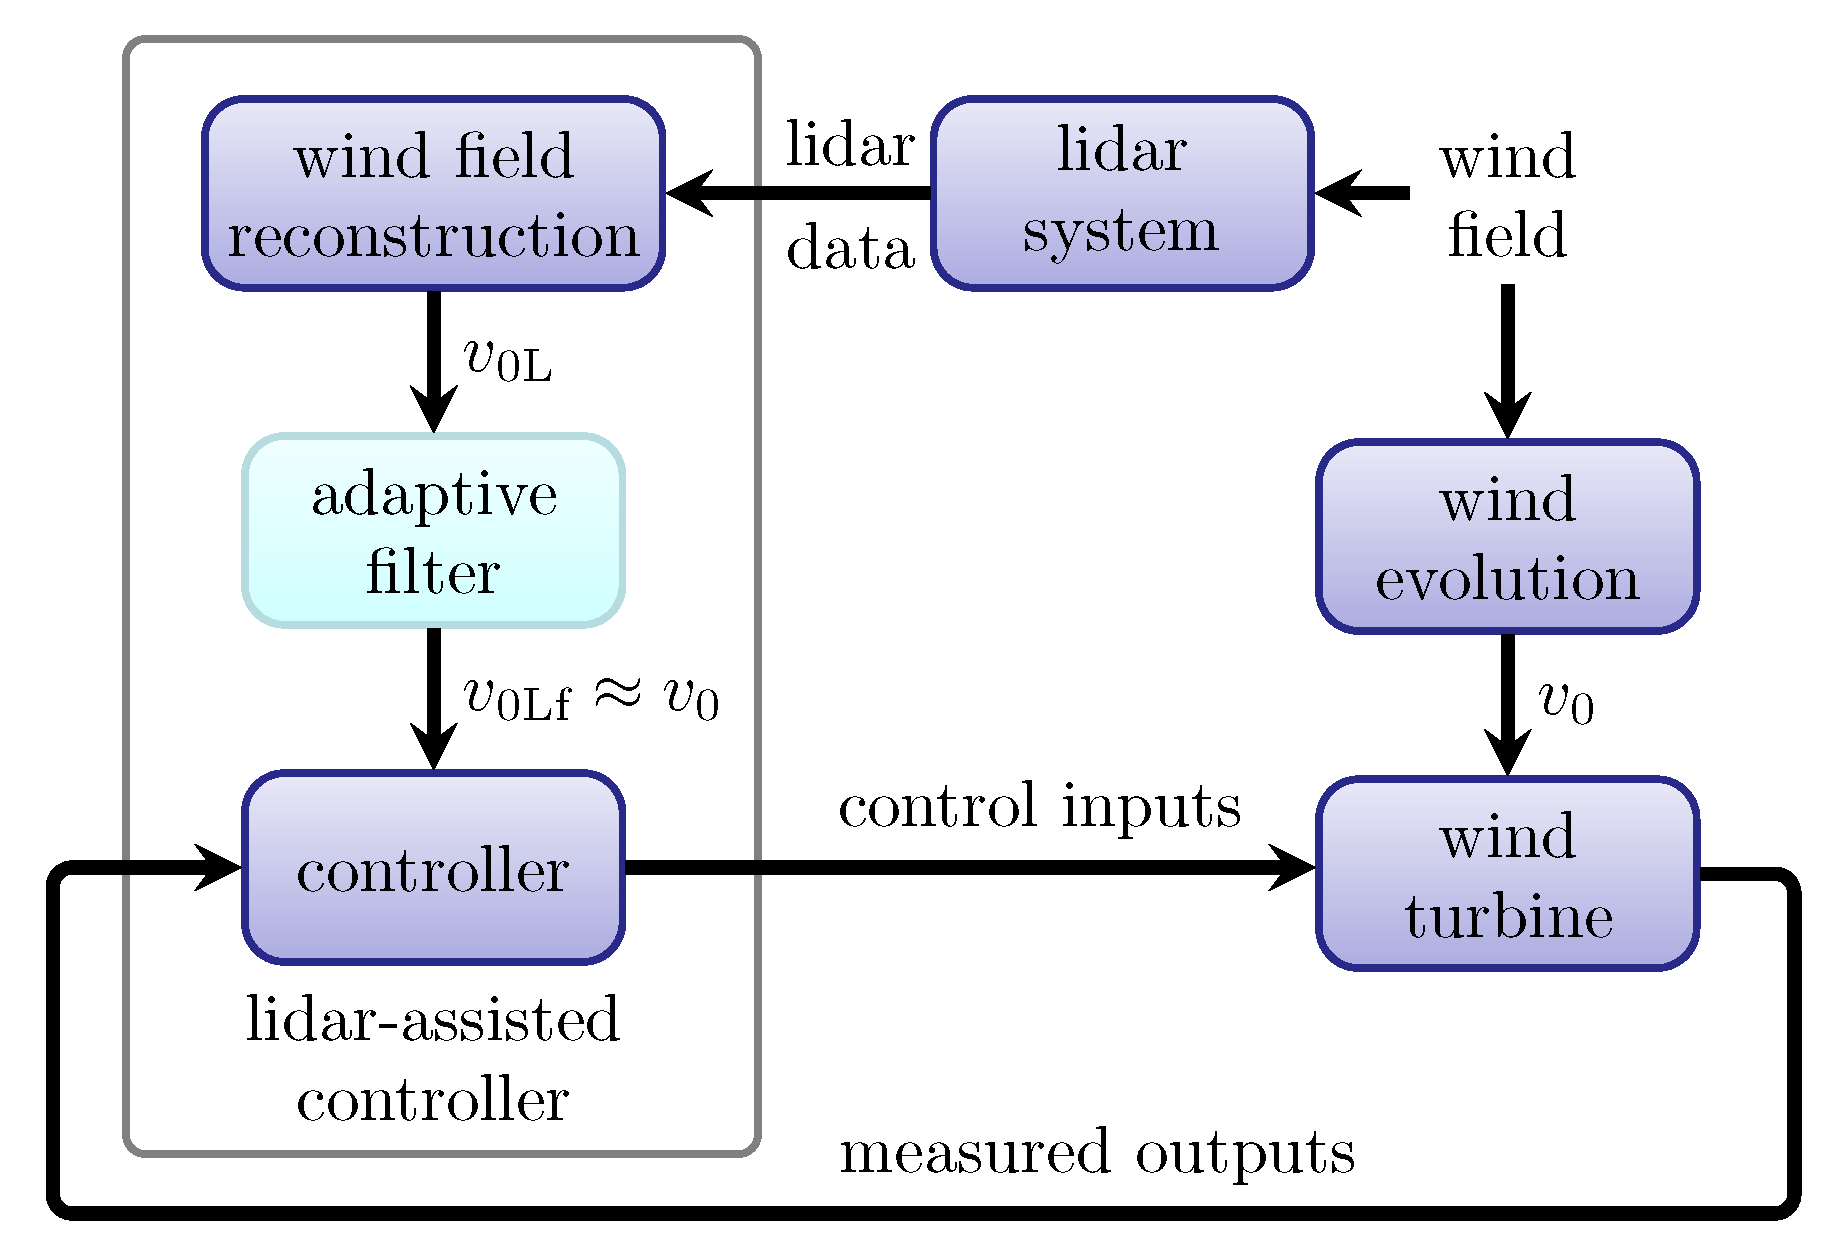
One important difference between LAC and the traditional applications (i.e., site assessment, power performance) is that the traditional applications focus on reproducing the point quantities measured by a met mast. For example, standard wind field reconstruction methods calculate the horizontal wind speed and direction from line-of-sight wind speeds. For LAC, new wind field reconstruction approaches have been developed to estimate rotor effective quantities, for example the rotor effective wind speed
in
Figure 3. Another difference is that, in traditional applications, the lidar data are usually post-processed offline and averaged over 10 min. For LAC, the signals are provided to the control system online with a high temporal resolution (≥1 Hz) . Therefore, although similar to the REWS discussed in
Section 3.1, the rotor effective wind speed used for LAC describes the instantaneous wind speed at the rotor, whereas the REWS is typically a 10-min average value. Further, uncorrelated frequencies are filtered out to avoid harmful control action (
in
Figure 3). Due to several issues such as the limitation to line-of-sight wind speeds or the evolution of the wind field from the measurement point to the rotor, the lidar system is only capable of estimating the rotor-effective quantities up to a certain frequency [
42,
43].
4.1. Barriers
Research using both simulation and field testing shows meaningful structural load reduction with LAC, yet the technology has not been widely adopted in the wind industry. Several barriers preventing the widespread use of LAC have been identified by Task 32. The first barrier identified is the multidisciplinary nature of lidar-assisted control. Lidar manufacturers are responsible for supplying the lidar equipment while wind turbine manufacturers design the control algorithms that use the lidar measurements. However, there is often insufficient collaboration between the two parties; lidar systems may not necessarily be optimized for control applications (see above for some of the main differences), and assumptions about lidar systems made by control engineers might not match reality. For example, system cost, scan pattern, and availability requirements for control are different than for other applications. More communication about these needs to the lidar community would allow the most suitable products to be made available. On the other hand, myths about availability, system performance, and cost may be preventing wind turbine manufacturers from moving forward with LAC. More collaboration between wind turbine OEMs and lidar manufacturers could help address these concerns.
Second, the value creation of LAC is very difficult to assess. Structural load reduction can lead to cost reduction or allow an increase in annual energy production via larger rotors or taller towers while maintaining original design loads. However, a sensor such as a lidar introduces capital and O&M expenses. It can be challenging to determine whether the benefits outweigh the additional costs, leading to a reduction in the levelized cost of energy (LCOE).
Finally, guidelines for certification of wind turbines with LAC are lacking. As an example, the IEC 61400-1 design standard [
44] defines the design load cases (DLCs) that must be simulated to assess structural loads, a necessary step in wind turbine type certification. However, LAC presents additional simulation requirements and several DLCs require further clarification when LAC is used. Without clear design standards for wind turbines using LAC, it is difficult for wind turbine manufacturers to understand how to include the technology in the design stage and assess the value creation.
4.2. Mitigation
To address the challenges caused by the multidisciplinary nature of LAC, the Task 32 workshop “Optimizing Lidar Design for Wind Turbine Control Applications” was held in Boston, MA in July 2016. The aim of the workshop was to bring together wind turbine OEMs, lidar suppliers, and researchers to identify the requirements of lidars for control applications and suggestions for optimizing lidar scan patterns. Although a shared opinion among workshop attendees was that more collaboration between lidar suppliers and wind turbine control engineers is needed, several useful suggestions and strategies for optimizing lidars for control applications were developed. For example, availability is very important for LAC applications; the benefits of LAC cannot be realized when the lidar is unavailable, potentially requiring the turbine to operate in a reduced-power “safe mode” to satisfy load requirements. Lidars for control applications should be designed for high availability, possibly adapting the scan pattern or data processing stage to improve availability when atmospheric conditions cause the signal-to-noise ratio of the backscattered light to become too low for reliable velocity estimates. Unique definitions of availability for control applications were discussed to address the short time scales (seconds) relevant to control. One useful metric for availability presented is the number of valid measurements obtained from the lidar scan during the previous few seconds. The lidar can be considered available when this value exceeds a threshold determined by a control engineer. Availability requirements unique to LAC can then be addressed by lidar manufacturers. Another topic discussed was the need to better anticipate and reduce the lifetime cost of the lidar, which is important for determining the value creation of LAC. One strategy for mitigating this barrier is to make lidar maintenance simple enough that it can be incorporated into standard wind turbine maintenance schedules without requiring special attention by lidar technicians.
Scan pattern optimization was addressed through an exercise in which computational tools were used to quickly assess the coherence and error between measurements from different scan patterns and the rotor effective wind speed of interest at the turbine. Tools such as these can be used to assess the performance vs. complexity of different scan patterns, allowing wind turbine manufacturers and lidar suppliers to find an appropriate tradeoff for a specific control application. A report for the Task 32 workshop “Optimizing Lidar Design for Wind Turbine Control Applications” is being prepared.
Task 32 has not yet focused on the problem of quantifying the reduction in LCOE through the use of LAC, but believes that this requires a systems engineering approach due to the complexity of the problem. Therefore, a collaboration with IEA Wind Task 37: Systems Engineering has been proposed, in which LAC can be applied to a reference wind turbine with a state-of-the-art baseline control system, allowing a number of parameters to be optimized with the objective of reducing LCOE.
To address the need for clear guidelines on certification to foster the widespread adoption of LAC, Task 32 recently held a workshop titled “Certification of Lidar-Assisted Control Applications” in January 2018 in Hamburg, Germany. The workshop, hosted by DNV GL, brought together wind turbine manufacturers, lidar suppliers, researchers, and certification bodies to develop ideas for modifications to existing design standards that should be made to address the use of LAC. Four categories relevant to certification were addressed: the lidar system, simulation models and load simulations, the control and protection system, and prototype measurements. The ideas generated during the workshop are to be incorporated into DNV GL’s guidelines on wind turbine certification with LAC, planned for later in 2018.
5. Lidar for Load Verification
In addition to using lidar measurements for control, lidars have the potential to be used as part of the load verification procedure. Load verification consists of the comparison of simulated and measured structural loads on a wind turbine to verify the accuracy of the simulation environment, and is a step in obtaining certification of the prototype turbine by a certifying body.
The steps involved in a typical load verification campaign are as follows. Wind turbines are typically designed according to the IEC 61400-1 standards [
44], where a range of wind conditions are prescribed. A load case matrix is created for different wind conditions and wind turbine components, and several load simulations are carried out. Eventually, extreme and fatigue loads are calculated, which provide a basis for dimensioning of the different wind turbine components. Subsequently, a prototype turbine is manufactured and installed at a test site for verification of the actual loads experienced by the turbine as compared to the simulated loads. The load measurements are usually carried out using strain gauges mounted on different wind turbine components, whereas the wind conditions are obtained using met mast anemometry. The instrumentation on the mast usually consists of cup anemometers and wind vanes installed on booms at three heights at some distance in front of the wind turbine. From the time series data of these instruments, first- and second-order statistics are estimated; amongst others mean wind speed, wind direction, wind speed profile, and turbulence intensity. Correspondingly statistics of the loads from the measured load time series are estimated. Eventually, the relationship between the wind and load statistics is determined. Simultaneously, new load simulations are carried out using wind conditions with the measured wind statistics (instead of the IEC standard wind conditions). The newly simulated loads are then compared with the measured loads, and subsequently verified to check whether the measured loads are smaller than the simulated loads. It is usually observed that the simulated loads do not compare very well with the measured loads, both in terms of accuracy and precision.
From the wind measurement side, two reasons have been attributed to the discrepancy between simulated and measured loads during the load verification stage; the first is the lack of availability of measurements with high spatial resolution that adequately represent the wind conditions across the entire rotor, and the second is the distance between the mast and the turbine, potentially introducing a mismatch between the measured wind conditions and those actually experienced by the turbine. Lidars have the potential to counter both these problems by allowing measurements at many different points relatively close to the turbine. The use of lidar to improve the estimation of the true wind statistics could yield better agreement between measured and simulated loads, and the improved load verification could ultimately lead to reducing the amount of material used for constructing certain components, thereby reducing the cost of wind turbines. Nevertheless, there are some barriers to the use of lidars for load verification.
5.1. Barriers
Lidars are proven to be quite accurate and precise for estimating first-order statistics such as the mean wind speed, wind direction, and the wind profile [
45]. However, estimating second-order statistics required for load verification, such as turbulence intensity, from lidar measurements is not yet acceptable. In [
18], two barriers to using a ground-based lidar in a VAD scanning mode have been identified; the first is the probe volume averaging along the lidar beam, and the second is the contamination due to the cross-correlation of different components of the wind vector. These two phenomena typically lead to underestimation and overestimation of the true turbulence intensity, respectively. The second barrier can be countered to a considerable extent by either using a different scanning configuration and data processing technique (e.g., six-beam method [
18]), or by using three lidars intersecting at a point. The challenge of probe-volume filtering still remains to be tackled. In addition, due to the physical limitations of lidars, spatially interspersed measurements cannot be obtained at very high sampling rates. This presents a further challenge in capturing all the relevant turbulence scales that influence the loads on the wind turbine. Thus, the barriers to the use of ground-based lidars for load verification can be summarized as:
Difficulty in overcoming the cross-correlation of different wind components when estimating second-order statistics using a single lidar;
lidar probe-volume filtering affecting the second-order statistics of the measured wind velocities; and
obtaining measurements at a large number of points across the rotor disk with sufficient temporal resolution.
An alternative to using ground-based lidars is to use nacelle-based lidars. However, besides tackling the aforementioned challenges, a barrier to the use of nacelle lidars for load verification is that, to the authors’ knowledge, a robust algorithm is yet to be developed for combining measurements in a vertical plane from nacelle lidars for estimating second-order statistics.
Lastly, the different configurations suggested above present economic challenges. Particularly the use of three lidar systems to overcome the cross-correlation of different wind components would increase the cost of measurements by a factor of three. It is therefore necessary to couple the benefits of using any configuration with the potential reduction in LCOE. A barrier to such coupling is that there is no robust model that provides a link between lidar-assisted load verification and LCOE.
5.2. Mitigation
Substantial efforts toward overcoming the barriers to the use of lidars for load verification remain as future work within Task 32. Within the research community, however, there has been some work related to the use of nacelle lidar measurements for load verification. In [
46], the authors present a method for using measurements from nacelle lidars to recreate as closely as possible the full wind field that interacted with the turbine, as opposed to merely deriving second-order statistics from the measurements. The full reconstructed wind field can then be used to perform simulations for load comparison, with better agreement with field data expected. The authors consider how different nacelle lidar scan patterns affect the accuracy of the recreated wind fields, but have not yet included realistic sources of lidar measurement error such as probe-volume filtering and line-of-sight limitations.
6. Lidar in Complex Flow
Wind lidar’s ability to measure wind profiles to greater heights than is possible with conventional met towers, to repeatedly sample large swathes using scanning lidars, and to retrieve multiple wind vectors from a single point using coordinated scanning lidars [
47] have made them a popular choice for measuring flow over complex terrain [
13], in turbine wakes, in the inflow to a turbine, and in urban areas [
11,
28,
48]. These complex flows exhibit spatial heterogeneity and transient features introduced by terrain, patchy land cover, turbine or structural wakes, local meteorology, and other effects. This heterogeneity and the transient features can lead to difficulties in interpreting LOS wind speed data.
As with site assessment in complex terrain (
Section 2.1), one way to mitigate the effect of flow heterogeneity is to analyze the measured data in conjunction with flow models that can account for the orography of the experiment site [
49,
50]. A similar methodology can be applied to scanning lidar measurements of different types of complex flows such as the induction zone upstream a wind turbine rotor, wind turbine wakes and low level jets and or various conditions of atmospheric stratification [
28,
48,
51,
52,
53,
54]. Physical models can also be used to reconstruct the wind field from lidar measurements. These models—such as flow complexity recognition (FCR) [
55], MuLiWEA [
56], and the LINCOM [
57] algorithms—aim to determine the three-dimensional flow field from the lidar measurements, not just a few parameters such as wind speed and direction. These first attempts to combine lidar measurements and flow models have given promising results and suggest that this approach could help provide the most realistic wind field corresponding to the measurement environmental conditions.
The need for a flow model can be avoided by using three lidar to simultaneously sample the same point [
58]. This approach, known as “multi lidar”, removes the unknowns in the wind field reconstruction but only provides information at the intersecting measurement points. Two lidar—dual lidar—can be used if an assumption is made regarding one of the velocity components.
IEA Wind Task 32 started to address the issues associated with complex flow by collecting experts’ know-how and methods applied within the research community into a summary of the state of the art [
11]. Early on in that work, the authors realized that there was no clear definition of “complex-flow” and therefore recommended that practitioners should anticipate complex flow conditions when any of the following indicators are observed:
Complex terrain
Heterogeneity in the upwind surface roughness or presence of trees
Presence of natural or artificial obstacles whose wake could reach the measurement volume
Local meteorology or terrain condition that could make the flow within the measurement volume non-homogeneous
Bias or uncertainty from the comparison between lidar and cup or sonic anemometer measurements that are unexpected according to standards (e.g., [
2])
Because the impact of these indicators would vary by use case, it was decided not to create thresholds for the quantitative metrics. Instead, the goal of these indicators was to prompt users to be aware of the possible impact of complex flow on their measurements and make appropriate plans.
Several workshops about lidar measurements in complex flows followed. One was held in 2016 in conjunction with IEA Wind Task 31—Wakebench—to investigate the use of wind lidars to measure wind turbine wakes. Another was held in June 2017 to define use cases for lidar in complex flow situations. Lidar offers a variety of measurement methods exploiting capabilities that extend well beyond what is possible with met masts. One outcome of this workshop was the understanding that insufficient time is typically invested in understanding the relationship between the data requirements and the capabilities of the lidar. This occurs because the approach to measurement campaigns typically adopted in the wind energy industry is heavily conditioned by restrictions that were previously imposed by more limited instruments. Often, data requirements for lidar have been assumed on the basis of these more limited capabilities. A key challenge presented by lidar is the need to review basic objectives given the measurement capabilities now available. Furthermore, as described in
Section 2, another workshop took place in November 2017 to explore the barriers to using lidar for measurements in complex terrain.
The following barriers and potential solutions have been identified at these workshops and by task participants:
Forecasting complex flows: Potentially complex flow conditions need to be recognized before a measurement takes place, so that an appropriate measurement technique can be applied. Currently, there is no clear, objective definition of what counts as complex flow for lidar measurements in recommended practices or standards, which means that either all conditions should be considered potentially complex (which increases the cost of a campaign), or that marginal cases might be treated as simple to avoid increasing costs.
Detecting complex flows: Complex flow conditions need to be recognized during a measurement or from the results, so that appropriate analysis methods can be used. Again, such conditions are not defined in standards, but might only be detected from lidar data after a measurement—or not even recognized.
Difficulty of multi-lidar measurements: Using two or more lidar is challenging because of equipment cost, the need for very detailed campaign planning, and the difficulty of operating multiple lidar simultaneously.
Task 32 tried to show that these obstacles are not insurmountable. Successful examples of multi-lidar measurements were presented during one of the workshops. In particular, it was demonstrated that concurrent lidar measurement could be applied for the investigation of the wind field spatial variability offshore but near coasts. Furthermore, the accuracy of scanning lidar was addressed to point out the importance of the scanner pointing precision and the uncertainty linked to dual Doppler wind field reconstruction methods.
In a joint meeting of Task 31 and Task 32, a discussion about a possible benchmark of wake models based on multi-lidar measurements was initiated. With this activity, Task 32 intends to provide support to communities that could benefit from lidar data, but lack the required background knowledge.
Unclear methods for uncertainty estimation: An estimate of the uncertainty associated with lidar wind field reconstruction in complex terrain is not straightforward. Two main solutions were proposed and discussed at the Task 32 workshops:
- -
Simulation of lidar measurements within high-fidelity wind field simulations. Simulations in a realistic (and therefore known) wind field can provide indications about the uncertainty to be expected during a field experiment [
56,
59,
60,
61].
- -
Application of the uncertainty propagation [
62] to the wind field reconstruction method. This approach was introduced to deal with dual-Doppler data analysis [
63,
64] and further investigated for nacelle-based power-performance testing applications.
Lack of guidance: Participants also noted that new users might find it difficult to use the examples, because of the slightly different approaches (e.g., scan patterns, flow models, data interpolation algorithm) applied to pursue similar objectives. To solve this issue, it was concluded that detailed definition of use cases could provide the needed guidance. From the data requirements, the conditions situation and the methodology that generally describe a use case, an unambiguous measurement and data analysis strategy could be outlined. If necessary, the field of application should be restricted. In this sense, Task 32 aims to extend the definition of the most common uses cases in the future.
Using lidar measurements and flow simulations together needs further development: In general, the lidar community is cautious with regards to the combination of lidar measurements and flow simulations because of the complexity and wide scope of the topic and its very early level of development. Task 32 identified the need of a state of art review to support and speed up the development of this approach. Such document should describe the different method implemented to incorporate lidar measurement into flow simulations and, for each case, point out the assumptions used to develop the flow model and their field of applicability.
7. Future Challenges
The application areas discussed in
Section 2 to
Section 6 were identified when Task 32 began its second phase in 2014. Since then, as wind lidar devices have become more advanced and accepted, other challenges have also become important. These challenges are discussed in this section and might be investigated by Task 32 in the future.
7.1. Uncertainty COmpared to Conventional Anemometers
Several sources of uncertainty impact how well we can determine the wind speed and wind direction based on a lidar’s observations of the flow field. These are uncertainties in the LOS, pointing, ranging, and wind field reconstruction. Challenges related to wind field reconstruction are well known and have been described elsewhere in this report.
LOS uncertainty is related to the process of extracting the LOS wind speed from the acquired backscattered signal. Fundamentally, this uncertainty is tied to the characteristics of the lidar components dedicated to the generation of the laser beam and detection of the corresponding backscattered signal, atmospheric characteristics and a choice of the Doppler peak estimator. LOS uncertainty has been extensively studied since the first lidars were introduced in the late 1970s (e.g., [
65]). However, as lidar technology becomes more widely adopted, IEA Wind Task 32 identified a need to revisit the LOS uncertainty and communicate it in a more approachable manner.
Several studies indicate that wind lidars are capable of acquiring wind information with lower uncertainty than the conventional cup or sonic anemometers mainly because the non-contact, remote measurement avoids flow distortion. Despite this, LOS uncertainty is currently determined by comparing the LOS measurements of wind lidar to reference measurements acquired by sensors mounted on met masts. This approach downplays the performance of wind lidars because of the relatively large uncertainties of mast based sensors and also results in a “black box” uncertainty, in that the physics behind the uncertainty is hidden.
Participants in Task 32 identified a physics-based way to determine the LOS uncertainty—also known as a “white box” method—for which the detailed understanding of contributions to the LOS uncertainty is essential. In addition, because lidars are a remote measurement, understanding where the LOS speed is acquired in the atmosphere is tied to quantifying the pointing and ranging uncertainty. A dedicated study of these two uncertainty sources has been presented in [
63], while practical aspects of determining these uncertainties in field are given in [
13,
47].
Uncertainties arising from assumptions associated with wind field reconstruction cannot be neglected if the quantity that is ultimately the subject of the measurement is a reconstructed wind parameter such as wind speed. Comparisons of concurrent white and black box calibration results suggest these can often be the dominant source of uncertainty, with excellent white box results failing to indicate poorer black box performance. An uncertainty evaluation that neglects wind conditions that influence the validity of the wind field reconstruction is incomplete. Indeed, given the impossibility of anticipating all possible influences, evaluations are necessarily incomplete from this point of view. Completeness can only be achieved with respect to our prior knowledge of possible influences. In that case, uncertainty should not be interpreted as the absolute likelihood of a given outcome, but as a measure of information we obtain should a particular outcome occur, relative to our prior understanding.
7.2. Developing the Wind Lidar Ecosystem
As technologies become more accepted, popular, and prevalent, an ecosystem of related technologies, software, service providers and applications grows around them and adds value to the end user. A recent example is the growth of new businesses in the last 10 years around smartphones, where so-called app stores connect users with providers, data can be shared easily and securely, and third parties provide a wide range of services. Such rapid growth in use and services is enabled by clear use cases, data sharing, and the ability to rapidly try new applications. For wind lidar, only the first—the use cases—have stabilized.
7.2.1. Data Tools
A wind lidar creates wind data that are transformed into information to support decision making. Thus, choices made about how to set up and use lidar data directly impact the decision. Therefore, it is important to consider many factors when designing a measurement campaign such as information about the lidars that will be used (their capabilities and power requirements), local atmospheric conditions (wind, aerosols, etc.), infrastructure (electricity, telecommunications, access roads) and site restrictions. This information is used to derive an optimal lidar setup and lidar configuration, and there may be complex interdependencies (for examples see, [
13]). It is therefore possible to envisage a tool or a suite of tools that can facilitate the deployment planning process.
As has been noted before, another issue is managing the data generated by a lidar measurement campaign. The general complexity of lidar data analysis, and the fact that different lidar systems store data in different formats with no or limited meta information, makes it harder to develop common tools for data processing and restricts implementation of novel methods such as machine learning.
In 2017, the e-WindLidar initiative [
66] started with a focus on development of community-based tools for the facilitation of lidar data analysis, planning of lidar-based experiments, and lidar configuration. The first result of this initiative is a proposal for the universal lidar data format [
67] which is in accordance with the FAIR principles [
68]. In 2018, the e-WindLidar initiative will be disseminated through a range of activities within Task 32, including a workshop about the universal lidar data format and community-based tools for data analysis.
7.2.2. Modular Lidar
Commercial lidar have been designed around specific use cases, such as wind energy resource assessment from the ground or a floating platform, for power performance testing from a nacelle, or for broad area coverage. They are optimized for these use cases and are robust and reliable. However, they are difficult to use for other applications. It is rare to encounter extremely flexible lidar systems such as the long- or short- range WindScanner [
13] and Stuttgart scanner [
69] which allow the adaptation of the lidar for different applications. Although flexible systems might not be needed by industry, a high level of flexibility is essential for research groups to explore new use case for lidars.
During the IEA Task 32 workshop in 2014, an OpenLidar initiative was proposed. Several members of Task 32 then developed a concept for a platform for the open-source design, construction, and operation of wind lidar devices. A central aspect of the OpenLidar initiative is the development of modular lidar. A standardized modular lidar system architecture would support interoperability and enable the development and testing of new technology as modules could be replaced with new designs without having to redesign the entire lidar system. This approach would allow the same lidar system to be employed for different use cases.
Figure 4 depicts a modular lidar concept developed by DTU Wind Energy.
7.2.3. Turbine Integrated Lidars
Currently, lidar systems are installed individually on the nacelles of wind turbines. In the future, particularly for LAC, it will be important to integrate the lidar systems into the mechanical and controller design of wind turbines. This will lead to lidar becoming a standard sensor, much in the way that nacelle-mounted wind vanes are today. Challenges in this area will include the design of the lidar and its reliable integration into the turbine control system, which (like other lidar applications) will require support from standards.
8. Conclusions
Wind lidar is a maturing technology that helps to reduce the cost of wind energy through cheaper siting, and provides the possibility for increased energy capture and reduced loads. However, wind lidar is not uniformly accepted or used within the wind energy industry. IEA Wind Task 32 is an international collaboration that aims to identify the barriers to the adoption of lidar for site assessment, power performance testing, loads verification, lidar-assisted controls, and complex flows, and suggest ways to mitigate those barriers.
IEA Wind Task 32 has identified barriers that are common to all areas of wind lidar use. These barriers are relatively low and are all actively being addressed by the wind lidar community and Task 32. It should be noted that none of them prevent the use of lidar at this time. Instead, these are mostly barriers to extracting more valuable data from wind lidar:
Need for standards. End users have more confidence in data when the collection and use of the data are supported by recommended practices and standards. Community-driven recommended practices are available for some applications of wind lidar, while internationally-recognized standards are only available for power performance testing. Standards for the use of lidar remote sensing are in development and will mitigate this barrier in the next few years.
Need for experts. As with any emerging technology, there are a limited number of expert lidar users. This forms a barrier to the effective deployment of lidar for wind energy applications. Efforts are underway within the wind lidar community to embed more knowledge in planning and analysis tools, and to develop flexible and resilient processes, which will help mitigate this barrier in the near future.
Need for data tools. Although commercial systems have condensed the amount of data delivered by a lidar to something similar to a conventional met tower, other applications can drown the user in data. The need to manage this flood forms a barrier to its rapid and effective use. Data management and processing tools are being developed to extract value from the data that should help mitigate this. The development of standards will also support this as standardized processes can be captured in such tools.
Need for better physics models. Wind field reconstruction for wind lidars in complex flow and other applications requires flow models. Such models would also enable dynamic uncertainty estimates that include the effect of the lidar configuration, motion, external conditions and other factors on the lidar measurement and wind field reconstruction. While there have been some efforts in this area, more work is required. Importantly, work on on the other barriers will support the development of solutions to this challenge.
Despite progress in identifying barriers to the adoption of wind lidar for wind energy applications—and mitigating some of them—there remains a significant amount of research to be done in this field. There are also opportunities for product development, to explore new applications, and the potential for industry to provide value-adding commercial services. IEA Wind Task 32 has supported the wind lidar community since its inception in 2011 and will continue to do so for the foreseeable future. Interested parties are welcome to attend meetings and workshops and are invited to contact the operating agent for more information.
IEA Wind TCP functions within a framework created by the International Energy Agency. Views, findings, and publications of the IEA Wind TCP do not necessarily represent the views or policies of the IEA Secretariat or of all its individual member countries. IEA Wind TCP is part of IEA’s Technology Collaboration Programme (TCP).

 ,
, 


