Article

A Spectral Mapping Signature for the Rapid Ohia Death (ROD) Pathogen in Hawaiian Forests

1
Department of Global Ecology, Carnegie Institution for Science, 260 Panama St, Stanford, CA 94305, USA
2
USDA Agricultural Research Service, Hilo, HI 96720, USA
3
College of Tropical Agriculture and Human Resources, University of Hawaiʻi at Manoa, Hilo, HI 96720, USA
4
Institute of Pacific Islands Forestry, US Forest Service, Hilo, HI 96720, USA
*
Author to whom correspondence should be addressed.
Remote Sens. 2018, 10(3), 404; https://doi.org/10.3390/rs10030404
Submission received: 2 February 2018 / Revised: 27 February 2018 / Accepted: 4 March 2018 / Published: 6 March 2018
(This article belongs to the Special Issue Remote Sensing of Tropical Forest Biodiversity)

Abstract

:
Pathogenic invasions are a major source of change in both agricultural and natural ecosystems. In forests, fungal pathogens can kill habitat-generating plant species such as canopy trees, but methods for remote detection, mapping and monitoring of such outbreaks are poorly developed. Two novel species of the fungal genus Ceratocystis have spread rapidly across humid and mesic forests of Hawaiʻi Island, causing widespread mortality of the keystone endemic canopy tree species, Metrosideros polymorpha (common name: ʻōhiʻa). The process, known as Rapid Ohia Death (ROD), causes browning of canopy leaves in weeks to months following infection by the pathogen. An operational mapping approach is needed to track the spread of the disease. We combined field studies of leaf spectroscopy with laboratory chemical studies and airborne remote sensing to develop a spectral signature for ROD. We found that close to 80% of ROD-infected plants undergo marked decreases in foliar concentrations of chlorophyll, water and non-structural carbohydrates, which collectively result in strong consistent changes in leaf spectral reflectance in the visible (400–700 nm) and shortwave-infrared (1300–2500 nm) wavelength regions. Leaf-level results were replicated at the canopy level using airborne laser-guided imaging spectroscopy, with quantitative spectral separability of normal green-leaf canopies from suspected ROD-infected brown-leaf canopies in the visible and shortwave-infrared spectrum. Our results provide the spectral–chemical basis for detection, mapping and monitoring of the spread of ROD in native Hawaiian forests.

Graphical Abstract

1. Introduction

Biological invasions are an important driver of global environmental change capable of causing enormous ecological damage requiring billions of dollars in management effort [1,2,3]. Among the most problematic types of invasions are those involving pests and pathogens that attack host plants. Although such invasions commonly threaten agricultural crops, they can also impact natural ecosystems [4,5]. A good example is Dutch elm disease, caused by Ascomycete fungi, which devastated multiple elm tree species across Europe and North America over the past century [6,7]. However, few pests or pathogens have been documented as drivers of massive natural forest loss in tropical or sub-tropical ecosystems.
In the Hawaiian Islands, the keystone endemic tree ʻōhiʻa (Metrosideros polymorpha L. Gaud.) comprises the majority of remaining native forest canopy (i.e., 350,000 ha statewide and 250,000 ha on Hawaiʻi Island), and the ʻōhiʻa canopy provides critical habitat for thousands of other native plant and animal species, as well as the majority of Hawaiʻi’s fresh water resources. Beginning in 2010, a new and alarmingly widespread mortality of ʻōhiʻa emerged on Hawaiʻi Island. Symptoms include a rapid browning of canopy leaves, followed by death of the tree. Known as Rapid Ohia Death (ROD), this process is distinct from other landscape-scale ʻōhiʻa dieback patterns events such as whole-cohort senescence or drought-induced losses [8,9,10]. Previously designated Ceratocystis fimbriata [11], the primary driver of ROD has now been identified as two novel and exotic fungal species in the same genus. These new species are currently undergoing taxonomic revision and herein referred to as Ceratocystis species A and B [12]. The fungi, which enter the host ʻōhiʻa and subsequently interrupt water flow in the tree xylem, cause desiccation of the canopy and a distinctive browning of foliage (Figure 1). Despite the growing understanding of how these Ceratocystis fungi kill their host trees, the pattern of ROD spread across Hawaiʻi Island remains poorly understood, and this information is needed to direct ground-based containment and mitigation actions.
Remote sensing has been identified as a critically important contributor to management efforts intended to control the spread of ROD in Hawaiʻi [13]. Without remote sensing that provides information on the condition of each tree in the forest, field crews do not know where to best apply tactical control measures to contain the disease, such as in cutting and covering contaminated trees. Many remote sensing approaches exist, ranging from simple optical imaging instruments to complex laser and radar systems, and from small-scale mapping platforms such as unmanned aerial vehicles (UAV) to global-scale satellite mapping instrumentation.
A unique technology carried today onboard the Carnegie Airborne Observatory (CAO; https://cao.carnegiescience.edu) called laser-guided imaging spectroscopy (LGIS) combines high spatial-resolution imaging spectroscopy with fused laser scanning to generate a spectral measurement for each identifiable tree crown in a forest canopy at spatial resolutions of two meters or less [14,15,16]. The spectral measurement generated by CAO imaging spectrometer covers the reflected-solar range of 400 to 2500 nm in 5-nm increments (427 channels). However, associating this measurement with the fungal pathogens that generate ROD requires an understanding of the spectroscopy of ʻōhiʻa foliage and tree crowns in the initial brown-canopy state of disease manifestation.
Because LGIS measurements detect and express changes in foliar chemistry, it is important to develop an understanding of the relationship between spectral reflectance and underpinning foliar chemical traits associated with the brown-canopy state. Here we report on a study to quantitatively link leaf and canopy spectroscopy and foliar chemistry of ROD-affected trees on Hawaiʻi Island. Results of this study support a new approach to map and monitor the ROD fungal outbreak using LGIS measurements (see [17]).

2. Materials and Methods

We combined field, laboratory and aircraft-based measurements to quantify relationships among ROD-affected M. polymorpha canopies, leaf chemistry, and leaf and canopy spectroscopy. Comparisons were made between brown-leaf canopies suspected of ROD and visibly normal or healthy green-leaf trees (Figure 1).

2.1. Leaf-Level Methods

Leaves were collected from both brown and green canopy states using slingshots and pole pruners. Two field sites were selected for foliar sampling of tree canopies composed of brown leaves. These canopies were observed to have browned rapidly and entirely, suggesting them as potential ROD-infested trees. One site was located in the upper Wailuku Forest Reserve on the windward side of Mauna Kea volcano at ca. 1500 m a.s.l. Previous pathological studies indicated that ROD is common in this site. Thirteen samples were collected from canopies with color varying from reddish brown to grey-brown in order to span a range of time since browning. Leaves from eight additional brown-leaf canopies were collected between 100 and 200 m a.s.l., above the town of Hilo, Hawaiʻi. Additionally, a total of 22 canopies were selected for green-leaf collections. Twenty samples were collected from ʻōhiʻa found on young and old soil substrates at 300 m, 700 m, 1350 m, and 2000 m a.s.l. on Mauna Loa volcano. Two more green-leaf samples were collected at 100 m a.s.l. above the town of Hilo.

2.1.1. Leaf Chemistry and Pathology

Branches of mature leaves were sealed in polyethylene bags in the field to maintain moisture, stored on ice in coolers, and transported to the USDA Forest Service laboratories in Hilo, HI within 4 h of collection. A subset of leaves was selected from the branches for scanning and weighing. Leaf area was determined on a 600 dots-per-inch flatbed top-illumination optical scanner, using enough leaves to fill one scan area of 21 cm × 25 cm (up to ca. 20 leaves per sample depending on leaf size). Petioles were removed from each leaf prior to scanning. Scanned leaves were dried at 70 °C for 72 h before dry mass (DM) was measured. Leaf mass per area (LMA) was calculated as g DM m–2. From a subset of leaves, leaf discs (at least 30 per sample) were immediately taken from randomly selected leaves and transferred to −80 °C cryogenic freezers. Remaining leaves were detached from the branches and subsamples were selected to represent the conditions found among all leaves collected. These samples were dried to a constant mass at 70 °C for chemical analysis.
Detailed chemical analysis protocols, along with instrument and standards information, are available on the Carnegie Spectranomics Project website (http://spectranomics.ciw.edu), and are summarized here. Dried foliage was ground in a 20 mesh Wiley mill, and subsets were analyzed for total carbon and nitrogen content and carbon fractions. Carbon fractions including non-structural carbohydrates (NSC), cellulose and lignin were determined in 0.5 g dry ground leaf tissue using sequential digestion of increasing acidity in a fiber analyzer (Ankom Technology, Macedon, NY, USA). Carbon fractions are presented on an ash-free dry mass basis following ignition of the remaining sample at 500 °C for 5.5 h. A lemon leaf standard was used as a reference with each run to ensure consistency across runs. A subset of ground material was further processed to a fine powder for determination of total C and N concentration by combustion-reduction elemental analysis (Costec Analytical Technologies Inc., Valencia, CA, USA).
Frozen leaf disks were used for chlorophyll-ab (chl-ab), phenol and tannin determinations. Disks were ground in 95% methanol on the high throughput tissue homogenizer for analysis of phenols and tannins. A portion of the solution was further diluted and incubated on an orbital shaker at room temperature (15–18 °C) in the dark for 48 h to ensure proper phenol extraction [18]. A second portion of the solution was further diluted in a 2 mL centrifuge tube containing 10 mg Polyvinylpyrrolidone (PVP) and incubated on ice for 30 min after centrifuging, after which 75% of the supernatant was placed in a new centrifuge tube containing another 10 mg PVP for a second precipitation step [19]. Total phenolic concentration in solution was determined colorimetrically using the Folin–Ciocalteau method. Phenol concentrations were measured in Gallic Acid Equivalents (GAE) relative to an eight-point Gallic acid standard curve. Chl-ab concentrations were quantified using two frozen leaf disks (1.54 cm2). These disks were rapidly ground in 1.5 mL centrifuge tubes containing 0.75 mL 100% acetone on a high throughput tissue homogenizer (Troemner, Thorofare, NJ, USA) with a small amount of MgCO3 to prevent acidification. Following dilution and centrifugation for 3 min at 3000 rpm, the absorbance of the supernatant was measured using a dual-beam scanning UV-VIS spectrometer (Lambda 25, Perkin Elmer, Beaconsfield, UK).
Wood samples were collected from trunks of trees suspected of ROD using a flame sterilized drill bit. Wood shavings were analyzed for the presence and species of Ceratocystis following the method of Heller and Keith [20], as described briefly here. DNA was extracted directly from wood shavings and the extracts were assayed using real-time quantitative Polymerase Chain Reaction (qPCR) for the presence of Ceratocystis sp. A and B. This diagnostic tool utilizes genetic polymorphisms within the cerato-platanin genes of the two species to detect and distinguish the pathogens. To be sure negative test results were not caused by inhibitors in the DNA extracts, amplification of a plant DNA marker was multiplexed with the fungal detection assays as a positive control. In addition to DNA testing, culture-based testing using the carrot baiting method of [21] was an additional method used to check for the presence of the pathogens.

2.1.2. Leaf Spectroscopy

Hemispherical reflectance spectra spanning the 400–2500 nm wavelength range were measured on 12 leaf surfaces of brown or green samples after acquiring each branch from the field. Spectra were collected with a field spectroradiometer (FS-3 with custom detectors and exit slit configuration to maximize signal-to-noise performance; Analytical Spectra Devices, Inc., Boulder, CO, USA), an integrating sphere designed for high-resolution spectroscopic measurements, and a custom illumination collimator [22]. Twenty-five spectra per sample were averaged and calibrated for dark current and stray light, and the spectral data were referenced to a calibration block within the integrating sphere (Spectralon, LabSphere Inc., Durham, NH, USA).
We used partial least squares regression (PLSR) analysis [23] to ascertain the relationship between leaf spectral reflectance and chemical properties. Leaf spectral data were convolved to 10 nm band-width (FWHM) and restricted to 415–2405 nm wavelength range, with 1345–1445 nm and 1875–2005 nm atmospheric water vapor regions removed. This configuration simulated measurements acquired by airborne instruments such as the Carnegie Airborne Observatory [15]. The PLSR approach is beneficial because it utilizes the continuous spectrum as a single measurement rather than as a band-by-band analysis. To avoid overfitting, the number of factors used in the PLSR analysis was determined by minimizing the Prediction Residual Error Sum of Squares (PRESS) statistic [24]. The PRESS statistic was calculated through a leave-one-out cross-validation prediction for each model using JMP software (Version 13.0 SAS Institute Inc., Cary, NC, USA). Precision and accuracy of the final PLSR models for each foliar trait were assessed based on R2 and RMSE, respectively, between the modeled spectroscopic trait values and field-measured trait values.

2.2. Canopy-Level Methods

The CAO collected airborne laser-guided imaging spectrometer (LGIS) data [16] over forested regions of Hawaiʻi Island in June 2017. The full extent of data collection and detailed processing steps, including atmospheric correction, are presented in Vaughn et al. [17]. In LGIS, visible-to-shortwave infrared (VSWIR) spectrometer data covering 400–2500 nm in 5-nm contiguous wavebands are spatially and temporally fused with 3-dimensional light detection and ranging (LiDAR) data acquired simultaneously [15]. This enables computation of the precise 3-D location of the spectrometer data with very high precision. In addition, high-resolution (24 cm) digital color imagery was collected along with the LiDAR and spectrometer data, providing accurate assessment of canopy conditions at the time of flight. The color imager is embedded in the LiDAR sensor head and is boresight-aligned with the LiDAR and VSWIR measurements. It is a 16-bit natural color (red-green-blue) imaging CCD array of 8984 × 6732 pixels (60-megapixels).
Using the high-resolution digital color imagery as a guide, apparent surface reflectance spectra were taken from the orthorectified VSWIR data. In the digital color imagery, we identified the locations of 50 individual crowns representative of green trees and 50 individual crowns representative of browning or diseased trees (Figure 2). VSWIR data at these selected crown locations were analyzed, and a single representative pixel was extracted from each crown subject to the restriction that each met a minimum brightness threshold to reduce the influence of shade and other factors ([17]. Under this restriction, green pixels must have a reflectance greater than 25% at 1070 nm, which is highly conservative for ensuring green canopy conditions. Similarly, pixels representing browning crowns must have a reflectance greater than 15% at the same wavelength. The reflectance spectra for each of these selected pixels were extracted for further analysis.
We measured the degree of separation between green and brown leaf and canopy spectra using a spectral separability index (SSI) [25]. This wavelength-level measure indicates the importance of each wavelength in distinguishing between the two classes. The SSI was calculated for each wavelength using the equation:
S S I = | μ λ g r e e n μ λ b r o w n | s λ g r e e n + s λ b r o w n
where μ λ c l a s s is the mean reflectance value at a given wavelength, and s λ c l a s s is the standard deviation of the wavelength within the given leaf or canopy class. Plotting this metric for all wavelengths in the measured spectrum can indicate which leaf or structural traits most strongly differ between the brown and green classes. We repeated all canopy-level spectral reflectance analyses using brightness-normalized reflectance, which has been found to improve chemical retrievals using airborne imaging spectroscopy (e.g., [26,27,28]). Brightness normalization minimizes differences in observed brightness in reflectance data due to canopy leaf orientation and depth.

3. Results

3.1. Leaf-Level Results

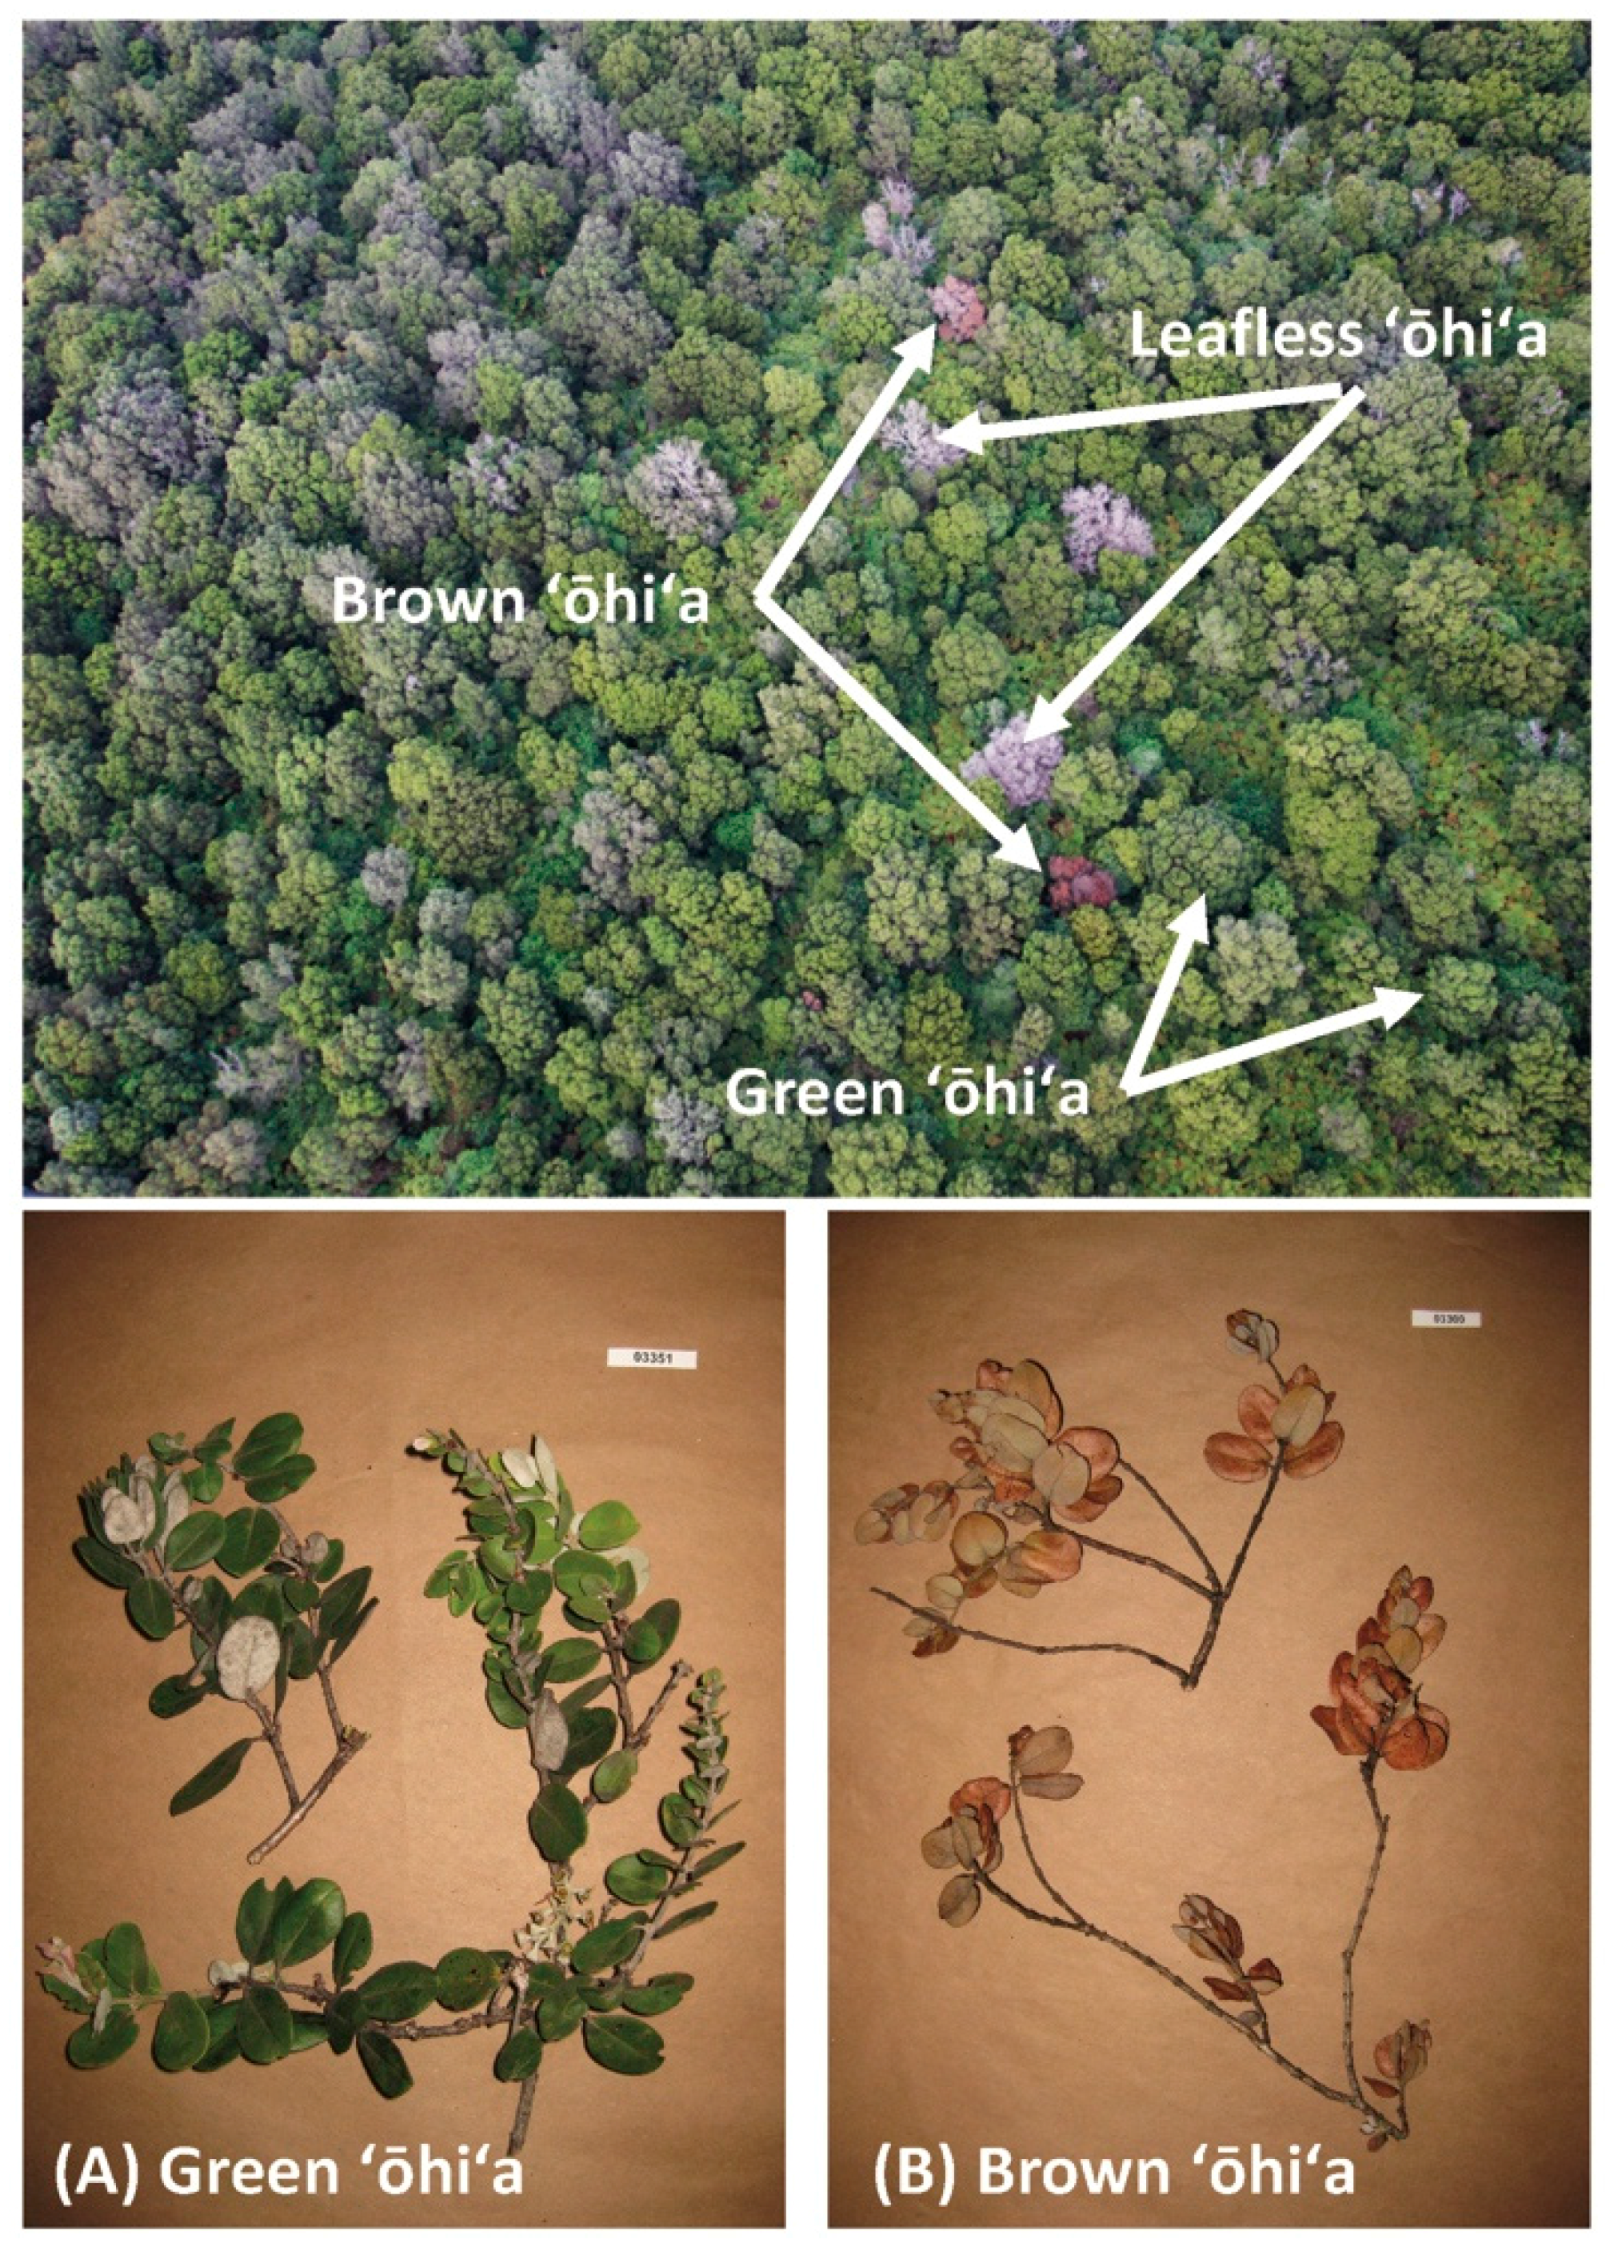
3.1.1. Leaf Chemistry and Pathology

Significant chemical and structural differences were observed between green and brown foliage of sampled M. polymorpha trees (Table 1). LMA, chl-ab, phenols, tannins, NSC and water concentrations were significantly higher in green foliage compared to brown foliage. Conversely, the proportion of total carbon remaining as cellulose was higher in brown foliage relative to green foliage. Total N, C, and lignin concentrations were not statistically different between green and brown leaves.
Wood pathological analyses indicated that Ceratocystis sp. A and B were present in 59% and 18% of the samples, respectively (Table 2). The less sensitive carrot-baiting method yielded Ceratocystis in 50% of the samples (data not shown). The collective 77% qPCR confirmation rate for the two fungi confirms that our chemical and spectral analyses were connected to the presence of the pathogen. Similar levels of ʻōhiʻa mortality were observed in field plots heavily affected by ROD [29]. Additionally, the 23% negative rate is thought to be partly due to sampling error; wood samples collected in the field for laboratory analysis may have been taken from the wrong portions of infected trees. Nonetheless, investigations into other patches of ʻōhiʻa dieback that lack the brown-canopy state have been found to have no detectable Ceratocystis fungal infection [9,30].

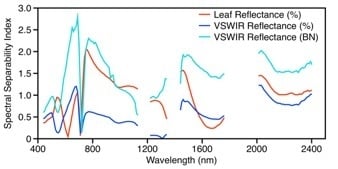
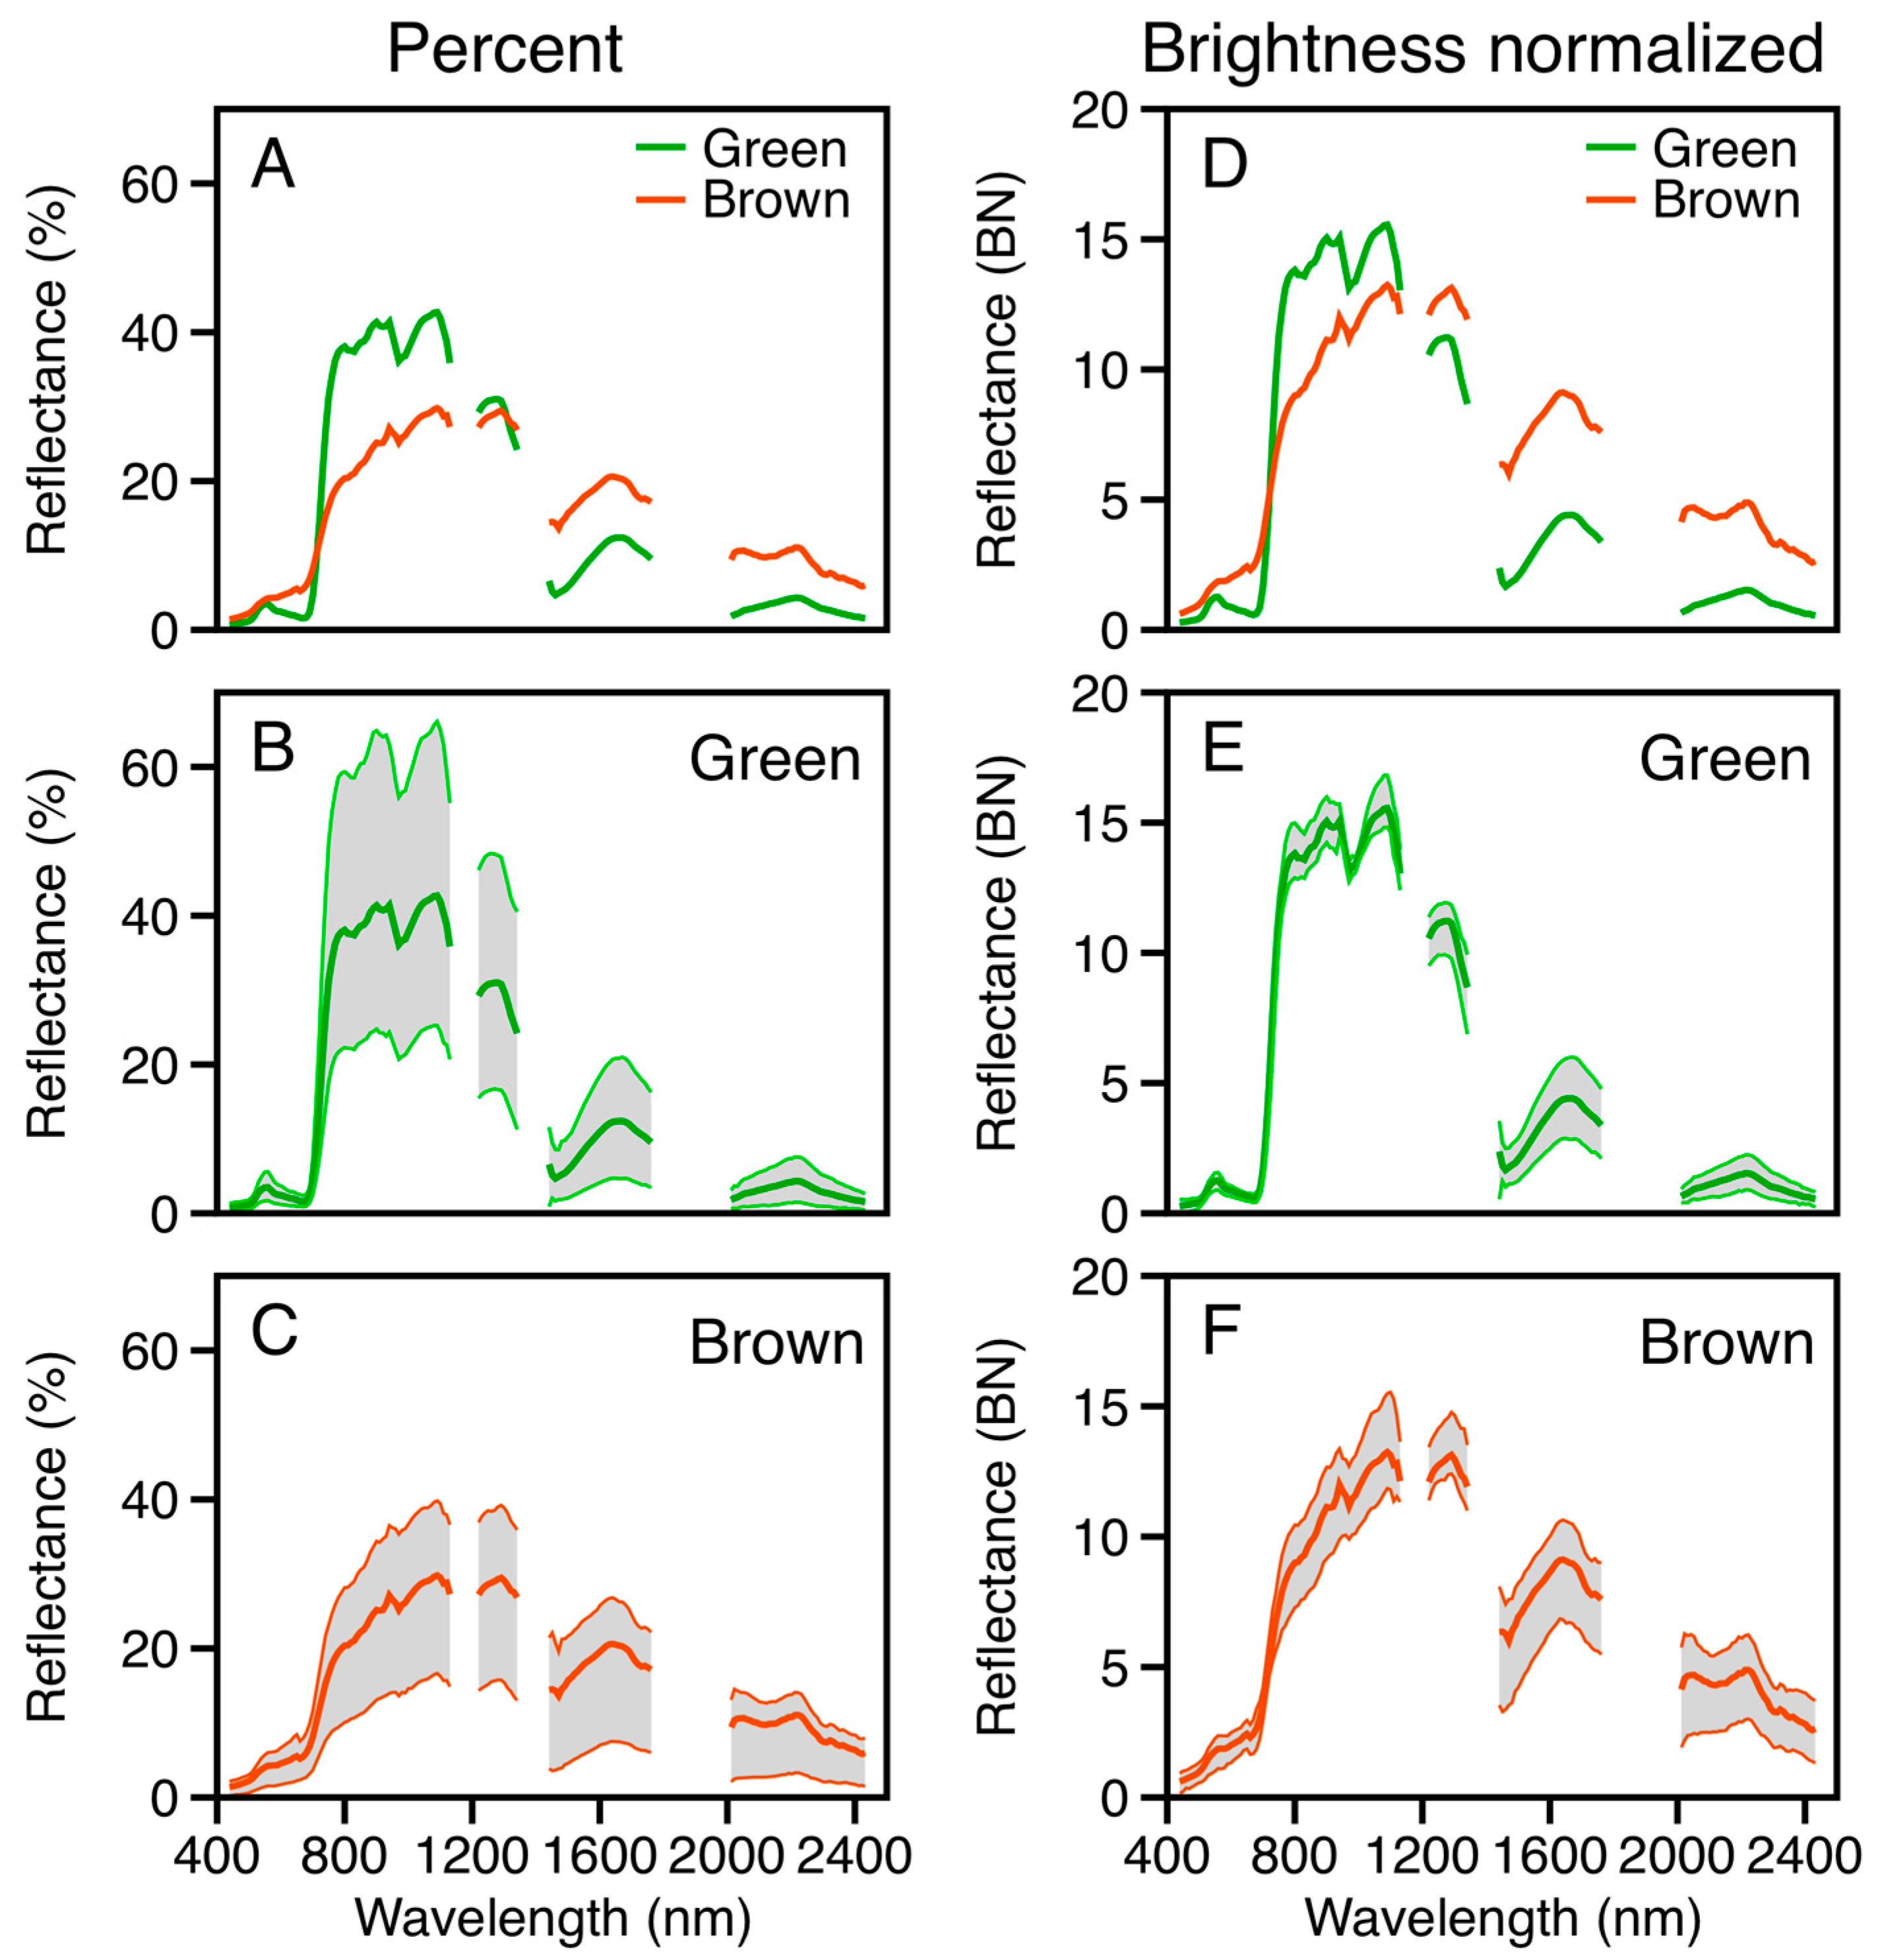
3.1.2. Leaf Spectroscopy

Green and brown leaf states showed pronounced spectral reflectance differences based on their scattering and absorption features (Figure 3). The green-leaf values followed the classic pattern with a local spectral reflectance peak at 550 nm, strong absorption near 680 nm, increased brightness in the near-infrared (700–1300 nm), and strong absorption in the shortwave-infrared (1300–2500 nm) (Figure 3). In contrast, brown leaves displayed no 550 nm peak, weak absorption at 680 nm and high shortwave-infrared (1300–2500 nm) values, along with the emergence of unique spectral features in the 2000–2400 nm range.

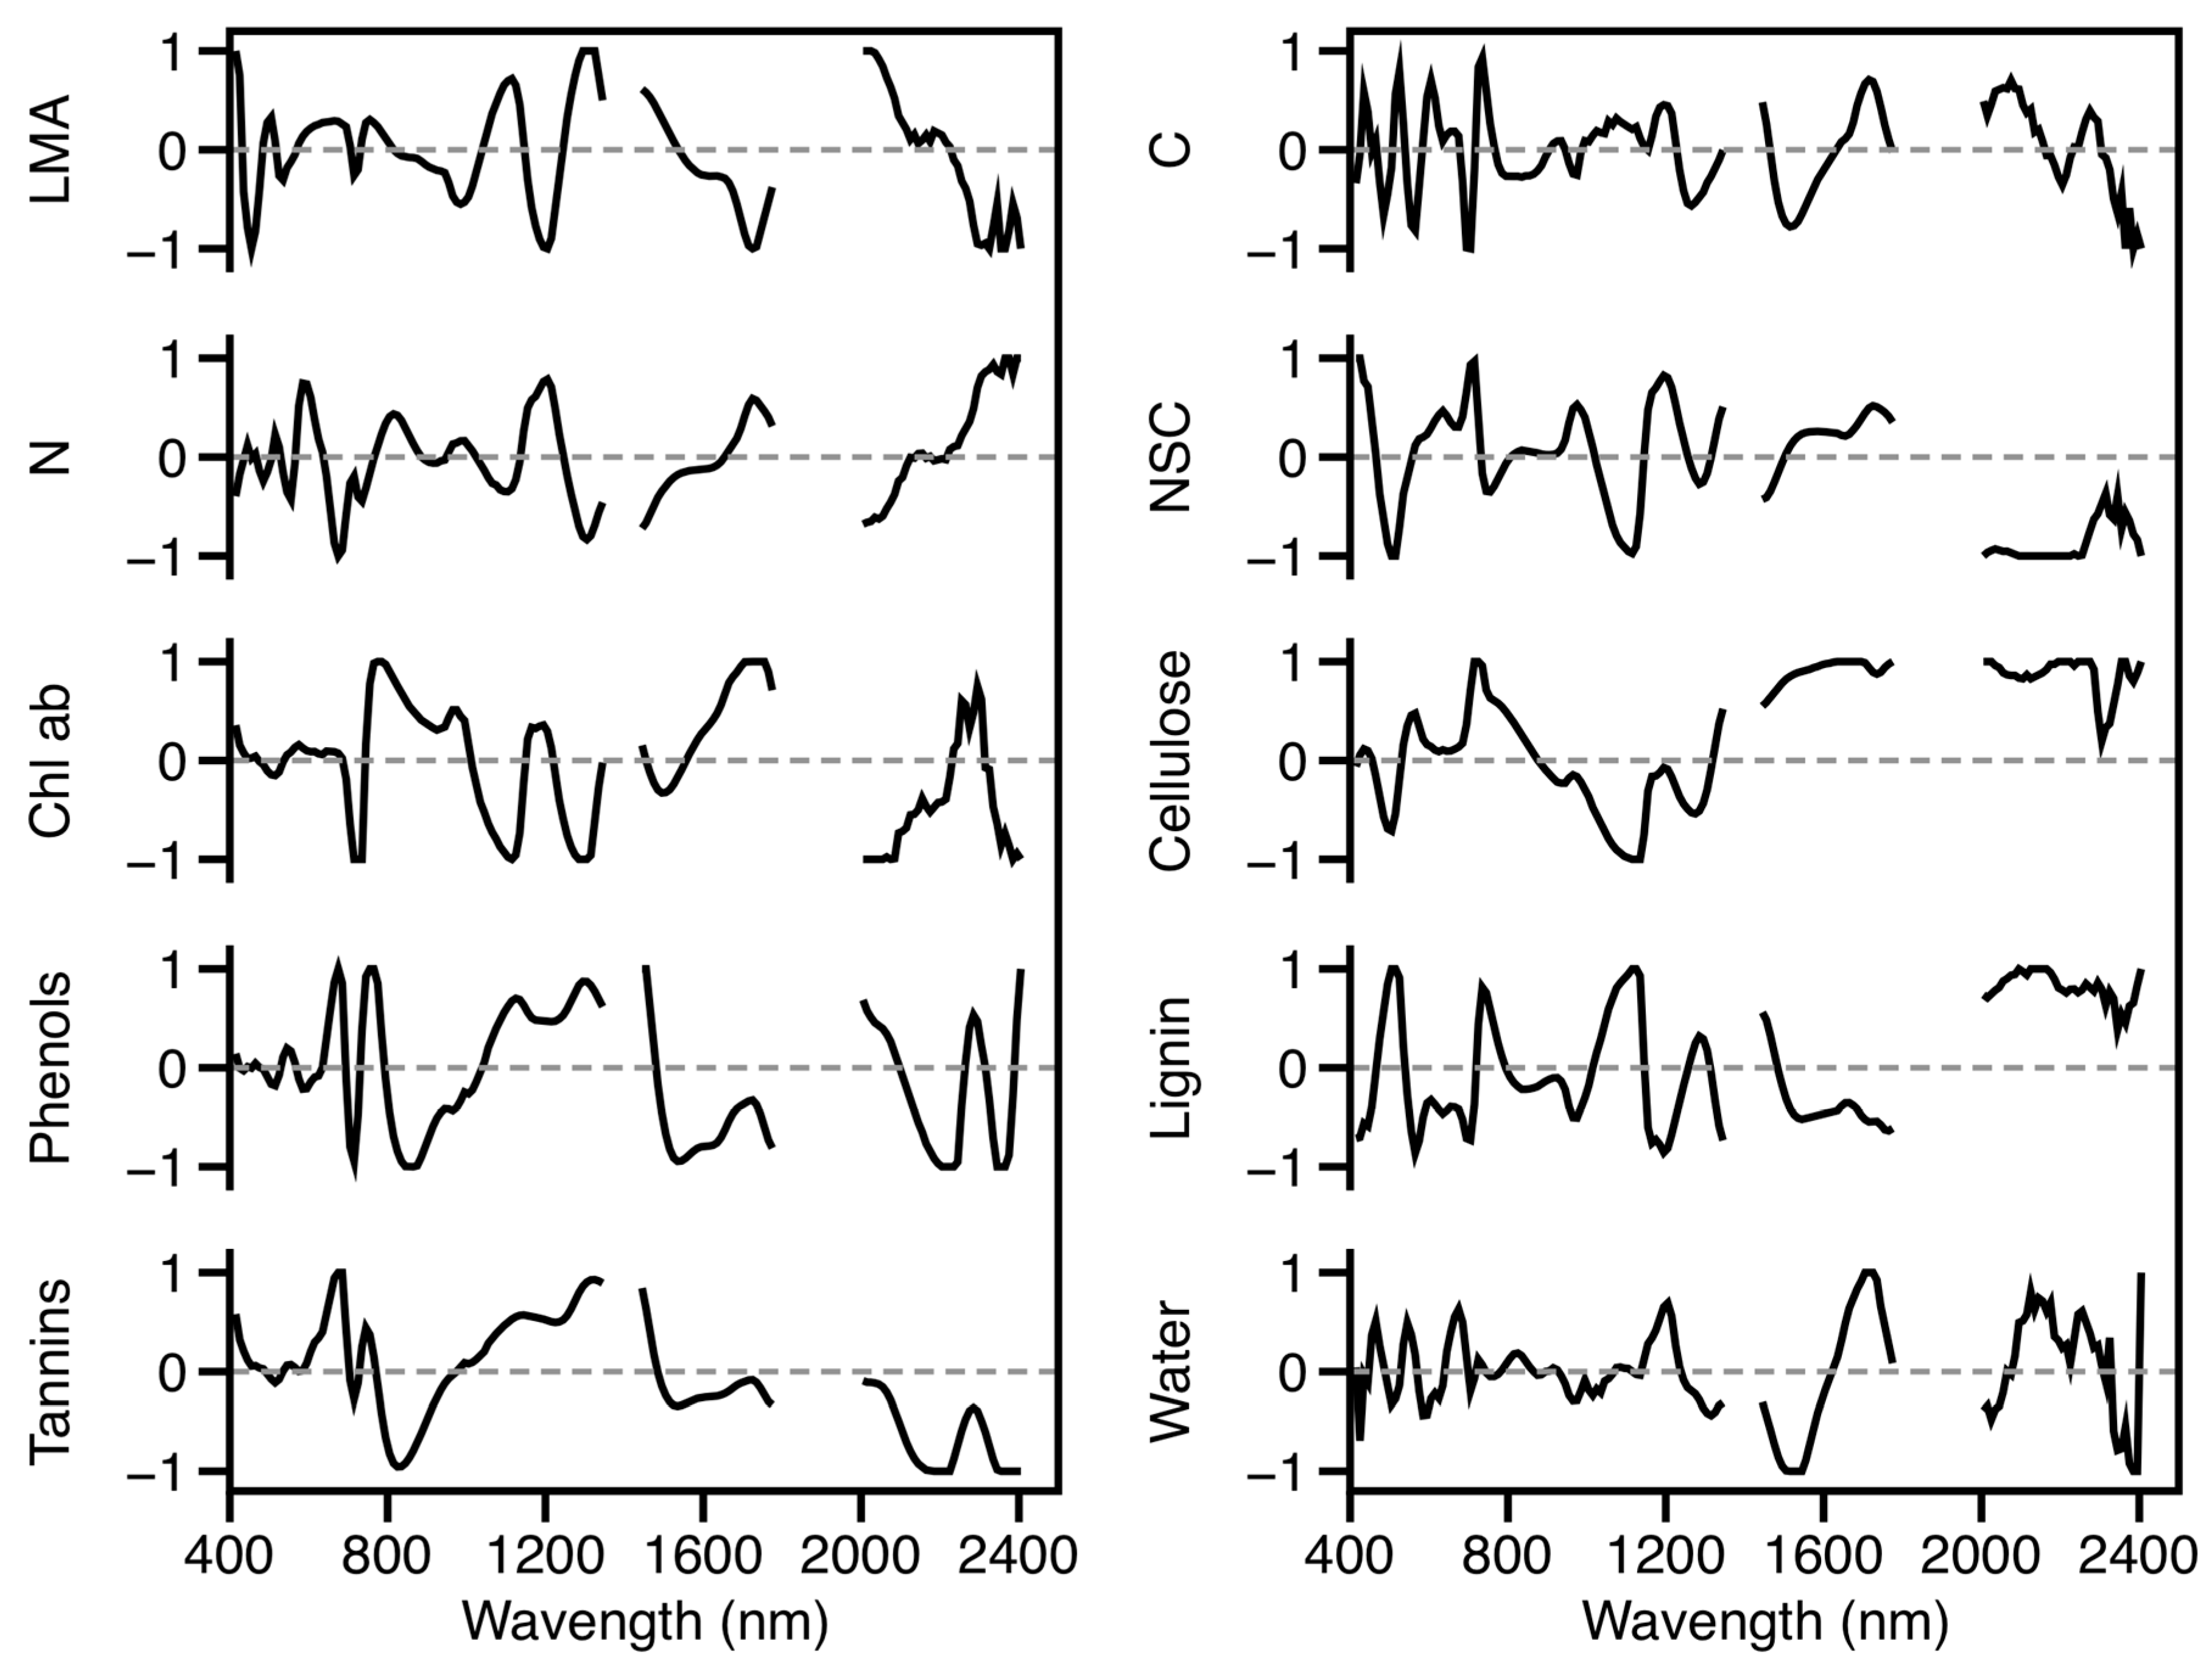
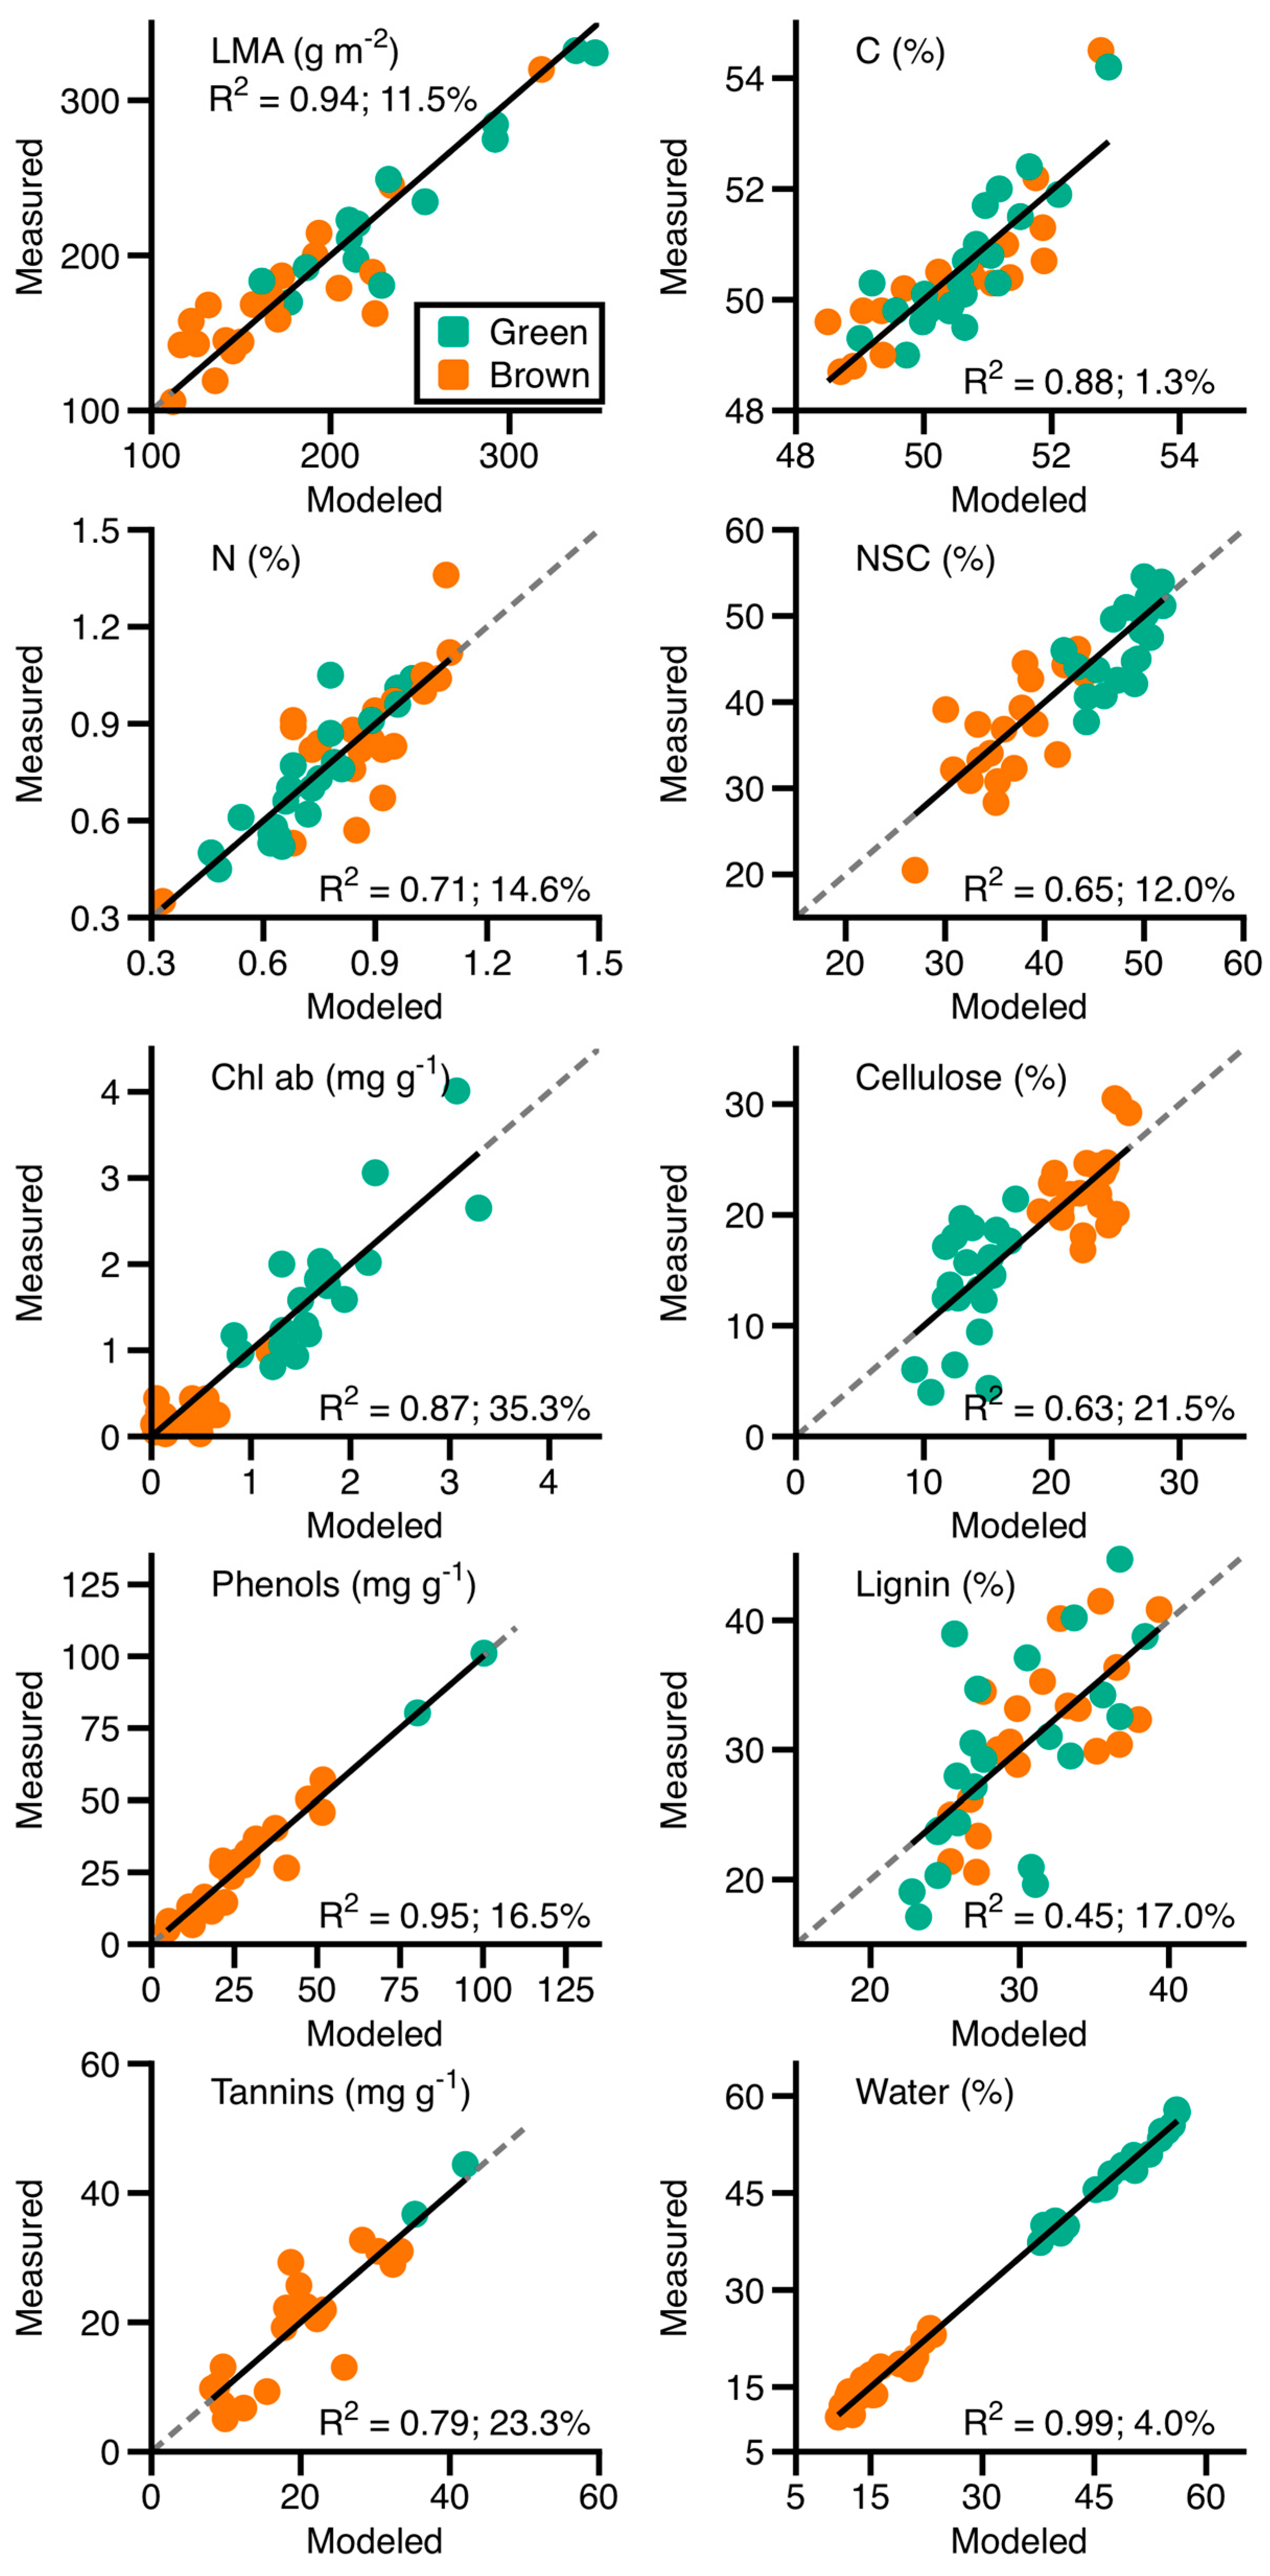
3.1.3. Leaf Spectral–Chemical Relationships

Spectral–chemical relationships were developed using the PLSR approach with leaf reflectance of a combination of green and brown leaves (Figure 4). PLSR wavelength weightings indicated the portions of the reflected spectrum most predictive of each leaf trait. For example, chl-ab was primarily predicted by reflectance in the 680–700 nm range associated with photosynthetic pigment absorption of incoming solar radiation. In contrast, leaf N was partially predicted by similar visible-wavelength absorptions, but was much more influenced by shortwave-infrared absorptions associated with leaf protein concentrations (1700–2300 nm). These PLSR weightings for leaf traits have been observed in other plant canopies worldwide [31,32,33].
Leaf reflectance measurements provided precise and accurate relationships with laboratory-assayed leaf traits (Figure 5). Reflectance spectra predicted LMA as well as chl-ab, phenol, C, and water concentrations with R2 values of 0.85–0.99. Leaf N, NSC, cellulose and tannin concentrations had a somewhat lower precision (R2 = 0.40–0.74). From these PLSR analyses, it became clear that the spectral differences in brown leaf and green leaf states of ʻōhiʻa are driven by underlying differences in chl-ab, NSC, phenol, tannin, and water concentrations (Figure 4).

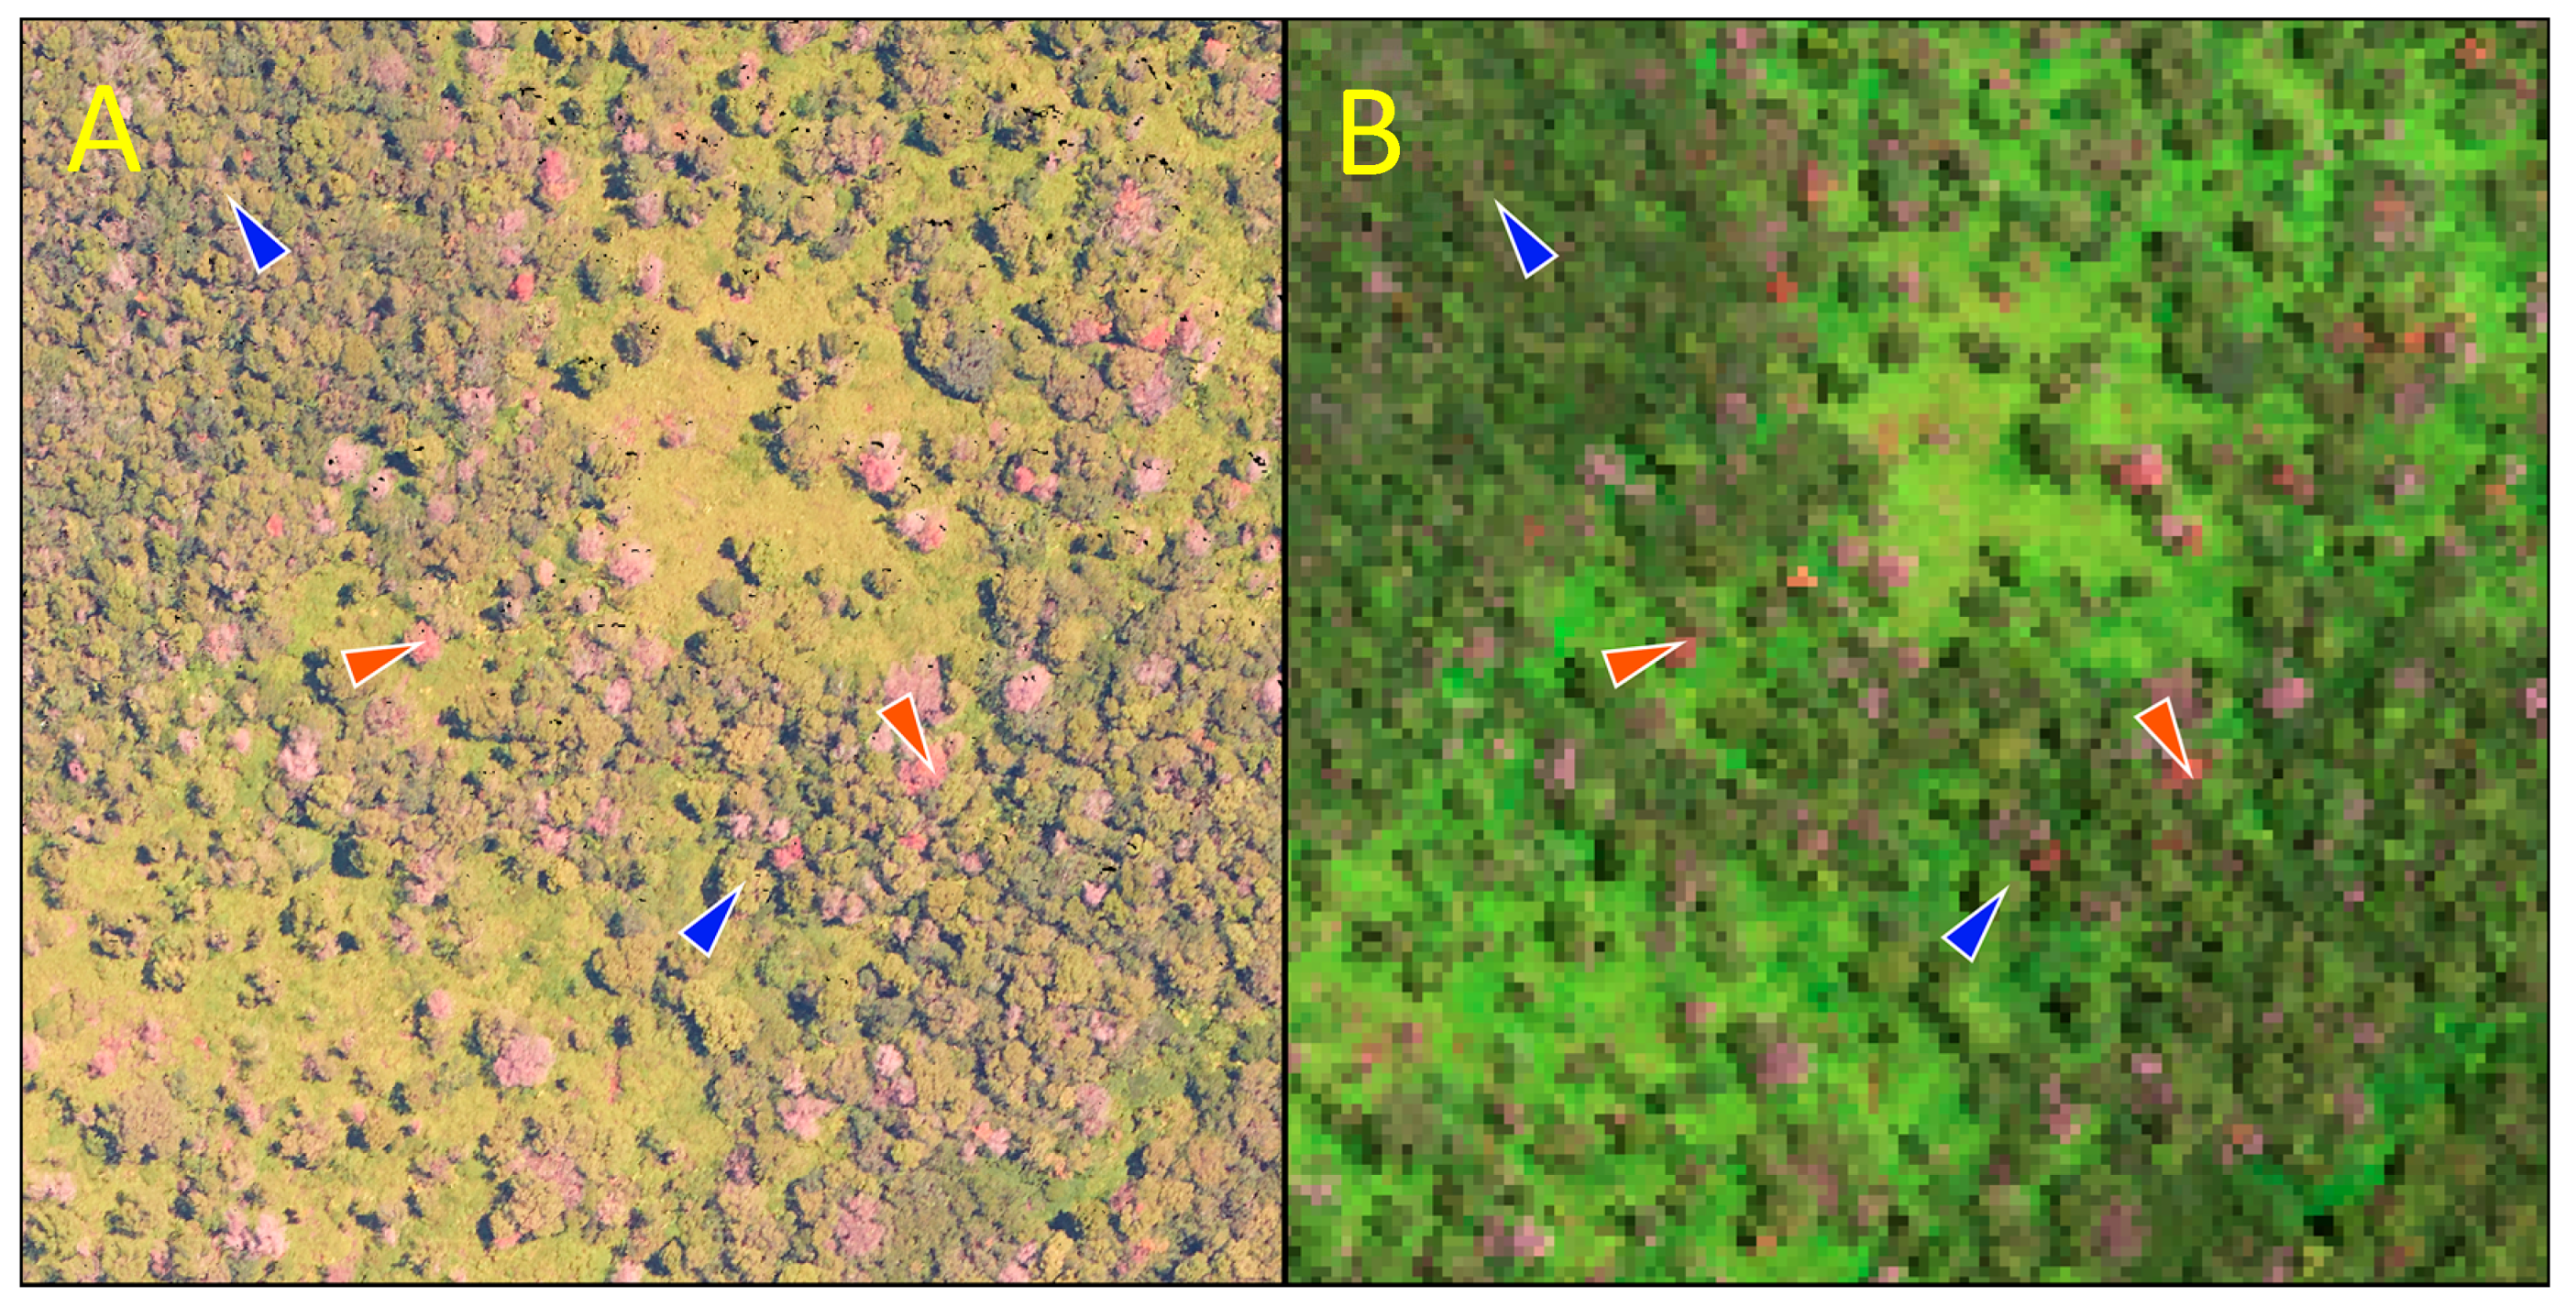
3.2. Canopy-Level Results

Green and brown canopy reflectance spectra (Figure 6A–C) had overall shapes similar to those found for leaf-level reflectance spectra (Figure 3A–C). Compared to leaf-level reflectances, canopy values were lower in the near-infrared (800–1300 nm) wavelength regions, relative to features in the shortwave (>1300 nm) wavelengths, and they were more variable across the entire spectrum. Brightness normalization reduced the overall variability of green and brown canopy spectra and increased the reflectance values in the near-infrared relative to the remainder of the spectrum. Brightness-normalized canopy spectra (Figure 6D–F) more closely resembled leaf-level spectra (Figure 3A–C) because inter- and intra-crown shading was mitigated in the data [26,34].
The spectral separability of green versus brown leaf and/or canopy reflectance had similar overall spectral shapes among different types of reflectance measurements, despite differences in magnitude (Figure 7). Highest spectral separability was located in the 680–780 nm wavelength range, which is associated with differences in chl-ab and phenols (Figure 4 and Figure 5). Secondary to peak separation at visible wavelengths, the shortwave-infrared (>1300 nm) was also important in separating green and brown leaves and canopies (Figure 7). Differences in this region of the spectrum were driven by shifts in relative amounts of cellulose and non-structural carbohydrates, as well as water concentrations between green and brown leaf and canopy states. Maximum spectral separability at the canopy level was achieved using brightness-normalized reflectance spectra from the airborne imaging spectrometer data (Figure 7).

4. Discussion

A combination of field and laboratory measurements revealed quantitative chemical and spectral differences between foliage from brown canopies suspected of ROD and visibly normal green-leaf canopies. Moreover, leaf-level spectral differences mirrored aircraft-based spectral measurements of brown and green leaf canopies, supporting the fundamental link between leaf and canopy spectroscopy and the foliar chemistry of ROD-affected trees. In combination, these multi-scale findings provide a functionally-based measurement to detect trees suspected of ROD infection using airborne imaging spectroscopy of Hawaiian forests.
Following Ceratocystis infection of M. polymorpha trees, leaf chemical changes include a loss of labile foliar constituents, resulting in canopy browning. During this process, foliar chl-ab and water concentrations drop to levels that are unable to sustain tree growth, and the proportions of NSC decreases 30–45% in brown leaves along with a concomitant proportional increase in cellulose concentrations. Chl-ab and water losses are expressed in the visible (400–700 nm) and shortwave-infrared (>1300 nm) wavelengths, but much less so in near-infrared (700–1300 nm) wavelengths (Figure 3). These spectral shifts are subsequently expressed in the PLSR results, which show pronounced wavelength shifts in the visible and shortwave regions (Figure 4). Simultaneously, a relative shift between NSC and cellulose abundances generated pronounced changes in shortwave-infrared (>1300 nm) spectral reflectance (Figure 3), as demonstrated in PLSR weightings (Figure 4) and chemical retrievals (Figure 5). In contrast to changes in concentrations of labile chemicals, lignin, total C and total N do not differ between green and brown leaves. Consistency in these less labile chemicals reflects the rapidity of Ceratocystis effects on its host. Such changes in foliar chemistry in response to Ceratocystis are similar to foliar response to drought following cavitation of xylem [35,36,37].
Leaf spectra not only provided a means to quantify chemical concentrations, but the shape of the leaf spectra mirrored those of the canopy for both green and brown leaves (Figure 3 and Figure 6). Importantly, there was consistency in the spectral separability of green and brown M. polymorpha states at leaf and canopy levels (Figure 7). The spectral separation was largely dominated by visible (400–700 nm) and shortwave-infrared (>1300 nm) features, which align well with chl-ab, water and NSC losses (Figure 4 and Figure 5). When applying brightness normalization to the canopy reflectance spectra in order to minimize canopy structural effects [26], direct contributions from leaves in the canopy were greatly amplified throughout the entire reflected-solar spectrum, but especially in the visible and shortwave regions (Figure 7). This finding strongly suggests that a spectral signature of suppressed chl-ab, leaf water and NSC can be used to map M. polymorpha trees suspected of ROD. Indeed, this spectral signature proved robust for detection and mapping of the brown-state M. polymorpha trees throughout Hawaiʻi Island, with demonstrated accuracies of 86% and higher (see Vaughn et al. [17]). Our study provides the chemical and spectral basis for new mapping capabilities, and presents an approach to develop context-specific spectral signatures for operational mapping with imaging spectroscopy.
We recognize that other processes can generate a brown-leaf state in M. polymorpha tree canopies, and in other plant species more generally. To date, however, we do not have a quantitative understanding of how processes, such as drought-induced mortality, affect absolute and relative partitioning of labile foliar chemicals in trees. Our study is one example of how to develop the understanding and the spectral basis for mapping. In the specific case of ROD, it is the rate of chemical–spectral change that may best separate this cause of tree mortality from other causes. It is commonly observed that trees affected by ROD can undergo rapid symptom progression, with tree canopies changing from a green to brown-leaf state in days to weeks. Few other environmental and/or biological (pathogenic) processes are known to operate at such fast rates. It is therefore imperative that the laser-guided imaging spectroscopy approach underpinned in this study, and made operational in the associated Vaughn et al. ([17] study, be carried out on a sufficiently frequent basis to capture differences in tree crown browning rates.
Remapping Hawaiʻi Island for suspected ROD using airborne techniques is tractable due to the fact that its forests currently cover only about 250,000 hectares. Yet repeatability remains a challenge, and satellite-based imagery is currently unable to provide high spatial resolution (less than five meters), high-fidelity imaging spectroscopy, or adequate controls for canopy structural variability (e.g., LiDAR). Until such advanced remote sensing assets are established and made available to the science community, applications for ecosystem management and conservation will be retained at regional scales using aircraft-based approaches.

5. Conclusions

Better methods are needed for rapid remote detection, mapping and monitoring of the effects of pathogenic outbreaks on forest communities. We used a combination of field and laboratory measurements to establish quantitative chemical and spectral differences between foliage from brown canopies suspected of Rapid Ohia Death in Hawaiian forests. We found that ROD-infected M. polymorpha trees undergo marked decreases in foliar concentrations of chlorophyll, water and non-structural carbohydrates, and these declines generated consistent changes in leaf spectral reflectance in the visible (400–700 nm) and shortwave-infrared (1300–2500 nm) wavelength regions. Leaf-level results were replicated at the canopy level using airborne laser-guided imaging spectroscopy, with quantitative spectral separability of normal green-leaf M. polymorpha canopies from suspected ROD-infected brown-leaf canopies. Our findings provide a functionally-based measurement to detect individual trees suspected of ROD infection using airborne imaging spectroscopy.

Acknowledgments

This study was supported by funds from the U.S. Forest Service and the Carnegie Institution for Science. The Carnegie Airborne Observatory has been made possible by grants and donations to G.P. Asner from the Avatar Alliance Foundation, Margaret A. Cargill Foundation, David and Lucile Packard Foundation, Gordon and Betty Moore Foundation, Grantham Foundation for the Protection of the Environment, W. M. Keck Foundation, John D. and Catherine T. MacArthur Foundation, Andrew Mellon Foundation, Mary Anne Nyburg Baker and G. Leonard Baker Jr, and William R. Hearst III.

Author Contributions

Gregory P. Asner conceived and designed the experiments; all co-authors performed the experiments; Gregory P. Asner, Roberta E. Martin, Wade P. Heller, Marc A. Hughes, Christopher Balzotti, and Nicholas R. Vaughn analyzed the data; Lisa M. Keith, Wade P. Heller and R. Flint Hughes contributed reagents/materials/analysis tools; Gregory P. Asner and Roberta E. Martin wrote the paper.

Conflicts of Interest

The authors declare no conflict of interest. Mention of trademark, proprietary product, or vendor does not constitute a guarantee or warranty of the product by the U.S. Dept. of Agriculture and does not imply its approval to the exclusion of other products or vendors that also may be suitable.

References

  1. Simberloff, D.; Martin, J.-L.; Genovesi, P.; Maris, V.; Wardle, D.A.; Aronson, J.; Courchamp, F.; Galil, B.; García-Berthou, E.; Pascal, M.; et al. Impacts of biological invasions: What’s what and the way forward. Trends Ecol. Evol. 2013, 28, 58–66. [Google Scholar] [CrossRef] [PubMed] [Green Version]
  2. Ghelardini, L.; Pepori, A.L.; Luchi, N.; Capretti, P.; Santini, A. Drivers of emerging fungal diseases of forest trees. For. Ecol. Manag. 2016, 381, 235–246. [Google Scholar] [CrossRef]
  3. Freer-Smith, P.H.; Webber, J.F. Tree pests and diseases: The threat to biodiversity and the delivery of ecosystem services. Biodivers. Conserv. 2017, 26, 3167–3181. [Google Scholar] [CrossRef]
  4. Boyd, I.L.; Freer-Smith, P.H.; Gilligan, C.A.; Godfray, H.C.J. The Consequence of Tree Pests and Diseases for Ecosystem Services. Science 2013, 342, 1235773. [Google Scholar] [CrossRef] [PubMed]
  5. Wingfield, M.J.; Brockerhoff, E.G.; Wingfield, B.D.; Slippers, B. Planted forest health: The need for a global strategy. Science 2015, 349, 832–836. [Google Scholar] [CrossRef] [PubMed]
  6. Hubbes, M. The American elm and Dutch elm disease. For. Chron. 1999, 75, 265–273. [Google Scholar] [CrossRef]
  7. Brasier, C.M.; Buck, K.W. Rapid Evolutionary Changes in a Globally Invading Fungal Pathogen (Dutch Elm Disease). Biol. Invasions 2001, 3, 223–233. [Google Scholar] [CrossRef]
  8. Mueller-Dombois, D.; Ellenberg, H. Aims and Methods of Vegetation Ecology; John Wiley and Sons, Inc.: New York, NY, USA, 1974. [Google Scholar]
  9. Hodges, C.S.; Adee, K.T.; Stein, J.D.; Wood, H.B.; Doty, R.D. Decline of ohia (Metrosideros polymorpha) in Hawaii: A review. Gen. Tech. Rep. 1986, 1–22. [Google Scholar] [CrossRef]
  10. Barbosa, J.M.; Asner, G.P. Effects of long-term rainfall decline on the structure and functioning of Hawaiian forests. Environ. Res. Lett. 2017, 12, 94002. [Google Scholar] [CrossRef]
  11. Keith, L.M.; Hughes, R.F.; Sugiyama, L.S.; Heller, W.P.; Bushe, B.C.; Friday, J.B. First Report of Ceratocystis Wilt on ʻŌhiʻa (Metrosideros polymorpha). Plant Dis. 2015, 99, 1276. [Google Scholar] [CrossRef]
  12. Barnes, I.; Fourie, A.; Wingfield, M.J.; Harrington, T.C.; McNew, D.L.; Sugiyama, L.S.; Luiz, B.C.; Heller, W.P.; Keith, L.M. New Ceratocystis species associated with rapid death of Metrosideros polymorpha in Hawaiʻi. Persoonia 2018, in press. [Google Scholar]
  13. RAPID ʻŌHIʻA DEATH, Part 1: Strategic Response Plan. Available online: https://cms.ctahr.hawaii.edu/Portals/222/Ohia Documents/ROD Strategic Response Plan Final 112216 (1).pdf?ver=2016-12-19-092946-040 (accessed on 16 January 2018).
  14. Asner, G.; Martin, R. Spectral and chemical analysis of tropical forests: Scaling from leaf to canopy levels. Remote Sens. Environ. 2008, 112, 3958–3970. [Google Scholar] [CrossRef]
  15. Asner, G.P.; Knapp, D.E.; Boardman, J.; Green, R.O.; Kennedy-Bowdoin, T.; Eastwood, M.; Martin, R.E.; Anderson, C.; Field, C.B. Carnegie Airborne Observatory-2: Increasing science data dimensionality via high-fidelity multi-sensor fusion. Remote Sens. Environ. 2012, 124, 454–465. [Google Scholar] [CrossRef]
  16. Asner, G.P.; Martin, R.E.; Knapp, D.E.; Tupayachi, R.; Anderson, C.B.; Sinca, F.; Vaughn, N.R.; Llactayo, W. Airborne laser-guided imaging spectroscopy to map forest trait diversity and guide conservation. Science 2017, 355, 385–389. [Google Scholar] [CrossRef] [PubMed]
  17. Vaughn, N.R.; Asner, G.P.; Brodrick, P.G.; Martin, R.E.; Heckler, J.W.; Knapp, D.E.; Hughes, R.F. An Approach for High-resolution Mapping of Hawaiian Metrosideros Forest Mortality Using Laser-guided Imaging Spectroscopy. Remote Sens. 2018, in press. [Google Scholar]
  18. Ainsworth, E.A.; Gillespie, K.M. Estimation of total phenolic content and other oxidation substrates in plant tissues using Folin Coicalteau reagent. Nat. Protoc. 2007, 2, 875–877. [Google Scholar] [CrossRef] [PubMed]
  19. Toth, G.B.; Pavia, H. Removal of dissolved brown algal phlorotannins using insoluble Polyvinylpyrrolidone (PVPP). J. Chem. Ecol. 2001, 27, 1899–1910. [Google Scholar] [CrossRef] [PubMed]
  20. Heller, W.; Keith, L. Real-time PCR assays to detect and distinguish the rapid ohia death pathogens. Phytopathology 2018. in review. [Google Scholar]
  21. Moller, W.J.; DeVay, J.E. Carrot as a species-selective isolation medium for Ceratocystis fimbriata. Phytopathology 1968, 58, 123–124. [Google Scholar]
  22. Asner, G.P.; Martin, R.E.; Knapp, D.E.; Tupayachi, R.; Anderson, C.; Carranza, L.; Martinez, P.; Houcheime, M.; Sinca, F.; Weiss, P. Spectroscopy of canopy chemicals in humid tropical forests. Remote Sens. Environ. 2011, 115, 3587–3598. [Google Scholar] [CrossRef]
  23. Haaland, D.M.; Thomas, E.V. Partial least-squares methods for spectral Analyses. 1. Relation to other quantitative calibration methods and the extraction of qualitative information. Anal. Chem. 1988, 60, 1193–1202. [Google Scholar] [CrossRef]
  24. Chen, S.; Hong, X.; Harris, C.J.; Sharkey, P.M. Sparse modeling using orthogonal forest regression with PRESS statistic and regularization. IEEE Trans. Syst. Man Cybern. 2004, 34, 898–911. [Google Scholar] [CrossRef]
  25. Somers, B.; Zortea, M.; Plaza, A.; Asner, G.P. Automated Extraction of Image-Based Endmember Bundles for Improved Spectral Unmixing. IEEE J. Sel. Top. Appl. Earth Obs. Remote Sens. 2012, 5, 396–408. [Google Scholar] [CrossRef]
  26. Feilhauer, H.; Asner, G.P.; Martin, R.E.; Schmidtlein, S. Brightness-normalized Partial Least Squares Regression for hyperspectral data. J. Quant. Spectrosc. Radiat. Transf. 2010, 111, 1947–1957. [Google Scholar] [CrossRef]
  27. Asner, G.P.; Anderson, C.B.; Martin, R.E.; Tupayachi, R.; Knapp, D.E.; Sinca, F. Landscape biogeochemistry reflected in shifting distributions of chemical traits in the Amazon forest canopy. Nat. Geosci. 2015, 8, 567–573. [Google Scholar] [CrossRef]
  28. Balzotti, C.S.; Asner, G.P.; Taylor, P.G.; Cleveland, C.C.; Cole, R.; Martin, R.E.; Nasto, M.; Osborne, B.B.; Porder, S.; Townsend, A.R. Environmental controls on canopy foliar nitrogen distributions in a Neotropical lowland forest. Ecol. Appl. 2016, 26, 2451–2464. [Google Scholar] [CrossRef] [PubMed]
  29. Mortenson, L.A.; Flint Hughes, R.; Friday, J.B.; Keith, L.M.; Barbosa, J.M.; Friday, N.J.; Liu, Z.; Sowards, T.G. Assessing spatial distribution, stand impacts and rate of Ceratocystis fimbriata induced ʻōhiʻa (Metrosideros polymorpha) mortality in a tropical wet forest, Hawaiʻi Island, USA. For. Ecol. Manag. 2016, 377, 83–92. [Google Scholar] [CrossRef]
  30. Hwang, S.; Ko, W. Quantitative studies of Phytophthora cinnamomi in decline and healthy Ohia forests. Trans. Br. Mycol. Soc. 1978, 70. [Google Scholar] [CrossRef]
  31. Curran, P.J. Remote sensing of foliar chemistry. Remote Sens. Environ. 1989, 30, 271–278. [Google Scholar] [CrossRef]
  32. Kokaly, R.F.; Asner, G.P.; Ollinger, S.V.; Martin, M.E.; Wessman, C.A. Characterizing canopy biochemistry from imaging spectroscopy and its application to ecosystem studies. Remote Sens. Environ. 2009, 113, S78–S91. [Google Scholar] [CrossRef]
  33. Asner, G.P.; Martin, R.E.; Anderson, C.B.; Knapp, D.E. Quantifying forest canopy traits: Imaging spectroscopy versus field survey. Remote Sens. Environ. 2015, 158, 15–27. [Google Scholar] [CrossRef]
  34. Martin, R.; Chadwick, K.; Brodrick, P.; Carranza-Jimenez, L.; Vaughn, N.; Asner, G. An Approach for Foliar Trait Retrieval from Airborne Imaging Spectroscopy of Tropical Forests. Remote Sens. 2018, 10, 199. [Google Scholar] [CrossRef]
  35. Choat, B.; Jansen, S.; Brodribb, T.J.; Cochard, H.; Delzon, S.; Bhaskar, R.; Bucci, S.J.; Feild, T.S.; Gleason, S.M. Global convergence in the vulnerability of forests to drought. Nature 2012. [Google Scholar] [CrossRef] [PubMed]
  36. McDowell, N.; Pockman, W.T.; Allen, C.D.; Breshears, D.D.; Cobb, N.; Kolb, T.; Plaut, J.; Sperry, J.; West, A.; Williams, D.G.; et al. Mechanisms of plant survival and mortality during drought: Why do some plants survive while others succumb to drought? New Phytol. 2008, 178, 719–739. [Google Scholar] [CrossRef] [PubMed]
  37. Oliva, J.; Stenlid, J.; Martínez-Vilalta, J. The effect of fungal pathogens on the water and carbon economy of trees: Implications for drought-induced mortality. New Phytol. 2014, 203, 1028–1035. [Google Scholar] [CrossRef] [PubMed]
Figure 1. Typical area of known Rapid Ohia Death (ROD) where infected trees exhibit the brown-canopy state. Green ʻōhiʻa (Metrosideros polymorpha) trees and leafless ʻōhiʻa trees are also visible. Bottom photos show examples of ʻōhiʻa foliar specimens collected for green-live (A) and brown ROD-infected (B) canopies.
Remotesensing 10 00404 g001
Figure 2. Example images from the Carnegie Airborne Observatory: (A) high-resolution digital color camera and (B) visible-to-shortwave infrared (VSWIR) imaging spectrometer showing suspected ROD-infected brown-state crowns and green crowns. Red arrows point to representative brown-state trees and blue arrows point to healthy green trees.
Remotesensing 10 00404 g002
Figure 3. (A) Comparison of mean green and brown leaf reflectance, followed by mean, minimum and maximum reflectance values for (B) green and (C) brown foliage.
Remotesensing 10 00404 g003
Figure 4. Partial least squares regression (PLSR) weightings determining chemometric relationships between leaf reflectance and leaf traits. Weighting values that depart from the zero line in each panel indicate where in the spectrum each leaf trait is quantitatively expressed.
Remotesensing 10 00404 g004
Figure 5. Accuracy and precision of reflectance-based analyses of traits for green and brown ʻōhiʻa foliage. The more separable a given trait, the more important its role in determining spectral differences associated with fungal infection leading to Rapid Ohia Death. Fewer phenol and tannin data points for green foliage is due to a lack of sampling as described in the methods.
Remotesensing 10 00404 g005
Figure 6. Comparisons of mean green and brown canopy reflectance and brightness-normalized canopy reflectance are shown in (A,D), respectively, followed by mean, minimum and maximum reflectance values for green (B,E) and brown (C,F) foliage.
Remotesensing 10 00404 g006
Figure 7. Spectral separability indices between green and brown for leaf (red line) and canopy (blue line) reflectance spectra. The separability index for canopy reflectance following brightness normalization (BN) is also provided (cyan line).
Remotesensing 10 00404 g007
Table 1. Foliar traits for live green and ROD-infected brown foliage in ʻōhiʻa canopies. For each trait, an asterisk (*) indicate significant differences between group means (t-tests; p < 0.01). Phenols and tannins were measured in only seven green leaf samples.
TraitGreen Foliage (n = 22)Brown Foliage (n = 21)
Mean (SD)RangeMean (SD)Range
LMA (g m−2) *315.6 (125.3)169.8–622.4172.9 (46.0)105.7–319.9
N (%)0.72 (0.18)0.45–1.050.86 (0.22)0.35–1.36
Chl-ab (mg g−1) *1.68 (0.78)0.81–4.010.21 (0.23)0.01–0.98
Phenols (mg g−1) *90.7 (14.7)80.3–101.125.7 (14.7)5.1–57.0
Tannins (mg g−1) *40.6 (5.4)36.7–44.419.2 (8.9)5.1–32.7
C (%)50.6 (1.2)49.0–54.250.9 (2.5)48.7–60.2
NSC (%) *47.9 (6.3)37.7–67.337.0 (6.7)20.5–46.1
Cellulose (%) *13.7 (5.1)4.0–21.422.8 (3.7)16.8–30.5
Lignin (%)29.3 (7.7)17.1–44.731.3 (5.9)20.6–41.5
Water (%) *47.1 (6.8)37.3–57.915.9 (4.1)10.3–24.1
Table 2. Results of quantitative Polymerase Chain Reaction (qPCR) tests on wood from ʻōhiʻa trees collected in the ‘brown’ canopy state, and thus suspected of having succumbed to ROD (see Table 1).
qPCR ResultNum. Trees% of Tested
Ceratocystis sp. A1359
Ceratocystis sp. B418
Negative523
Total22100

