Climate Change and Anthropogenic Impacts on Wetland and Agriculture in the Songnen and Sanjiang Plain, Northeast China

Abstract
:1. Introduction
2. Materials and Methods
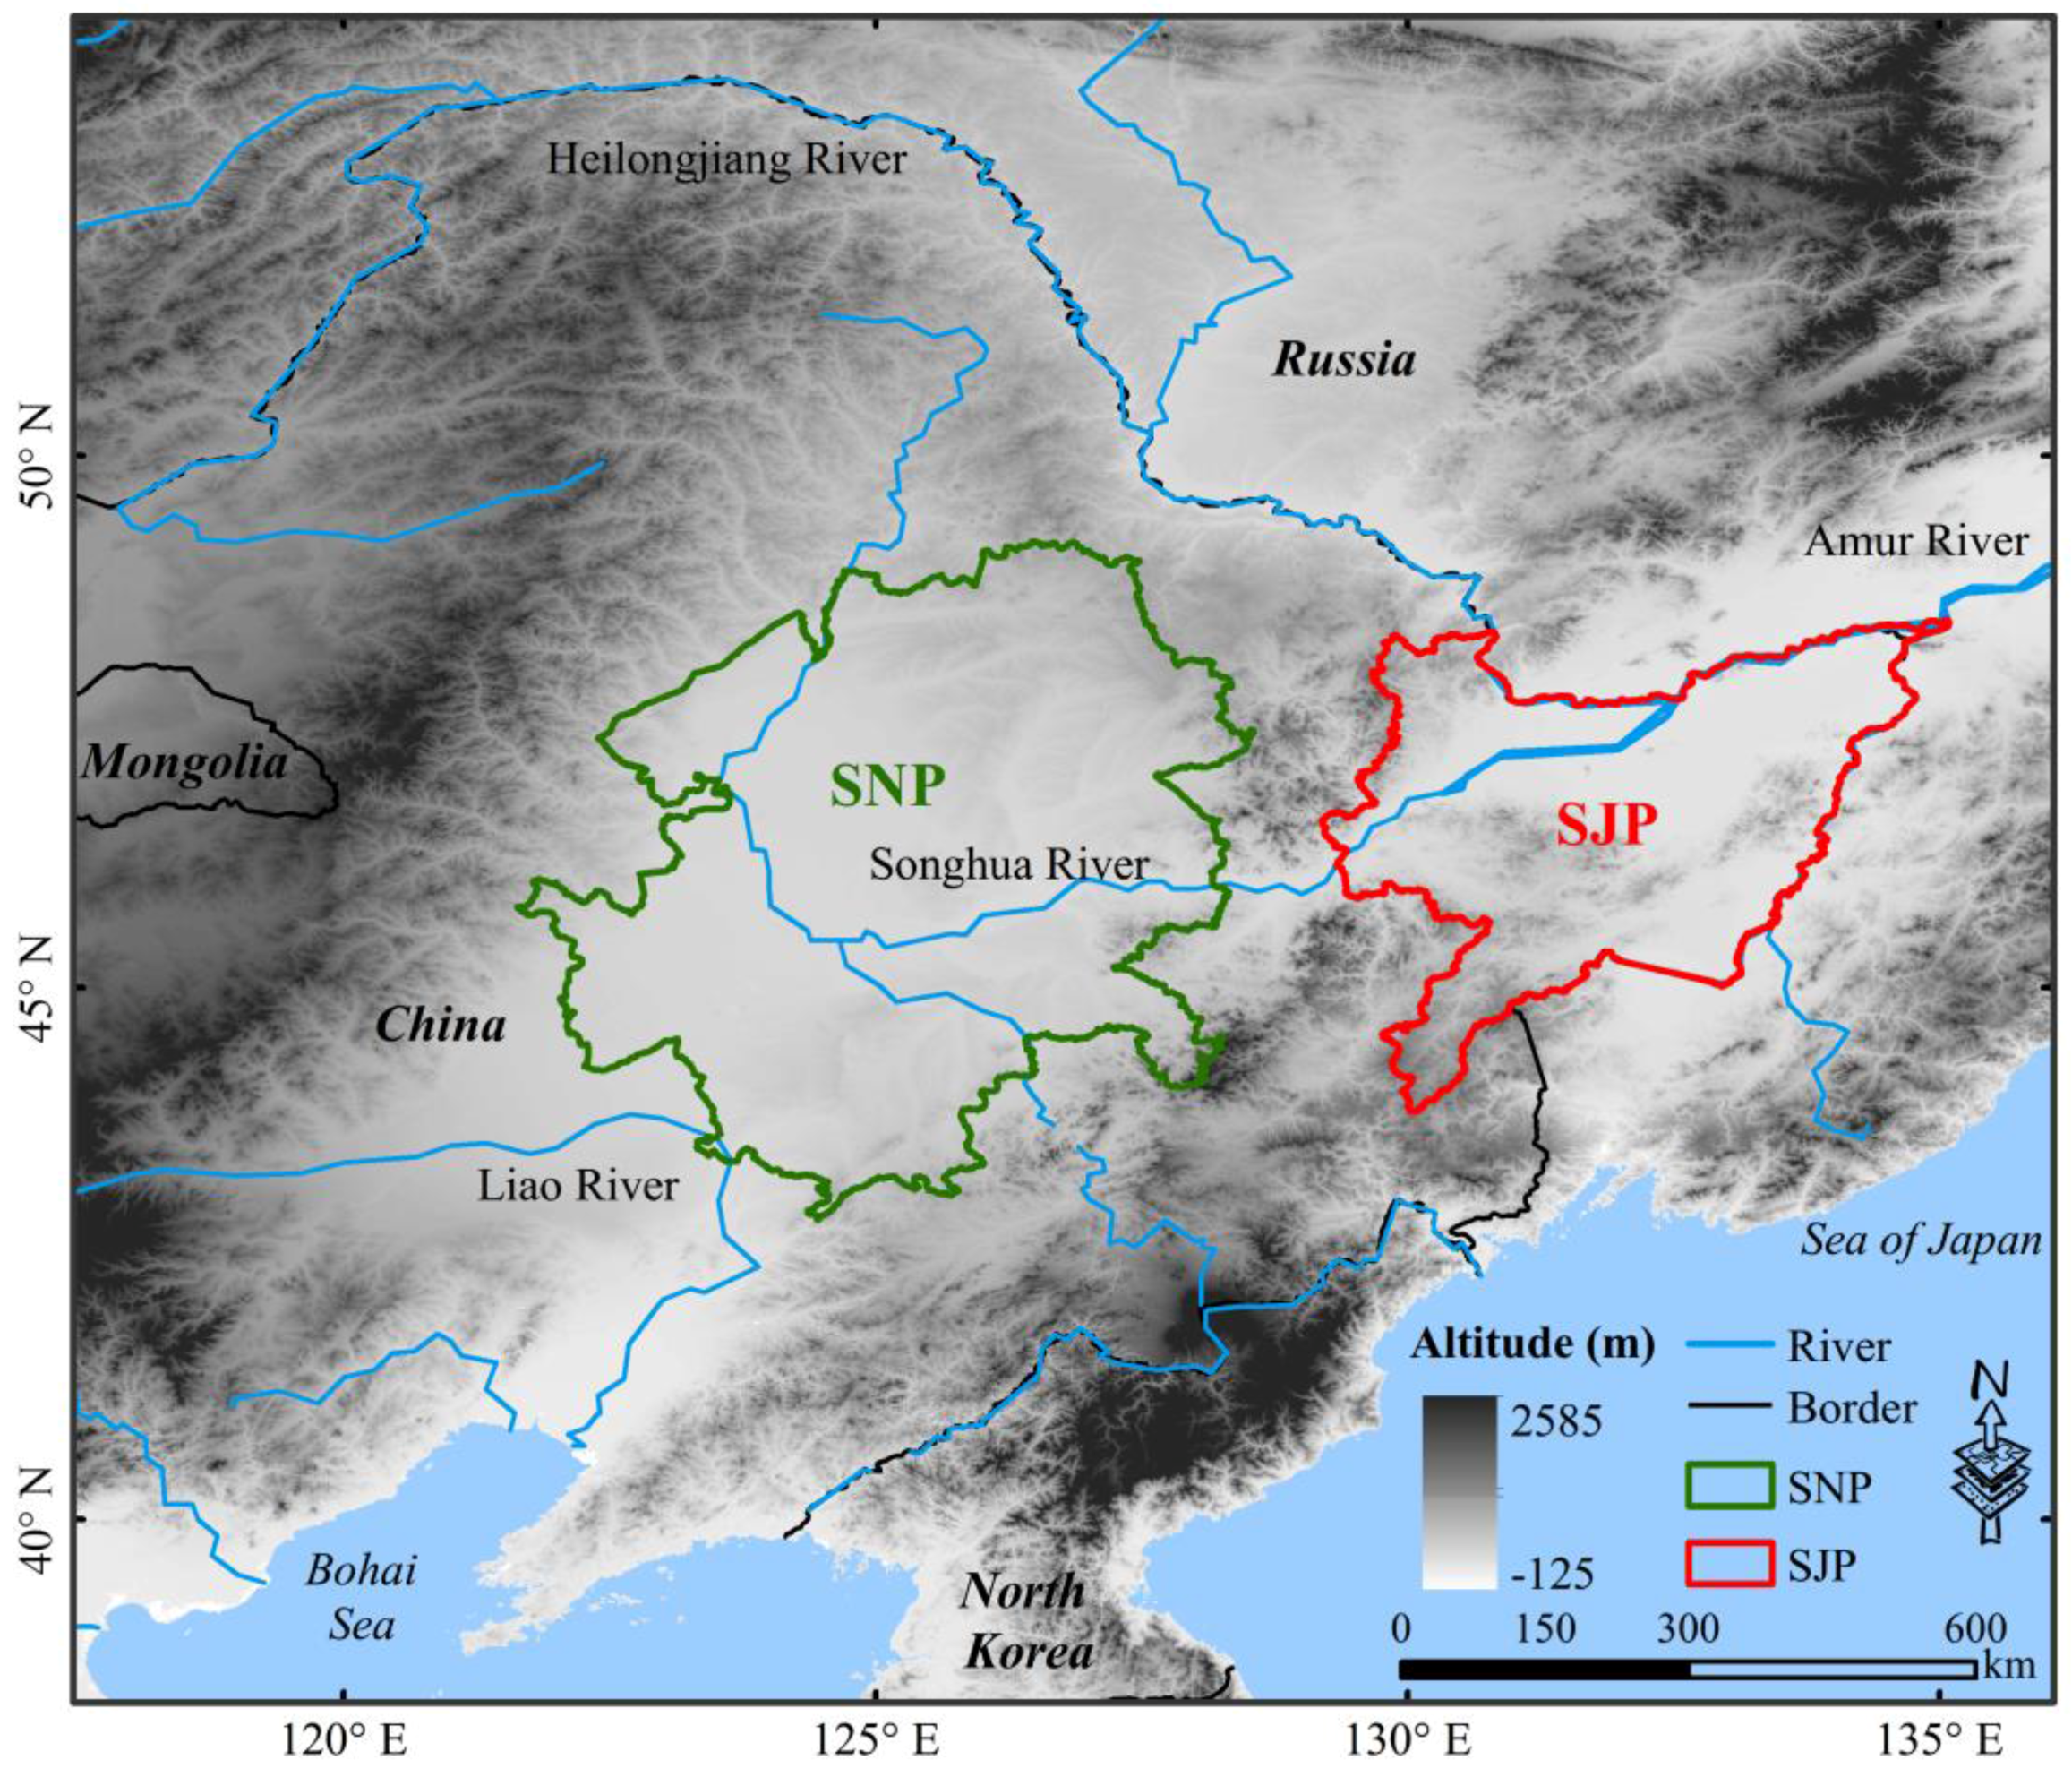
2.1. Study Region
2.2. Methodologies
2.2.1. LULCC Detection—Especially for the Conversion from Marshland to Other LULC Types
2.2.2. Quantitatively Distinguishing the Impacts of Anthropogenic Activities and Climatic Changes on Conversion and Loss of Marshland
2.2.3. Maxent Modeling
2.2.4. Suitability—Predicting Impacts of Different Climate Change Scenarios
2.3. Materials
2.3.1. LULC Dataset
2.3.2. Environmental Data for the Maxent Modeling
2.3.3. Other Supplementary Data
3. Results
3.1. Spatiotemporal Variations of LULCC in the SJP and SNP
3.2. The Relative Role of Anthropogenic Activities and Climatic Changes in Terms of Their Impacts on Marshland
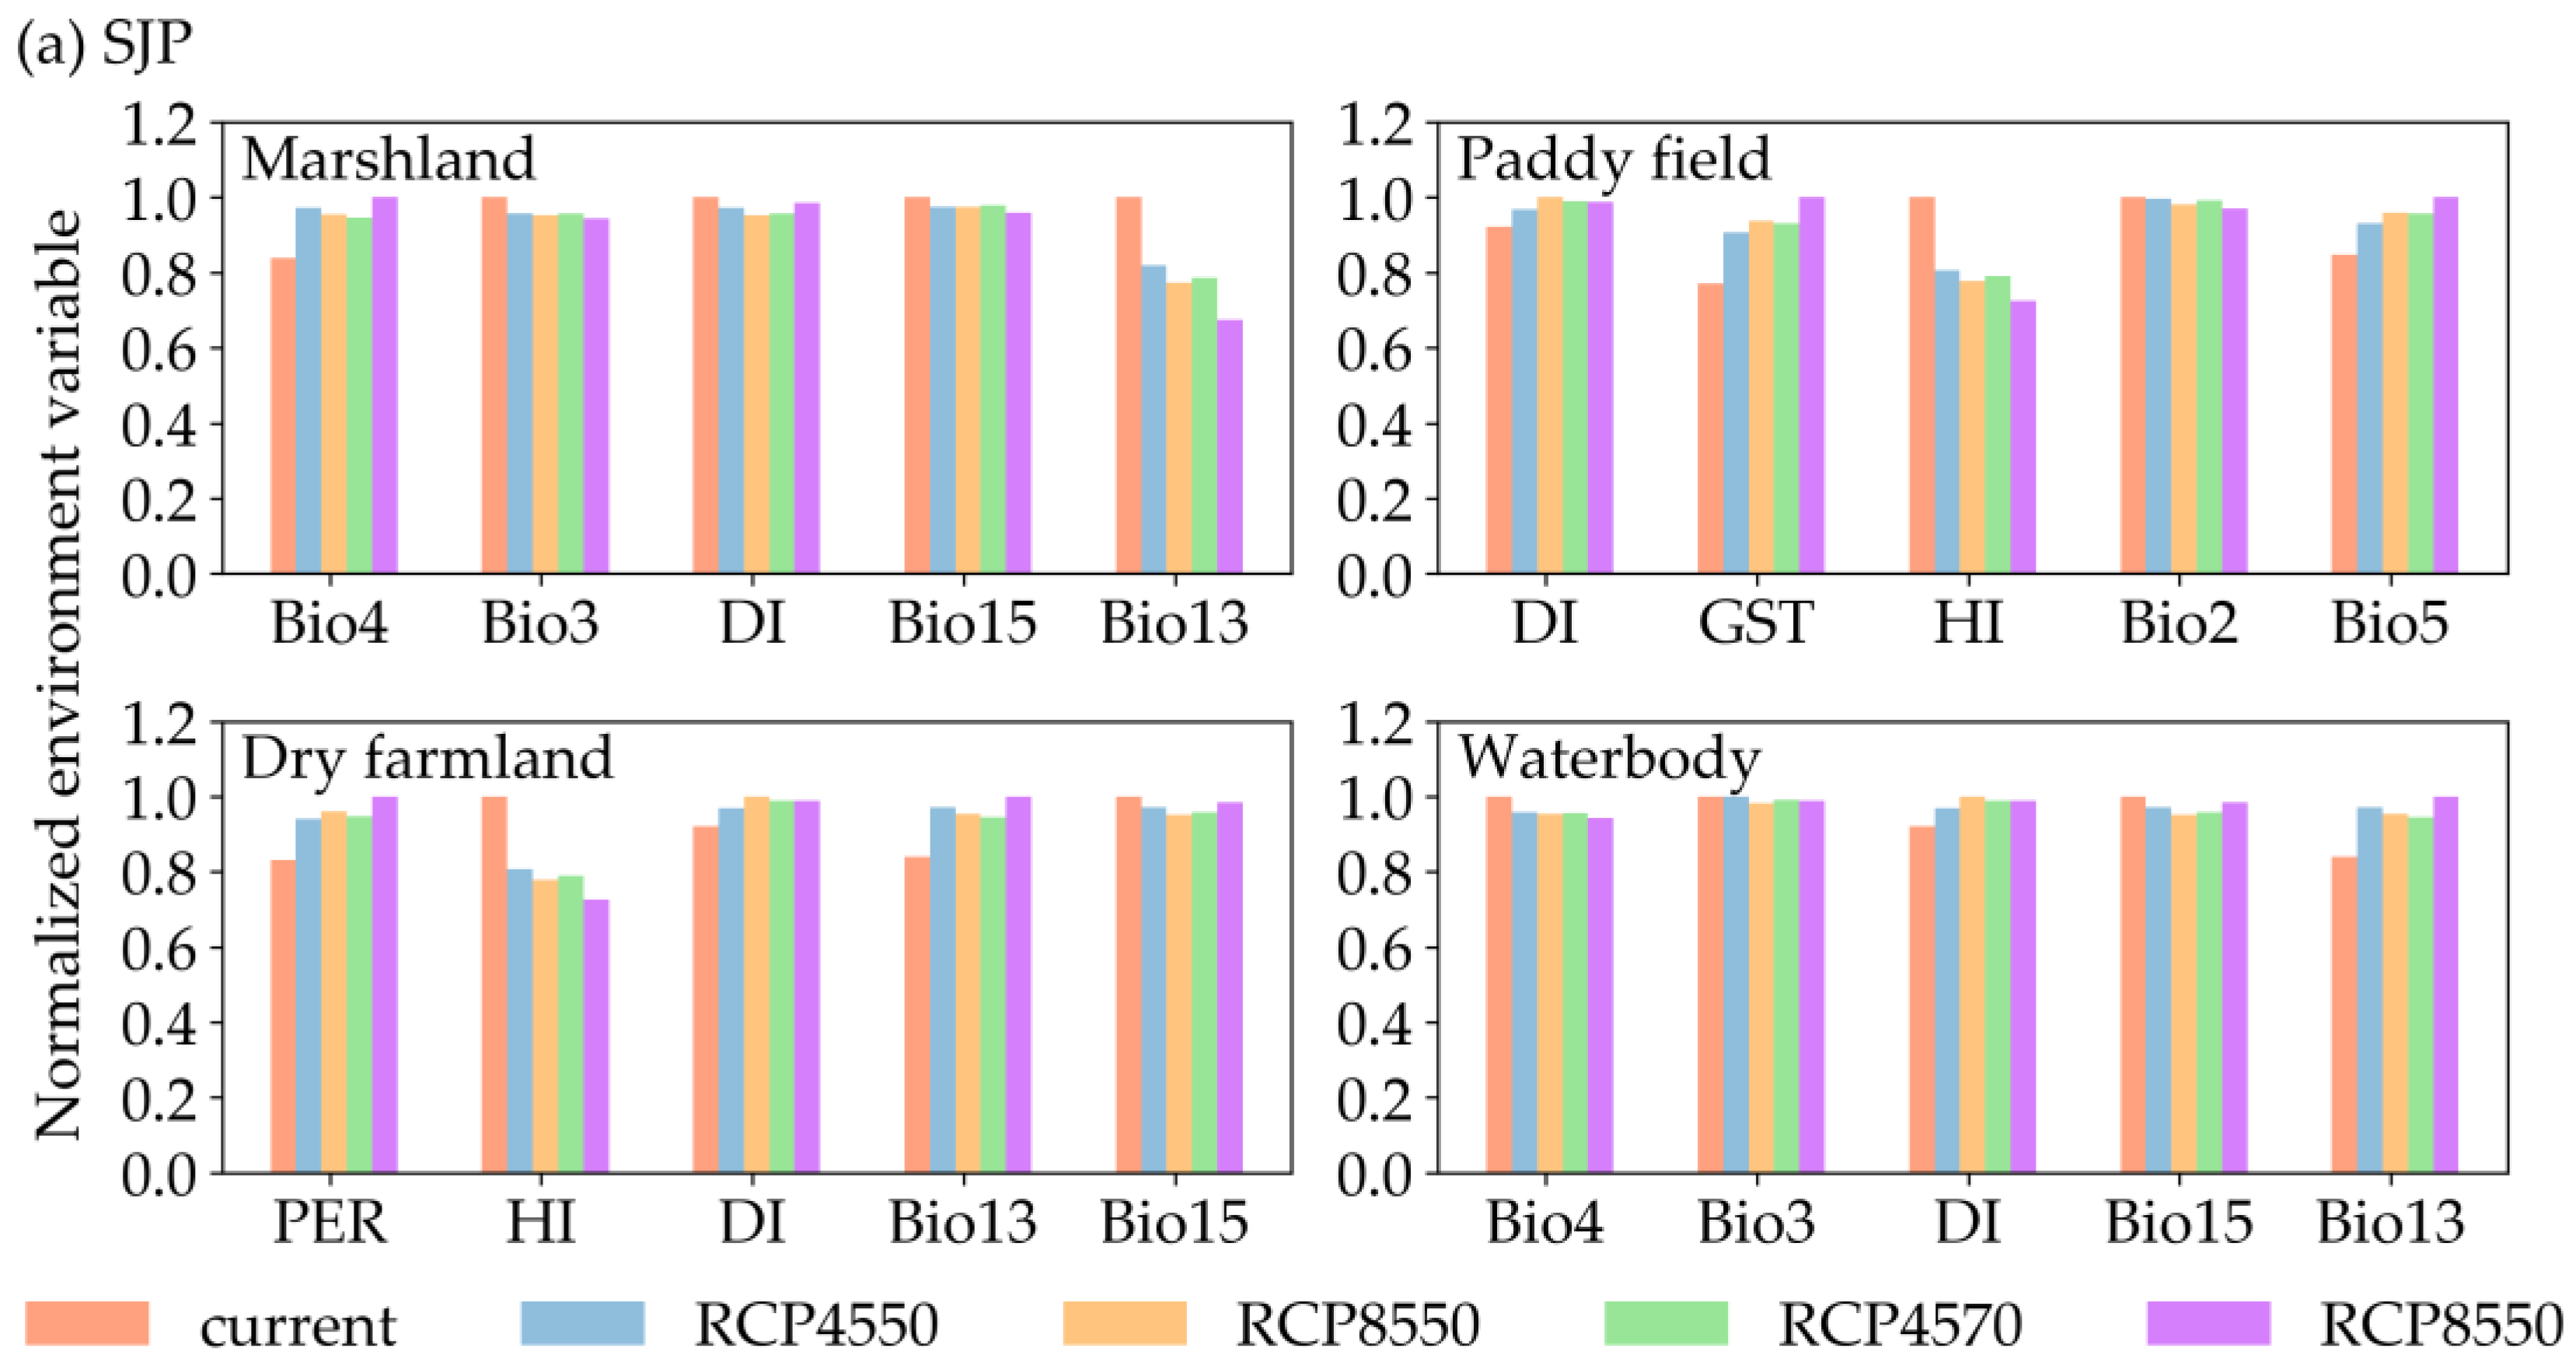
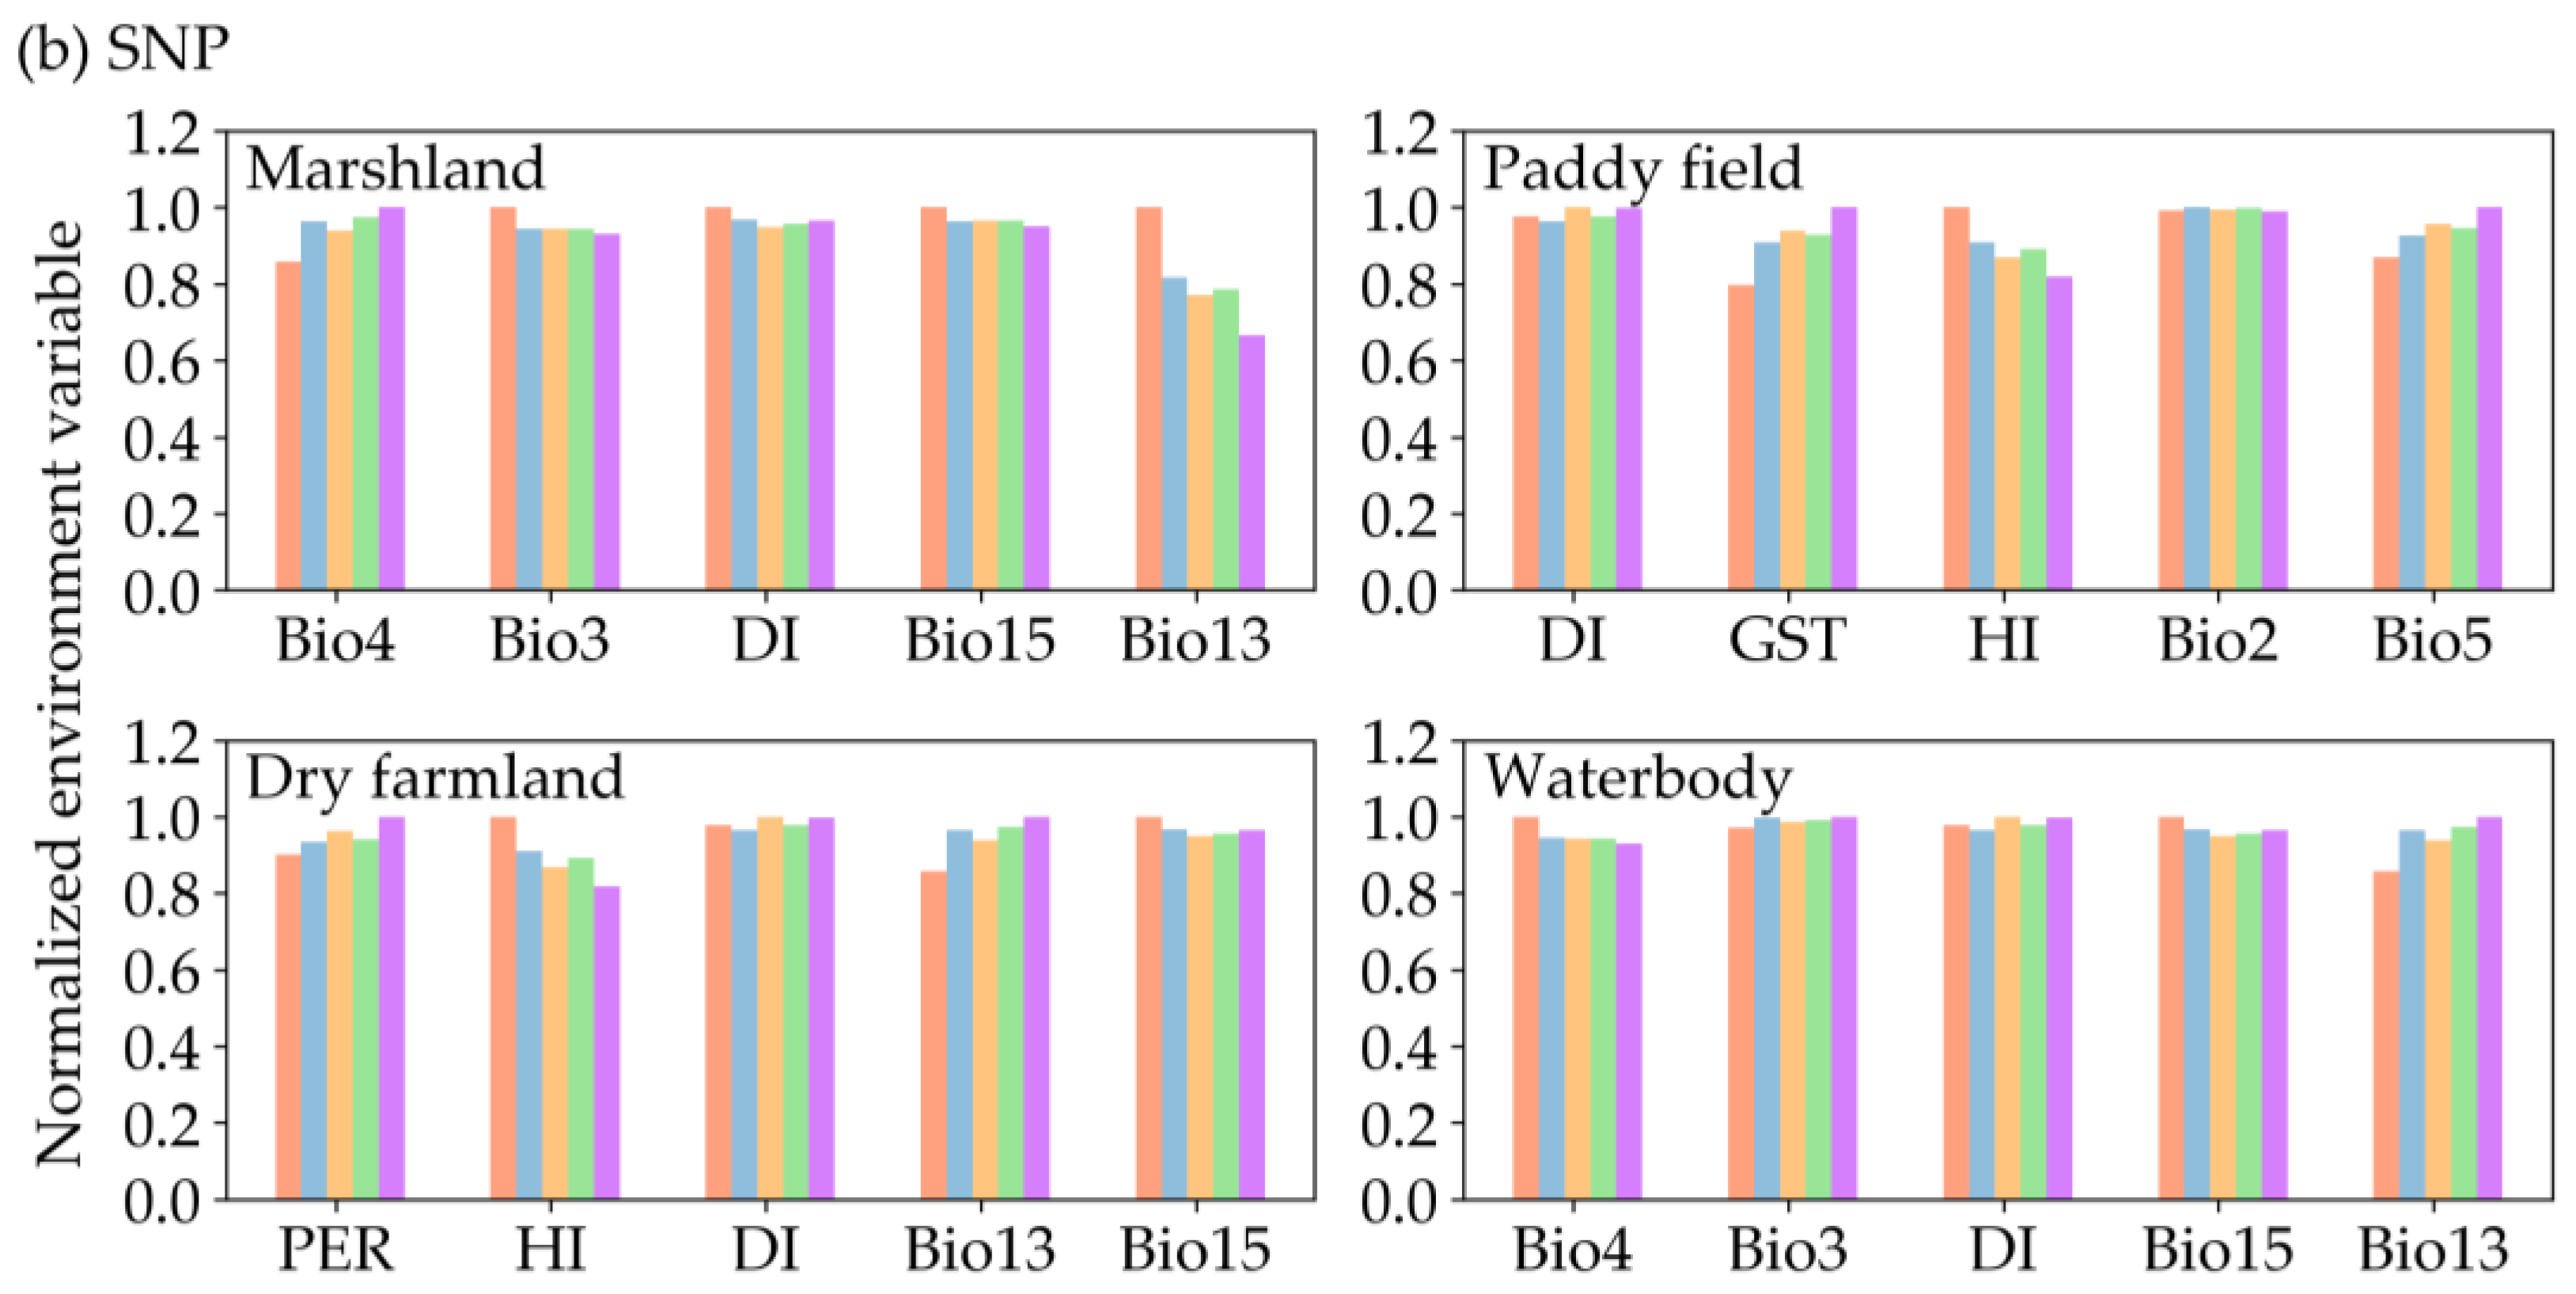
3.3. Maxent Modeling Performance and Sensitivity of Environment Variables
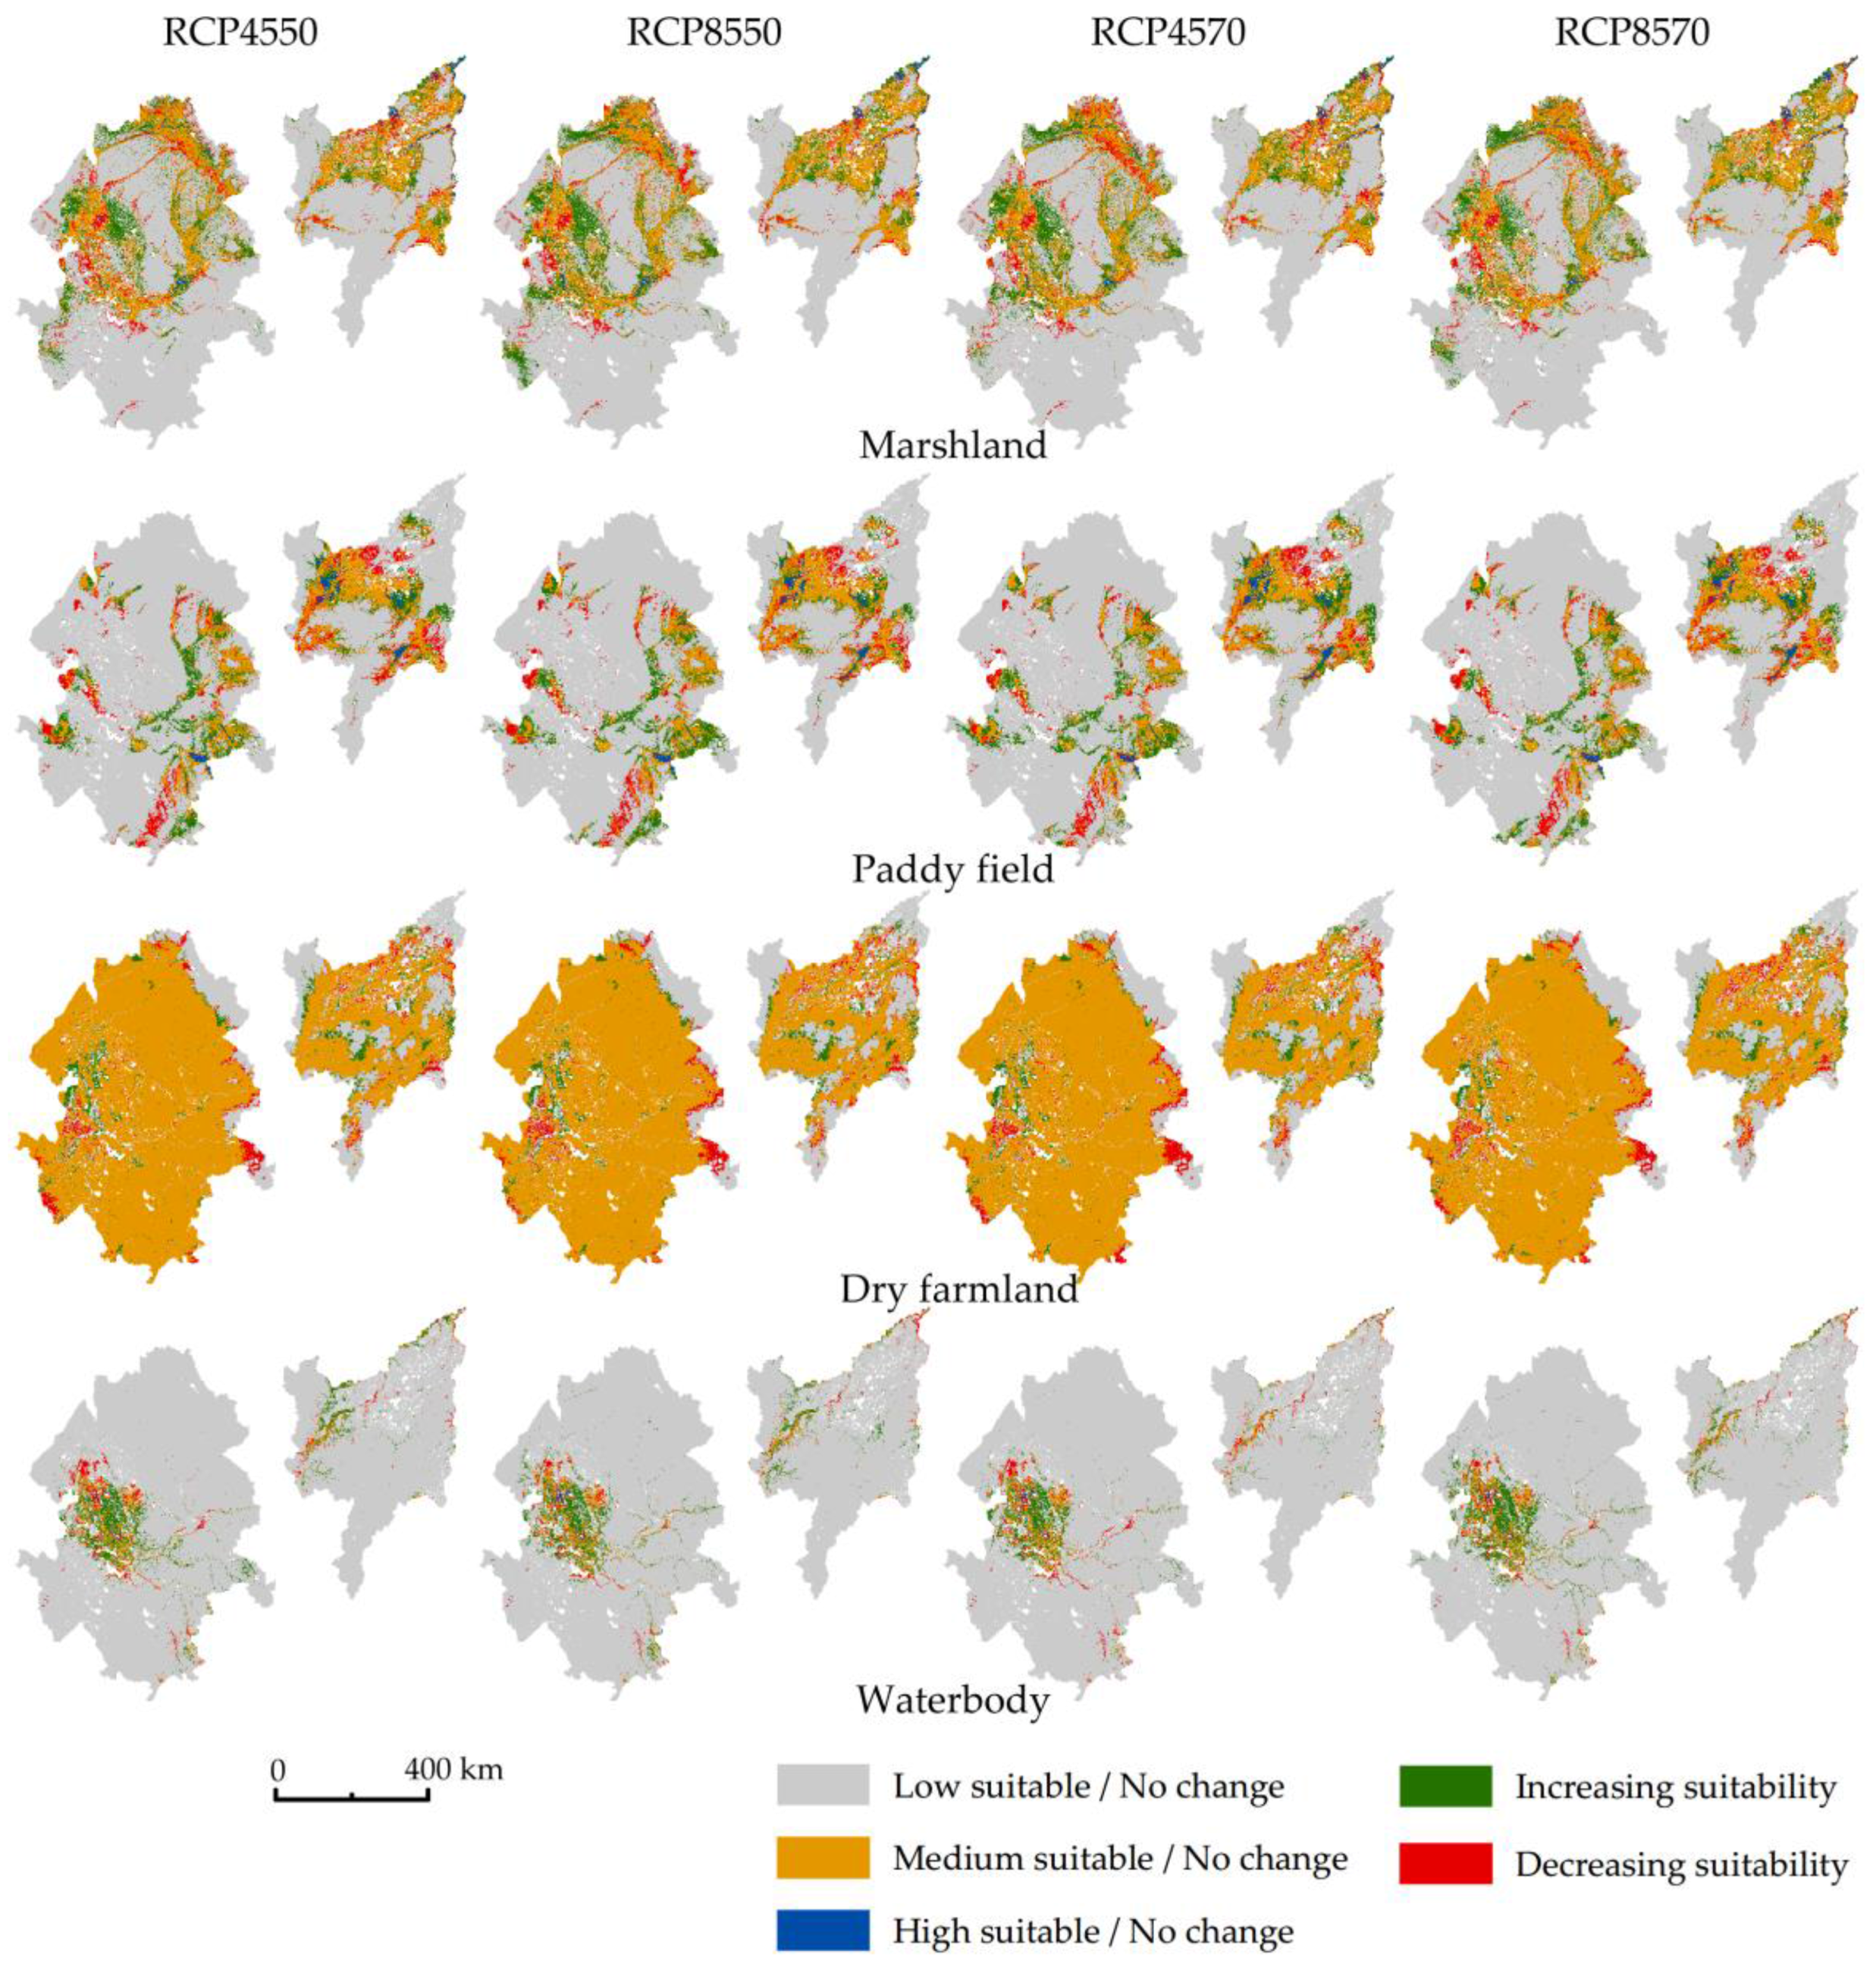
3.4. How the Predicted Climate Change Scenarios Will Spatially and Temporally Impact Wetlands and Agriculture
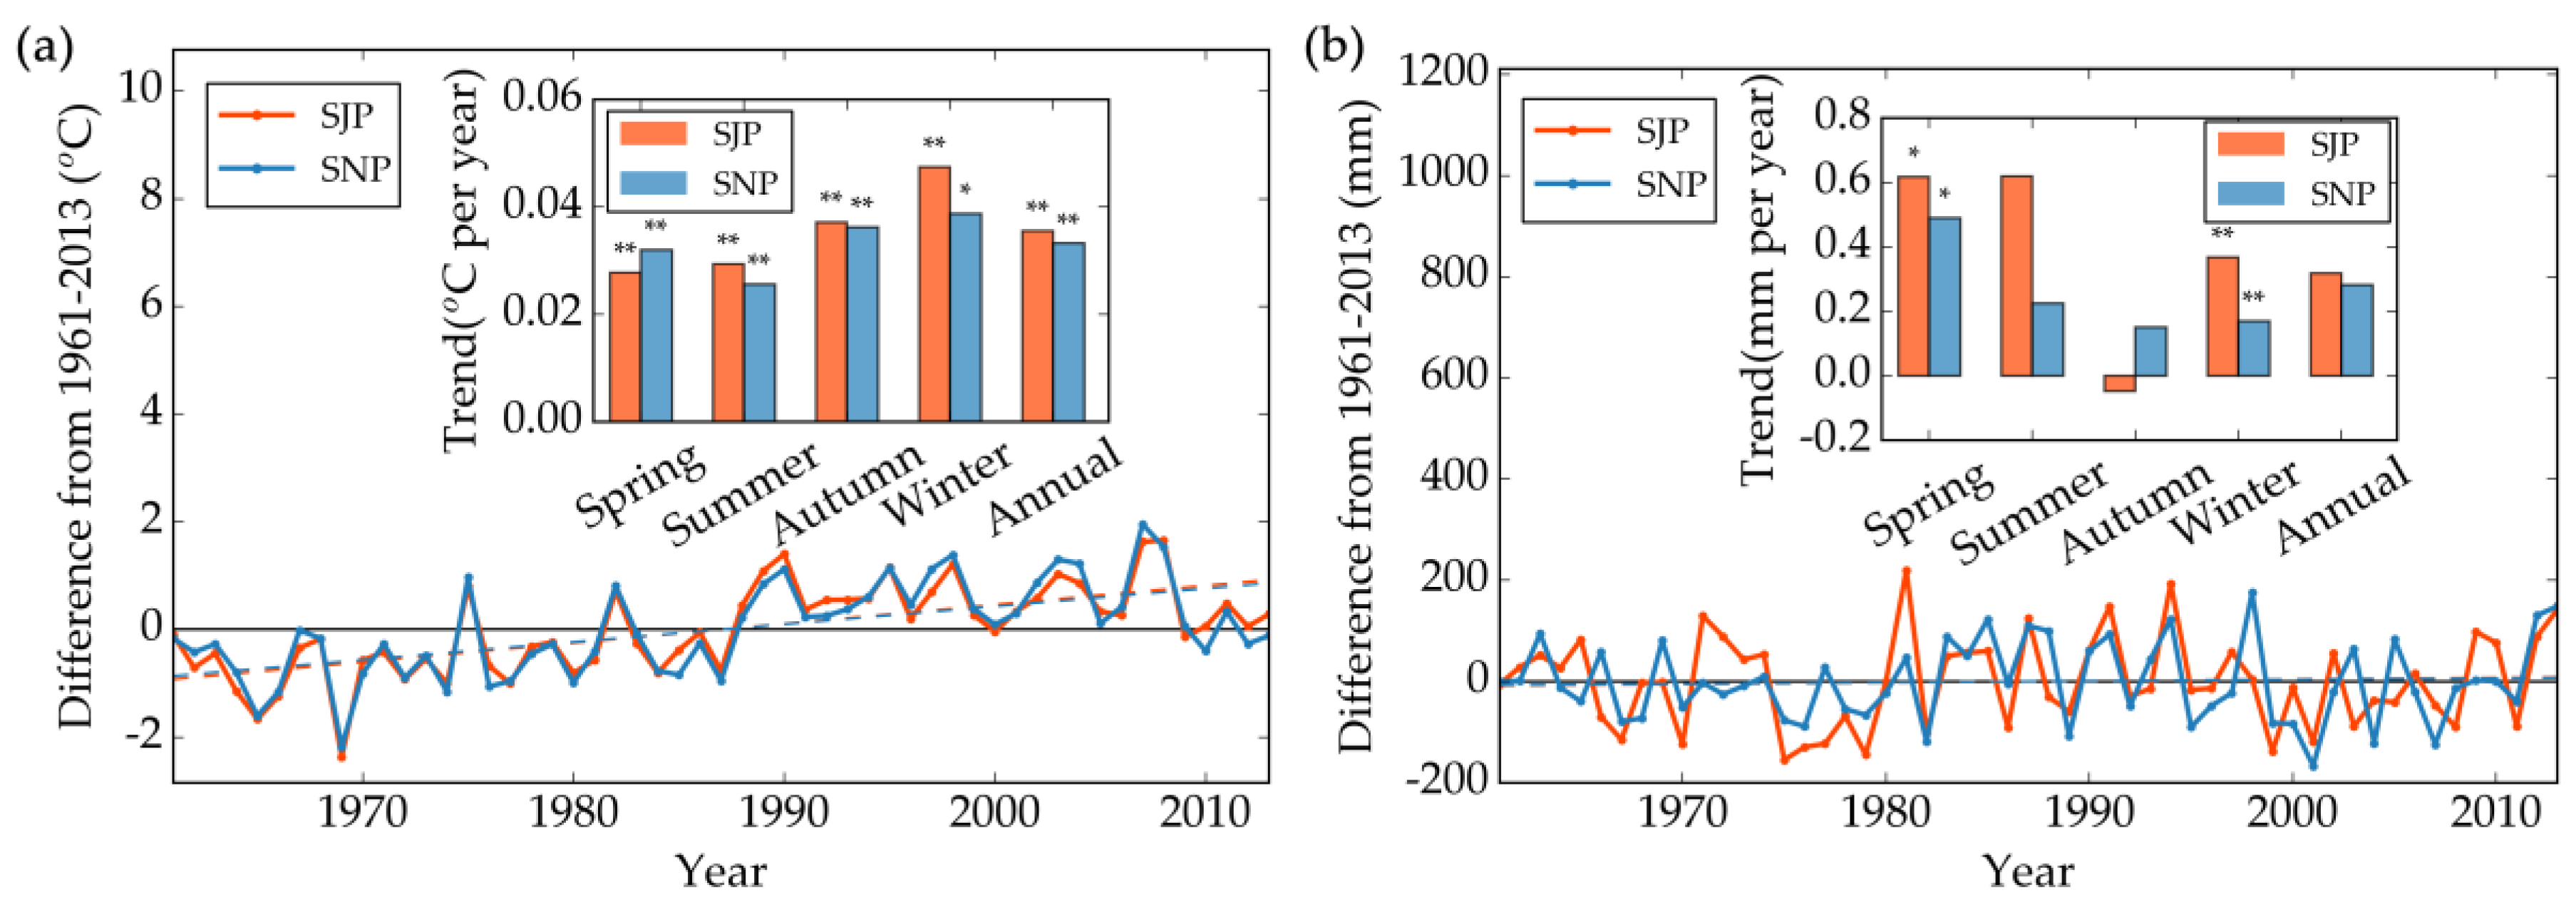
3.4.1. Historical Climate Changes and Scenarios for the Future of Wetlands and Agriculture
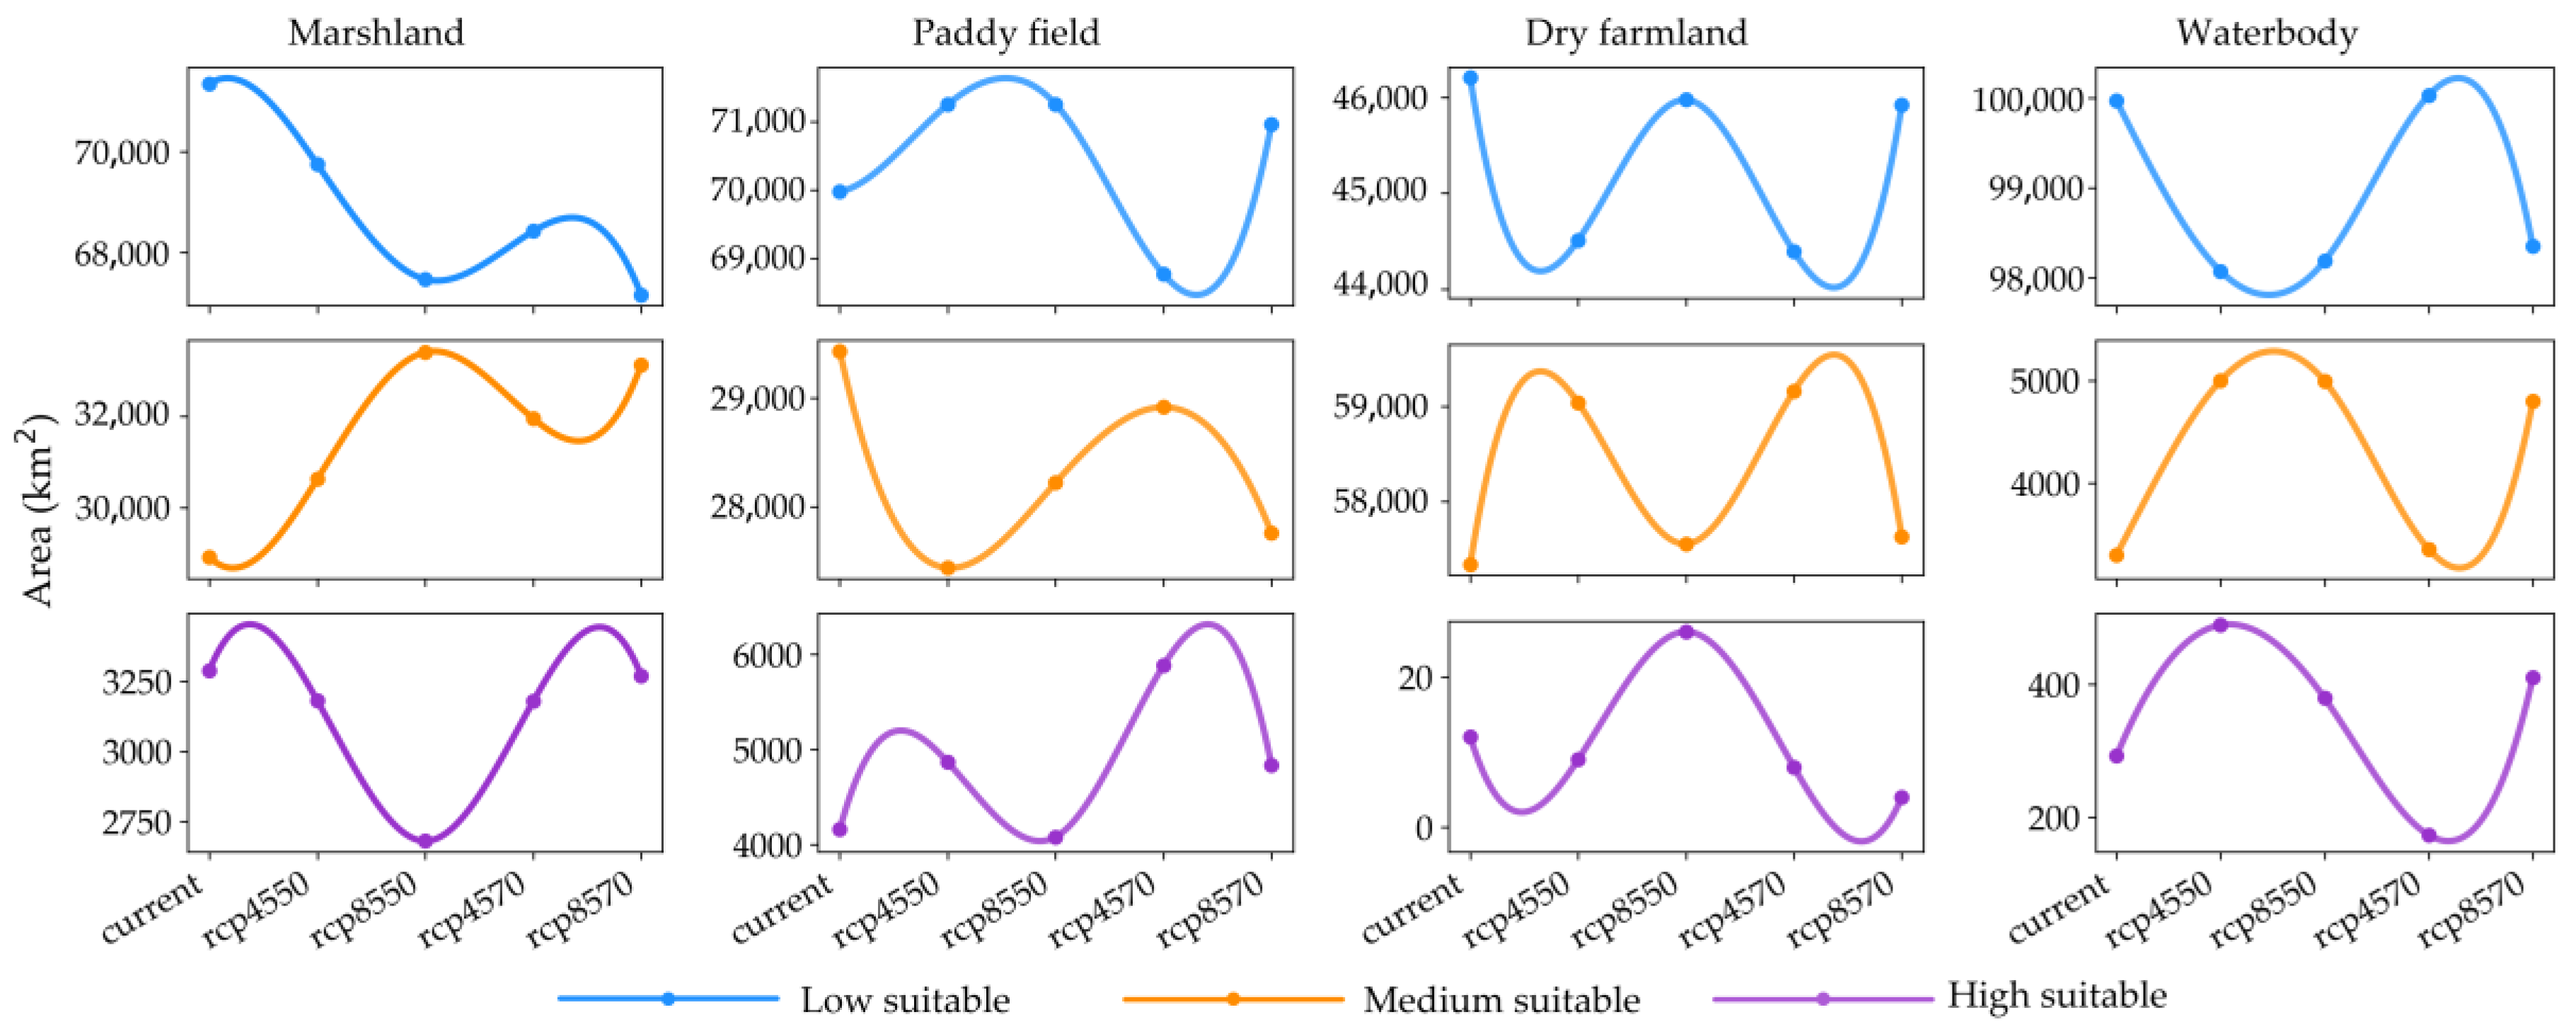
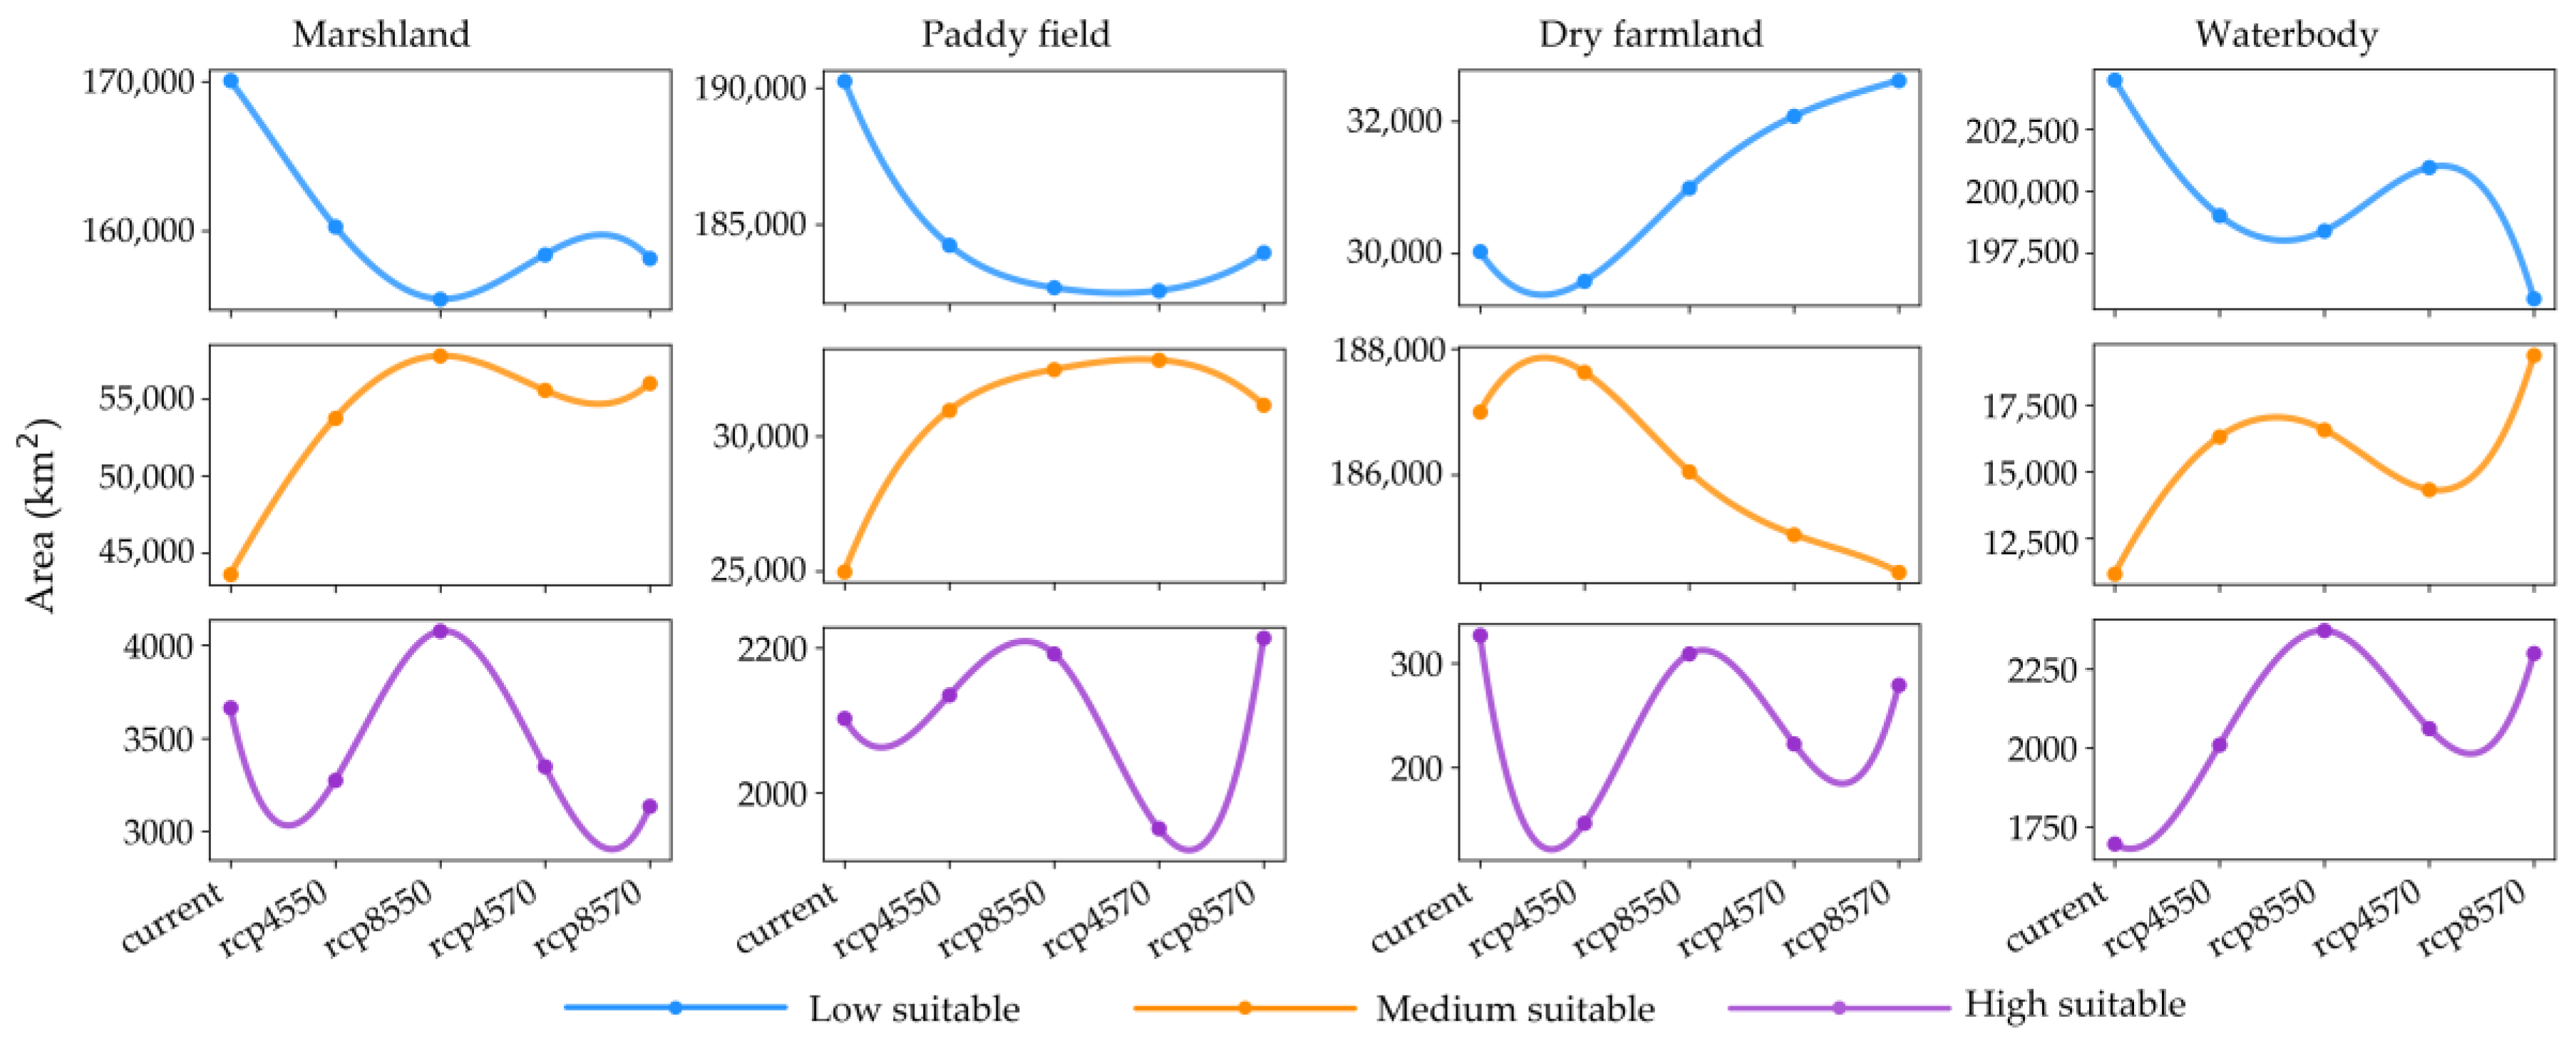
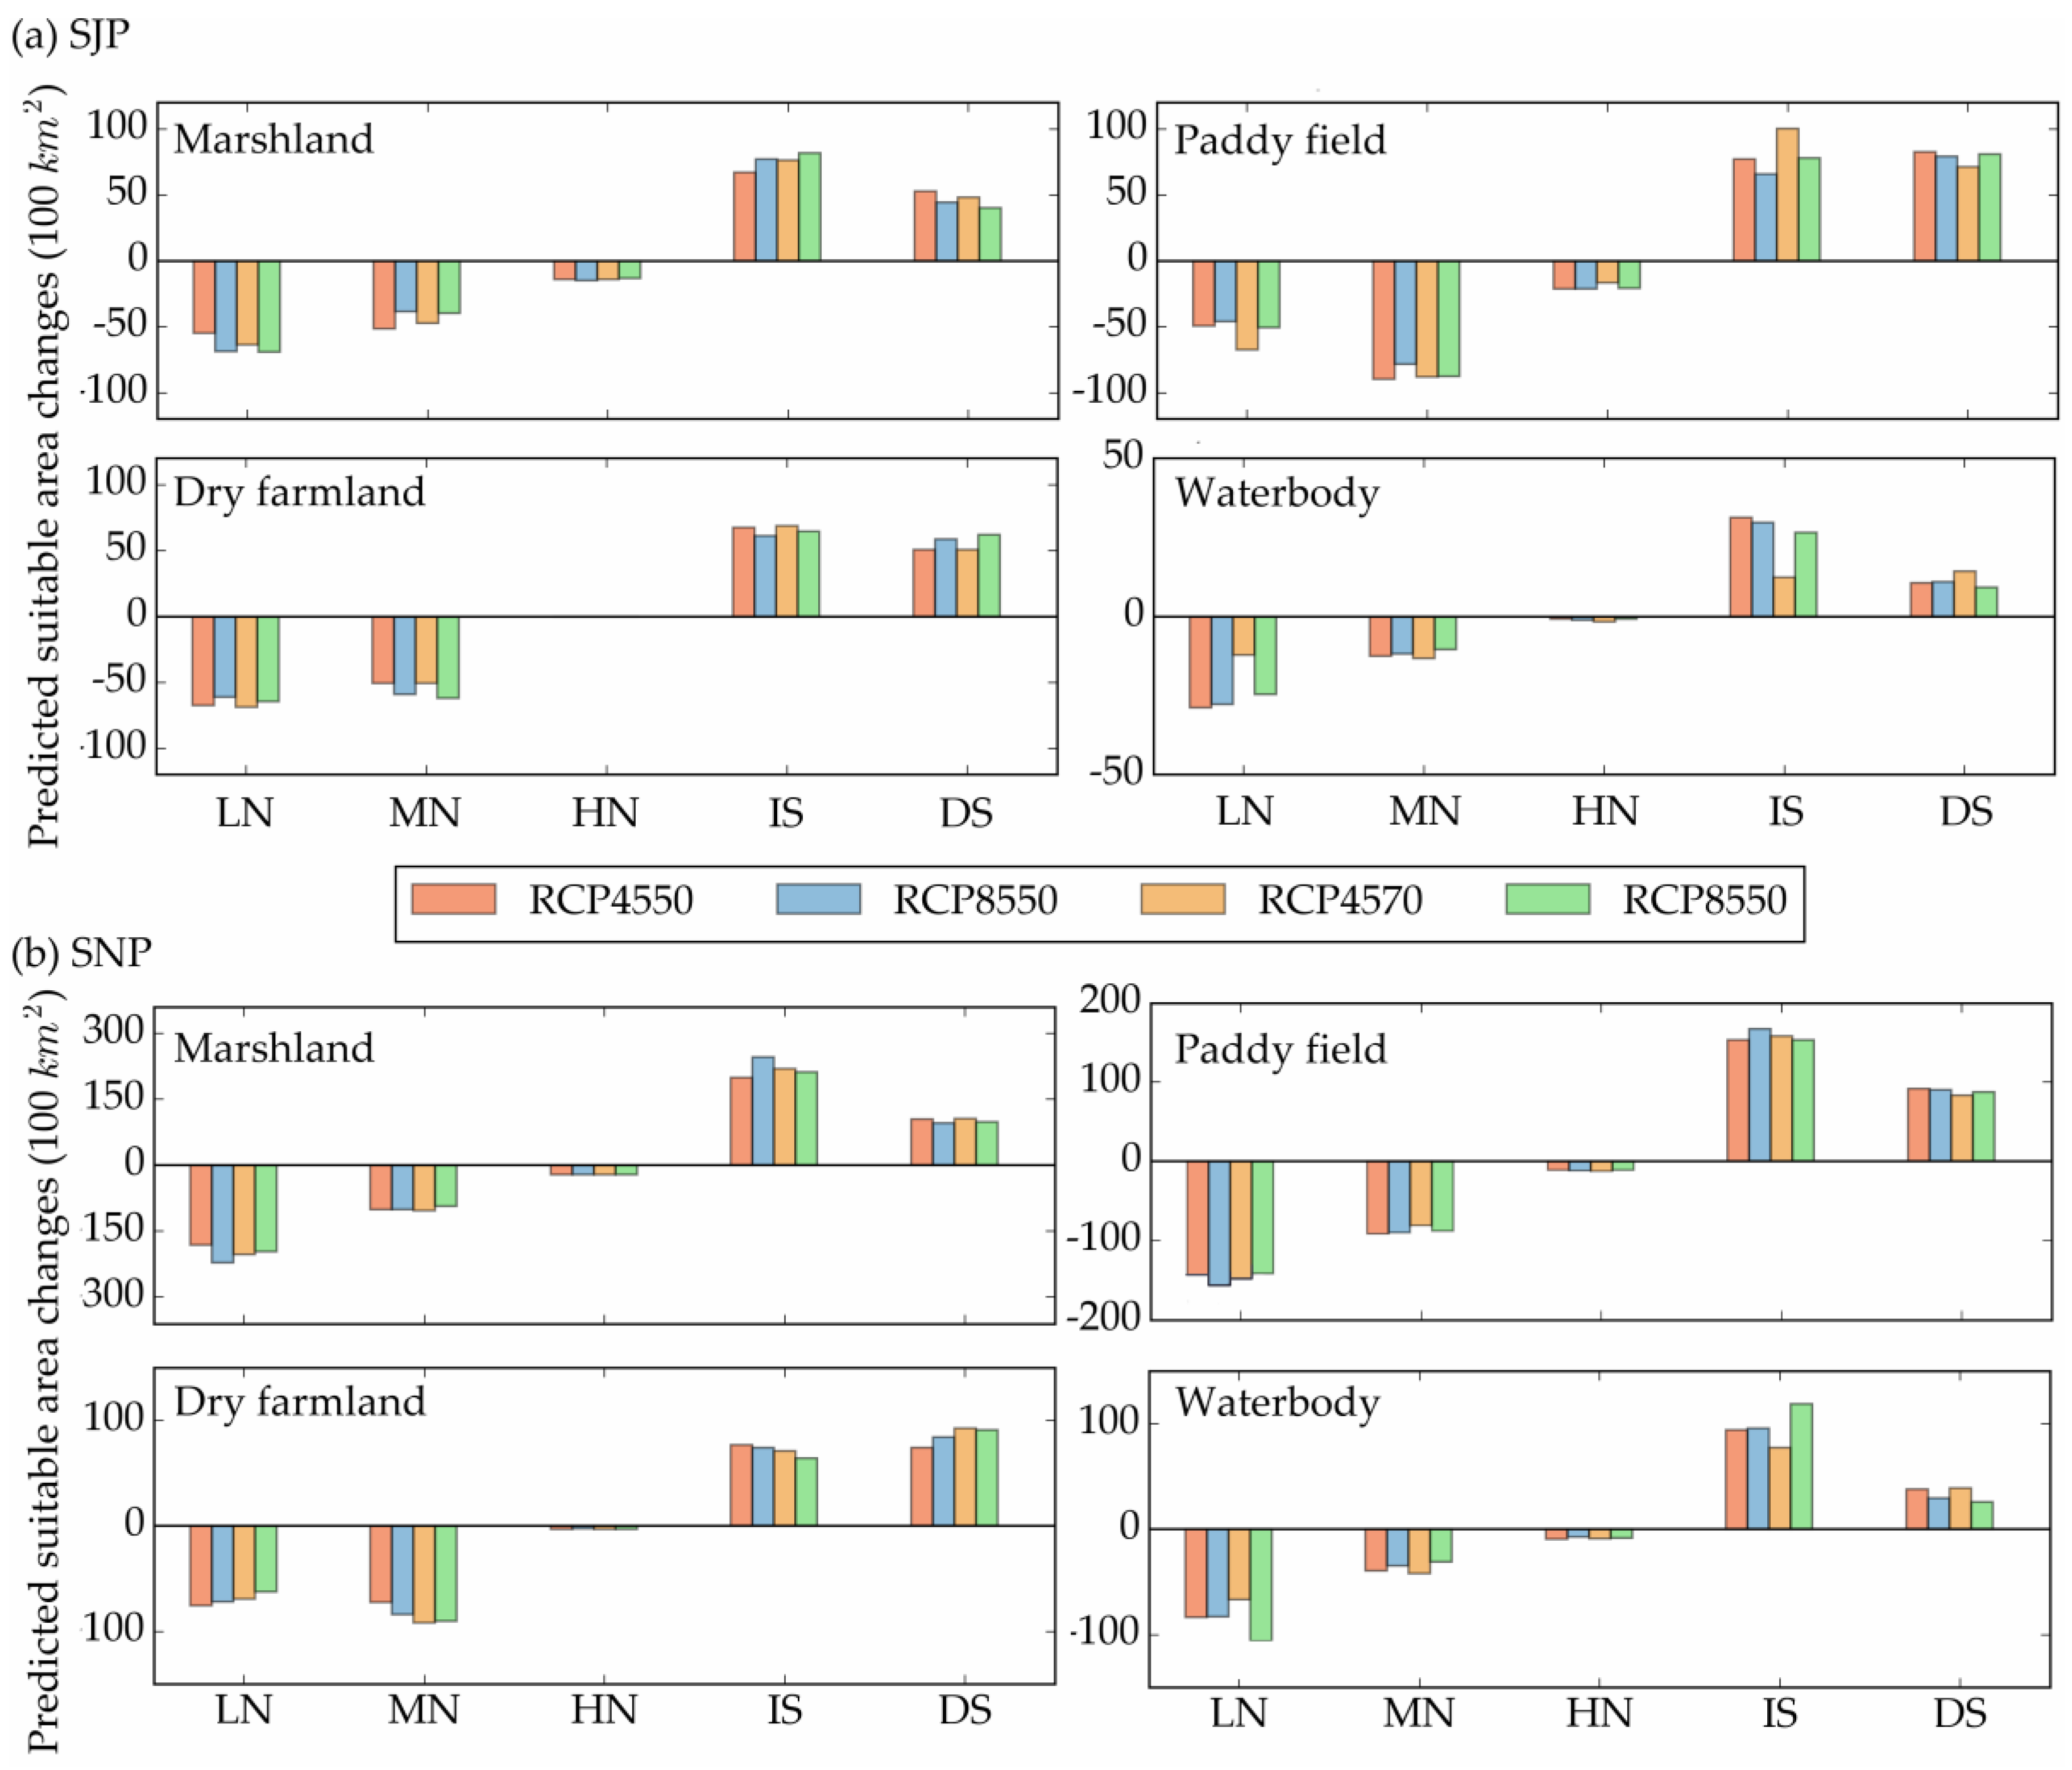
3.4.2. Predicted Wetlands and Agricultural Lands Suitability under Different Climatic Change Scenarios
4. Discussion
4.1. Processes of LULCC over the Two Plains and Their Driving Forces
4.2. Suitability Changes of Predicted Wetlands and Agricultural Lands Distributions under Future Climate Changes and Its Implications
4.3. Uncertainty Analysis
5. Conclusions
Supplementary Materials
Acknowledgments
Author Contributions
Conflicts of Interest
References
- Bullock, A.; Acreman, M. The role of wetlands in the hydrological cycle. Hydrol. Earth Syst. Sci. Discuss. 2003, 7, 358–389. [Google Scholar] [CrossRef]
- Costanza, R.; d’Arge, R.; De Groot, R.; Farber, S.; Grasso, M.; Hannon, B.; Limburg, K.; Naeem, S.; O’neill, R.V.; Paruelo, J. The value of the world’s ecosystem services and natural capital. Nature 1997, 387, 253–260. [Google Scholar] [CrossRef]
- Tiner, R.W. Wetland indicators: A guide to wetland identification. In Delineation, Classification, and Mapping; CRC Press: Boca Raton, FL, USA, 1999. [Google Scholar]
- Mitsch, W.J.; Gosselink, J.G. Wetlands. Hoboken; John Wiley & Sons, Inc.: New York, NY, USA, 2007. [Google Scholar]
- Bucher, E.H.; Bonetto, A.; Boyle, T.; Canevari, P.; Castro, G.; Huszar, P.; Stone, T. Hidrovia: An Initial Environmental Examination of the Paraguay-Parana Waterway; Humedales para las Américas: Buenos Aires, Argentina, 1993. [Google Scholar]
- Finlayson, M.; Cruz, R.; Davidson, N.; Alder, J.; Cork, S.; de Groot, R.; Lévêque, C.; Milton, G.; Peterson, G.; Pritchard, D. Millennium Ecosystem Assessment: Ecosystems and Human Well-Being: Wetlands and Water Synthesis; Island Press: Washington, DC, USA, 2005. [Google Scholar]
- Davidson, N.C. How much wetland has the world lost? Long-term and recent trends in global wetland area. Mar. Freshw. Res. 2014, 65, 936–941. [Google Scholar] [CrossRef]
- Gardner, R.C.; Barchiesi, S.; Beltrame, C.; Finlayson, C.M.; Galewski, T.; Harrison, I.; Paganini, M.; Perennou, C.; Pritchard, D.; Rosenqvist, A. State of the world’s wetlands and their services to people: A compilation of recent analyses. Soc. Sci. Electr. Publ. 2015. [Google Scholar] [CrossRef]
- Avis, C.A.; Weaver, A.J.; Meissner, K.J. Reduction in areal extent of high-latitude wetlands in response to permafrost thaw. Nat. Geosci. 2011, 4, 444–448. [Google Scholar] [CrossRef]
- Asselen, S.V.; Verburg, P.H.; Vermaat, J.E.; Janse, J.H. Drivers of wetland conversion: A global meta-analysis. PLoS ONE 2013, 8, e81292. [Google Scholar] [CrossRef] [PubMed]
- Erwin, K.L. Wetlands and global climate change: The role of wetland restoration in a changing world. Wetl. Ecol. Manag. 2009, 17. [Google Scholar] [CrossRef]
- Vitousek, P.M.; Mooney, H.A.; Lubchenco, J.; Melillo, J.M. Human domination of earth’s ecosystems. Science 1997, 277, 494–499. [Google Scholar] [CrossRef]
- FAOSTAT. Online Statistical Service. Food and Agriculture Organization of the United Nations, Rome 2009. Available online: http://www.fao.org/faostat/en/home (accessed on 30 November 2017).
- Luo, G.; Zhou, C.; Chen, X.; Li, Y. A methodology of characterizing status and trend of land changes in oases: A case study of sangong river watershed, Xinjiang, China. J. Environ. Manag. 2008, 88, 775–783. [Google Scholar] [CrossRef] [PubMed]
- Foley, J.A.; DeFries, R.; Asner, G.P.; Barford, C.; Bonan, G.; Carpenter, S.R.; Chapin, F.S.; Coe, M.T.; Daily, G.C.; Gibbs, H.K. Global consequences of land use. Science 2005, 309, 570–574. [Google Scholar] [CrossRef] [PubMed]
- Parker, D.C.; Manson, S.M.; Janssen, M.A.; Hoffmann, M.J.; Deadman, P. Multi-agent systems for the simulation of land-use and land-cover change: A review. Ann. Assoc. Am. Geogr. 2003, 93, 314–337. [Google Scholar] [CrossRef]
- Bradley, B.A.; Mustard, J.F. Identifying land cover variability distinct from land cover change: Cheatgrass in the great basin. Remote Sens. Environ. 2005, 94, 204–213. [Google Scholar] [CrossRef]
- Song, K.; Wang, Z.; Li, L.; Tedesco, L.; Li, F.; Jin, C.; Du, J. Wetlands shrinkage, fragmentation and their links to agriculture in the muleng-xingkai plain, China. J. Environ. Manag. 2012, 111, 120–132. [Google Scholar] [CrossRef] [PubMed]
- Zhao, R.; Chen, Y.; Shi, P.; Zhang, L.; Pan, J.; Zhao, H. Land use and land cover change and driving mechanism in the arid inland river basin: A case study of tarim river, Xinjiang, China. Environ. Earth Sci. 2013, 68, 591–604. [Google Scholar] [CrossRef]
- Tiner, R.W.; Lang, M.W.; Klemas, V.V. Remote Sensing of Wetlands: Applications and Advances; CRC Press: Boca Raton, FL, USA, 2015. [Google Scholar]
- Hoorn, C.; Wesselingh, F.; ter Steege, H.; Bermudez, M.; Mora, A.; Sevink, J.; Sanmartín, I.; Sanchez-Meseguer, A.; Anderson, C.; Figueiredo, J. Amazonia through time: Andean uplift, climate change, landscape evolution, and biodiversity. Science 2010, 330, 927–931. [Google Scholar] [CrossRef] [PubMed] [Green Version]
- Liu, X.; Dong, G.; Wang, X.; Xue, Z.; Jiang, M.; Lu, X.; Zhang, Y. Characterizing the spatial pattern of marshlands in the Sanjiang plain, northeast China. Ecol. Eng. 2013, 53, 335–342. [Google Scholar] [CrossRef]
- Yan, F.; Zhang, S.; Liu, X.; Chen, D.; Chen, J.; Bu, K.; Yang, J.; Chang, L. The effects of spatiotemporal changes in land degradation on ecosystem services values in Sanjiang plain, China. Remote Sens. 2016, 8, 917. [Google Scholar] [CrossRef]
- Junk, W.J.; An, S.; Finlayson, C.M.; Gopal, B.; Květ, J.; Mitchell, S.A.; Mitsch, W.J.; Robarts, R.D. Current state of knowledge regarding the world’s wetlands and their future under global climate change: A synthesis. Aquat. Sci. 2013, 75, 151–167. [Google Scholar] [CrossRef]
- Mao, D.; Wang, Z.; Li, L.; Song, K.; Jia, M. Quantitative assessment of human-induced impacts on marshes in northeast China from 2000 to 2011. Ecol. Eng. 2014, 68, 97–104. [Google Scholar] [CrossRef]
- Yan, F.; Zhang, S.; Liu, X.; Yu, L.; Chen, D.; Yang, J.; Yang, C.; Bu, K.; Chang, L. Monitoring spatiotemporal changes of marshes in the Sanjiang plain, China. Ecol. Eng. 2017, 104, 184–194. [Google Scholar] [CrossRef]
- Liu, D.; Wang, Z.; Song, K.; Zhang, B.; Hu, L.; Huang, N.; Zhang, S.; Luo, L.; Zhang, C.; Jiang, G. Land use/cover changes and environmental consequences in songnen plain, northeast China. Chin. Geogr. Sci. 2009, 19, 299–305. [Google Scholar] [CrossRef]
- Dan, W.; Wei, H.; Zhang, S.; Bu, K.; Bao, X.; Yi, W.; Yue, L. Processes and prediction of land use/land cover changes (lucc) driven by farm construction: The case of naoli river basin in Sanjiang plain. Environ. Earth Sci. 2015, 73, 4841–4851. [Google Scholar] [CrossRef]
- Intergovernmental Panel on Climate Change (IPCC). Managing the Risks of Extreme Events and Disasters to Advance Climate Change Adaptation; A special report of the intergovernmental panel on climate change; Field, C., Barros, V., Stocker, T., Qin, D., Dokken, D., Ebi, K., Mastrandrea, M.D., Mach, K.J., Plattner, G.-K., Allen, S.K., et al., Eds.; Cambridge University Press: Cambridge, UK; New York, NY, USA, 2012. [Google Scholar]
- Shilong, P.; Ciais, P.; Yao, H.; Shen, Z.H.; Peng, S.S.; Li, J.S.; Zhou, L.P.; Liu, H.Y.; Ma, Y.C.; Ding, Y.H. The impacts of climate change on water resources and agriculture in China. Nature 2010, 467, 43–51. [Google Scholar]
- Zhang, B.; Song, X.; Zhang, Y.; Han, D.; Tang, C.; Yu, Y.; Ma, Y. Hydrochemical characteristics and water quality assessment of surface water and groundwater in songnen plain, northeast China. Water Res. 2012, 46, 2737–2748. [Google Scholar] [CrossRef] [PubMed]
- Ramsar, C. The List of Wetlands of International Importance; RAMSAR Secretariat: Gland, Switzerland, 2004. [Google Scholar]
- Yao, H.; Sun, W.; Wen, Z.; Yongqiang, Y.U.; Yanhua, S.U.; Song, C. Marshland conversion to cropland in northeast China from 1950 to 2000 reduced the greenhouse effect. Glob. Chang. Biol. 2010, 16, 680–695. [Google Scholar]
- Wang, Z.; Huang, N.; Luo, L.; Li, X.; Ren, C.; Song, K.; Chen, J.M. Shrinkage and fragmentation of marshes in the west songnen plain, China, from 1954 to 2008 and its possible causes. Int. J. Appl. Earth Obs. Geoinf. 2011, 13, 477–486. [Google Scholar] [CrossRef]
- Wang, Z.; Song, K.; Ma, W.; Ren, C.; Zhang, B.; Liu, D.; Chen, J.M.; Song, C. Loss and fragmentation of marshes in the Sanjiang plain, northeast China, 1954–2005. Wetlands 2011, 31, 945. [Google Scholar] [CrossRef]
- Wang, X.; Zhang, G.; Xu, Y.J.; Sun, G. Identifying the regional-scale groundwater-surface water interaction on the Sanjiang plain, northeast China. Environ. Sci. Pollut. Res. 2015, 22, 16951–16961. [Google Scholar] [CrossRef] [PubMed]
- Ding, Y.; Ren, G.; Zhao, Z.; Xu, Y.; Luo, Y.; Li, Q.; Zhang, J. Detection, causes and projection of climate change over China: An overview of recent progress. Adv. Atmos. Sci. 2007, 24, 954–971. [Google Scholar] [CrossRef]
- Li, T.; Huang, Y.; Zhang, W.; Yu, Y.Q. Methane emissions associated with the conversion of marshland to cropland and climate change on the Sanjiang plain of northeast China from 1950 to 2100. Biogeosciences 2012, 9, 5887–5927. [Google Scholar] [CrossRef]
- Lu, D.; Li, G.; Moran, E.; Hetrick, S. Spatiotemporal analysis of land use and land cover change in the brazilian amazon. Int. J. Remote Sens. 2013, 34, 5953–5978. [Google Scholar] [CrossRef] [PubMed]
- Rgjr, P.; Shusas, E.; Mceachern, M. Detecting important categorical land changes while accounting for persistence. Agric. Ecosyst. Environ. 2004, 101, 251–268. [Google Scholar]
- Li, X.Y.; Ma, Y.J.; Xu, H.Y.; Wang, J.H.; Zhang, D.S. Impact of land use and land cover change on environmental degradation in lake qinghai watershed, northeast qinghai-tibet plateau. Land Degrad. Dev. 2010, 20, 69–83. [Google Scholar] [CrossRef]
- Zhou, Q.; Li, B.; Kurban, A. Trajectory analysis of land cover change in arid environment of China. Int. J. Remote Sens. 2008, 29, 1093–1107. [Google Scholar] [CrossRef]
- Mertens, B.; Lambin, E.F. Land-cover-change trajectories in southern cameroon. Ann. Assoc. Am. Geogr. 2000, 90, 467–494. [Google Scholar] [CrossRef]
- Wang, D.; Gong, J.; Chen, L.; Zhang, L.; Song, Y.; Yue, Y. Spatio-temporal pattern analysis of land use/cover change trajectories in xihe watershed. Int. J. Appl. Earth Obs. Geoinf. 2012, 14, 12–21. [Google Scholar] [CrossRef]
- Phillips, S.J.; Anderson, R.P.; Schapire, R.E. Maximum entropy modeling of species geographic distributions. Ecol. Model. 2006, 190, 231–259. [Google Scholar] [CrossRef]
- Evangelista, P.; Young, N.; Burnett, J. How will climate change spatially affect agriculture production in ethiopia? Case studies of important cereal crops. Clim. Chang. 2013, 119, 855–873. [Google Scholar] [CrossRef]
- Hunter, E.A.; Raney, P.A.; Gibbs, J.P.; Leopold, D.J. Improving wetland mitigation site identification through community distribution modeling and a patch-based ranking scheme. Wetlands 2012, 32, 841–850. [Google Scholar] [CrossRef]
- Kutywayo, D.; Chemura, A.; Kusena, W.; Chidoko, P.; Mahoya, C. The impact of climate change on the potential distribution of agricultural pests: The case of the coffee white stem borer (Monochamus leuconotus p.) in zimbabwe. PLoS ONE 2013, 8, e73432. [Google Scholar] [CrossRef] [PubMed]
- Liu, H.; Bu, R.; Liu, J.; Leng, W.; Hu, Y.; Yang, L.; Liu, H. Predicting the wetland distributions under climate warming in the great xing’an mountains, northeastern China. Ecol. Res. 2011, 26, 605–613. [Google Scholar] [CrossRef]
- Xue, Z.; Zhang, Z.; Lu, X.; Zou, Y.; Lu, Y.; Jiang, M.; Tong, S.; Zhang, K. Predicted areas of potential distributions of alpine wetlands under different scenarios in the qinghai-tibetan plateau, China. Glob. Planet. Chang. 2014, 123, 77–85. [Google Scholar] [CrossRef]
- Thuiller, W. Patterns and uncertainties of species’ range shifts under climate change. Glob. Chang. Biol. 2004, 10, 2020–2027. [Google Scholar] [CrossRef]
- Allouche, O.; Tsoar, A.; Kadmon, R. Assessing the accuracy of species distribution models: Prevalence, kappa and the true skill statistic (tss). J. Appl. Ecol. 2006, 43, 1223–1232. [Google Scholar] [CrossRef]
- Swets, J.A. Measuring the accuracy of diagnostic systems. Science 1988, 240, 1285–1293. [Google Scholar] [CrossRef] [PubMed]
- Tukey, J.W. Bias and confidence in not-quite large samples. Ann. Math. Stat. 1958, 29, 614. [Google Scholar]
- Intergovernmental Panel on Climate Change (IPCC). Climate change 2013: The Physical Science Basis. Contribution of Working Group i to the Fifth Assessment Report of the Intergovernmental Panel on Climate Change; Stocker, T.F., Qin, D., Plattner, G.-K., Tignor, M., Allen, S.K., Boschung, J., Nauels, A., Xia, Y., Bex, B., Midgley, B., et al., Eds.; Cambridge University Press: Cambridge, UK; New York, NY, USA, 2013. [Google Scholar]
- Liu, J.; Liu, M.; Tian, H.; Zhuang, D.; Zhang, Z.; Zhang, W.; Tang, X.; Deng, X. Spatial and temporal patterns of China’s cropland during 1990–2000: An analysis based on landsat tm data. Remote Sens. Environ. 2005, 98, 442–456. [Google Scholar] [CrossRef]
- Liu, J.; Liu, M.; Deng, X.; Zhuang, D.; Zhang, Z.; Luo, D. The land use and land cover change database and its relative studies in China. J. Geogr. Sci. 2002, 12, 275–282. [Google Scholar]
- Keddy, P.A. Wetland Ecology: Principles and Conservation; Cambridge University Press: Cambridge, UK; New York, NY, USA, 2000; pp. 683–685. [Google Scholar]
- Hijmans, R.J.; Cameron, S.E.; Parra, J.L.; Jones, P.G.; Jarvis, A. Very high resolution interpolated climate surfaces for global land areas. Int. J. Climatol. 2005, 25, 1965–1978. [Google Scholar] [CrossRef]
- Fick, S.E.; Hijmans, R.J. Worldclim 2: New 1-km spatial resolution climate surfaces for global land areas. Int. J. Climatol. 2017, 37, 4302–4315. [Google Scholar] [CrossRef]
- Holdridge, L.R. Determination of world plant formations from simple climatic data. Science 1947, 105, 367. [Google Scholar] [CrossRef] [PubMed]
- Kira, T. On the altitudinal arrangement of climatic zone in japan. Kanti Nogaku 1948, 2, 143–173. [Google Scholar]
- Kira, T. Forest ecosystems of east and southeast asia in a global perspective. Ecol. Res. 1991, 6, 185–200. [Google Scholar] [CrossRef]
- Xu, W.D. Kira’s temperature indices and their application in the study of vegetation. Chin. J. Ecol. 1985, 3, 35–39. [Google Scholar]
- Rodhe, A.; Seibert, J. Wetland occurrence in relation to topography: A test of topographic indices as moisture indicators. Agric. For. Meteorol. 1999, 98, 325–340. [Google Scholar] [CrossRef]
- Beven, K.; Kirkby, M.J. A physically based, variable contributing area model of basin hydrology/un modèle à base physique de zone d’appel variable de l’hydrologie du bassin versant. Hydrol. Sci. J. 1979, 24, 43–69. [Google Scholar] [CrossRef]
- Lehner, B.; Verdin, K.; Jarvis, A. Hydrosheds Technical Documentation, Version 1.0; World Wildlife Fund US: Washington, DC, USA, 2006; pp. 1–27. [Google Scholar]
- Taylor, K.E.; Stouffer, R.J.; Meehl, G.A. An overview of cmip5 and the experiment design. Bull. Am. Meteorol. Soc. 2012, 93, 485–498. [Google Scholar] [CrossRef]
- Johnson, F.; Sharma, A. Measurement of gcm skill in predicting variables relevant for hydroclimatological assessments. J. Clim. 2010, 22, 4373–4382. [Google Scholar] [CrossRef]
- Mcsweeney, C.F.; Jones, R.G.; Lee, R.W.; Rowell, D.P. Selecting cmip5 gcms for downscaling over multiple regions. Clim. Dyn. 2015, 44, 3237–3260. [Google Scholar] [CrossRef]
- Tang, Y.; Tang, Q.; Tian, F.; Zhang, Z.; Liu, G. Responses of natural runoff to recent climatic variations in the yellow river basin, China. Hydrol. Earth Syst. Sci. 2013, 17, 4471. [Google Scholar] [CrossRef]
- Yang, H.; Qi, J.; Xu, X.; Yang, D.; Lv, H. The regional variation in climate elasticity and climate contribution to runoff across China. J. Hydrol. 2014, 517, 607–616. [Google Scholar] [CrossRef]
- Zhang, K.; Kimball, J.S.; Nemani, R.R.; Running, S.W. A continuous satellite-derived global record of land surface evapotranspiration from 1983 to 2006. Water Resour. Res. 2010, 46, 109–118. [Google Scholar] [CrossRef]
- Tan, J.; Yang, P.; Liu, Z.; Wu, W.; Zhang, L.; Li, Z.; You, L.; Tang, H.; Li, Z. Spatio-temporal dynamics of maize cropping system in northeast China between 1980 and 2010 by using spatial production allocation model. J. Geogr. Sci. 2014, 24, 397–410. [Google Scholar] [CrossRef]
- Songer, M.; Delion, M.; Biggs, A.; Huang, Q. Modeling impacts of climate change on giant panda habitat. Int. J. Ecol. 2012, 2012. [Google Scholar] [CrossRef]
- Wilke, A.K.; Morton, L.W. Climatologists’ patterns of conveying climate science to the agricultural community. Agric. Hum. Values 2015, 32, 99–110. [Google Scholar] [CrossRef]
- Zeng, L.H.; Song, K.S.; Bai, Z.; Wang, Z.M.; Jia, D. Analysis of evapotranspiration characteristics for different land covers over songnen plain based on remote sensing. Trans. Chin. Soc. Agric. Eng. 2010, 26, 233–242. [Google Scholar]
- Wang, Z.; Zhang, B.; Zhang, S.; Li, X.; Liu, D.; Song, K.; Li, J.; Li, F.; Duan, H. Changes of land use and of ecosystem service values in Sanjiang plain, northeast China. Environ. Monit. Assess. 2006, 112, 69–91. [Google Scholar] [CrossRef] [PubMed]
- Tian, Y.; Yin, K.; Lu, D.; Hua, L.; Zhao, Q.; Wen, M. Examining land use and land cover spatiotemporal change and driving forces in beijing from 1978 to 2010. Remote Sens. 2014, 6, 10593–10611. [Google Scholar] [CrossRef]
- Peng, G.; Niu, Z.G.; Xiao, C.; Zhao, K.Y.; Zhou, D.M.; Guo, J.H.; Lu, L.; Wang, X.F.; Li, D.D.; Huang, H.B. China’s wetland change (1990–2000) determined by remote sensing. Sci. Sin. Terrae 2010, 53, 1036–1042. [Google Scholar]
- Huang, N.; Liu, D.; Wang, Z.; Zhang, B.; Song, K.; Ren, C. Spatial decision analysis on returning farm land to wetland based on gis in the Sanjiang plain. Sci. Geogr. Sin. 2009, 29, 874–879. [Google Scholar]
- Radosavljevic, A.; Anderson, R.P. Making better maxent models of species distributions: Complexity, overfitting and evaluation. J. Biogeogr. 2014, 41, 629–643. [Google Scholar] [CrossRef]
- Beaumont, L.; Pitman, A.; Poulsen, M.; Hughes, L. Where will species go? Incorporating new advances in climate modelling into projections of species distributions. Glob. Chang. Biol. 2007, 13, 1368–1385. [Google Scholar] [CrossRef]
- Wiens, J.A.; Stralberg, D.; Jongsomjit, D.; Howell, C.A.; Snyder, M.A. Niches, models, and climate change: Assessing the assumptions and uncertainties. Proc. Natl. Acad. Sci. USA 2009, 106, 19729–19736. [Google Scholar] [CrossRef] [PubMed]


| Variables | Description |
|---|---|
| Human induced changes | Marshland→Paddy field |
| Marshland→Dry farmland | |
| Marshland→Forest land | |
| Marshland→Settlement | |
| Naturally induced changes | Paddy field→Marshland |
| Dry farmland→Marshland | |
| Forest land→Marshland | |
| Grassland→Marshland | |
| Waterbody→Marshland | |
| Marshland→Grassland | |
| Marshland→Waterbody | |
| Marshland→Other unused land | |
| Other unused land→Marshland |
| Code | Suitable Level | Interval (%) | Uncertainty Term 1 | Likelihood of the Outcome 1 |
|---|---|---|---|---|
| 1 | Low suitable | [0, 33) | Exceptionally unlikely | 0–1% probability |
| Very unlikely | 0–10% probability | |||
| Unlikely | 0–33% probability | |||
| 2 | Medium suitable | [33, 66) | About as likely as not | 33–66% probability |
| 3 | High suitable | [66, 100] | Likely | 66–100% probability |
| Very likely | 90–100% probability | |||
| Virtually certain | 99–100% probability |
| Variables | Category | Calculation 2 | Unit |
|---|---|---|---|
| Bio1-Bio19 1 | Bioclimatic | WorldClim database | - |
| GST | Other Climatic | ||
| GSP | |||
| ABT | |||
| CI | |||
| WI | |||
| DI | |||
| HI | |||
| PER | |||
| Elevation | Terrain | HydroSHED 3 database | m |
| Slope | ArcGIS spatial analysis | ||
| TWI | - | ||
| Trasp | - | ||
| RA | ArcGIS spatial analysis | m | |
| ESD | ArcGIS spatial analysis | m |
| Plain | Year | Paddy Field | Dry Farmland | Marshland | Cultivation Index 2 (%) | |||
|---|---|---|---|---|---|---|---|---|
| Area (km2) | Ratio 1 (%) | Area (km2) | Ratio 1 (%) | Area (km2) | Ratio 1 (%) | |||
| SJP | 1980 | 4890 | 4.51 | 34,159 | 31.52 | 18,247 | 16.84 | 36.03 |
| 1990 | 5790 | 5.34 | 39,463 | 36.43 | 13,773 | 12.71 | 41.77 | |
| 1995 | 4127 | 3.81 | 45,219 | 41.72 | 11,747 | 10.84 | 45.53 | |
| 2000 | 10,663 | 9.84 | 41,807 | 38.57 | 11,168 | 10.30 | 48.41 | |
| 2005 | 11,413 | 10.53 | 41,429 | 38.23 | 10,798 | 9.96 | 48.76 | |
| 2010 | 14,379 | 13.27 | 39,156 | 36.13 | 10,485 | 9.67 | 49.40 | |
| 2015 | 18,760 | 17.31 | 36,223 | 33.42 | 9720 | 8.97 | 50.73 | |
| SNP | 1980 | 9548 | 4.27 | 111,299 | 49.81 | 21,184 | 9.48 | 54.08 |
| 1990 | 9853 | 4.41 | 112,916 | 50.54 | 20,489 | 9.17 | 54.95 | |
| 1995 | 15,502 | 6.94 | 115,480 | 51.68 | 18,208 | 8.15 | 58.62 | |
| 2000 | 14,526 | 6.50 | 117,684 | 52.67 | 18,964 | 8.49 | 59.17 | |
| 2005 | 14,030 | 6.28 | 119,048 | 53.28 | 18,397 | 8.23 | 59.55 | |
| 2010 | 14,346 | 6.42 | 118,617 | 53.08 | 18,226 | 8.16 | 59.50 | |
| 2015 | 16,292 | 7.29 | 117,095 | 52.40 | 17,904 | 8.01 | 59.69 | |
| 1980–1990 | 1990–1995 | 1995–2000 | 2000–2005 | 2005–2010 | 2010–2015 | |
|---|---|---|---|---|---|---|
| SJP (SNP) | SJP (SNP) | SJP (SNP) | SJP (SNP) | SJP (SNP) | SJP (SNP) | |
| Paddy filed | 1.84 (0.32) | −5.74 (11.47) | 31.67 (−1.26) | 1.41 (−0.68) | 5.20 (0.45) | 6.09 (2.71) |
| Dry farmland | 1.55 (0.15) | 2.92 (0.45) | −1.51 (0.38) | −0.18 (0.23) | −1.10 (−0.07) | −1.50 (−0.26) |
| Marshland | −2.45 (−0.33) | −2.94 (−2.23) | −0.99 (0.83) | −0.66 (−0.60) | −0.58 (−0.19) | −1.46 (−0.35) |
| Waterbody | −0.08 (0.18) | 0.37 (−1.86) | 0.67 (−1.12) | −0.03 (−1.11) | −0.04 (0.57) | −0.03 (0.15) |
| Forestland | −0.21 (−0.29) | 0.62 (−0.64) | −1.32 (0.02) | −0.05 (−0.05) | −0.18 (0.00) | −0.35 (−0.06) |
| Grassland | −1.40 (−0.63) | −8.95 (−0.97) | 0.33(−4.54) | 0.44 (−0.02) | −0.20 (0.06) | −0.37 (−0.19) |
| Settlement | 1.30 (0.32) | 1.03 (0.46) | −1.65 (0.03) | 0.00 (0.20) | −0.09 (0.16) | 0.14 (0.93) |
| Other unused land | 0.00 (0.70) | 14.55 (−5.73) | −6.32 (8.17) | 1.54 (0.01) | 5.71 (0.00) | −1.11 (−0.57) |
| 1980–2015 | 1990–2015 | 1995–2015 | 2000–2015 | 2005–2015 | |
|---|---|---|---|---|---|
| SJP (SNP) | SJP (SNP) | SJP (SNP) | SJP (SNP) | SJP (SNP) | |
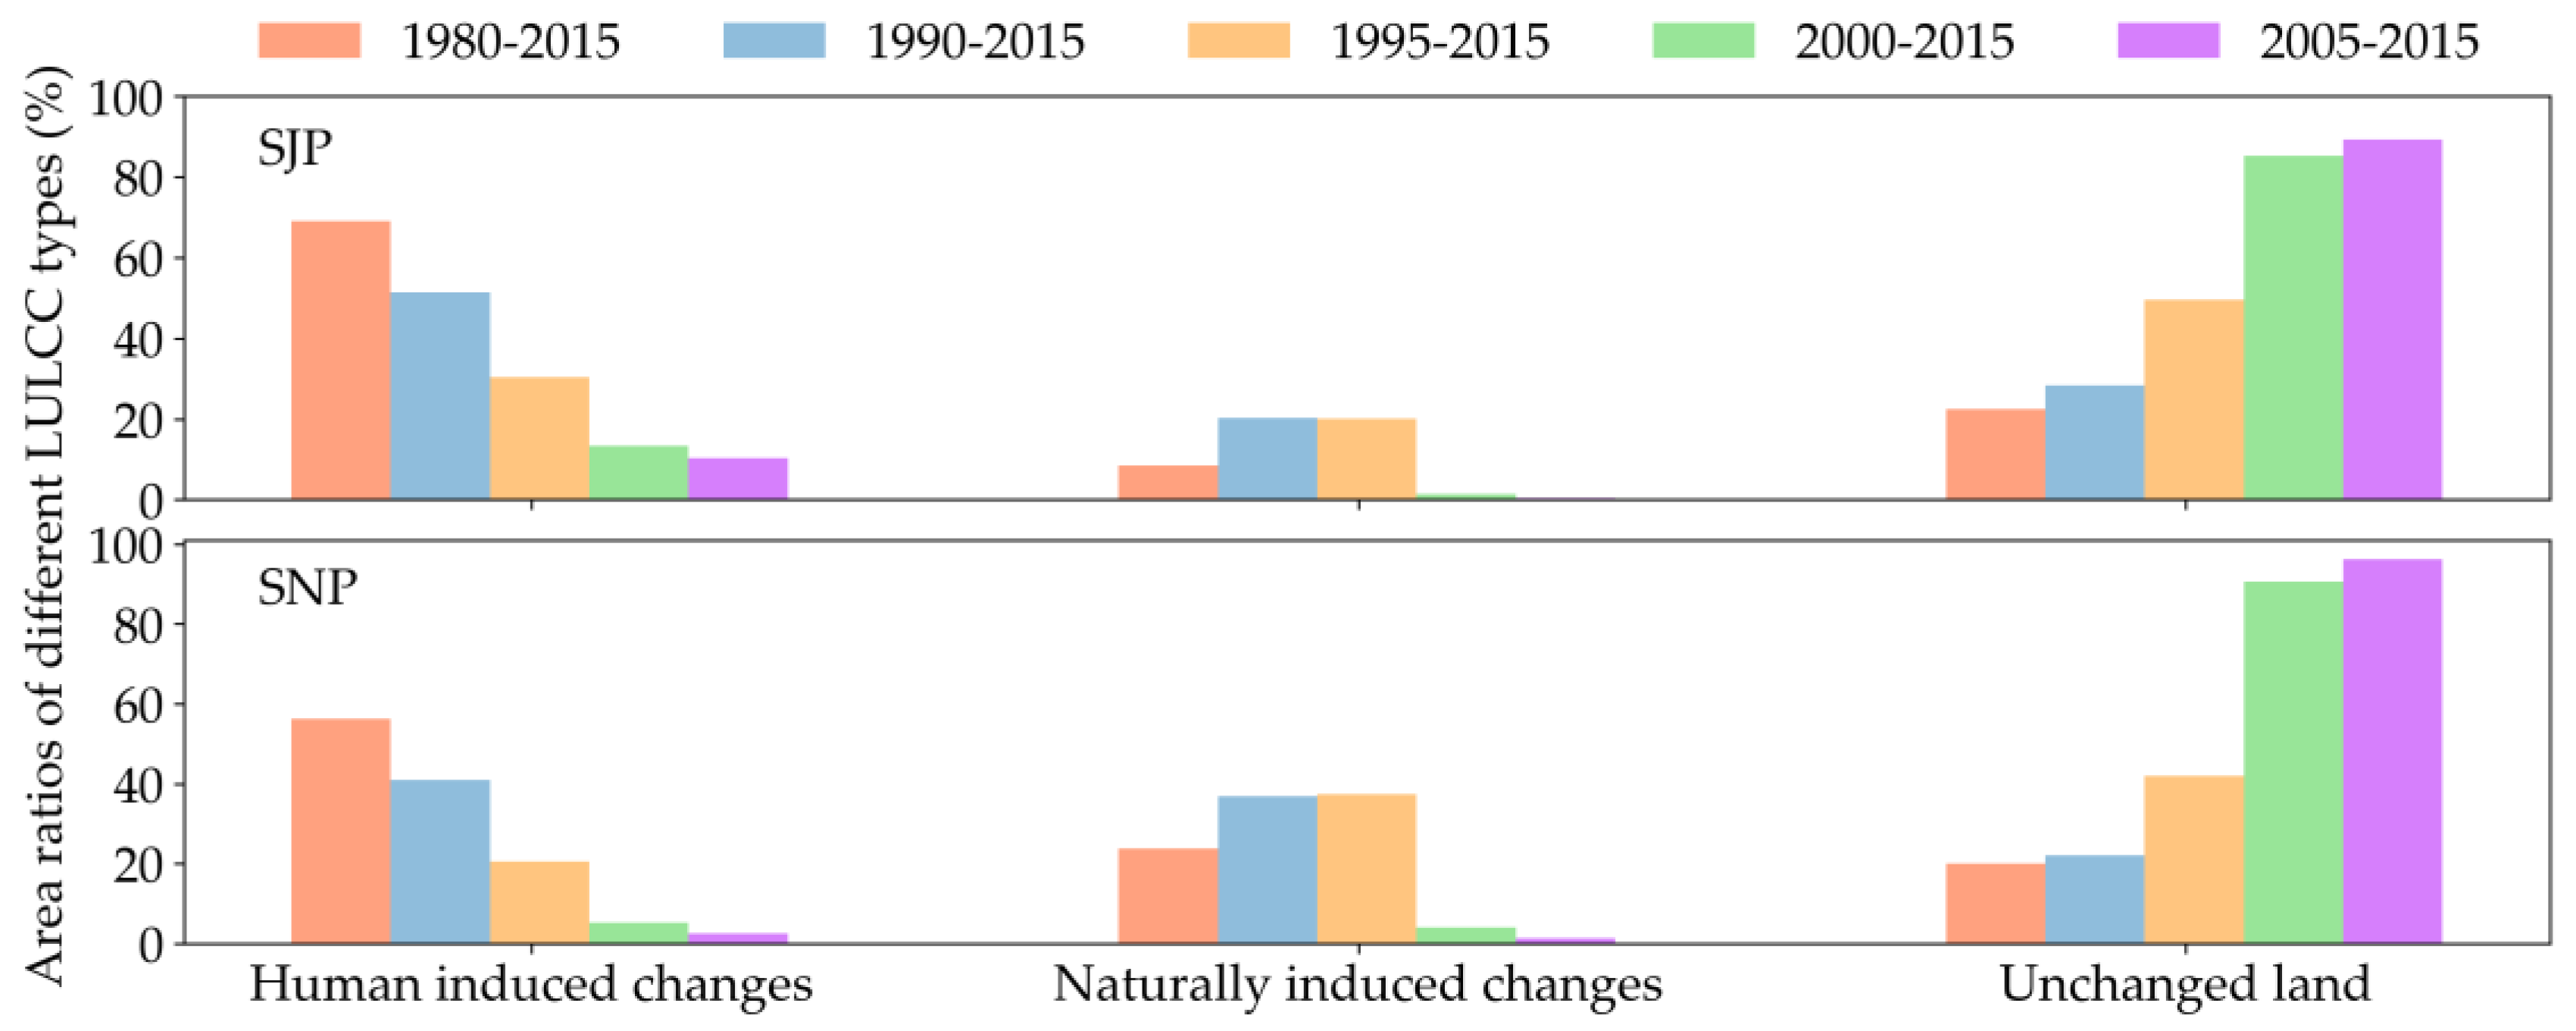
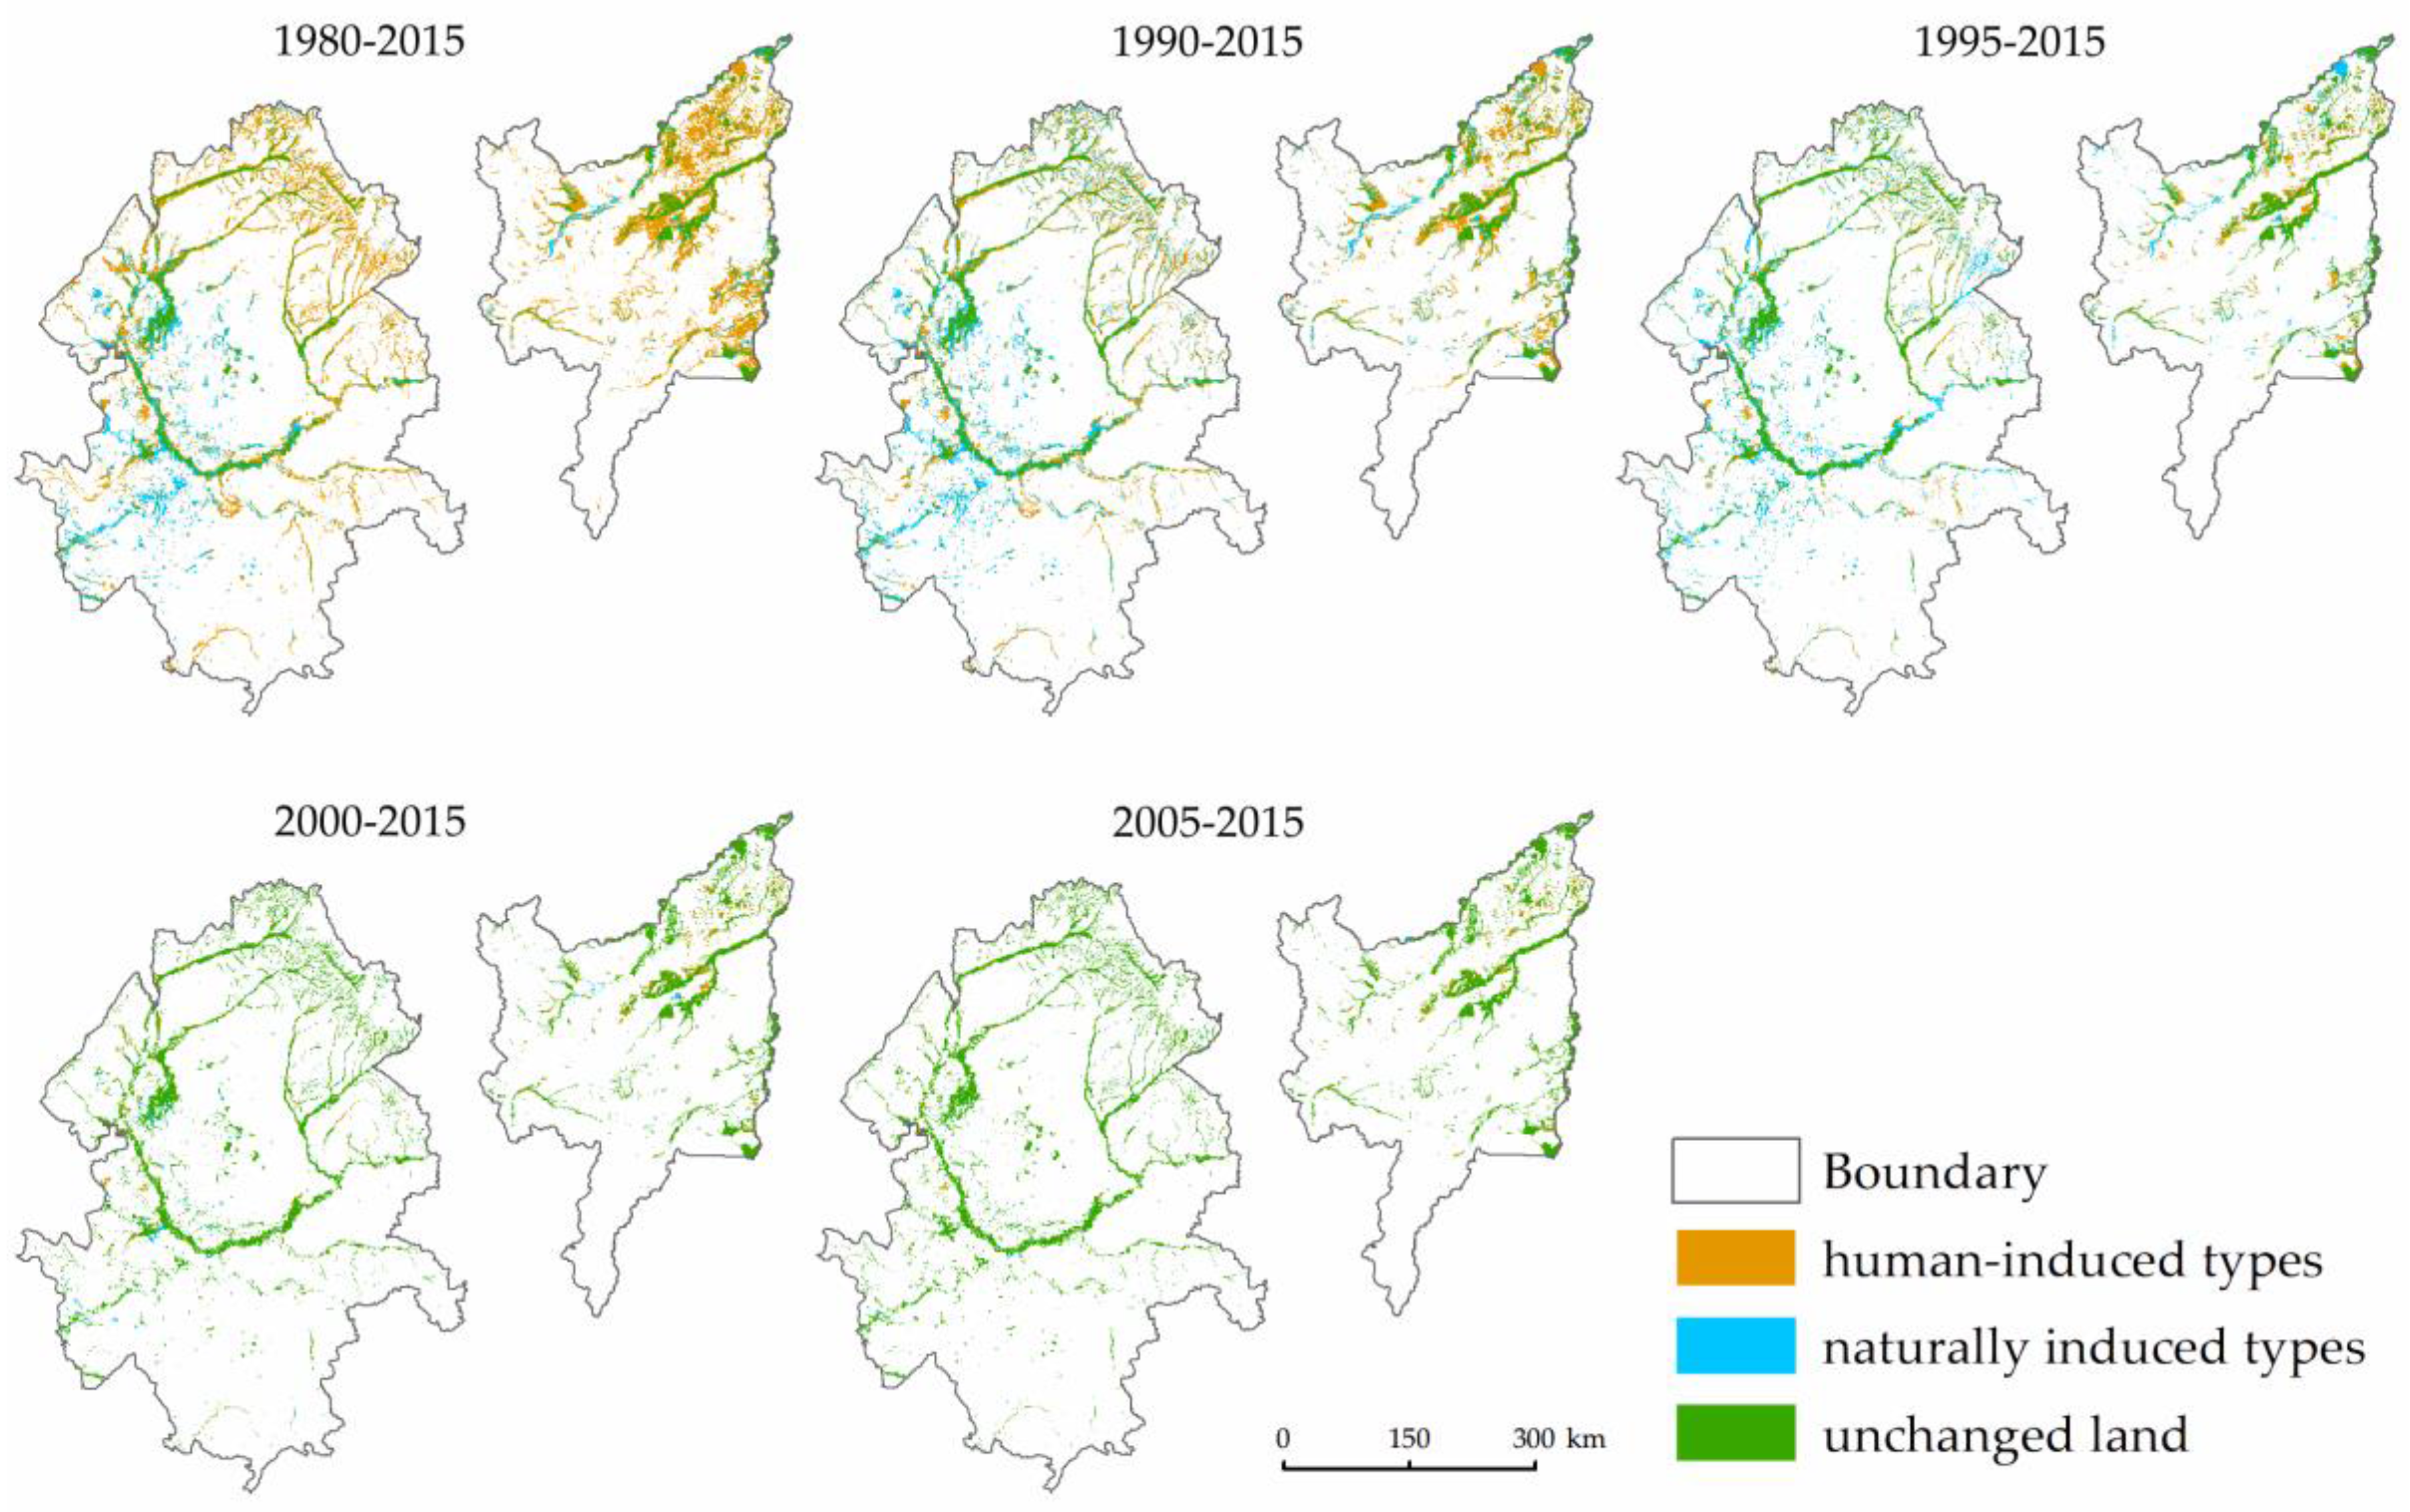
| Human induced changes | 16,642 (19,778) | 9924 (13,617) | 4430 (5302) | 1497 (1019) | 1117 (469) |
| Naturally induced changes | 2032 (8336) | 3919 (12,259) | 2925 (9687) | 157 (791) | 50 (230) |
| Unchanged land | 5403 (7054) | 5465 (7328) | 7237 (10,866) | 9611 (17,525) | 9674 (17,800) |
| LULC Type | Current | RCP4550 | RCP8550 | RCP4570 | RCP8570 | Average |
|---|---|---|---|---|---|---|
| Marshland | 0.908 | 0.893 | 0.890 | 0.890 | 0.893 | 0.895 |
| Waterbody | 0.968 | 0.958 | 0.959 | 0.963 | 0.963 | 0.962 |
| Paddy field | 0.923 | 0.924 | 0.924 | 0.919 | 0.920 | 0.922 |
| Dry farmland | 0.720 | 0.708 | 0.710 | 0.708 | 0.711 | 0.711 |
| LULC Type | Variable | Permutation Importance 1 (%) | Percent Contribution 2 (%) |
|---|---|---|---|
| Marshland | Elevation | 16.26 | 12.34 |
| TWI | 9.32 | 20.54 | |
| Bio13 | 7.38 | 4.54 | |
| Slope | 7.14 | 11.52 | |
| Bio4 | 5.44 | 6.34 | |
| Bio15 | 4.32 | 2.46 | |
| Bio7 | 4.28 | 5.58 | |
| CI | 3.60 | 2.32 | |
| Waterbody | Elevation | 28.58 | 17.84 |
| ESD | 15.20 | 10.9 | |
| RA | 5.74 | 1.40 | |
| Bio4 | 3.36 | 1.66 | |
| Bio3 | 3.24 | 11.74 | |
| DI | 3.04 | 4.14 | |
| Bio15 | 2.88 | 2.08 | |
| Bio13 | 2.76 | 2.48 | |
| Paddy field | Elevation | 18.28 | 14.34 |
| DI | 6.22 | 2.18 | |
| GST | 5.78 | 10.48 | |
| HI | 5.46 | 4.56 | |
| Bio2 | 5.24 | 3.82 | |
| Bio5 | 4.68 | 2.76 | |
| TWI | 3.44 | 7.04 | |
| Slope | 3.30 | 4.24 | |
| Dry farmland | PER | 10.74 | 14.98 |
| HI | 9.92 | 20.06 | |
| Slope | 8.02 | 11.94 | |
| TWI | 6.30 | 5.82 | |
| ESD | 5.30 | 11.74 | |
| DI | 4.76 | 2.72 | |
| Bio13 | 3.42 | 1.50 | |
| Bio15 | 3.18 | 3.34 |
© 2018 by the authors. Licensee MDPI, Basel, Switzerland. This article is an open access article distributed under the terms and conditions of the Creative Commons Attribution (CC BY) license (http://creativecommons.org/licenses/by/4.0/).
Share and Cite
Chen, H.; Zhang, W.; Gao, H.; Nie, N. Climate Change and Anthropogenic Impacts on Wetland and Agriculture in the Songnen and Sanjiang Plain, Northeast China. Remote Sens. 2018, 10, 356. https://doi.org/10.3390/rs10030356
Chen H, Zhang W, Gao H, Nie N. Climate Change and Anthropogenic Impacts on Wetland and Agriculture in the Songnen and Sanjiang Plain, Northeast China. Remote Sensing. 2018; 10(3):356. https://doi.org/10.3390/rs10030356
Chicago/Turabian StyleChen, Hao, Wanchang Zhang, Huiran Gao, and Ning Nie. 2018. "Climate Change and Anthropogenic Impacts on Wetland and Agriculture in the Songnen and Sanjiang Plain, Northeast China" Remote Sensing 10, no. 3: 356. https://doi.org/10.3390/rs10030356
APA StyleChen, H., Zhang, W., Gao, H., & Nie, N. (2018). Climate Change and Anthropogenic Impacts on Wetland and Agriculture in the Songnen and Sanjiang Plain, Northeast China. Remote Sensing, 10(3), 356. https://doi.org/10.3390/rs10030356