Article

Evaluation of Three-Hourly TMPA Rainfall Products Using Telemetric Rain Gauge Observations at Lai Nullah Basin in Islamabad, Pakistan

1
Department of Space Science, Institute of Space Technology (IST), Islamabad 44000, Pakistan
2
Hagler Bailly Pakistan, Islamabad 44000, Pakistan
3
SERVIR-Mekong, Asian Disaster Preparedness Center (ADPC), Bangkok 10400, Thailand
4
Institute of Geographical Information System (IGIS), National University of Science and Technology (NUST), Islamabad 44000, Pakistan
*
Author to whom correspondence should be addressed.
Remote Sens. 2018, 10(12), 2040; https://doi.org/10.3390/rs10122040
Submission received: 14 October 2018 / Revised: 3 December 2018 / Accepted: 11 December 2018 / Published: 14 December 2018
(This article belongs to the Special Issue Remote Sensing of Precipitation)

Abstract

:
Flash floods which occur due to heavy rainfall in hilly and semi-hilly areas may prove deleterious when they hit urban centers. The prediction of such localized and heterogeneous phenomena is a challenge due to a scarcity of in-situ rainfall. A possible solution is the utilization of satellite-based precipitation products. The current study evaluates the efficacy of Tropical Rainfall Measuring Mission (TRMM) Multi-satellite Precipitation Analysis (TMPA) three-hourly products, i.e., 3B42 near-real-time (3B42RT) and 3B42 research version (3B42V7) at a sub-daily time scale. Various categorical indices have been used to assess the capability of products in the detection of rain/no-rain. Hourly rain rates are assessed by employing the most commonly used statistical measures, such as correlation coefficients (CC), mean bias error (MBE), mean absolute error (MAE), and root-mean-square error (RMSE). Further, a diurnal analysis is performed to authenticate TMPA’s performance in specific hours of the day. In general, the results show the good capability of both TMPA products in the detection of rain/no-rain events in all seasons except winter. Specifically, 3B42V7 performed better than 3B42RT. Moreover, both products detect a high number of rainy days falsely in light rain ranges. Regarding rainfall measurements, TMPA products exhibit an overall underestimation. Seasonally, 3B42V7 underestimates rainfall in monsoon and post-monsoon, and overestimates in winter and pre-monsoon. 3B42RT, on the other hand, underestimates rainfall in all seasons. A greater MBE and RMSE are found with both TMPA rain measurements in monsoon and post-monsoon seasons. Overall, a weak correlation and high MBE between the TMPA (3B42RT, 3B42V7) and reference gauge hourly rain rates are found at a three-hourly time scale (CC = 0.41, 0.38, MBE = −0.92, −0.70). The correlation is significant at decadal (CC = 0.79, 0.77) and monthly (CC = 0.91, 0.90) timescales. Furthermore, diurnal rainfall analysis indicates low credibility of 3B42RT to detect flash flooding. Within the parameters of this study, we conclude that the TMPA products are not the best choice at a three-hourly time scale in hilly/semi-hilly areas of Pakistan. However, both products can be used at daily, yet more reliably above daily, time scales, with 3B42V7 preferable due to its consistency.

1. Introduction

Precipitation is a key phenomenon which has a direct impact on global climate patterns. Anomalies in precipitation may cause natural hazards, like droughts, floods, and landslides [1]. A natural event that occurs in a populated area is highly dangerous as it may cause loss of human lives and damage to property [2]. Regarding the climate change vulnerability index, Pakistan has been ranked 13th globally [3]. The county is prone to multiple natural hazards, like floods, droughts, earthquakes, and cyclones [3,4,5]. The frequency and intensity of extreme weather events have increased in the past two decades; therefore, an estimated 40% of the population is vulnerable to such disasters [3]. Rainfall, a major contributing factor at local-scale climate patterns, not only impacts weather systems, but also influences the water flow in rivers and water level in dams [3]. Monsoon rain is an expected and dominant phenomenon in Pakistan’s climate [6]. The monsoon period typically ranges from July to mid-September. Most parts of the country receive rainfall in the monsoon season [7]. Due to heavy rainfall in the monsoon season, flooding in the low-lying areas along rivers is common, while hilly and semi-hilly areas experience flash floods due to steep elevation gradients [7,8]. Lai Nullah is a natural stream fed by rainwater. It passes through the twin cities, i.e., Islamabad and Rawalpindi, and inundates the surrounding areas almost every year due to heavy rainfall in the monsoon [3,6]. Lai Nullah basin receives rainfall of about 600 mm during the monsoon, which is ~60% of annual rainfall. From 1944 to 2014 (70 years), Lai Nullah basin faced more than 23 flood events [9]. Extreme flood events were recorded in 1981, 1988, 1997, and 2001. The flood in 2001 was the most catastrophic, causing 74 deaths, out of which 64 fatalities occurred in Rawalpindi [3,6,10,11]. From 1994 to 1997, Lai Nullah flooded five times, causing the loss of 84 human lives and destroying around 1000 houses [6,10,12,13]. After the 2001 floods, intermittent moderate level floods have been reported. A flash flood was reported by Hayat (2007) [4] in Lai Nullah due to moderate intensity rain for 6 h on 20th March 2007. Afzal et al. [14] reported a severe rainfall spell on 5th July 2008 when 104 mm rainfall was recorded in 100 min, and an overall 162 mm in 5 h. Consequently, densely populated low-lying areas near Lai Nullah faced a flood-like situation, causing three causalities and wrecking a massive amount of property. In 2014, a flood occurred when ~280 mm rainfall was recorded in a day, which severely inundated low-lying areas [6]. Each year, after the flooding, people living along Lai Nullah face numerous crises, which include loss of life and property [15]. There is a dire need for accurate and high spatio-temporal precipitation data to minimize risks to people’s lives and properties due to regular flash floods in Lai Nullah. Such measurements are not only important to predict rapidly developing hydro-meteorological phenomena like a flash flood, but also significant for sustainable planning and the management of water resources, agriculture lands, urban areas, and ecological systems [16,17].
Conventionally, rainfall gauges are used to observe rainfall. Presently, these are the only instruments available to measure rainfall accumulation directly. Over the last few decades, the number of rainfall gauges has increased tremendously, but still, their density does not meet scientific needs. Furthermore, rainfall is a heterogeneous phenomenon which varies at different spatio-temporal scales. Rain gauges only record local-scale information, which may lead to potential errors when interpolation is applied at larger scales, especially in hilly areas [18]. In addition, a spatial distribution of rain gauges is sparse in remote, undeveloped areas and regions with complex terrain [19]. An alternative approach to estimating precipitation is a weather radar, which can reveal the precipitation patterns and storm structure along with real-time monitoring at a very high spatial and temporal resolution. Limited coverage of weather radars and the associated complex data processing that is also prone to errors is another challenge [1]. Thus, recording precise precipitation at a fine spatial and temporal resolution, from a regional to global scale, is a contemporary issue for researchers [1,16,20].
Advances in remote sensing technologies have capacitated the scientific community to employ satellite-based precipitation products at varied spatial and temporal resolutions [16]. Satellites such as the Tropical Rainfall Measuring Mission (TRMM) [21], Climate Prediction Center MORPHing technique (CMORPH) [22], and Precipitation Estimation from Remotely Sensed Information Using Artificial Neural Networks (PERSIANN) [23] are delivering free data products to the community. These products are indeed valuable for hydrological modeling and predictions, flood forecasting, land surface derivation models, reservoir operations and risk analysis, resource management and monitoring, drought early warning, and the validation of numerical models for regions with a paucity of weather stations. Typically, these rainfall products have a high spatial and temporal resolution, and good spatial and temporal coverage. [1,24,25]
TRMM products are widely used among researchers and hydrologists, and have been applied globally in various precipitation assessment, and hydrological and flood inundation modeling studies [25,26,27,28,29,30,31,32,33,34,35,36,37,38,39]. TRMM was the first space mission with a special focus on measuring tropical and subtropical rainfall through visible/infrared, and active and passive microwave sensors [40]. Primarily, the three rainfall sensors mounted on TRMM were the Visible and Infrared Scanner (VIRS), Precipitation Radar (PR), and TRMM Microwave Imager (TMI) [16,41].
While the advantages of such satellite-based products are multifarious, precipitation measurements that are done through indirect methods associated with remote sensing techniques can potentially induce large uncertainties and errors. These uncertainties associated with the precipitation retrieval algorithm can generate errors in rainfall estimation, which can further propagate into hydrological modeling. Therefore, it is essential to evaluate the rainfall retrieval capability of a satellite sensor before its application. Such an assessment can guide users about applications of products and impacts of accompanied errors [1,17,42].
Many studies have been undertaken globally to validate Tropical Rainfall Measuring Mission (TRMM) Multi-satellite Precipitation Analysis (TMPA) at a daily time scale. For example, Wang et al. [1] evaluated TMPA 3B42 version 7 and Integrated Multi-satellite Retrievals for GPM (IMERG) at different time scales and found a very high correlation of TMPA 3B42 version 7 with rain gauge observations at a yearly time scale, but a weak linear relationship (correlation coefficient <0.5) at a daily time scale. A couple of studies [43,44] evaluated TMPA 3B42 version 6 in Saudi Arabia and Nepal. The studies showed an overall underestimation in Nepal and a typical overestimation in Saudi Arabia. Moreover, the performance of TMPA 3B42 version 6 in mountainous regions was poor compared to plain areas. A similar study [45] conducted in Bangladesh showed that TMPA 3B42 version 5 overestimated rainfall in most of the areas in pre-monsoon and post-monsoon seasons and underestimated in the monsoon season, especially in heavily wet areas. Overall, TMPA 3B42 version 5 underestimated rainfall in wet areas and overestimated rainfall in dry areas. Cai et al. [46] also found a weak correlation (r = 0.5) between TMPA 3B42 version 7 and rain gauge data, but the correlation was high at monthly and annual time scales. Another study [47] used different temporal as well as spatial scales to evaluate TMPA 3B42 and found a modest correlation at a daily scale, but a good relationship (r > 0.8) at monthly timescale. Additionally, the study revealed no significant improvement in the performance of TMPA when evaluated at a 1 × 1 degree grid cell by merging 0.25 × 0.25 degree grid cells.
Though TMPA 3B42 products have been extensively assessed at daily and longer time scales, their evaluation at a sub-daily time scale is quite rare. A recent study [17] compared TMPA 3B42 research version with rain gauge data at Khorasan Razavi province in northeastern Iran and observed a correlation coefficient value of 0.36 for average three-hourly rainfall. The study also discovered an underestimation of TMPA 3B42 research version at a 3-h timescale. Another study [48] conducted in Greece evaluated TMPA 3B42 with rain gauge data at a high temporal resolution of 3 h and found a correlation coefficient value slightly less than 0.3 between both sources. Nevertheless, this correlation increased with aggregated time intervals, i.e., 6 h, 12 h, 24 h, and 48 h, and gained a peak value of 0.6 at a maximum aggregated interval. Moreover, the study found a decrease in mean absolute error and root mean square error when moving from a low aggregated interval to a high aggregated interval. Yuan et al. [49] investigated the diurnal characteristics of TRMM 3B42 in central eastern China by using rain gauge data and noticed some dispersed patterns. TRMM 3B42 version 6 hourly intensities were also appraised by Scheel et al. [47] for a very short period of three months in the Central Andes region. Results regarding rain detection capabilities were tantamount to daily results, but the correlation was significantly lower (0.01) compared to the correlation (r = 0.55) with ground observations at a daily timescale. In another study [50] conducted over the Korean Peninsula, the correlation coefficient value was found to be 0.47 when 3B42 V6 was evaluated against automatic weather station data, whereas the 3B42 product slightly overestimated rain rates. Villarini [51] compared two pixels of the three-hourly rainfall product of TMPA 3B42 with rain gauge observations over the metropolitan area and observed a mean correlation coefficient value of 0.38 between both sources. In another study [52] on a regional scale, a mean correlation coefficient value of 0.45 between TMPA 3B42 and ground rainfall observations was noticed for cold and warm seasons.
Many studies have been carried out for Pakistan regarding the validation of TMPA 3B42 products. Nonetheless, these studies only validated TMPA 3B42 products at daily or above daily time scales. In a study [16], surface rainfall gauge and Asian Precipitation Highly Resolved Observational Data Integration Towards Evaluation of Water Resources (APHRODITE) data were used to evaluate TMPA daily rain. The study divulged an overestimation of TMPA 3B42 version 7 in pre-monsoon and monsoon seasons, while an underestimation in post-monsoon and winter seasons. Likewise, a good agreement between TMPA 3B42 version 7 and ground observations was observed in plain and medium elevation areas. Hussain et al. [53] concluded in their study that the performance of TMPA 3B42 was better in mountainous regions than the arid region. Also, TMPA 3B42 overestimated rainfall in glacier regions. Anjum et al. [54] assessed TMPA 3B42 real-time and post-real-time products for the inclement flood event of 2010 in the mountainous region. The TMPA post-real-time product performed well in comparison to the real-time product and generally captured the spatial patterns of precipitations; albeit both products were unable to capture the temporal variation of the storm. TMPA 3B42 v6 and v7 were compared by Anjum et al. [55] for the Swat watershed. Overall, TMPA 3B42 version 7 performed better. The algorithms performed well at the monthly scale, but poorly at the daily and seasonal scale. Another study [56] revealed that TMPA 3B42 underestimated rainfall in intense monsoon regions, but overestimated in southern parts of the Indus basin. Three different satellite algorithms, including the TMPA 3B42 real-time product, were analyzed by Sadiq et al. [57]. The TMPA performed well in high intensity rainfall events, but highly overestimated for light rain rates. This overestimation was also observed in mountains regions in north and coastal areas in the south of the Indus basin.
Our present study comprises the validation and performance assessment of both TMPA 3-hourly rainfall products, i.e., 3B42 near-real-time (3B42RT hereafter) and 3B42 research version (3B42V7 hereafter) hourly rain rates at various time scales for the period 2007 to 2010 in Lai Nullah basin in Islamabad, Pakistan. The major objective of the study is to evaluate TMPA’s rainfall rates (mm/h) at 3-h time intervals by using 10-min temporal resolution telemetric rain gauge (TRG) observations. Validation of TMPA products at the finest time scale, i.e., 3-h, is inadequate around the globe. One possible reason for this is that the in-situ rainfall data is not sufficiently available at the sub-daily timescale. Similarly, in Pakistan, the validation of TMPA products at the sub-daily scale has not been executed yet, and the current study is the first of its kind to evaluate TMPA products at a 3-h timescale. The motivation behind this validation study is to examine the feasibility of 3B42RT’s three-hourly rain rates for the prediction of heterogeneous and localized hydro-meteorological phenomenon like urban flash flooding and to determine the viability of 3B42V7’s sub-daily rain rates for water-related modeling. Furthermore, diurnal analysis has also been conducted to verify TMPA products’ behavior at specific hours of the day. The TMPA’s rain rates have also been inspected at daily, decadal, and monthly timescales. Aggregated rainfall patterns of both TMPA products are also analyzed at seasonal and annual scales. Such a fine-scale validation study will assist users and scientists to probe the operability of the TRMM 3B42 3-h products before their potential usage at a high temporal resolution (3-h) in the localized context of Pakistan.

2. Study Area, Datasets, and Methodology
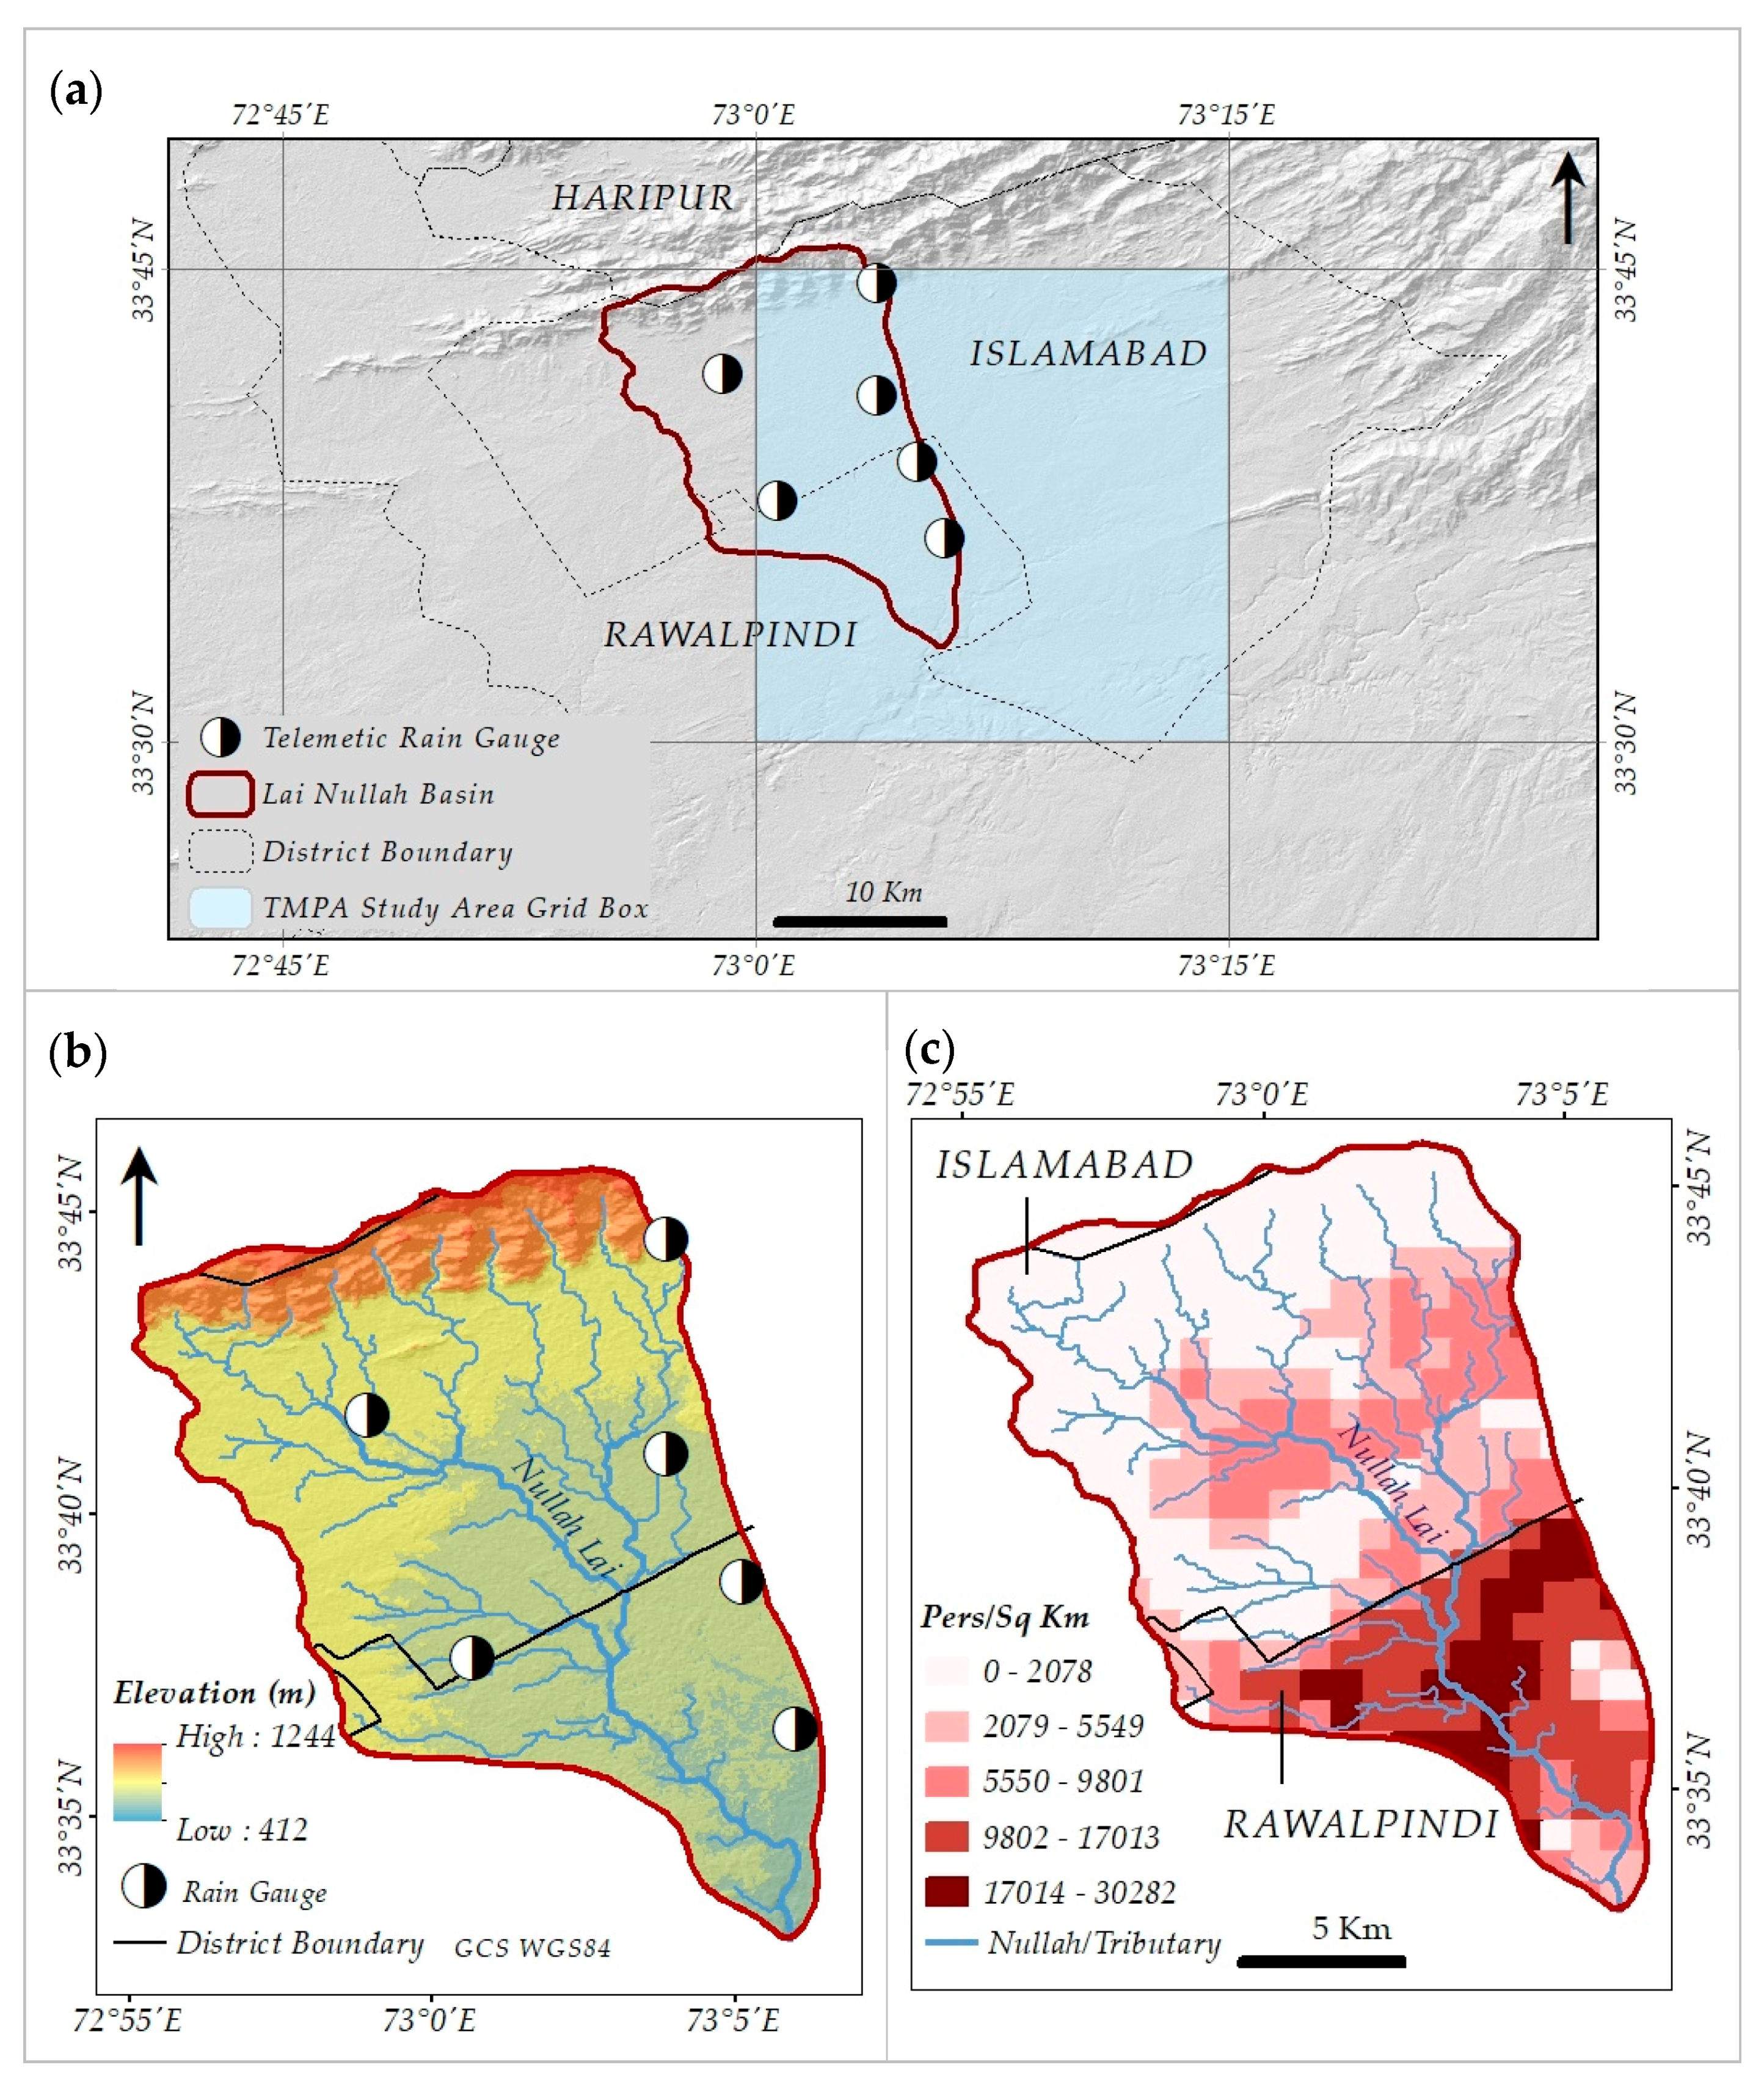
2.1. Study Area

The study area is Lai Nullah basin, which covers a major portion of Islamabad and Rawalpindi, also known as the ‘Twin cities’, in the northern part of Pakistan. This basin is located at 33°45′36″ to 33°33′01″ North and 72°55′16″ to 73°6′27″ East (Figure 1).
The total area of the basin is approximately 230 km2. The area of the upper portion of the basin which covers Islamabad is approximately 159.6 km2, i.e., ~69% of the total catchment area of Lai Nullah basin. The lower part of the basin covers almost 70.5 km² of Rawalpindi city and its surroundings [6,10,58]. The lowest point of Lai Nullah is 420 m above mean sea level (a.m.s.l.) at the confluence of Soan River, while the highest elevation of the basin is 1200 m a.m.s.l. at the top of the mountain of Margalla hills.

2.2. Telemetric Rain Gauge Observations

An in-situ rainfall dataset for a period of approximately four years (1 April 2007 to 31 December 2010) at a 10 min temporal resolution was obtained from the Pakistan Meteorological Department (PMD)—the national weather forecasting agency of Pakistan. The surface rainfall observations have been recorded by telemetric rain gauges (TRGs). PMD, with the technical help of Japan International Cooperation Agency (JICA), installed these TRGs in Lai Nullah basin for a flood prediction and early warning system. These telemetric rain gauges are tipping bucket rainfall gauges which have a sensitivity of 0.1 mm [12]. Tipping bucket (TB) rain gauges may include systematic as well as random errors. Systematic error may include calibration error, wind-induced error, and sampling error. PMD follows the World Meteorological Organization (WMO) guidelines [59] on quality control for automated weather stations, which include telemetric rain gauges. Figure 1a shows the location while Table 1 provides the exact coordinates and elevation of TRGs. Out of the six gauges, only two rain gauges are in Rawalpindi, while the remaining are stationed in Islamabad city.

2.3. TMPA

The Tropical Rainfall Measuring Mission was launched on 27 November 1997, from the Tanegashima Space Center in Japan. Various weather-related instruments like a TRMM microwave imager (TMI), and visible and infrared sensor (VIRS) were mounted on the satellite [43]. The TMPA is one of several products offered by TRMM, and it is a fine scale product which has a spatial resolution of 0.25° × 0.25° at a 3-h temporal scale [1,21]. The product covers an area between 50°N–50°S. The construction of TMPA involves multi-sensor analysis techniques which utilize synergy between the passive microwave retrievals of rainfall with the geostationary infrared observations [41]. The TMPA is further categorized as real-time (3B42-RT) and post-real time (3B42 research version) [21,60]. Both versions have the same spatial and temporal coverage; the only difference is that the research version is biased adjusted by using monthly rain gauge data [21,61]. The current study includes both TMPA versions for the validation.
TMPA 3B42 products are developed in a sequence which starts from a collection of rainfall-related passive microwave data from various low earth orbit (LEO) microwave sensors, including TMI, Advanced Microwave Scanning Radiometer-Earth Observing System (AMSR-E), Special Sensor Microwave Imager (SSM/I), and Advanced Microwave Sounding Unit-B (AMSU-B). Each of the passive microwave sensor’s measurements are converted into precipitation and then averaged to a spatial grid of a 0.25° cell size with a temporal resolution of 3-h (±90 min from central time slot). Best estimates are calculated by using some statistical methods for coincident data. However, it should be noted that in LEO, each satellite gives a very dispersed sampling of precipitation in time and space. All other microwave sensors are calibrated by using TRMM combine instruments (TCI) and TMI. In the next step, infrared measurements are collected from the international constellation of geosynchronous earth orbit (GEO) satellites. Then, GEO’s IR data, which offers an exceptional time-space coverage, is processed at a 0.25° spatial grid and 3-h temporal scale. Again, microwave TCI data is used to calibrate IR estimates. Then, microwave and infrared estimates are merged to form a single best estimate. In first preference, 0.25° grid cells are assigned microwave-based rainfall estimates, and the remaining gaps are filled with IR-based precipitating estimates. This step provides near-real-time estimates of precipitation labeled as the TMPA 3B42 near-real time product. At the final stage, three-hourly merged rain estimates are summed over a calendar month to construct the monthly multi-satellite (MS) product. This product is then combined with monthly rain gauge data to form a post-real time satellite-gauge (SG) product, which is labeled as TRMM’s research version product (3B43). In the end, the SG/MS ratios are calculated on each cell of a 0.25° grid and then applied to every three-hourly field of the month to construct a research version 3B42 product [21]. Version 7 of the TMPA 3B42 product was released in May 2012 after applying some major revisions in the TMPA 3B42 version 6. However, very soon after this, some errors were identified in TMPA 3B42V7; therefore, V7 was again revisited, and a newly revised version was released in December 2012 [62].

2.4. Methodology

Validation of precipitation data at a sub-daily scale is a big challenge as standard observations are taken at a daily scale [52]. However, for the current study, reference in-situ rainfall observations are available at a very high temporal resolution of 10 min. Therefore, such high temporal reference data offers a unique opportunity to assess TMPA’s hourly rain rates at its finest temporal resolution, i.e., 3-h, and then the other time scales like daily, decadal, and monthly.
In-situ reference data is taken from the telemetric rain gauges, which are point-based observations. On the other hand, a satellite averages rainfall over a specific area or pixel. One way is to interpolate reference point data for an area-to-area comparison, but such a comparison may cause additional error due to interpolation techniques [1]. Thus, the point-to-pixel comparison method has been considered for the current study. TMPA is a grid-based product; therefore, the location of each pixel for rain gauge stations remains fixed. Spatial overlays revealed that rain gauges are quite closely distributed and five out of six rain gauges fall within a single pixel. Villarini [51] suggests using at least five rain gauges for computing areal averages at high spatial and temporal resolutions. Therefore, non-zero averaged rain rates (mm/h) of five rain gauges are calculated for the comparison with satellite-based rainfall measurements. The use of more than a distributed single station against one TMPA grid cell may minimize the well-known issue of unrepresentative error, i.e., point-based precipitation observations are likely to be unrepresentative of satellite estimated areal values [20]. But the number of rain gauges that is suitable to represent a grid cell is dependent on the rain pattern, spatial properties, seasons, and terrain. However, the correlation coefficient between satellite-based rainfall and rain gauge rainfall is increased when the number of rain gauges and accumulation intervals is increased till a certain range. Also, the error statistic is improved when more than one set of rain gauge data is used against one grid cell [63]. After careful assessment, the sixth rain gauge which is falling near the border of another pixel is discarded from the analysis. Finally, temporal collocation using a ±5 min time window is performed to generate the satellite–gauge data pairs for comparison.
Commonly used statistical methods to assess satellite rainfall algorithms are continuous and categorical methods [20]. Continuous statistical measures related to satellite rainfall amount evaluation include mean bias error (MBE), mean absolute error (MAE), root mean square error (RMSE), and Pearson correlation coefficient (CC) between estimated and observed rainfall values [20,43,44,54,64]. CC computes the linear relationship between measured and observed rainfall. MBE calculates the average difference between measured and observed rainfall. A positive MBE value indicates an overestimation, while a negative value presents an underestimation of satellite rainfall with respect to the rainfall from in-situ gauge data. MAE determines the average absolute magnitude of error, while RMSE also estimates the average error magnitude, but gives more weight to larger errors. The perfect values for these measures are 1 for the correlation coefficient, and 0 for MBE, MAE, and RMSE. The CC value is considered significant if it is equal to or greater than 0.7 [53]. Standard deviation (SD) [65] is another useful statistical measure to assess the capability of each dataset in capturing rainfall variability. A higher SD value represents more variation in rainfall from its mean value. The performance of the TMPA algorithm has been characterized into three basic groups [43,44]: overestimation, underestimation, and approximately equal (within ±10%). Categorical statistical measures have been calculated to assess the performance of TMPA in the detection of rain/no-rain events at a given threshold. Indices like Bias, probability of detection (POB), false alarms ratio (FAR), threat score (TS), equitable threat score (ETS) and skill score (SS) [1,20,43], Refs. [44,54,66,67] have been calculated. Bias estimates the frequency of measured rainfall events to the frequency of observed rainfall events. It indicates whether a measuring system under-detects or over-detects rainy events. POD describes the ability of a rain measuring source to detect rain events correctly. FAR represents the cases when a rain measuring source detects rain when there is no rain detected. TS/CSI, ETS, and SS demonstrate the overall fraction of events which are correctly detected by a rain measuring source. The difference between ETS and TS is that the ETS is an adjusted index for hits associated with random chance. Perfect scores for Bias and FAR are 0 and 1 for the POD, TS, ETS, and SS. More details of categorical and continuous statistical measures are given in Table 2. The diurnal variations of precipitation captured by TRG and TMPA products are assessed by using the frequency of precipitation occurrence, the precipitation intensity, and the precipitation amount. Precipitation frequency is defined as the number of rainy events divided by the total number of events. Precipitation intensity is defined as the mean rates averaged over the precipitating events, and the amount of precipitation is accumulated precipitation [49,68,69,70].
The rain/no-rain detection threshold reported for the telemetric rain gauges is 0.1 mm/h. However, a minimum non-zero value of ‘1 mm/h’ has been found in TRG data series analysis. Hence, the data pairs with the rain gauge rainfall value ‘0’ and TMPA rainfall values less than 1 mm/h are excluded from categorical analysis. Overall, the rain rate threshold of 0.1 mm/h has been used for both datasets to consider rain/no-rain events for calculating categorical, as well as continuous, statistics measurements. Moreover, data pairs where TMPA products and rain gauge have zero rainfall values are excluded during calculations of continuous statistics, i.e., CC, MBE, MAE, and RMSE.
The comparison of TMPA hourly rain rates with the rain gauge observations is carried out at a 3-h time interval. Furthermore, mean hourly rain rates are computed for daily, decadal, and monthly comparisons. TMPA hourly rain rates are also evaluated in different seasons. Seasons are defined as the winter season (November-February), pre-monsoon season (March-May), monsoon season (June-August), and post-monsoon season (September-October) [71]. The mean maximum temperature of Islamabad is 40 °C during June (monsoon) and the mean minimum temperature is 3 °C during January (winter) [72]. The annual mean temperature of Islamabad is 29 °C, and annual mean precipitation is 1140 mm [73]. The monsoon receives a major portion of annual rainfall (~60%). The monsoon precipitation system which mainly originates from the Bay of Bengal enters Pakistan from its southern (Arabian sea), south-eastern (India), and north-eastern boundaries (Nepal) [56,57,74]. Due to heavy rainfall in the monsoon, different parts of Pakistan face floods in this season. Pre-monsoon and post-monsoon seasons are considered warm seasons, with a relatively low rainfall amount in these seasons. Islamabad often receives moderate to heavy rainfall showers in winter months due to a phenomenon called western disturbances or winter westerlies. Western disturbances originate from the Mediterranean region and enter Pakistan through Afghanistan at its north-western boundaries [56,57,75].
In addition to rain rates validation, monthly, seasonal, and annual rainfall amounts are also aggregated to compare both datasets.

3. Analysis and Results

3.1. TMPA Products Evaluation for Entire Study Period

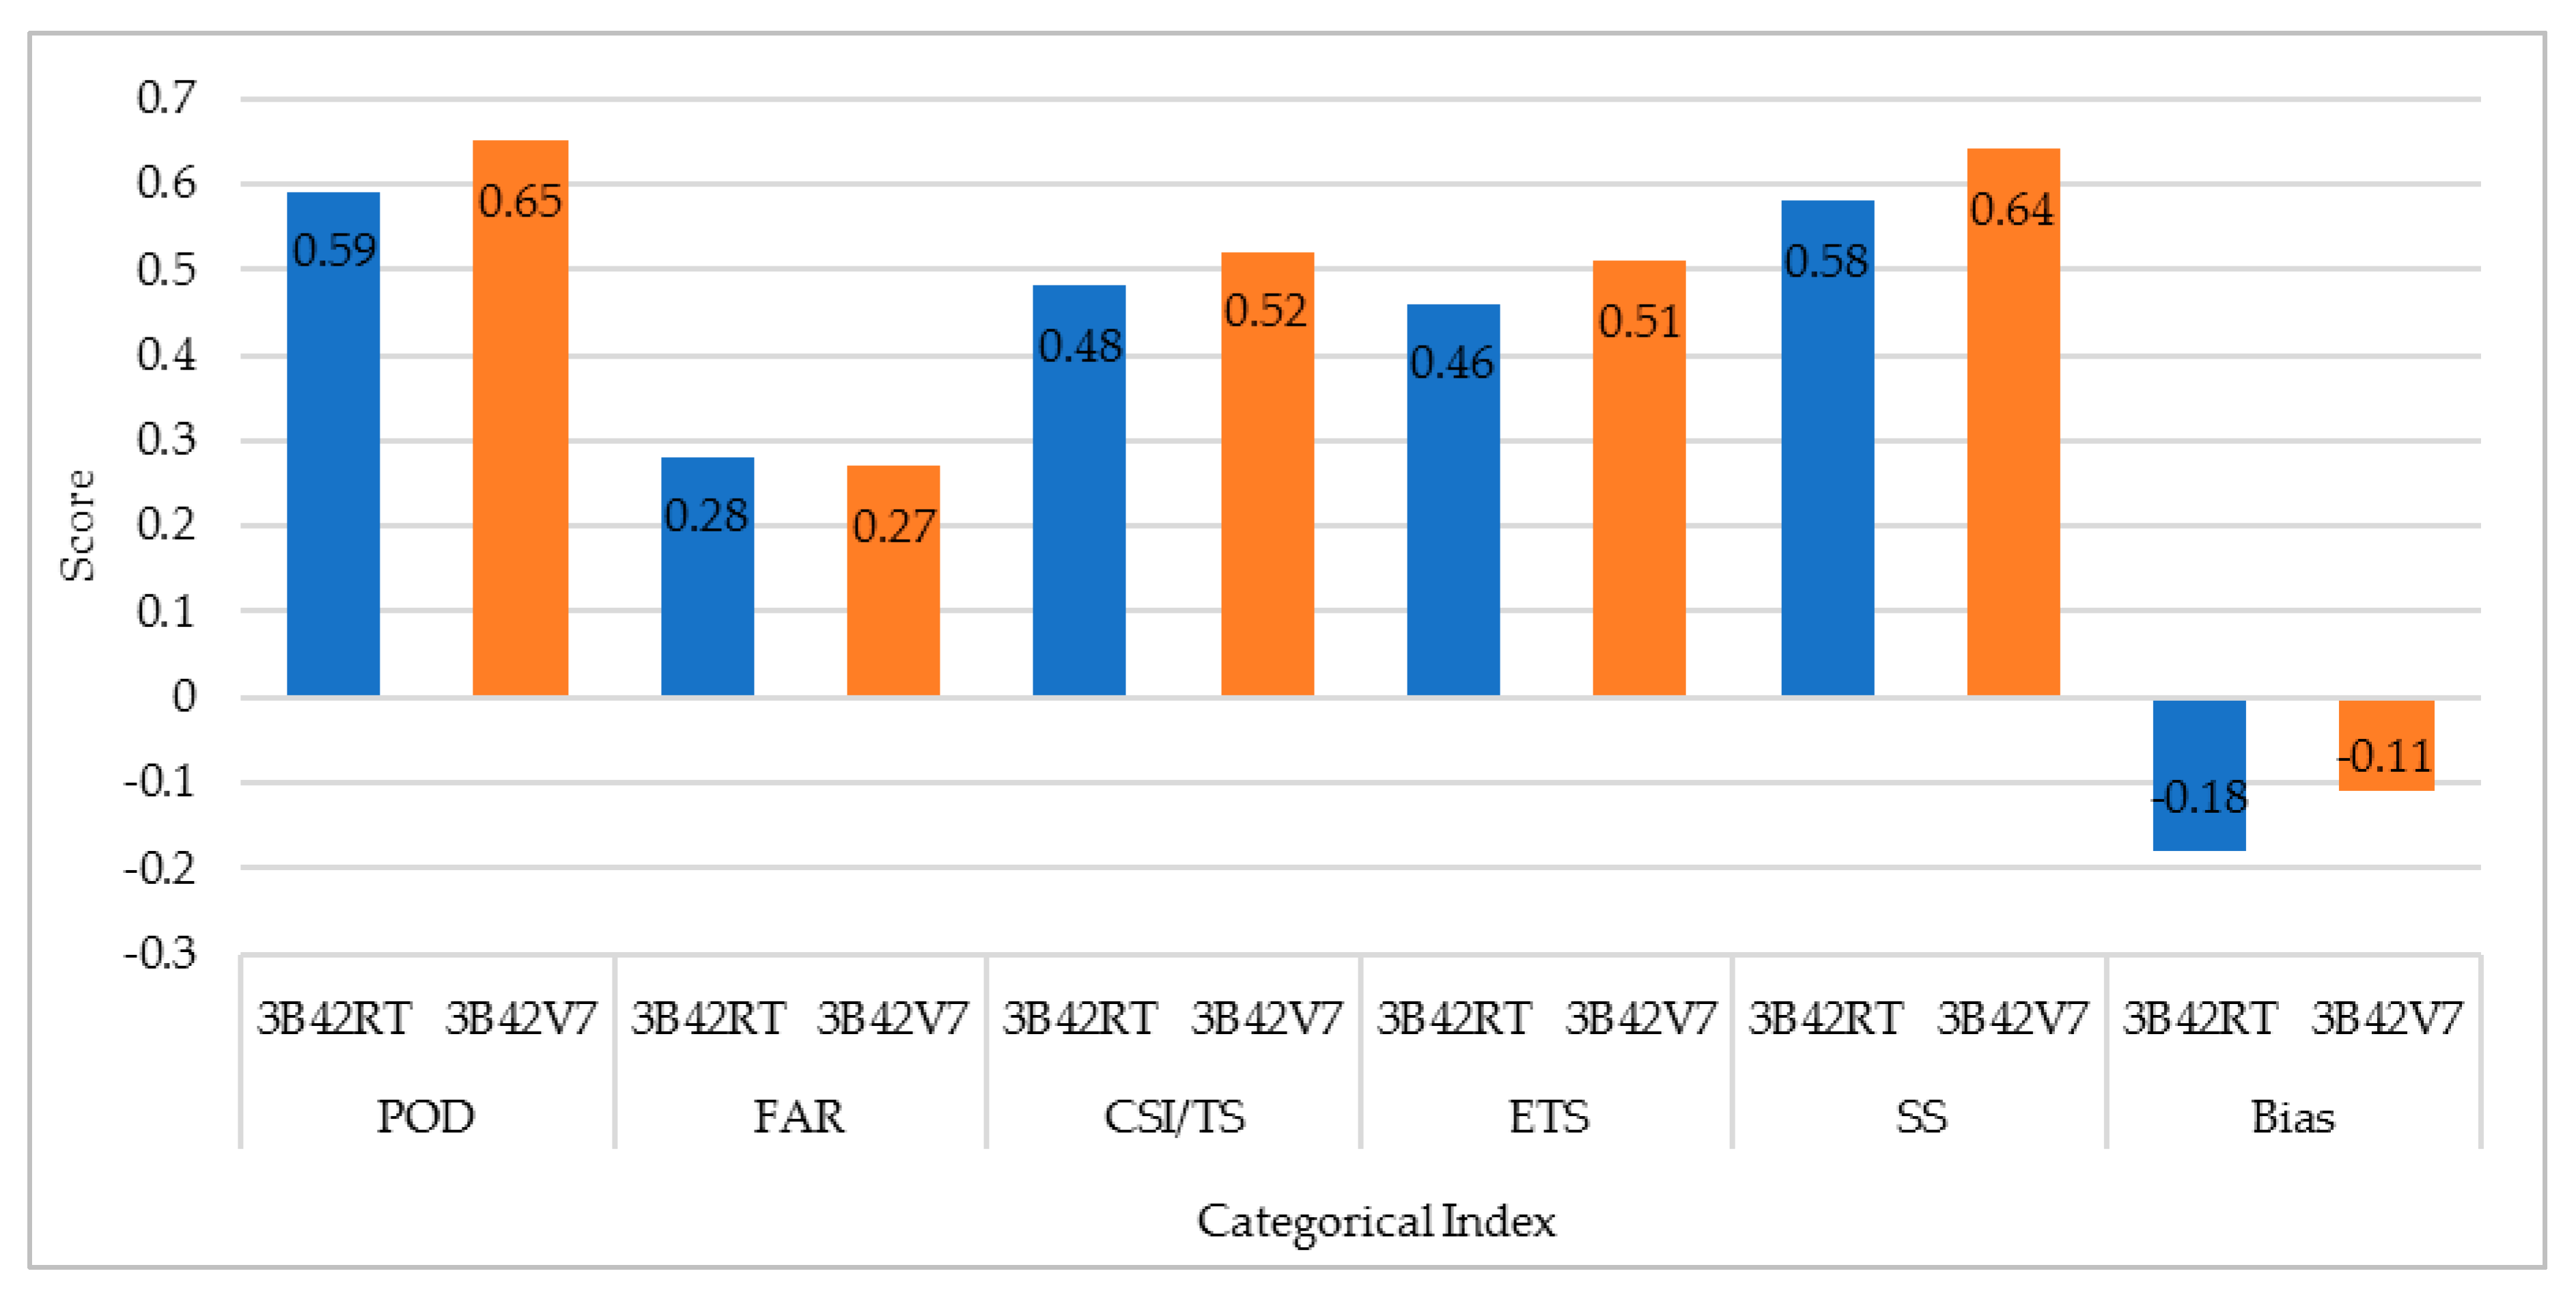
3.1.1. TMPA Performance Assessment Using Categorical Indices

The values of performance indices (as per Table 2) at a 3-h interval have been calculated and are shown in Figure 2. The Bias score for the entire period is −0.18 for 3B42RT and −0.11 for 3B42V7. The values of probability of detection (POD) and false alarm ratio (FAR) are 0.59 and 0.28, respectively, for 3B42RT, and 0.65 and 0.27, respectively, for 3BV7. The threat score (TS) or critical success index (CSI) measures the fraction of all rain events that were correctly identified and its ideal score should be ‘1’. In the current study, the calculated threat score is 0.48 and 0.52 for 3B42RT and 3B42V7, respectively. The equitable threat score (ETS), which estimates the skill of a measuring source relative to chance, has low values compared to TS. The skill score (SS) is 0.58 for 3B42RT and 0.64 for 3B42V7.

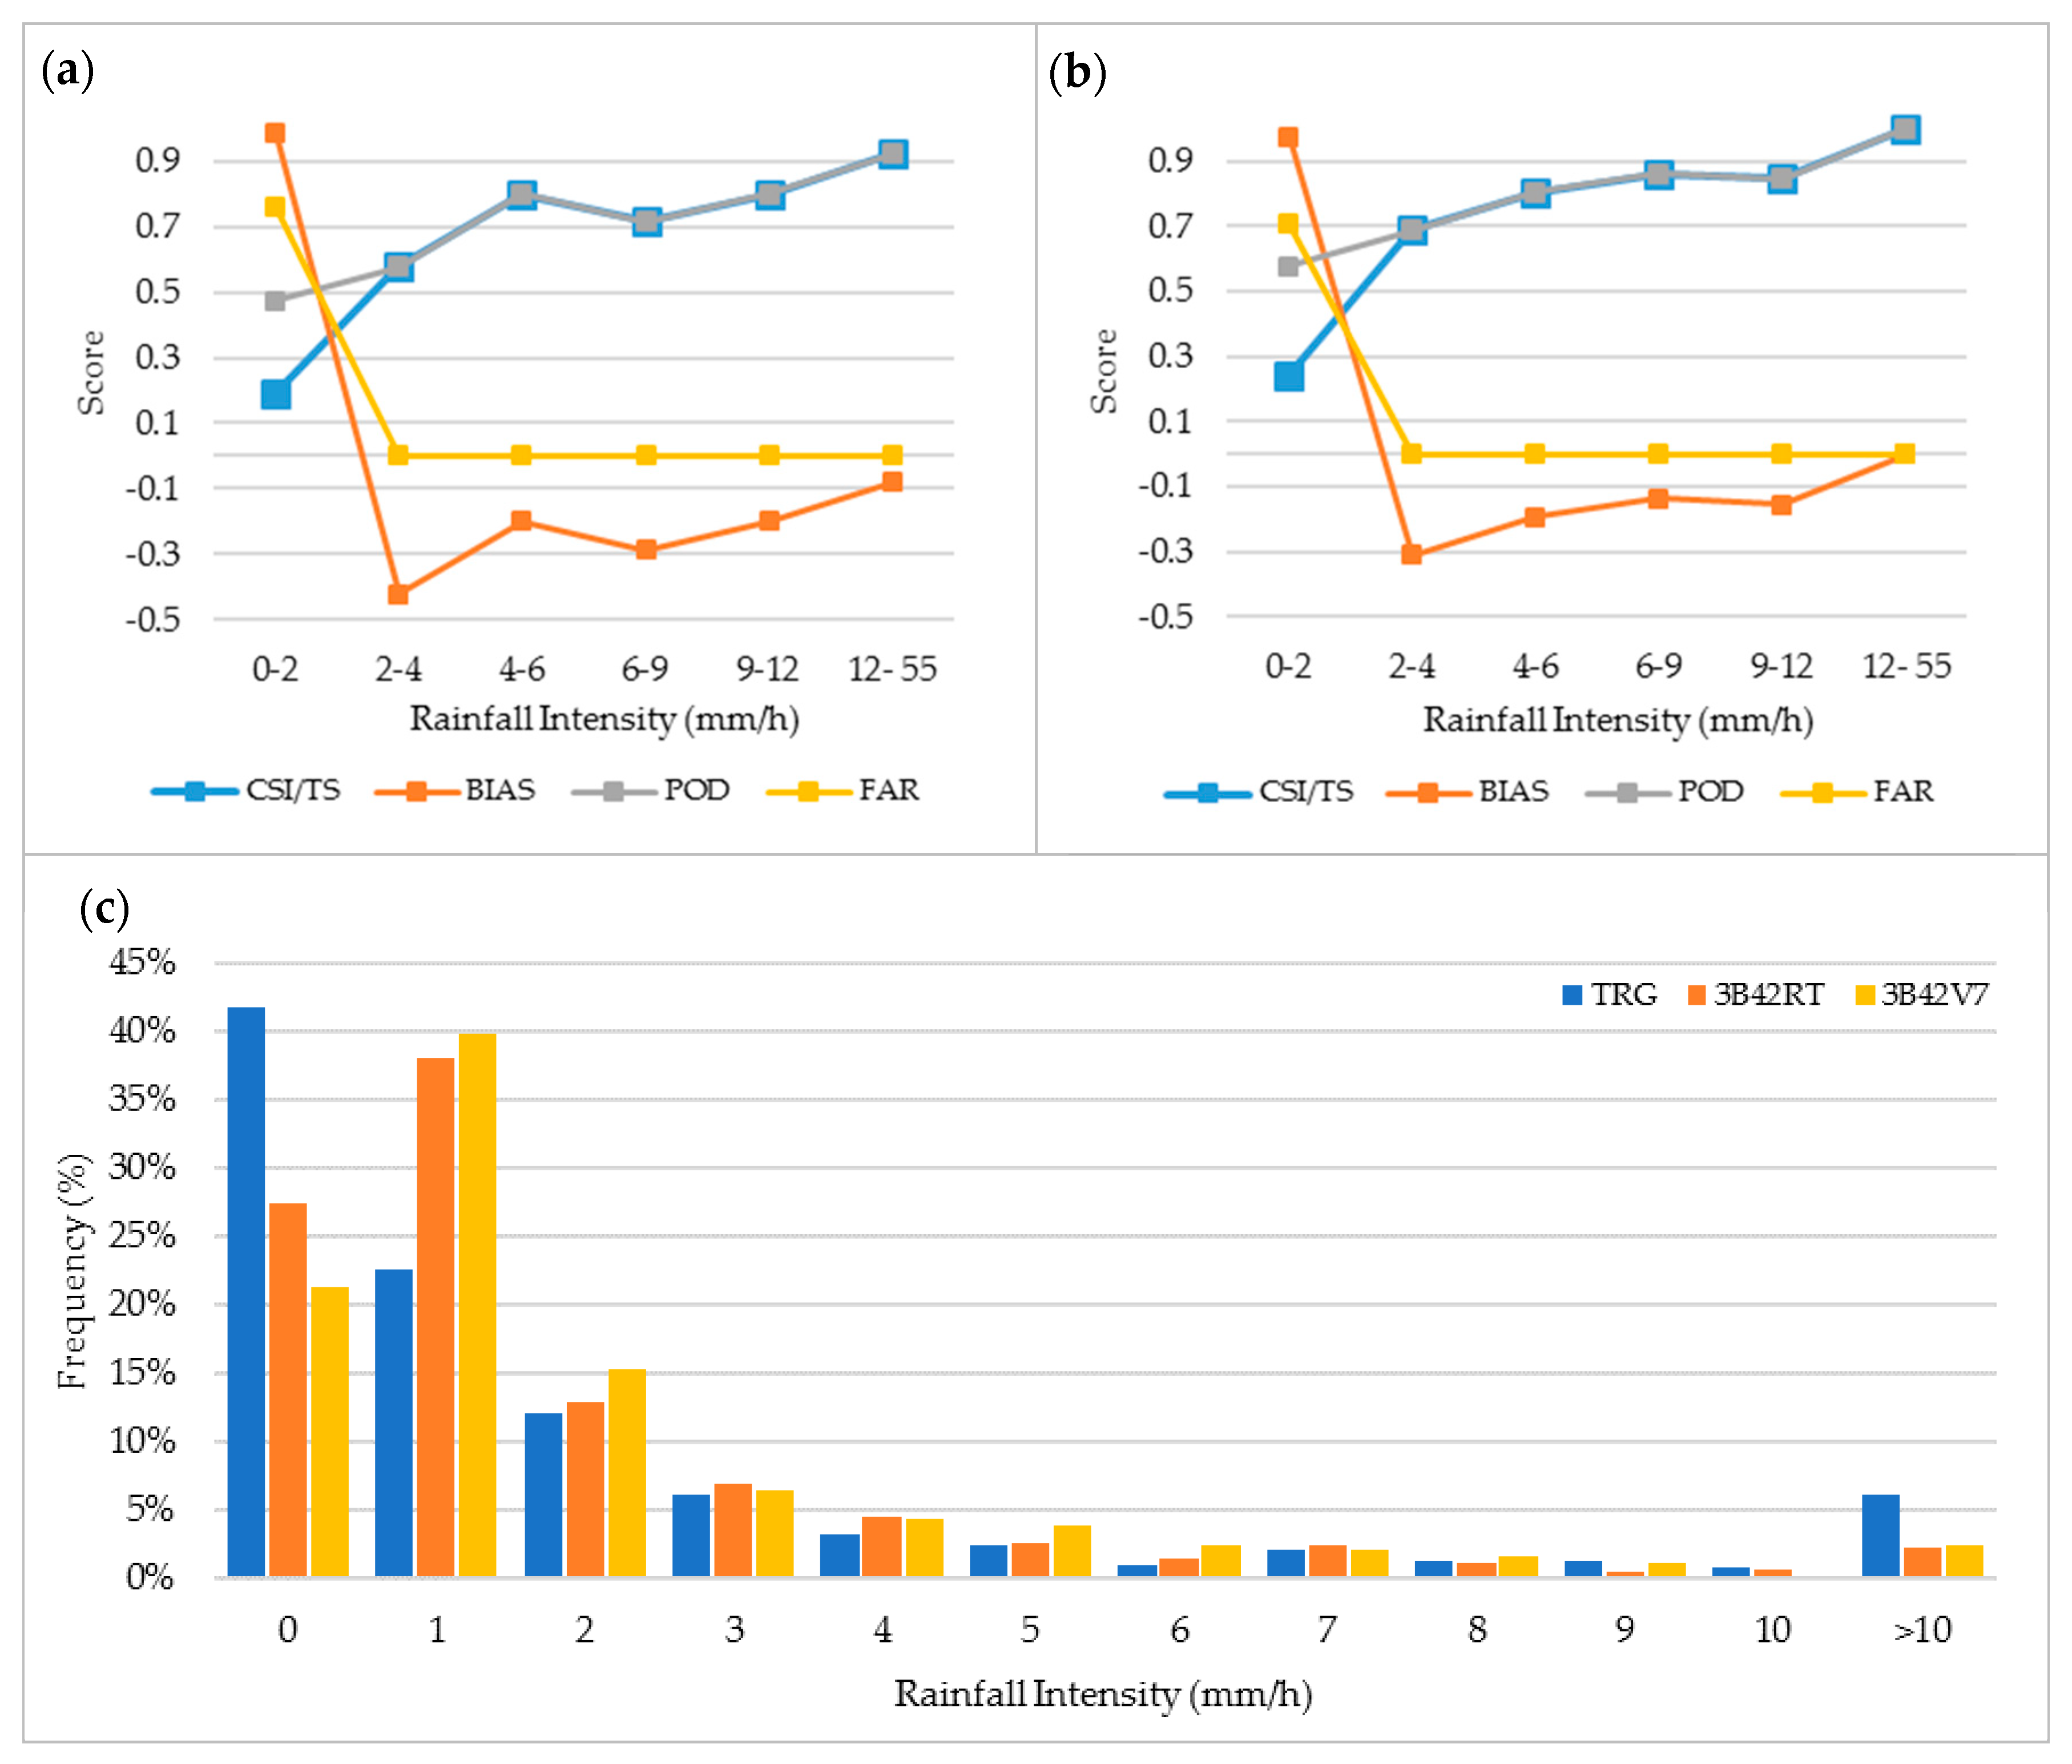
3.1.2. TMPA Performance as a Function of Rainfall Intensity

Skill scores for different performance indices have been calculated at various rainfall intensities to check TMPA’s performance in the detection of events at different rain intensities. The rain threshold to detect a rain/no-rain event is 0.1 mm/h for all rain intensity brackets. As shown in Figure 3a,b, for light rain events, both TMPA products have a high positive bias score (>0.9) and high FAR values, which indicate that the TMPA products erroneously detect a high number of rainy days. Overall, TMPA products demonstrate a better performance for high-intensity rain events. It should also be noted that the higher the rainfall intensities, the smaller the number of data samples available for skill scores calculation. Figure 3c displays a TRG, 3B42RT, and 3B42V7 histogram which shows rainfall distribution frequencies. Histograms of all three datasets are right-skewed, and around 75% of the events fall under 0–2 mm/h rainfall intensities.
TMPA’s performance in the detection of various rainfall intensities has been examined by classifying TRG rain rates into different rain categories (Table 3). TRG rain intensities have been categorized as light rain, moderate rain, heavy rain, very heavy rain, and extreme rain [76]. Figure 4a,b describes how 3B42RT and 3B42V7 classify rain events with reference to TRG classification. 3B42RT detects 58.5% ‘light rain’ events as ‘no rain’ and only 21.6% ‘light rain’ events are detected correctly, while 19.9% of ‘light rain’ events are detected as ‘moderate’ and ‘heavy rain’ events. Similarly, 3B42RT detects 25.9% ‘moderate rain’ events, 21.7% ‘heavy rain events’, and only 9.5% ‘very heavy rain’ events correctly. 3B42RT detects all ‘extreme events’ as ‘heavy rain’ intensity rain events. 3B42V7, on the other hand, detects 51.1% ‘light rain’ events as ‘no rain’ and only 25,6% ‘light rain’ events are detected correctly, while 23.3% of ‘light rain’ events are detected as ‘moderate’ and ‘heavy rain’ events. Similarly, 3B42V7 detects 31.3% ‘moderate rain’ events, 33.7% ‘heavy rain’ events, and only 4.8% ‘very heavy’ rain events correctly. TMPA detects all extreme events as very heavy rain intensity rain events (see Figure 4c).

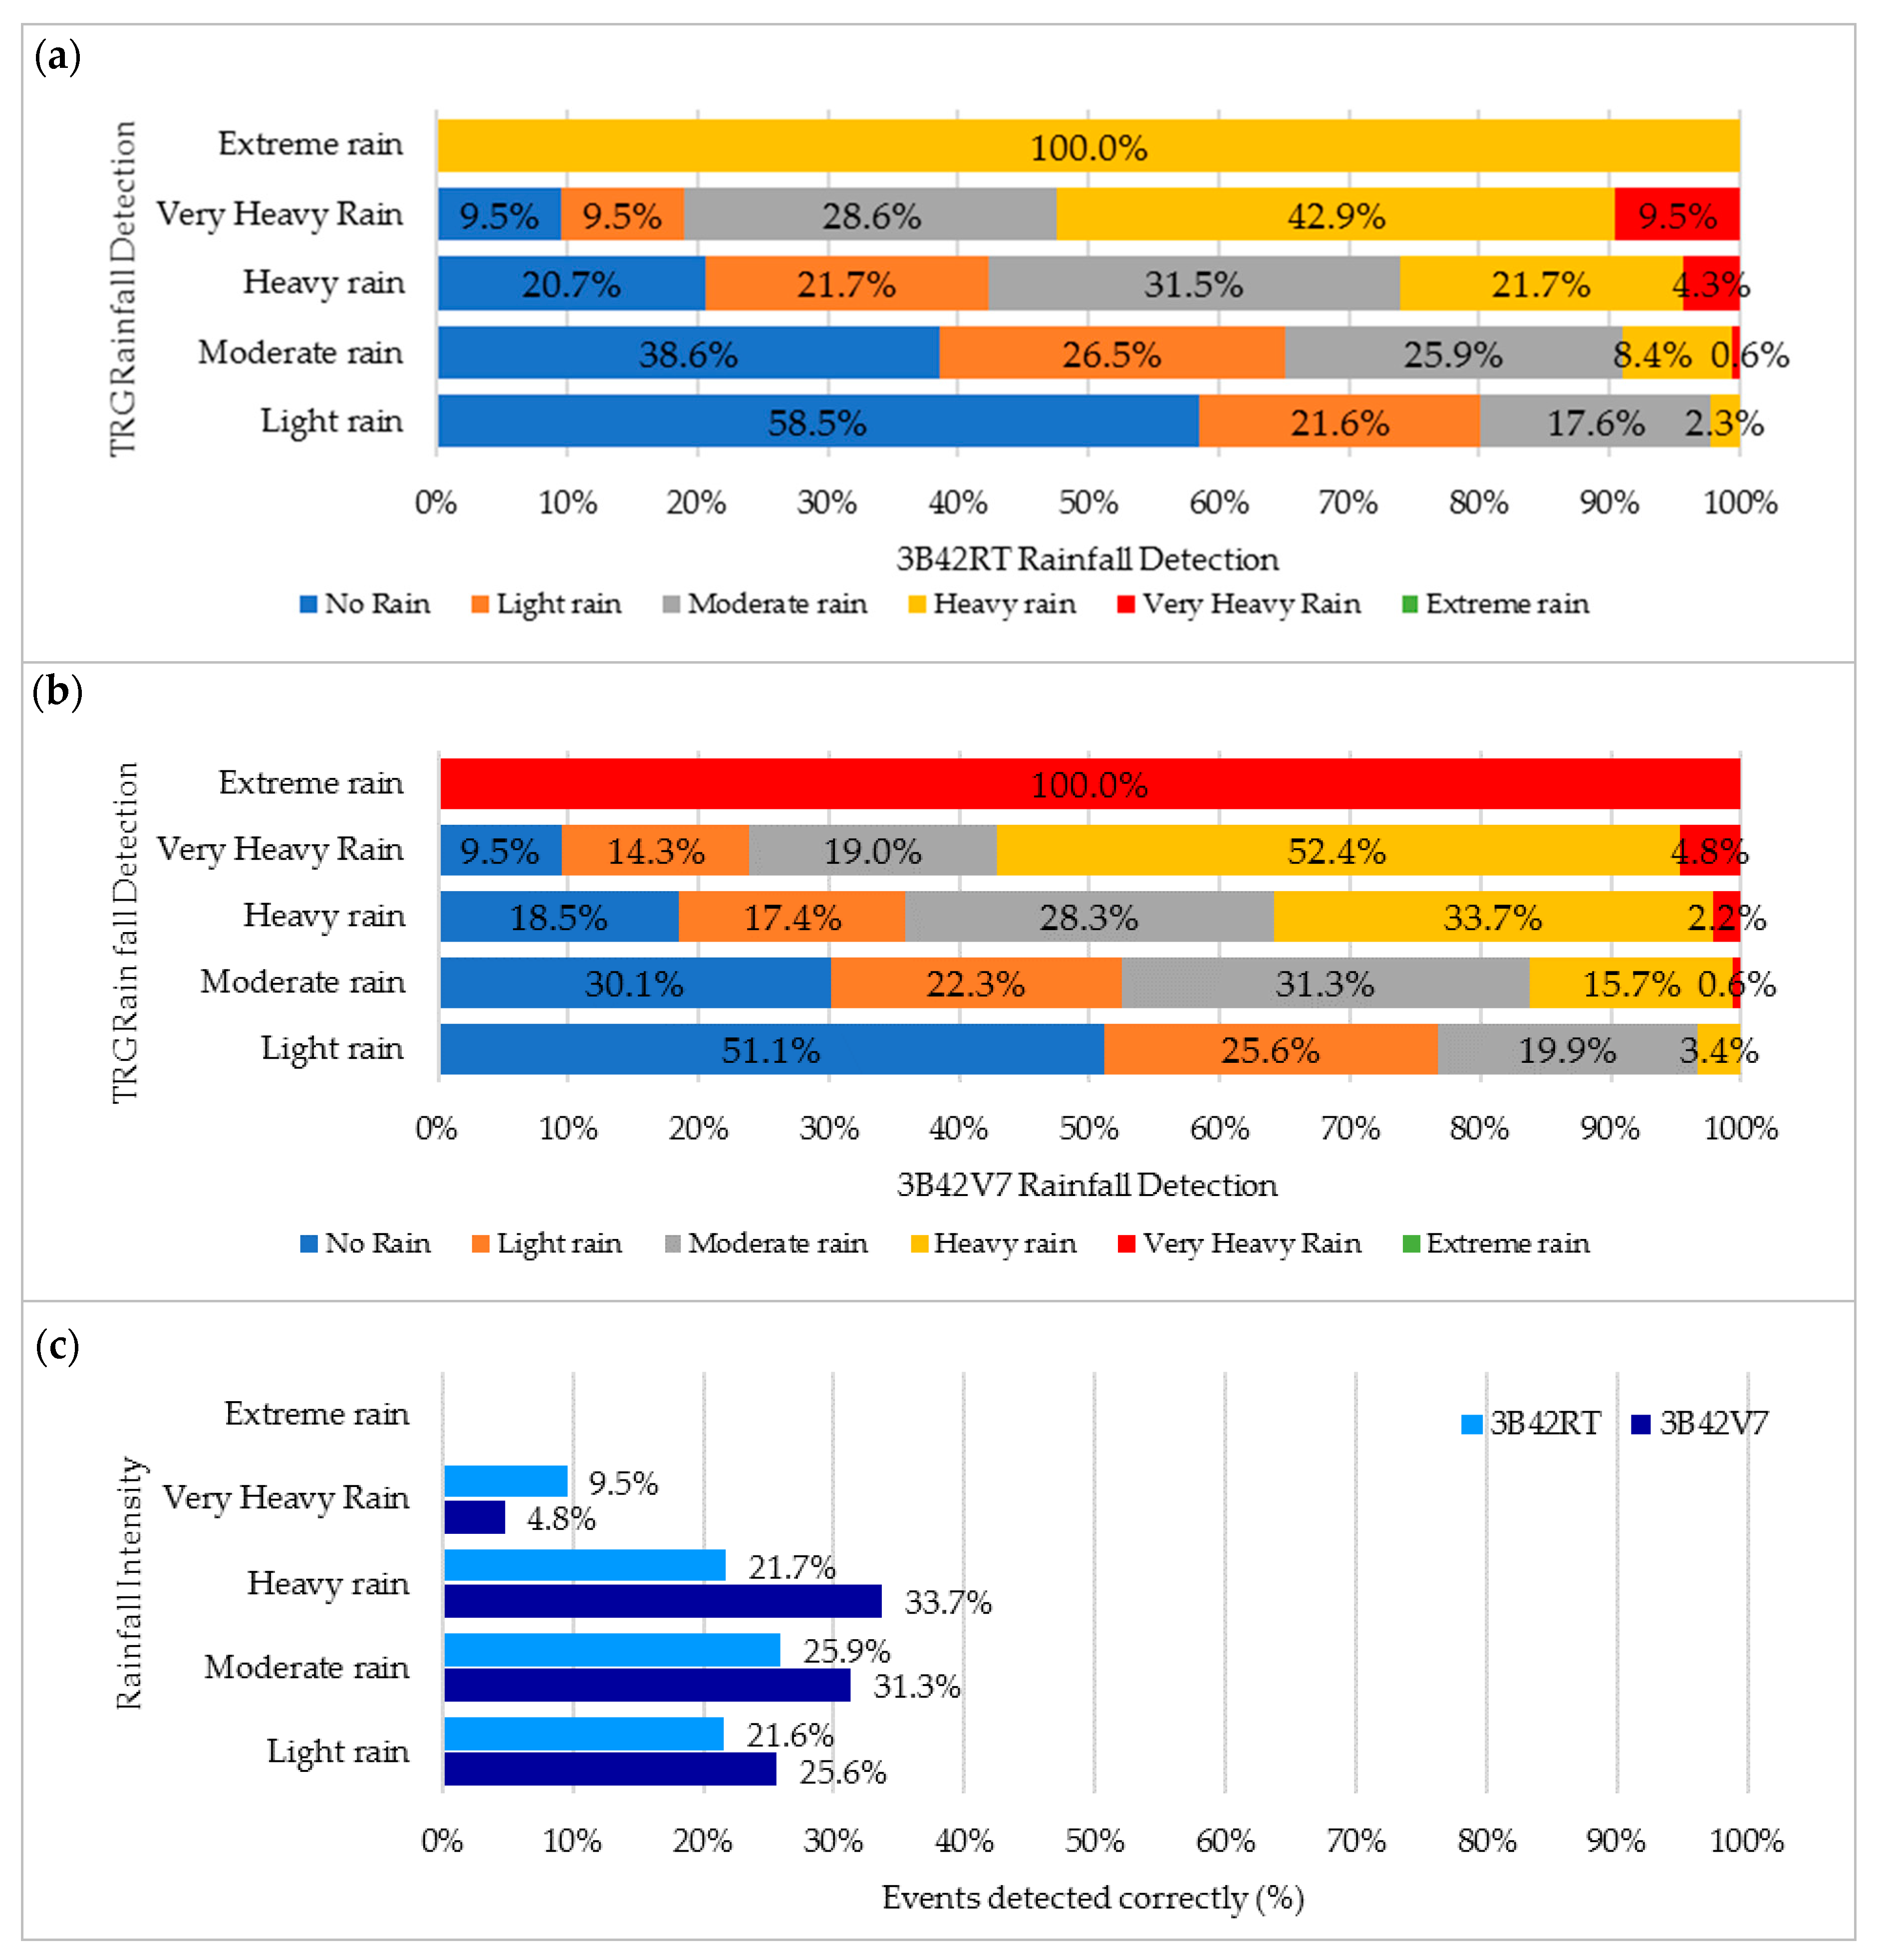
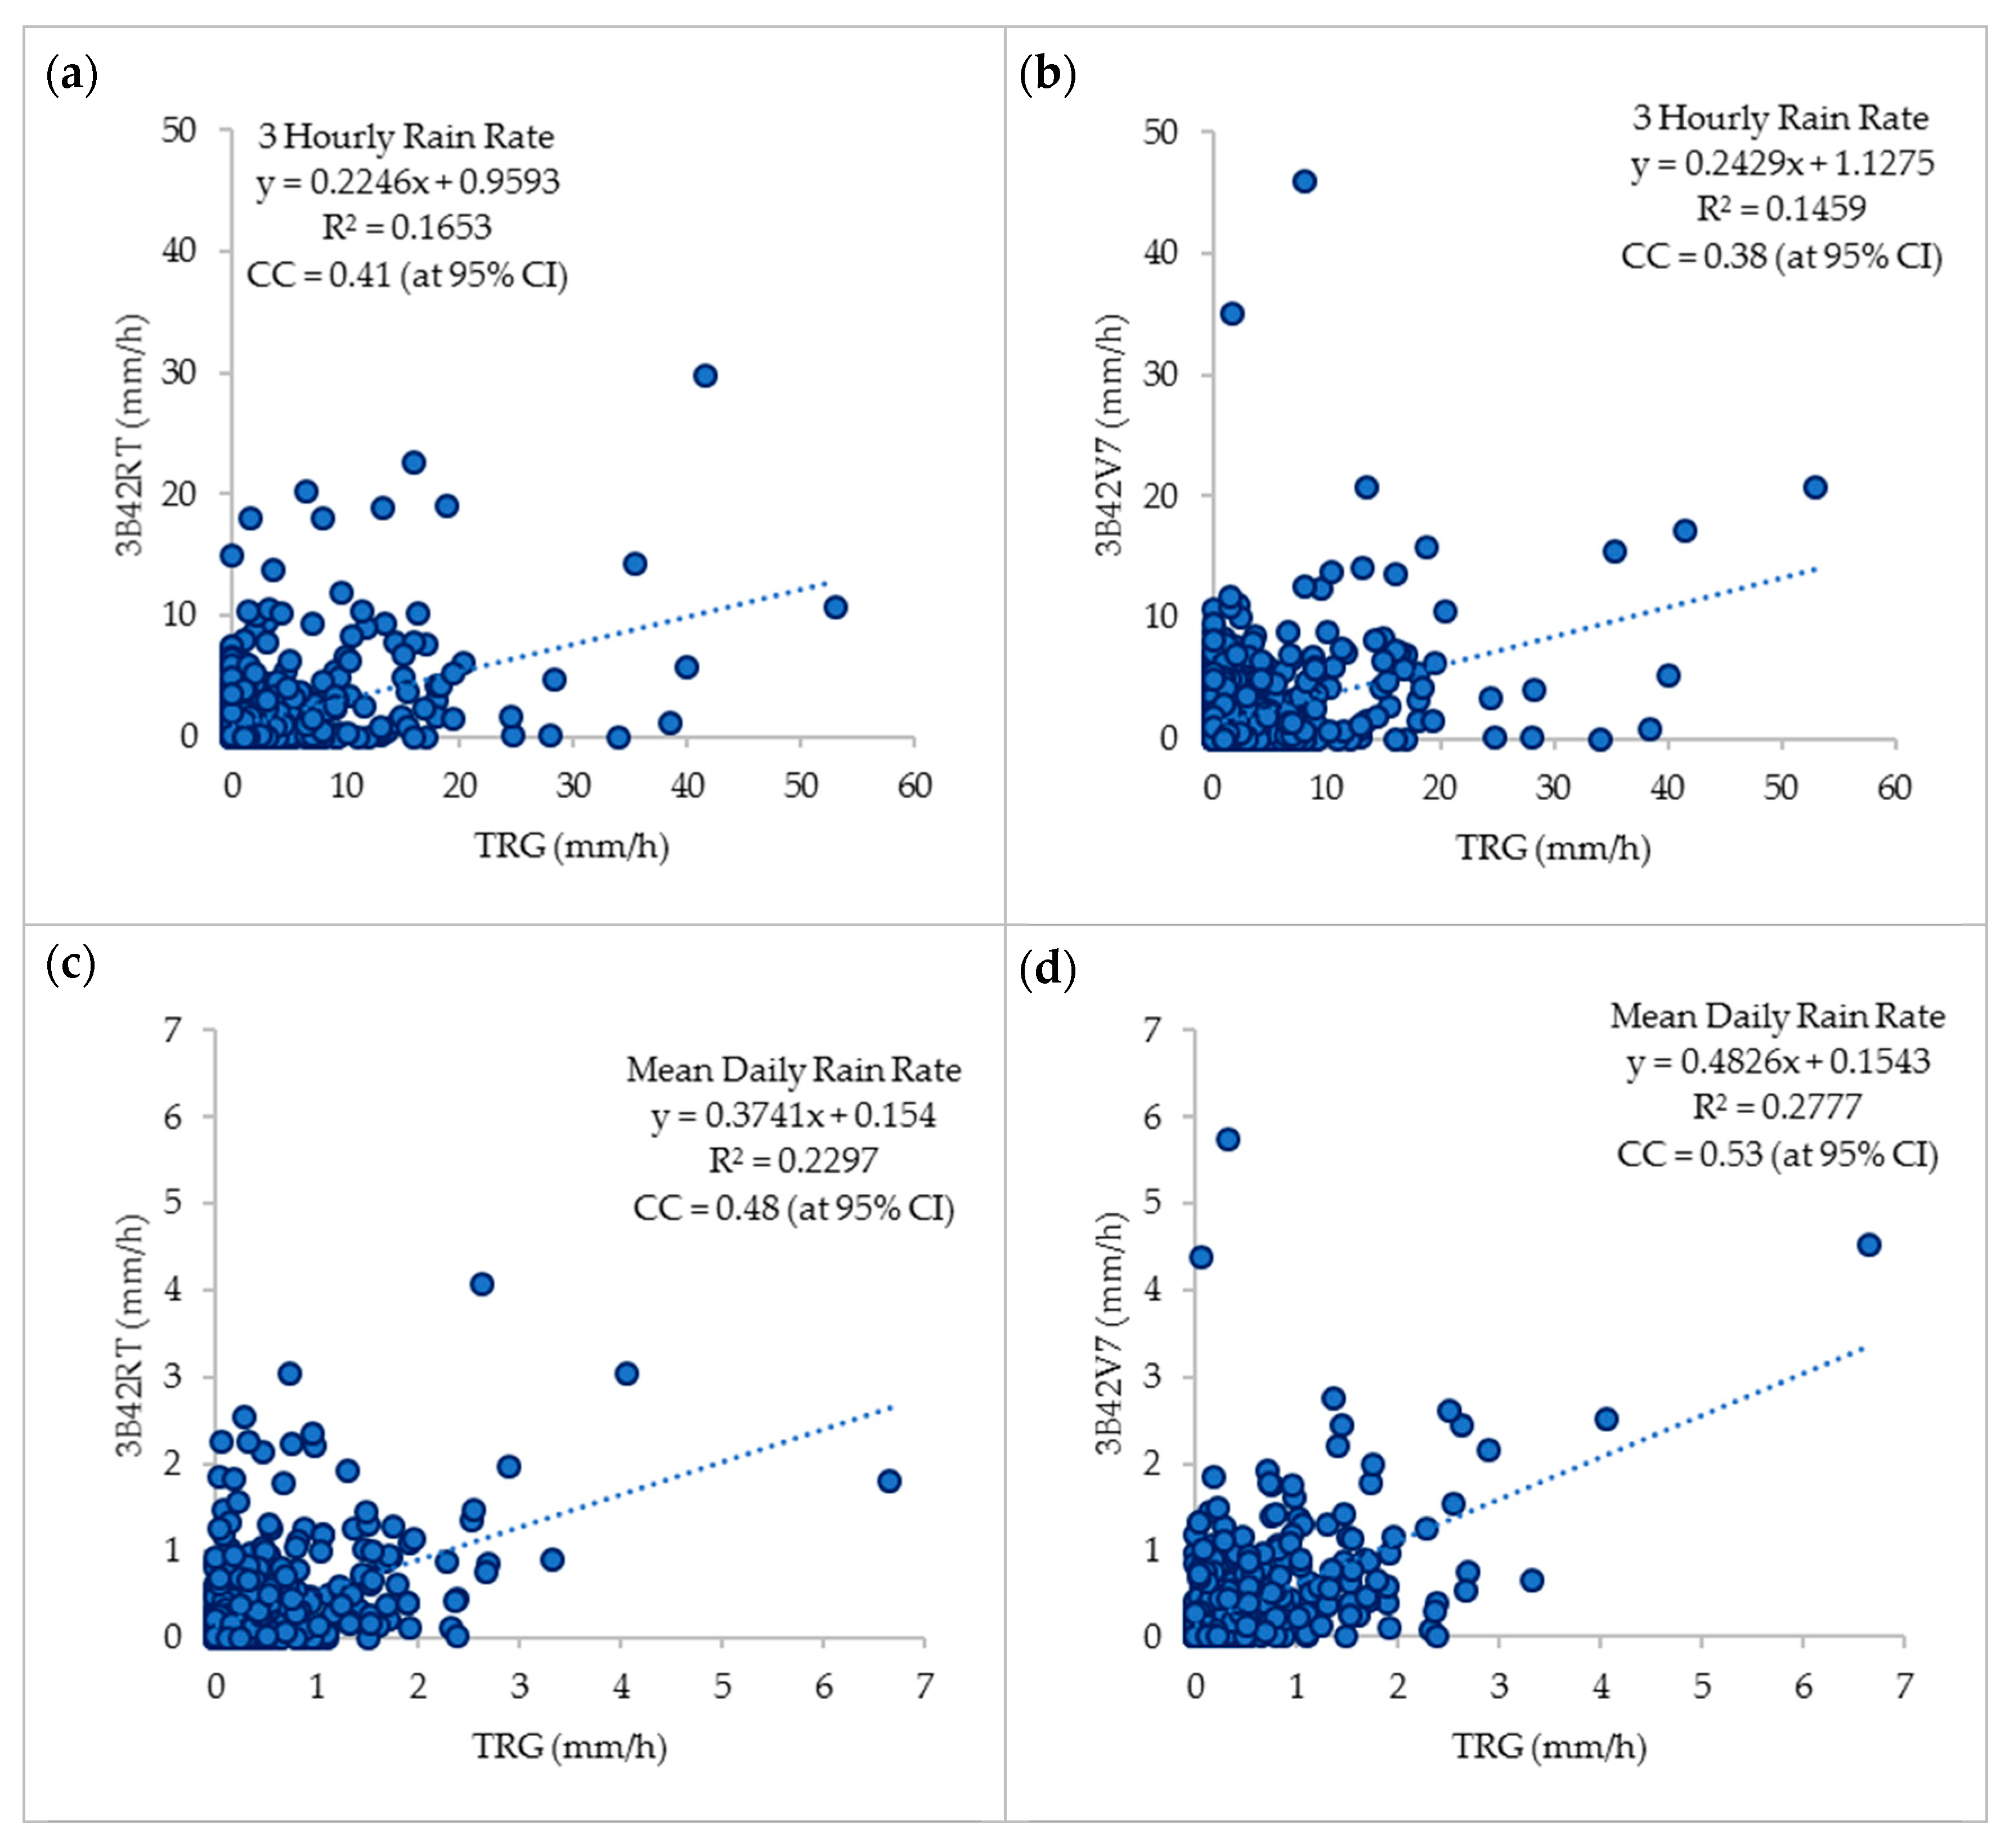
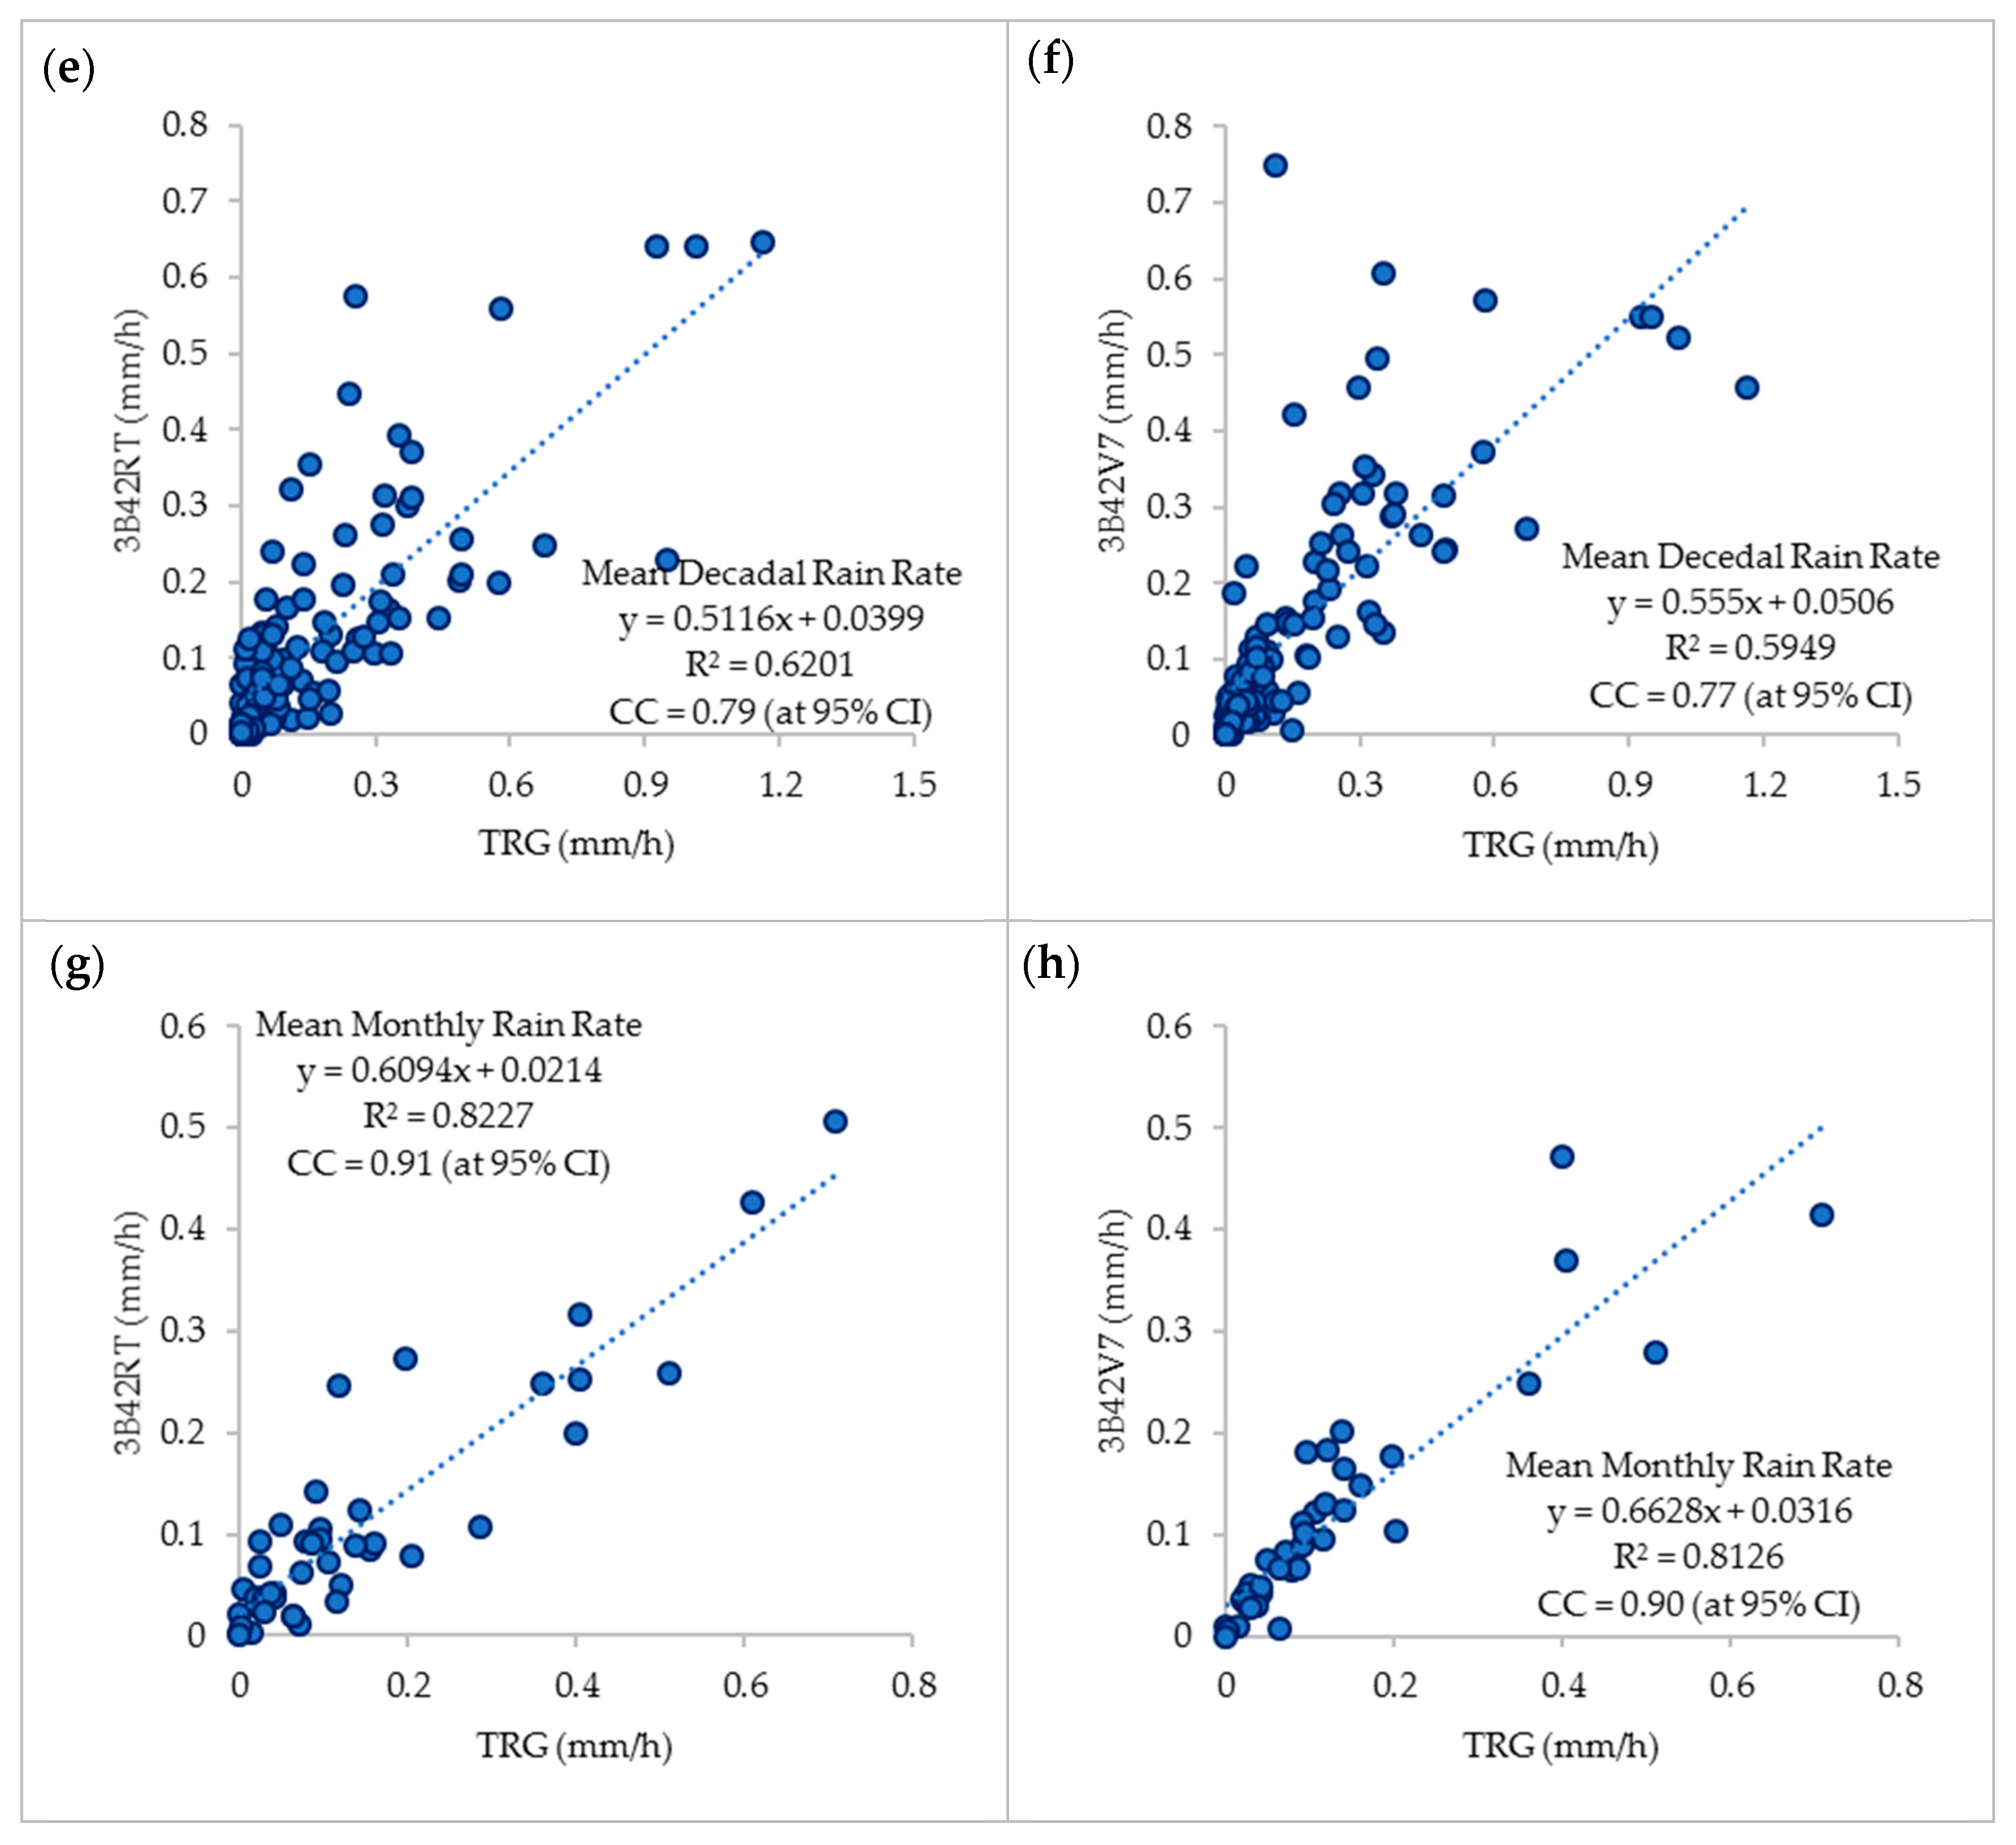
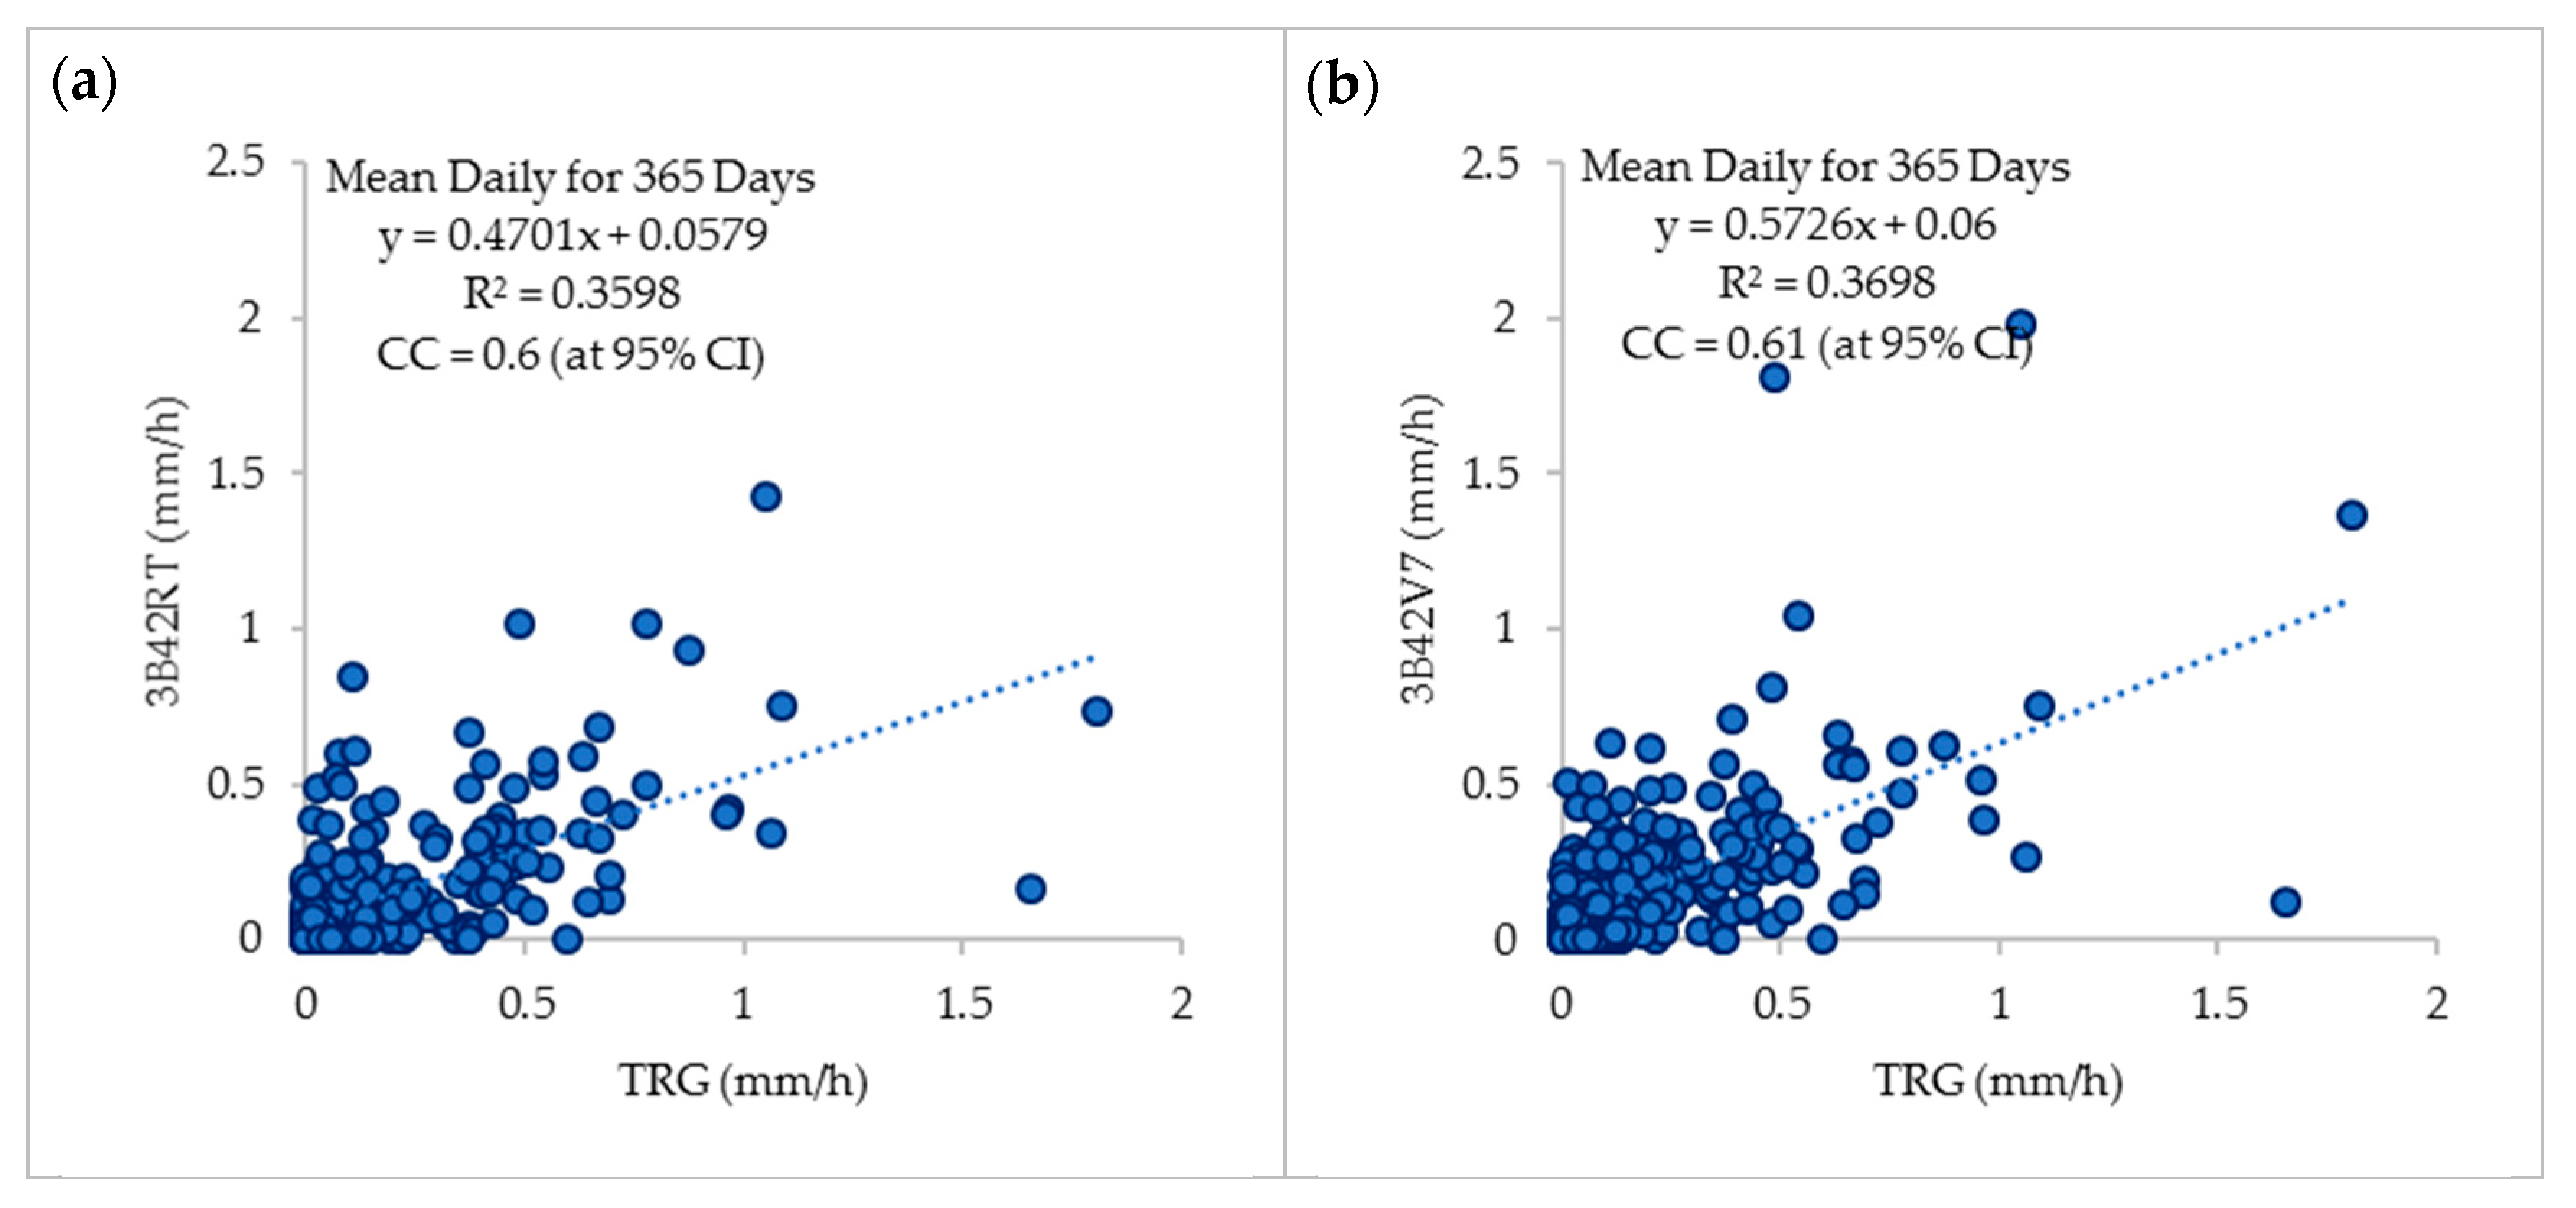
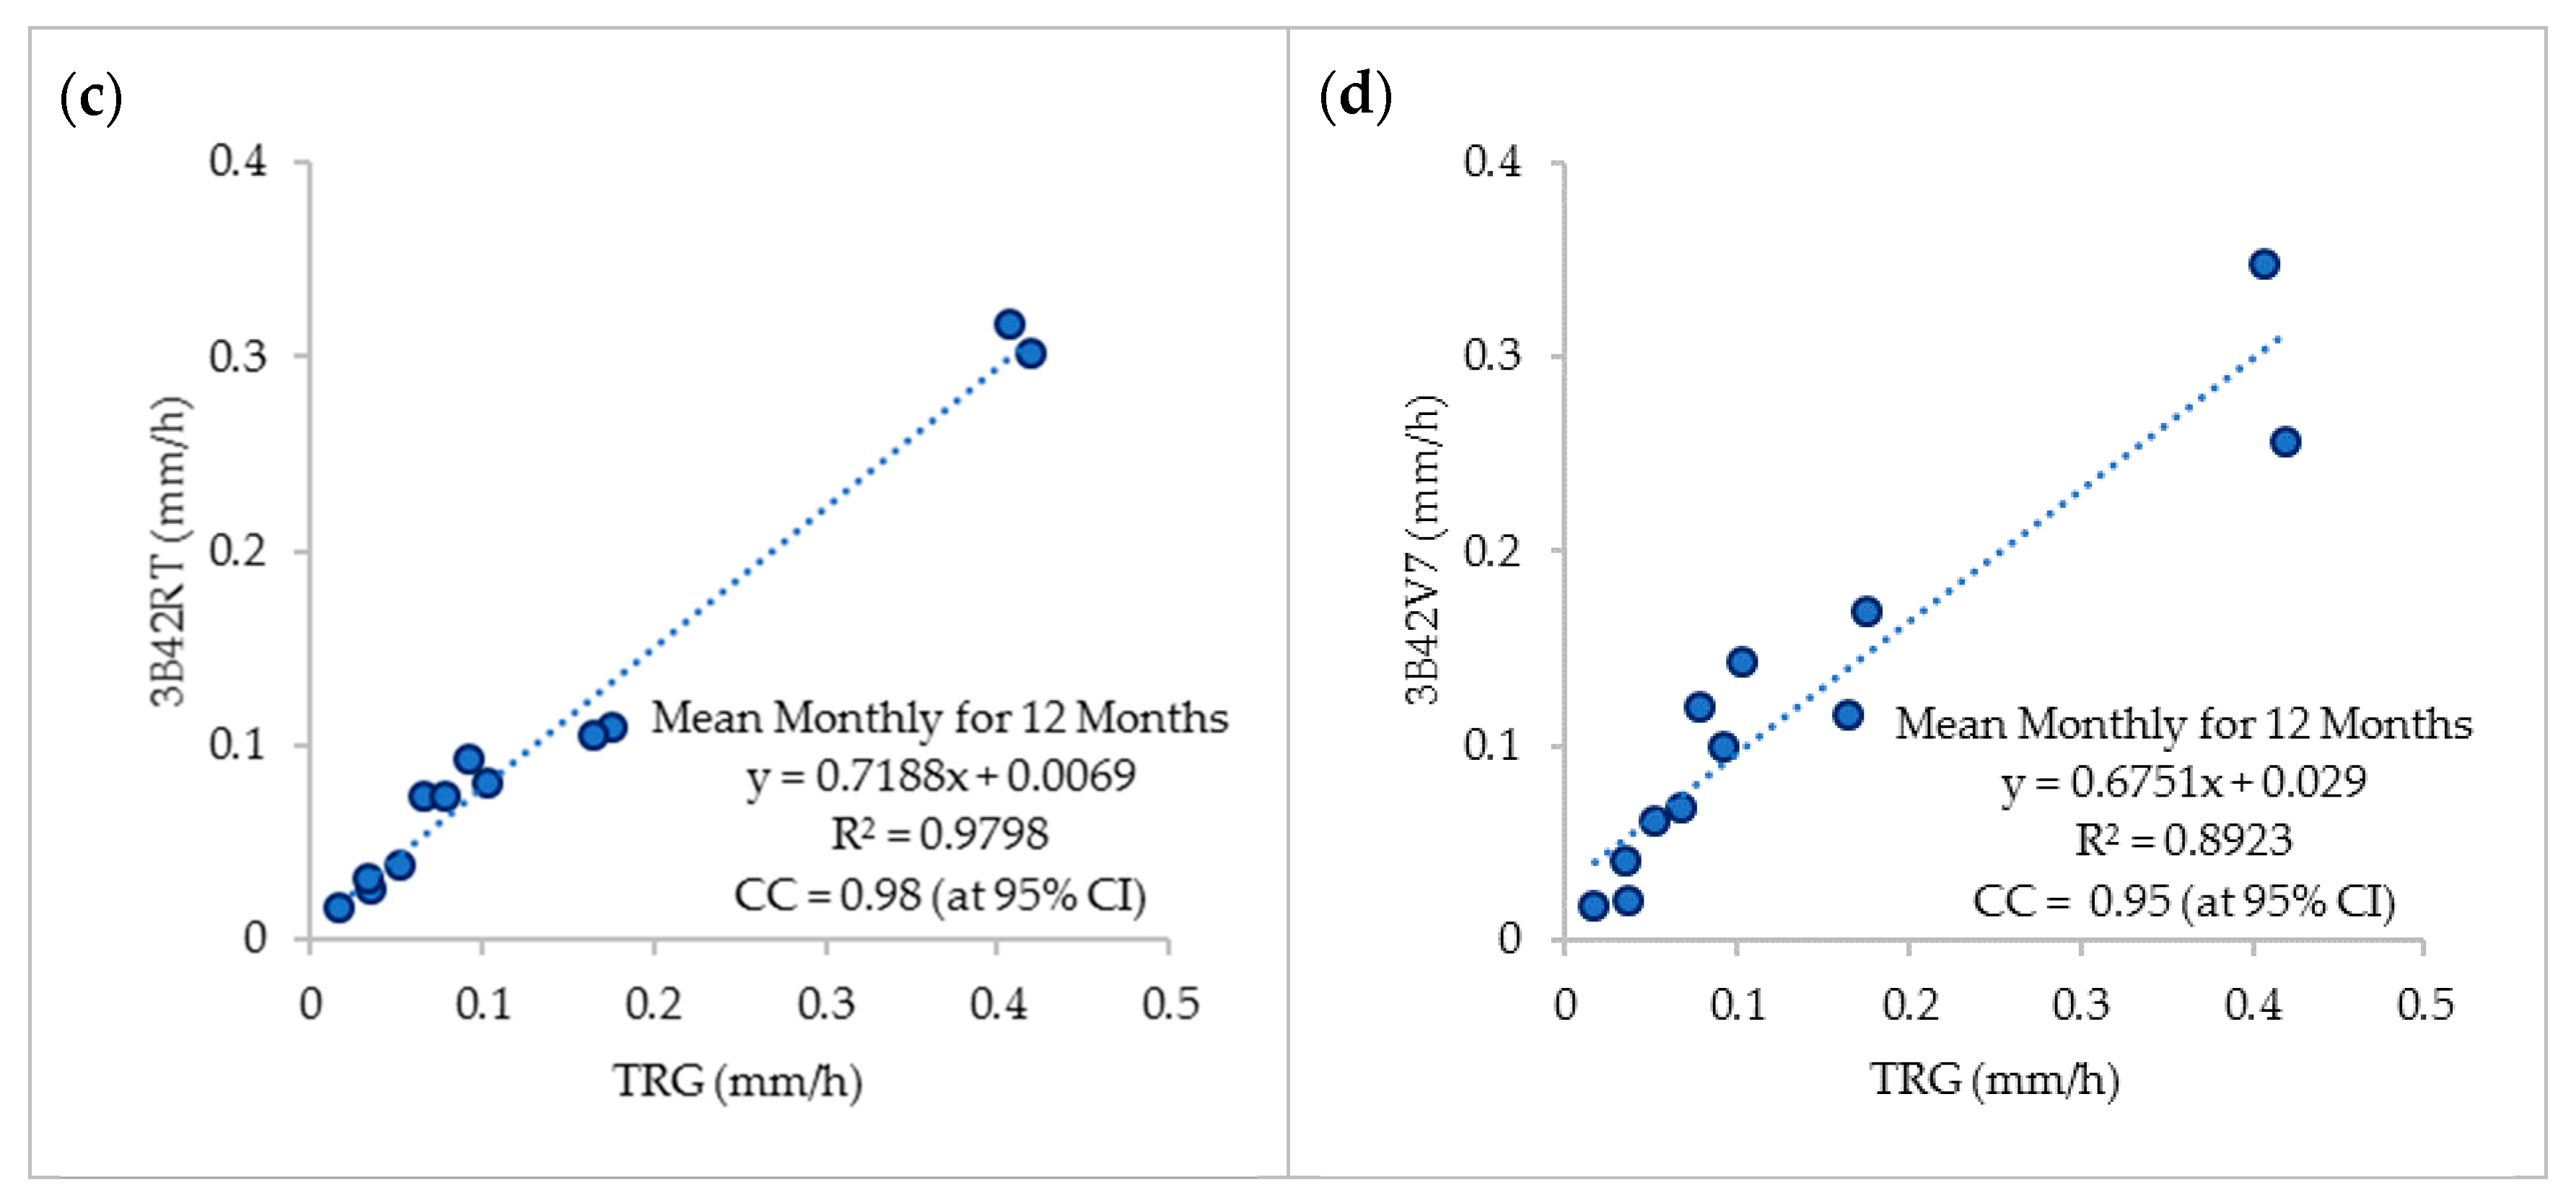
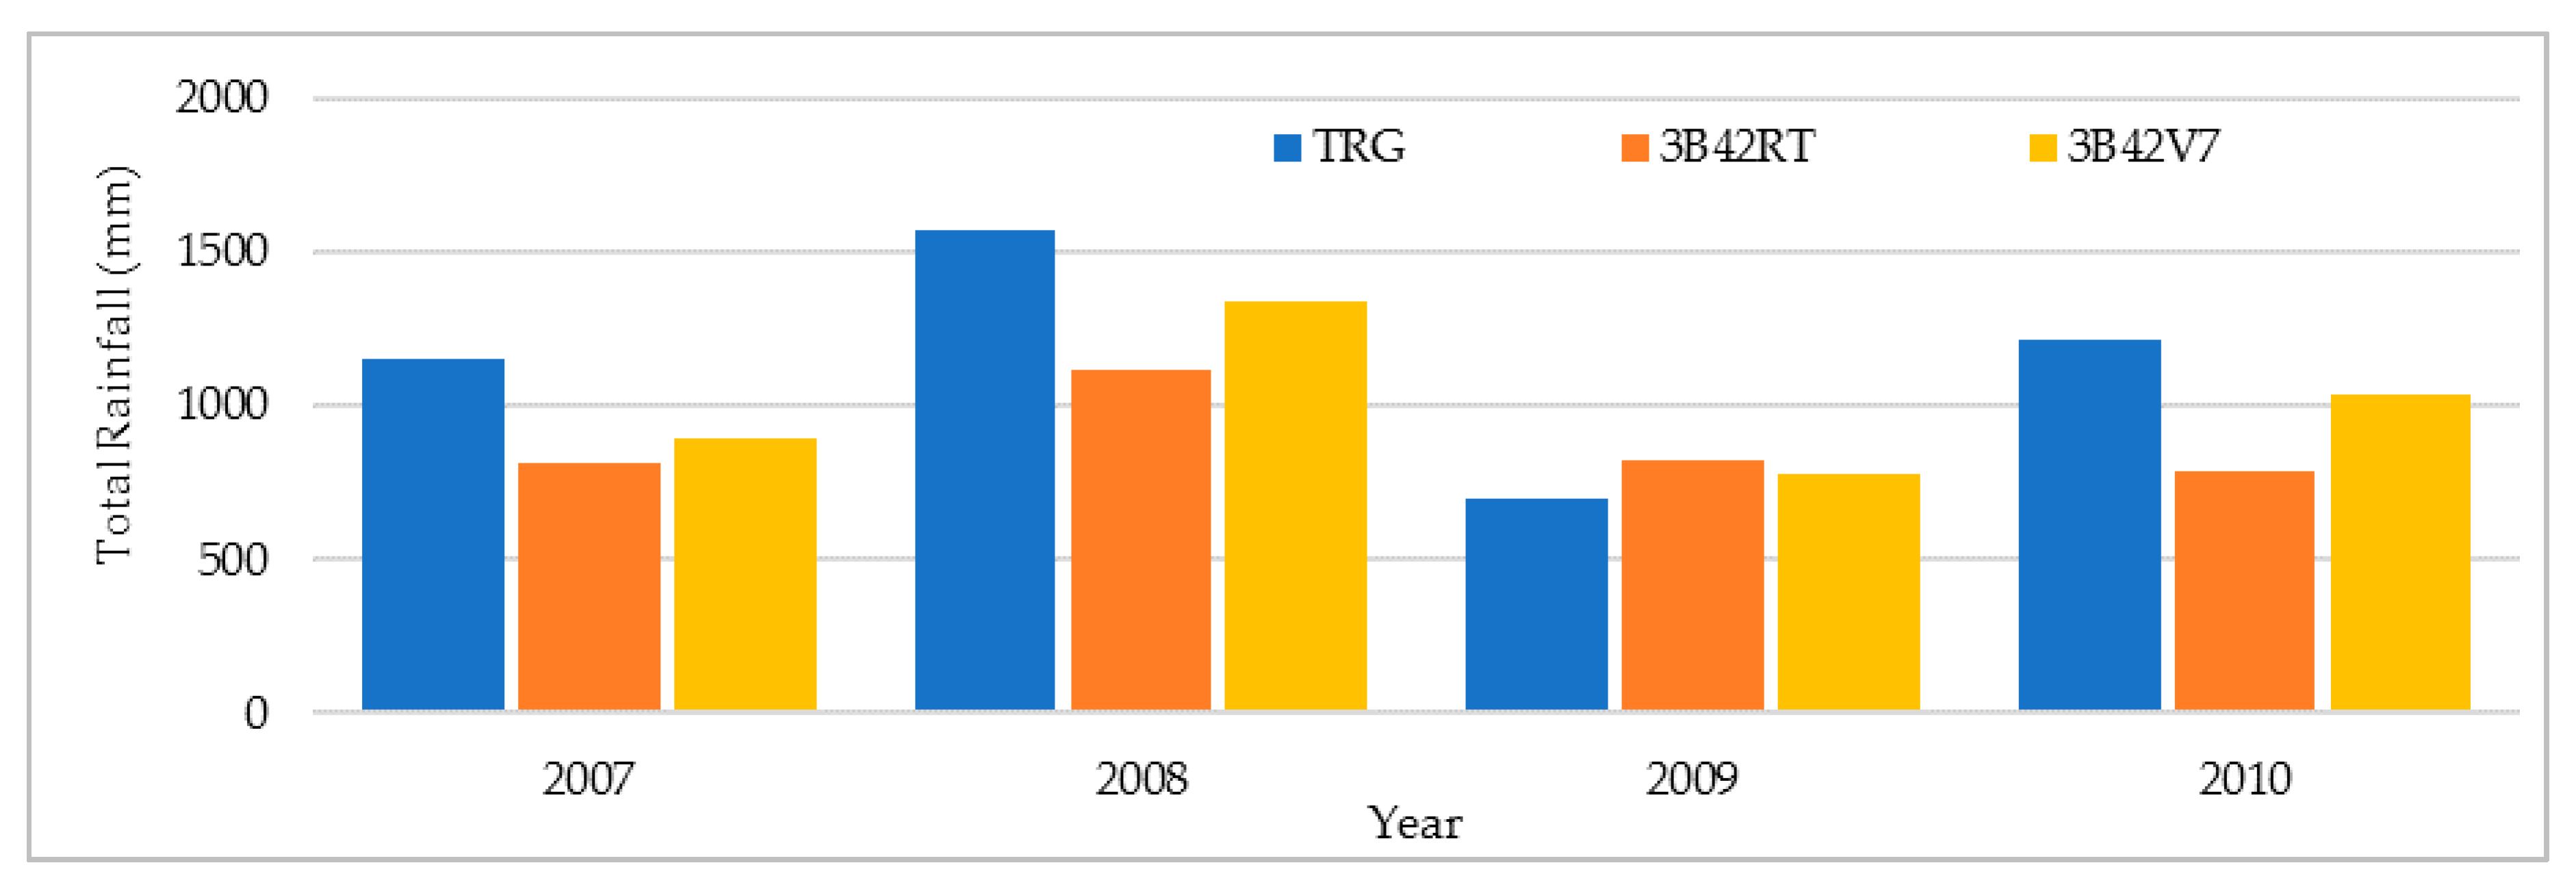
3.1.3. TMPA Rainfall Validation

On average, 3B42RT and 3B42V7 give rain rates of 1.50 and 1.72 mm/h, respectively, at a three-hourly time scale, while the TRG rain rate is 2.42 mm/h (see Table 4). The mean bias error for 3B42RT is −0.92 mm/h, while it is −0.70 mm/h for 3B42V7. The negative sign shows an overall underestimation of rainfall by TMPA products. Mean absolute errors at a three-hourly scale are 2.47 mm/h and 2.46 mm/h, respectively. The root means square error, which gives more weight to larger errors, has a value of 4.88 mm/h for 3B42RT and 5.01 mm/h for 3B42V7. Figure 5a,b shows the scatter plots of TRG and TMPA product measurements. The value of the correlation coefficient at a three-hourly scale is 0.41 for 3B42RT and 0.38 for 3B43V7.
Scatterplots of TMPA products vs. TRG at various time scales are shown in Figure 5 and Figure 6. These scatterplots show that the value of the correlation coefficient between TMPA products and TRG measurements is improved when hourly rain rates are averaged at daily, decadal, and monthly time intervals. CC is the highest at the monthly time interval for both products when compared to shorter time intervals. Validation statistics, summarized in Table 4, indicate error statistics being ameliorated when shifted from brief to prolonged time intervals. Errors, i.e., MBE, MAE, and RMSE, are minimum at the monthly time interval. Standard deviation values calculated at various timescales show a quite low skill of TMPA products in capturing rainfall variability, especially at a 3-h timescale. This gap in rainfall variability is reduced at higher timescales.
Yearly accumulated rainfall comparisons of TRG, 3B43RT, and 3B42v7 are shown in Figure 7. TMPA products underestimate the rainfall amount in all years except 2009, when they slightly overestimate rainfall. Overall, 3B42RT underestimates −24% of the total rainfall amount, while 3B42V7 underestimates −13% of the total rainfall amount.

3.2. TMPA Products Evaluation for Different Seasons

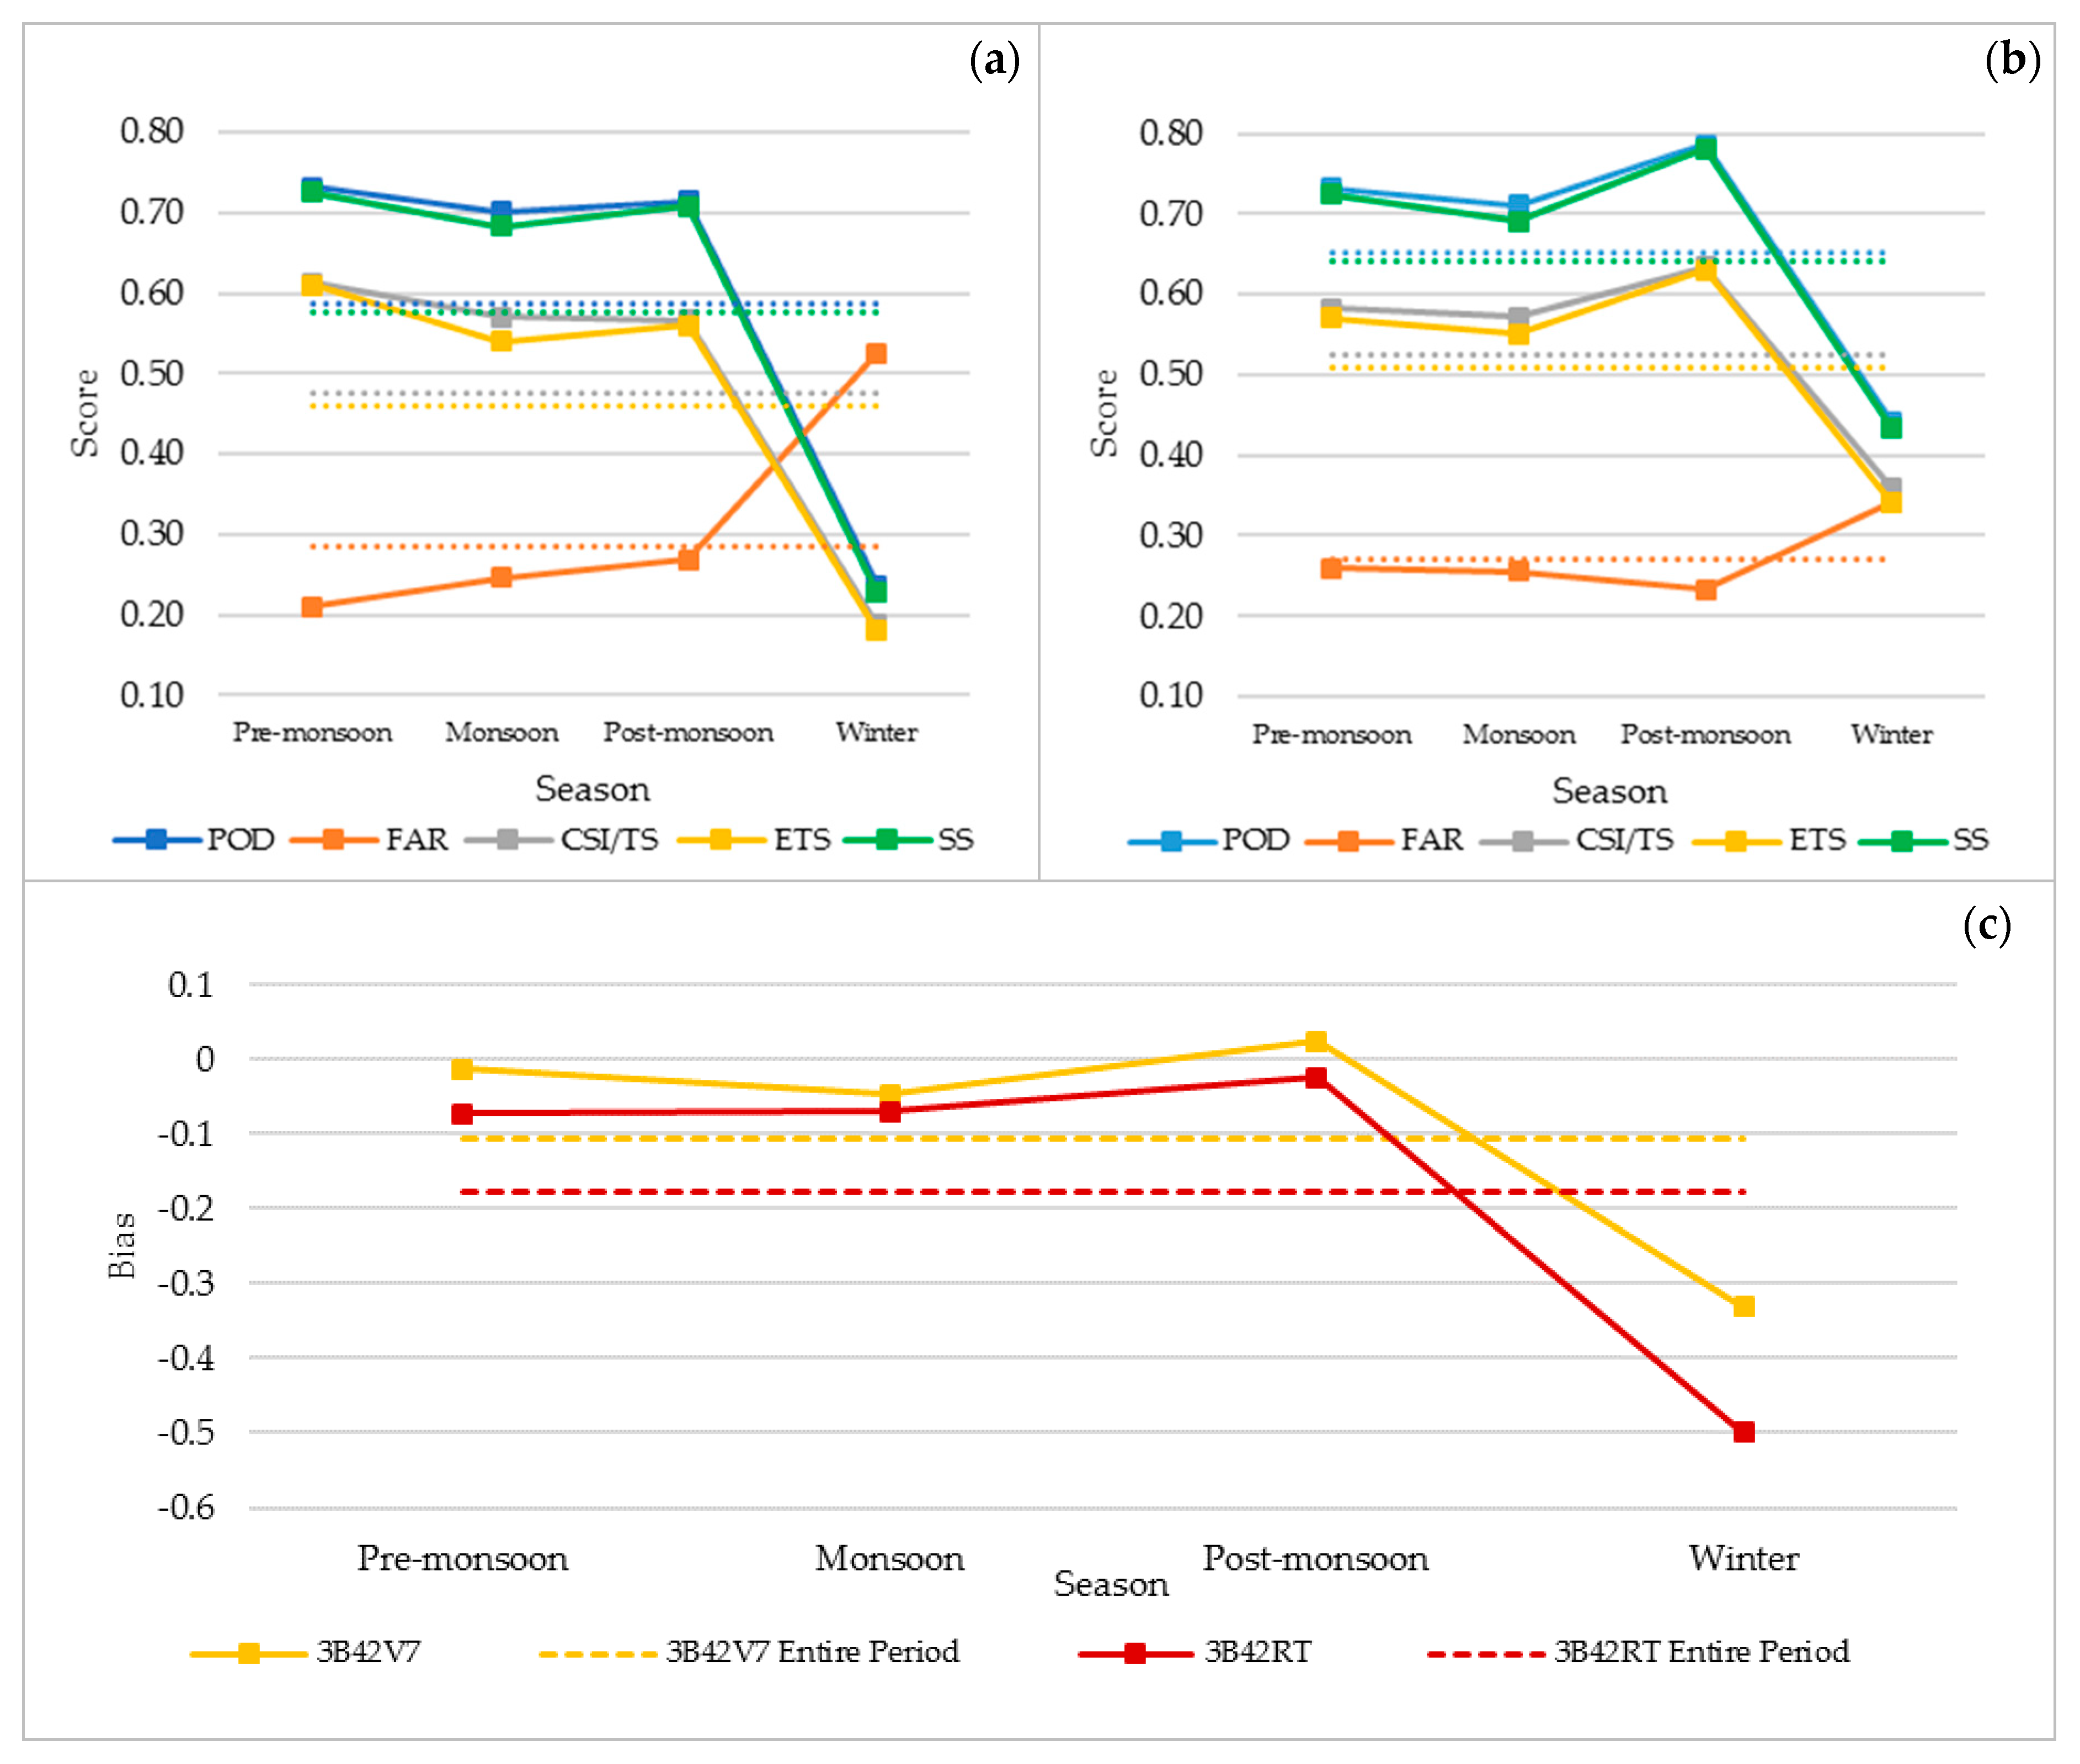
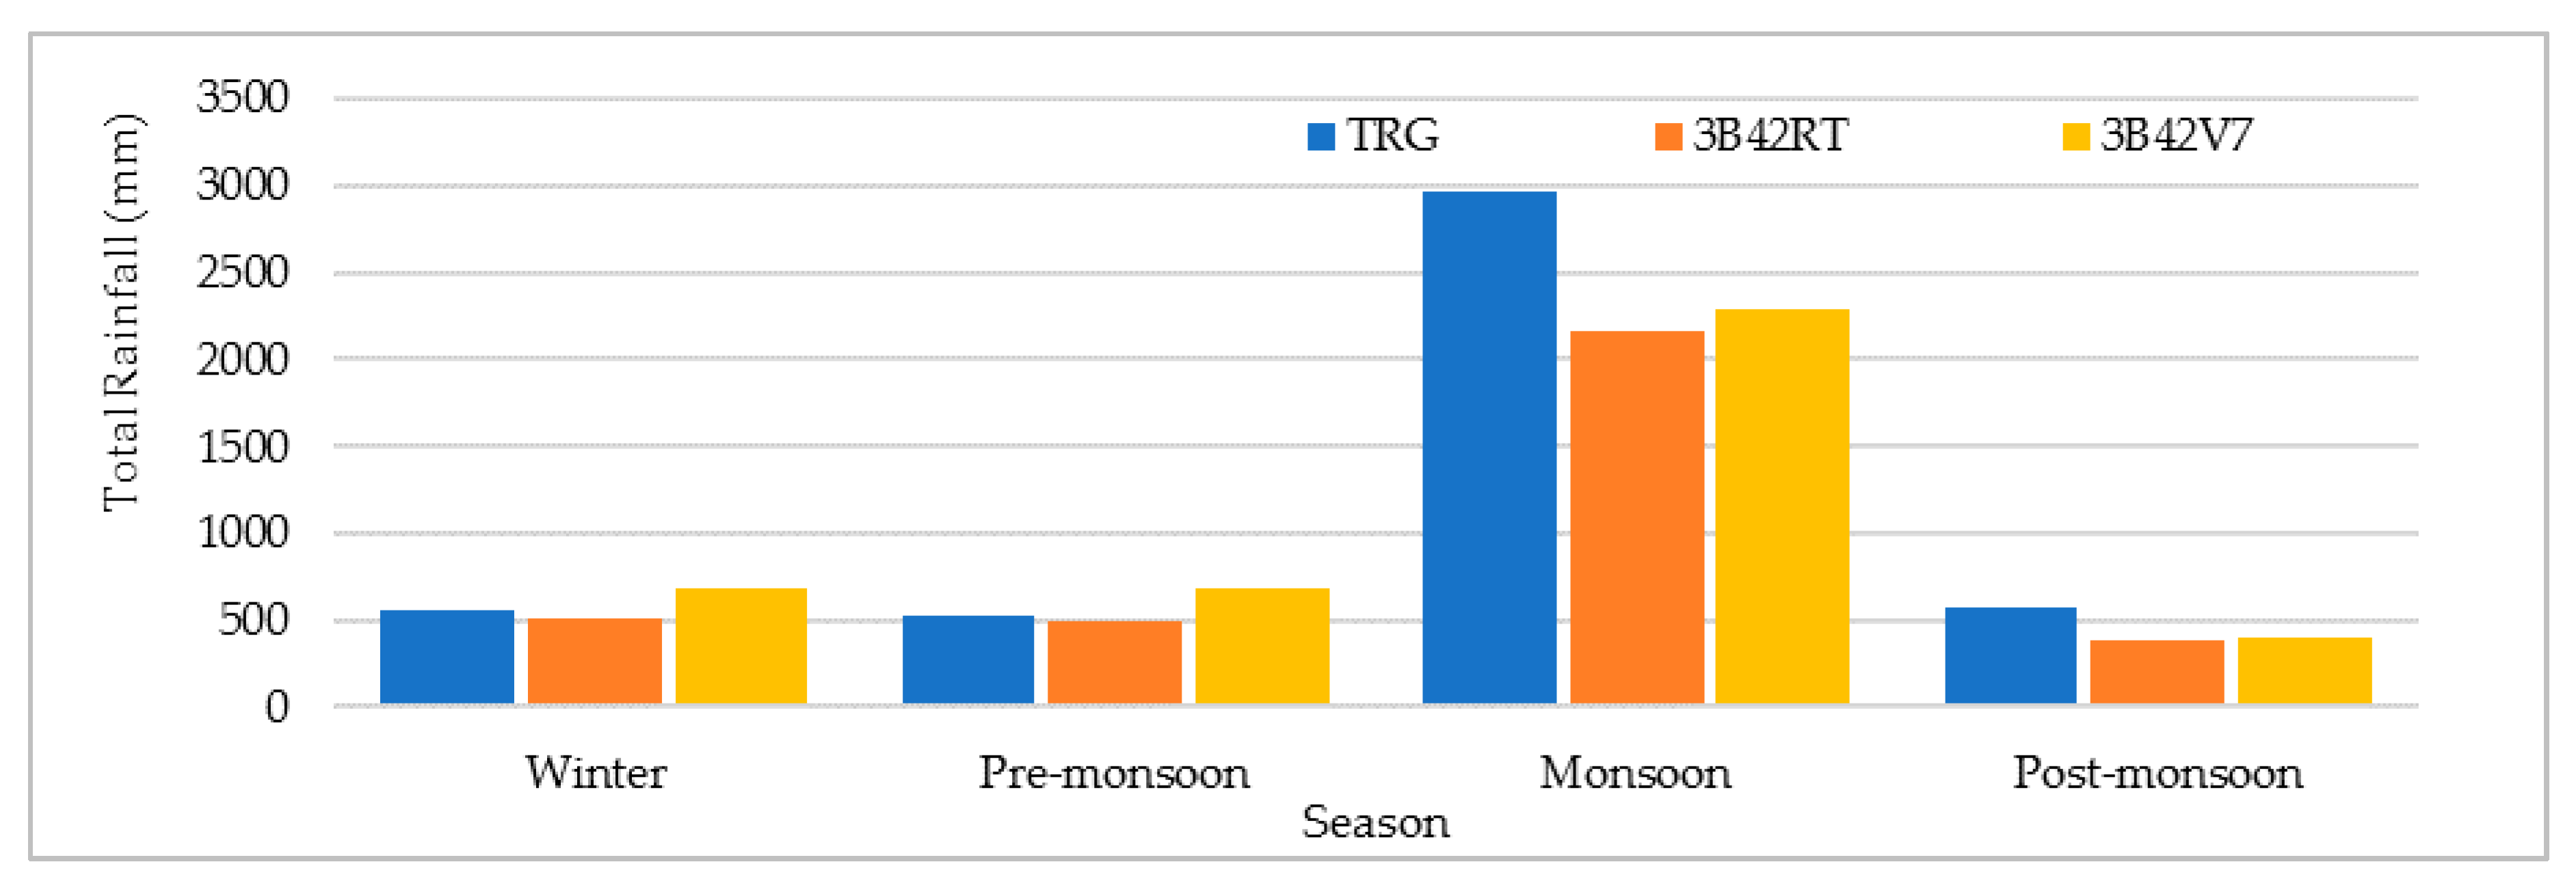
3.2.1. Seasonal Performance Assessment

Figure 8a,b shows the season-wise various performance indices for 3B42RT and 3B42V7, respectively. 3B42RT performs better in pre-monsoon, with values of 0.73, 0.21, 0.61, and 0.72 for POD, FAR, CSI/TS, and SS, respectively. 3B42V7, on the other hand, has a better performance in post-monsoon, with the highest POD (0.79) and lowest FAR (0.23); TS (0.63) and SS (0.78) are also high compared to other seasons. Post-monsoon is the only season where bias is positive for 3B42V7 (Figure 8c), showing that TMPA detects more rainy days than TRG. 3B42RT has a negative bias for all seasons. The performance of both TMPA products is the lowest during the winter season. The values of POD, FAR, and Bias are (0.24, 0.44), (0.52, 0.34), and (−0.50, −0.33), respectively, for 3B42RT and 3B42V7. Other performance-indices like TS (0.19, 0.36) and SS (0.23, 0.43) for 3B42RT and 3B42V7 are also quite low in comparison to other seasons. It is notable that the winter is typically a dry season in Pakistan, which may explain our present findings. Figure 8 indicates that the performance of both TMPA products is better in pre-monsoon and post-monsoon, with monsoon results also comparable to these two seasonal periods. However, it is winter, a relatively dry season, when TMPA products perform the worst regarding accurate events detection.

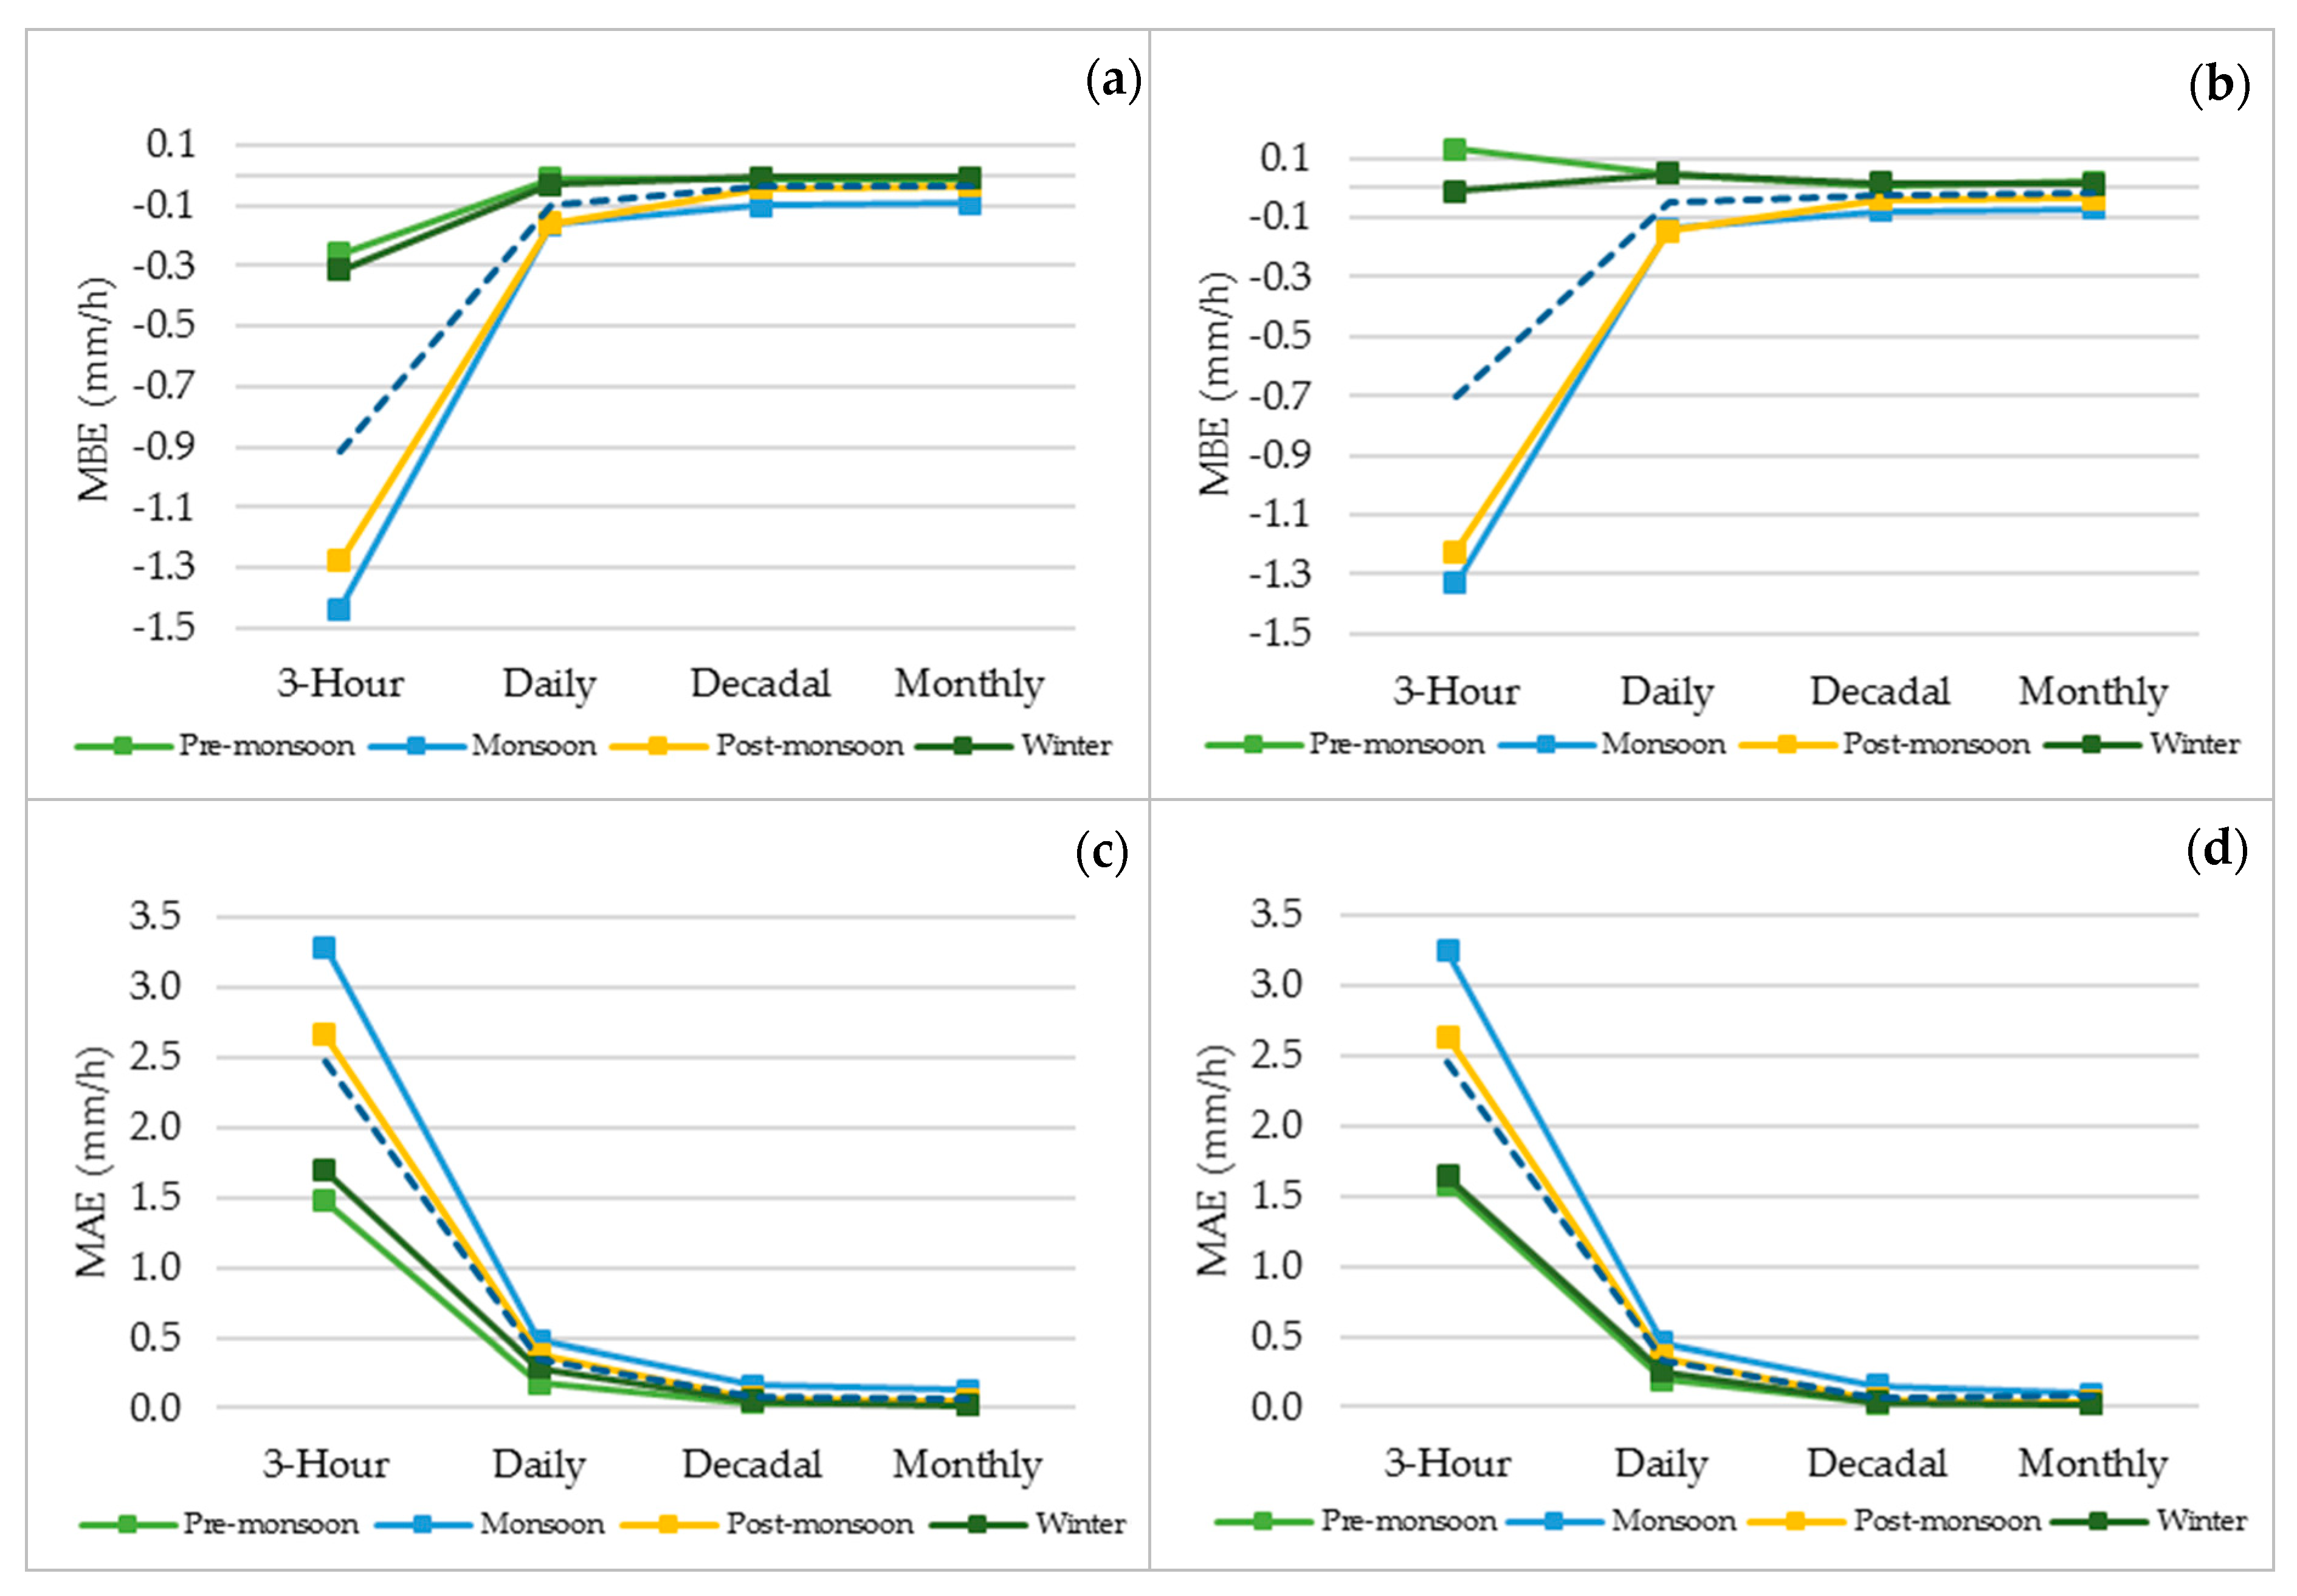
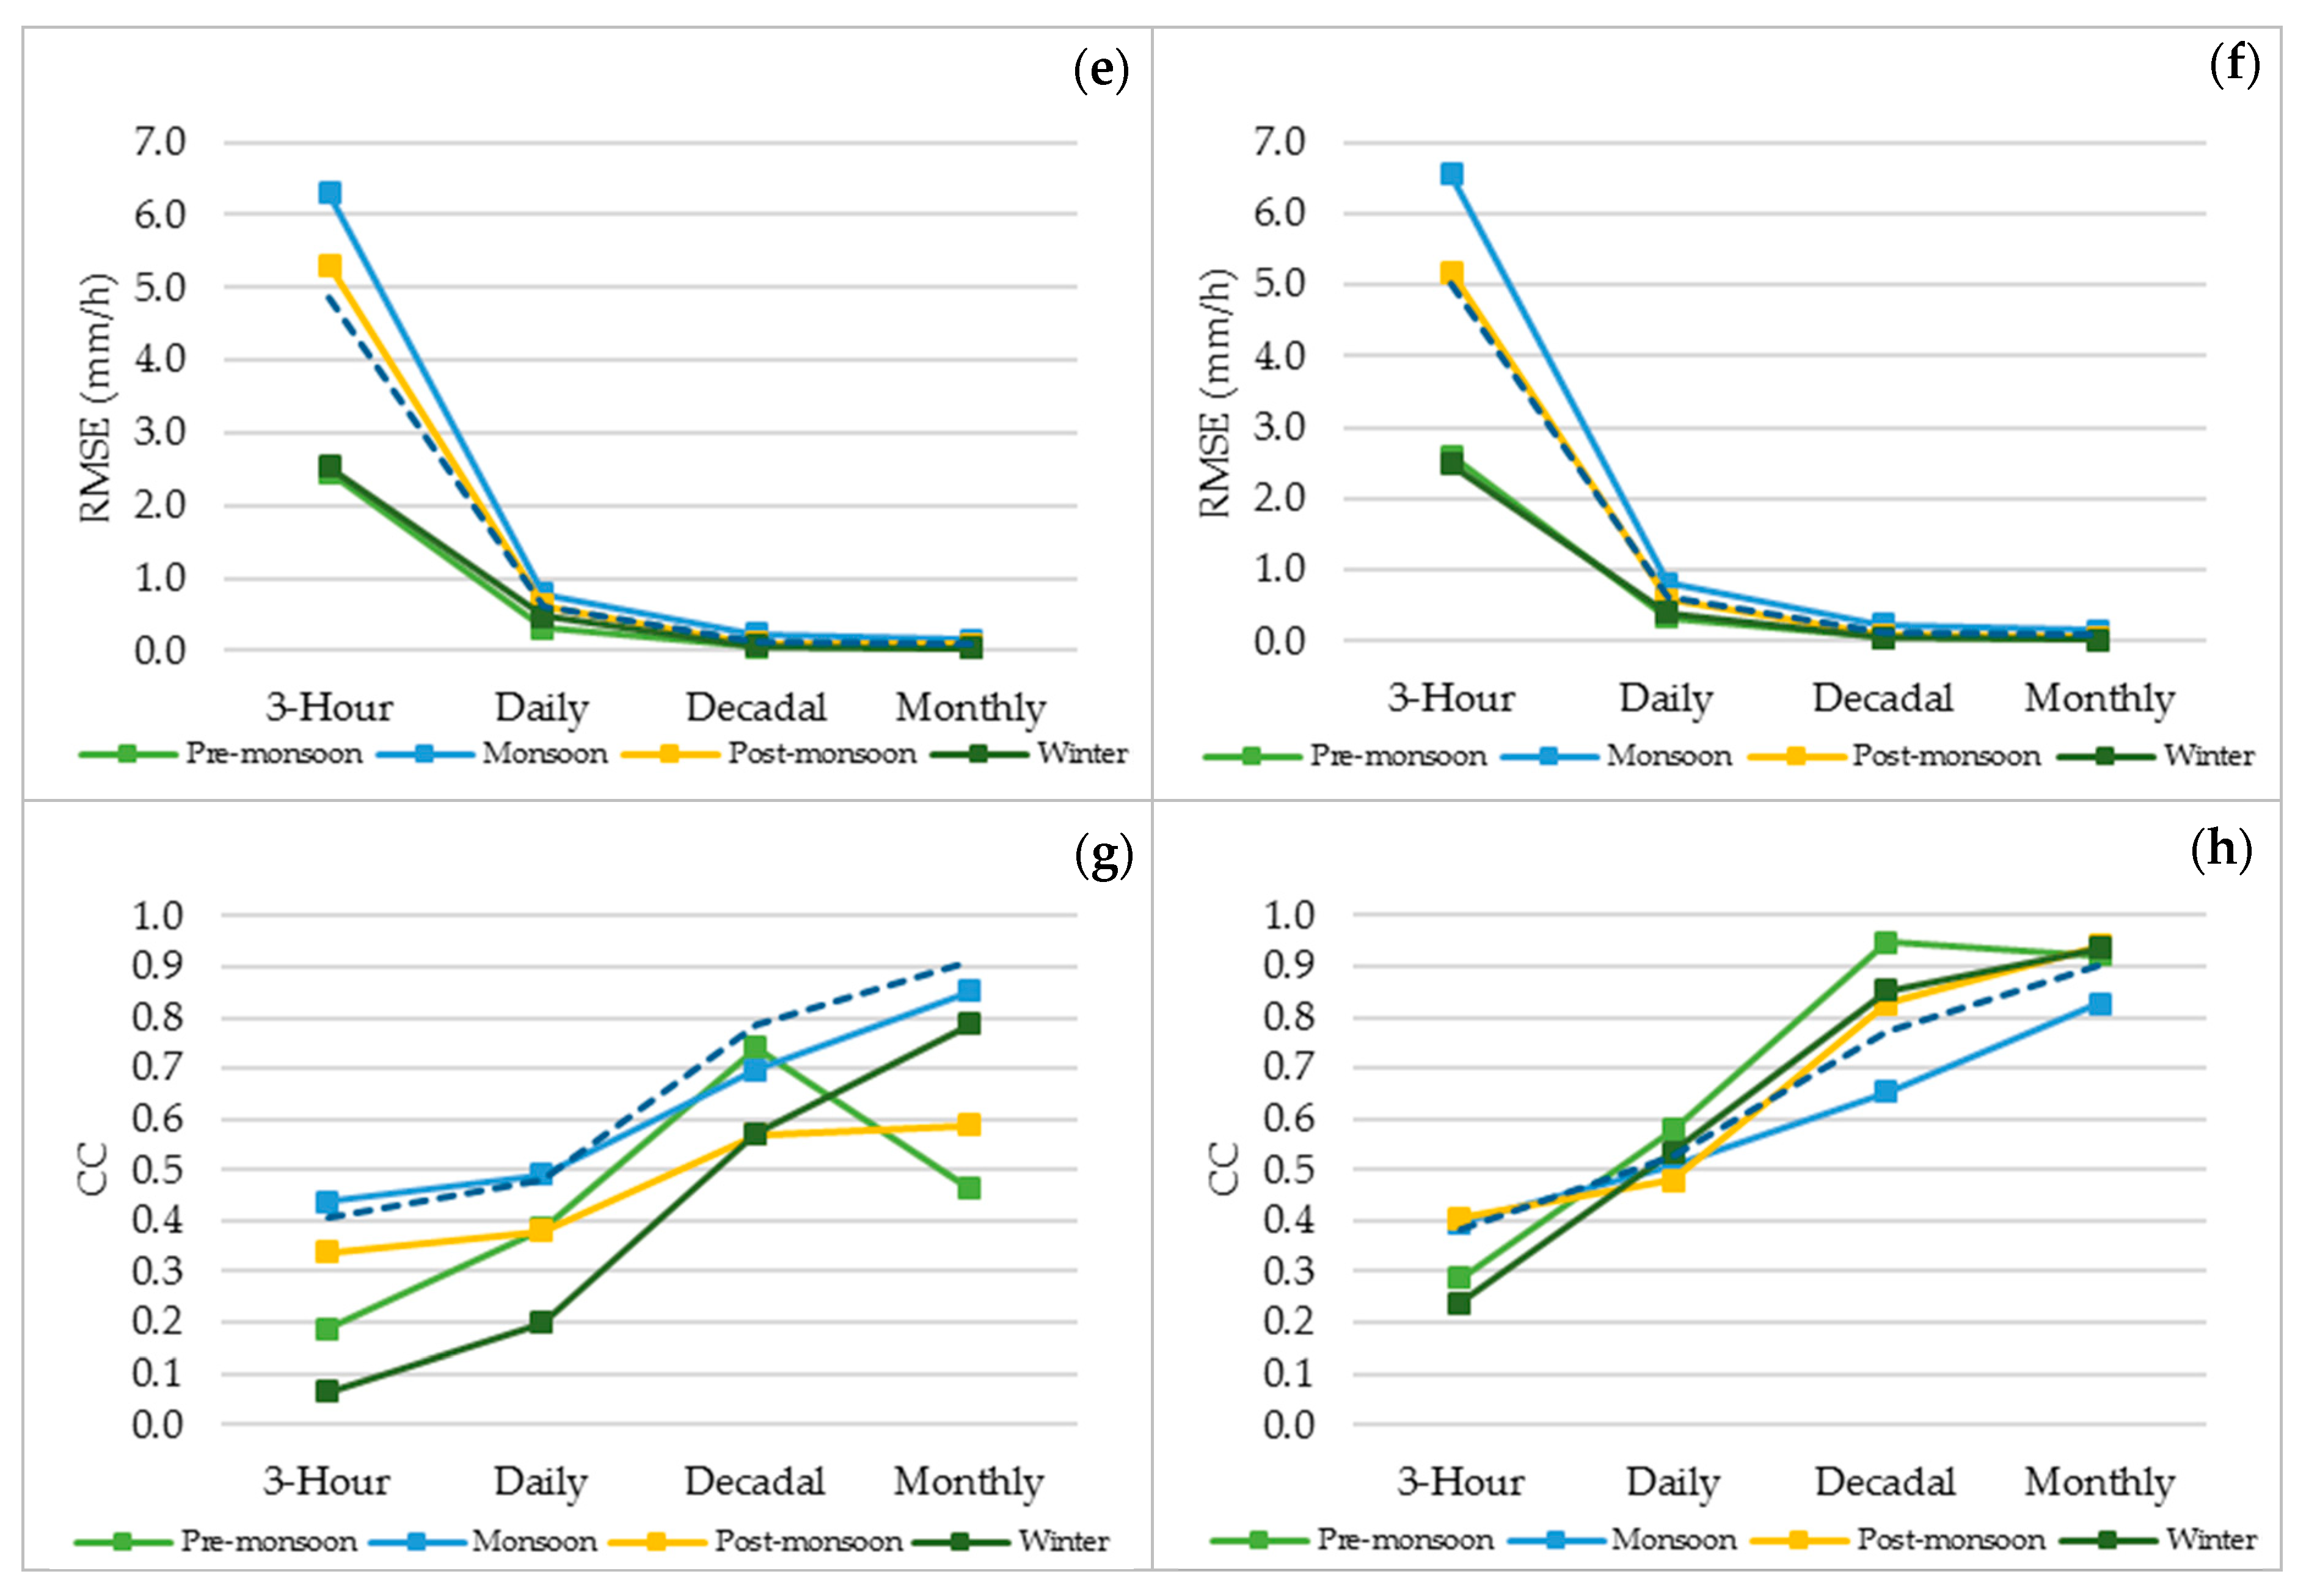
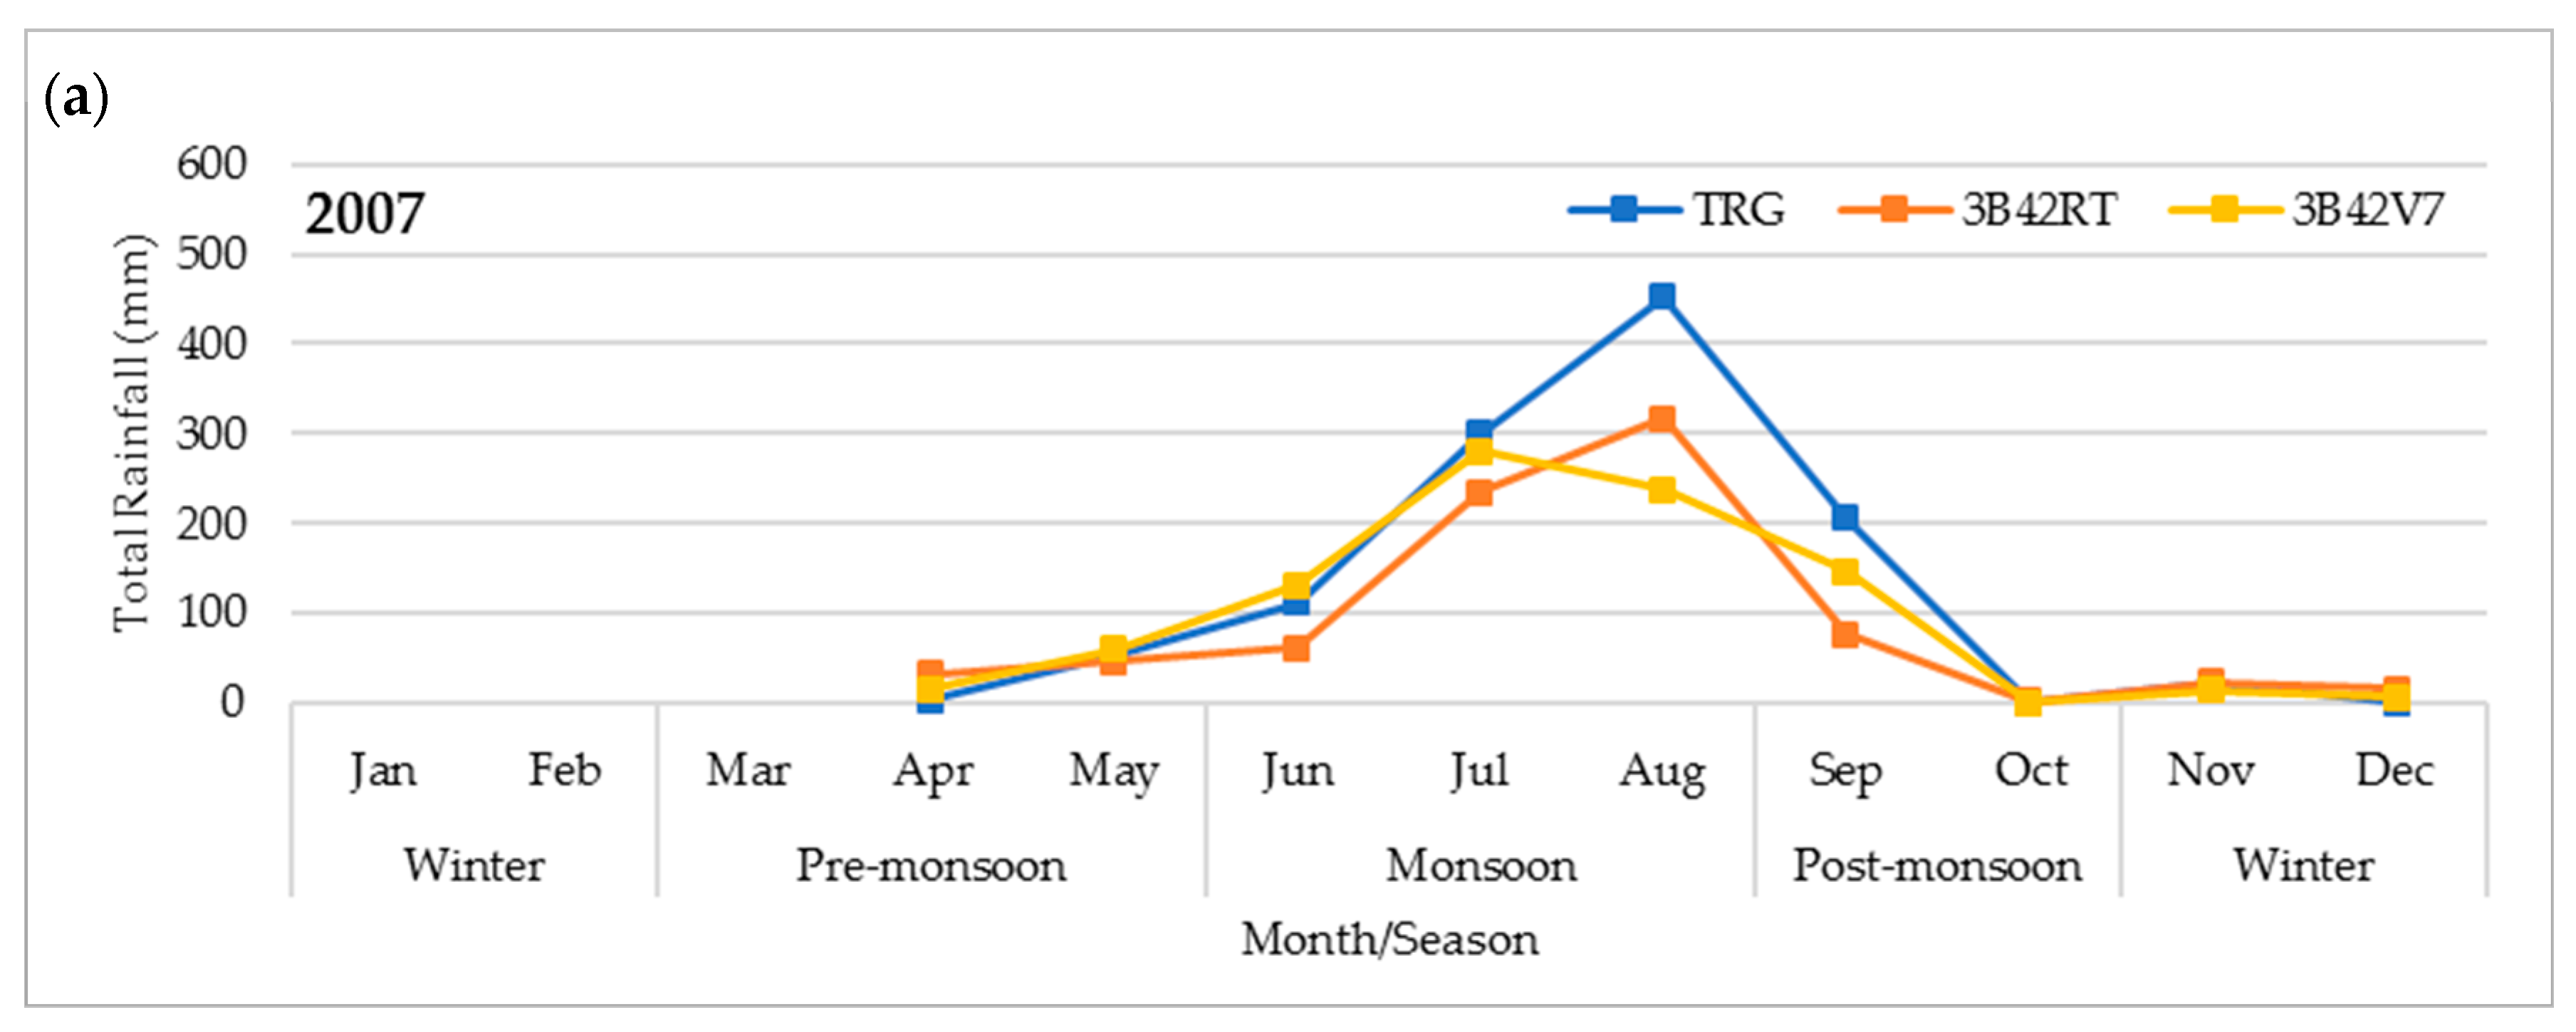
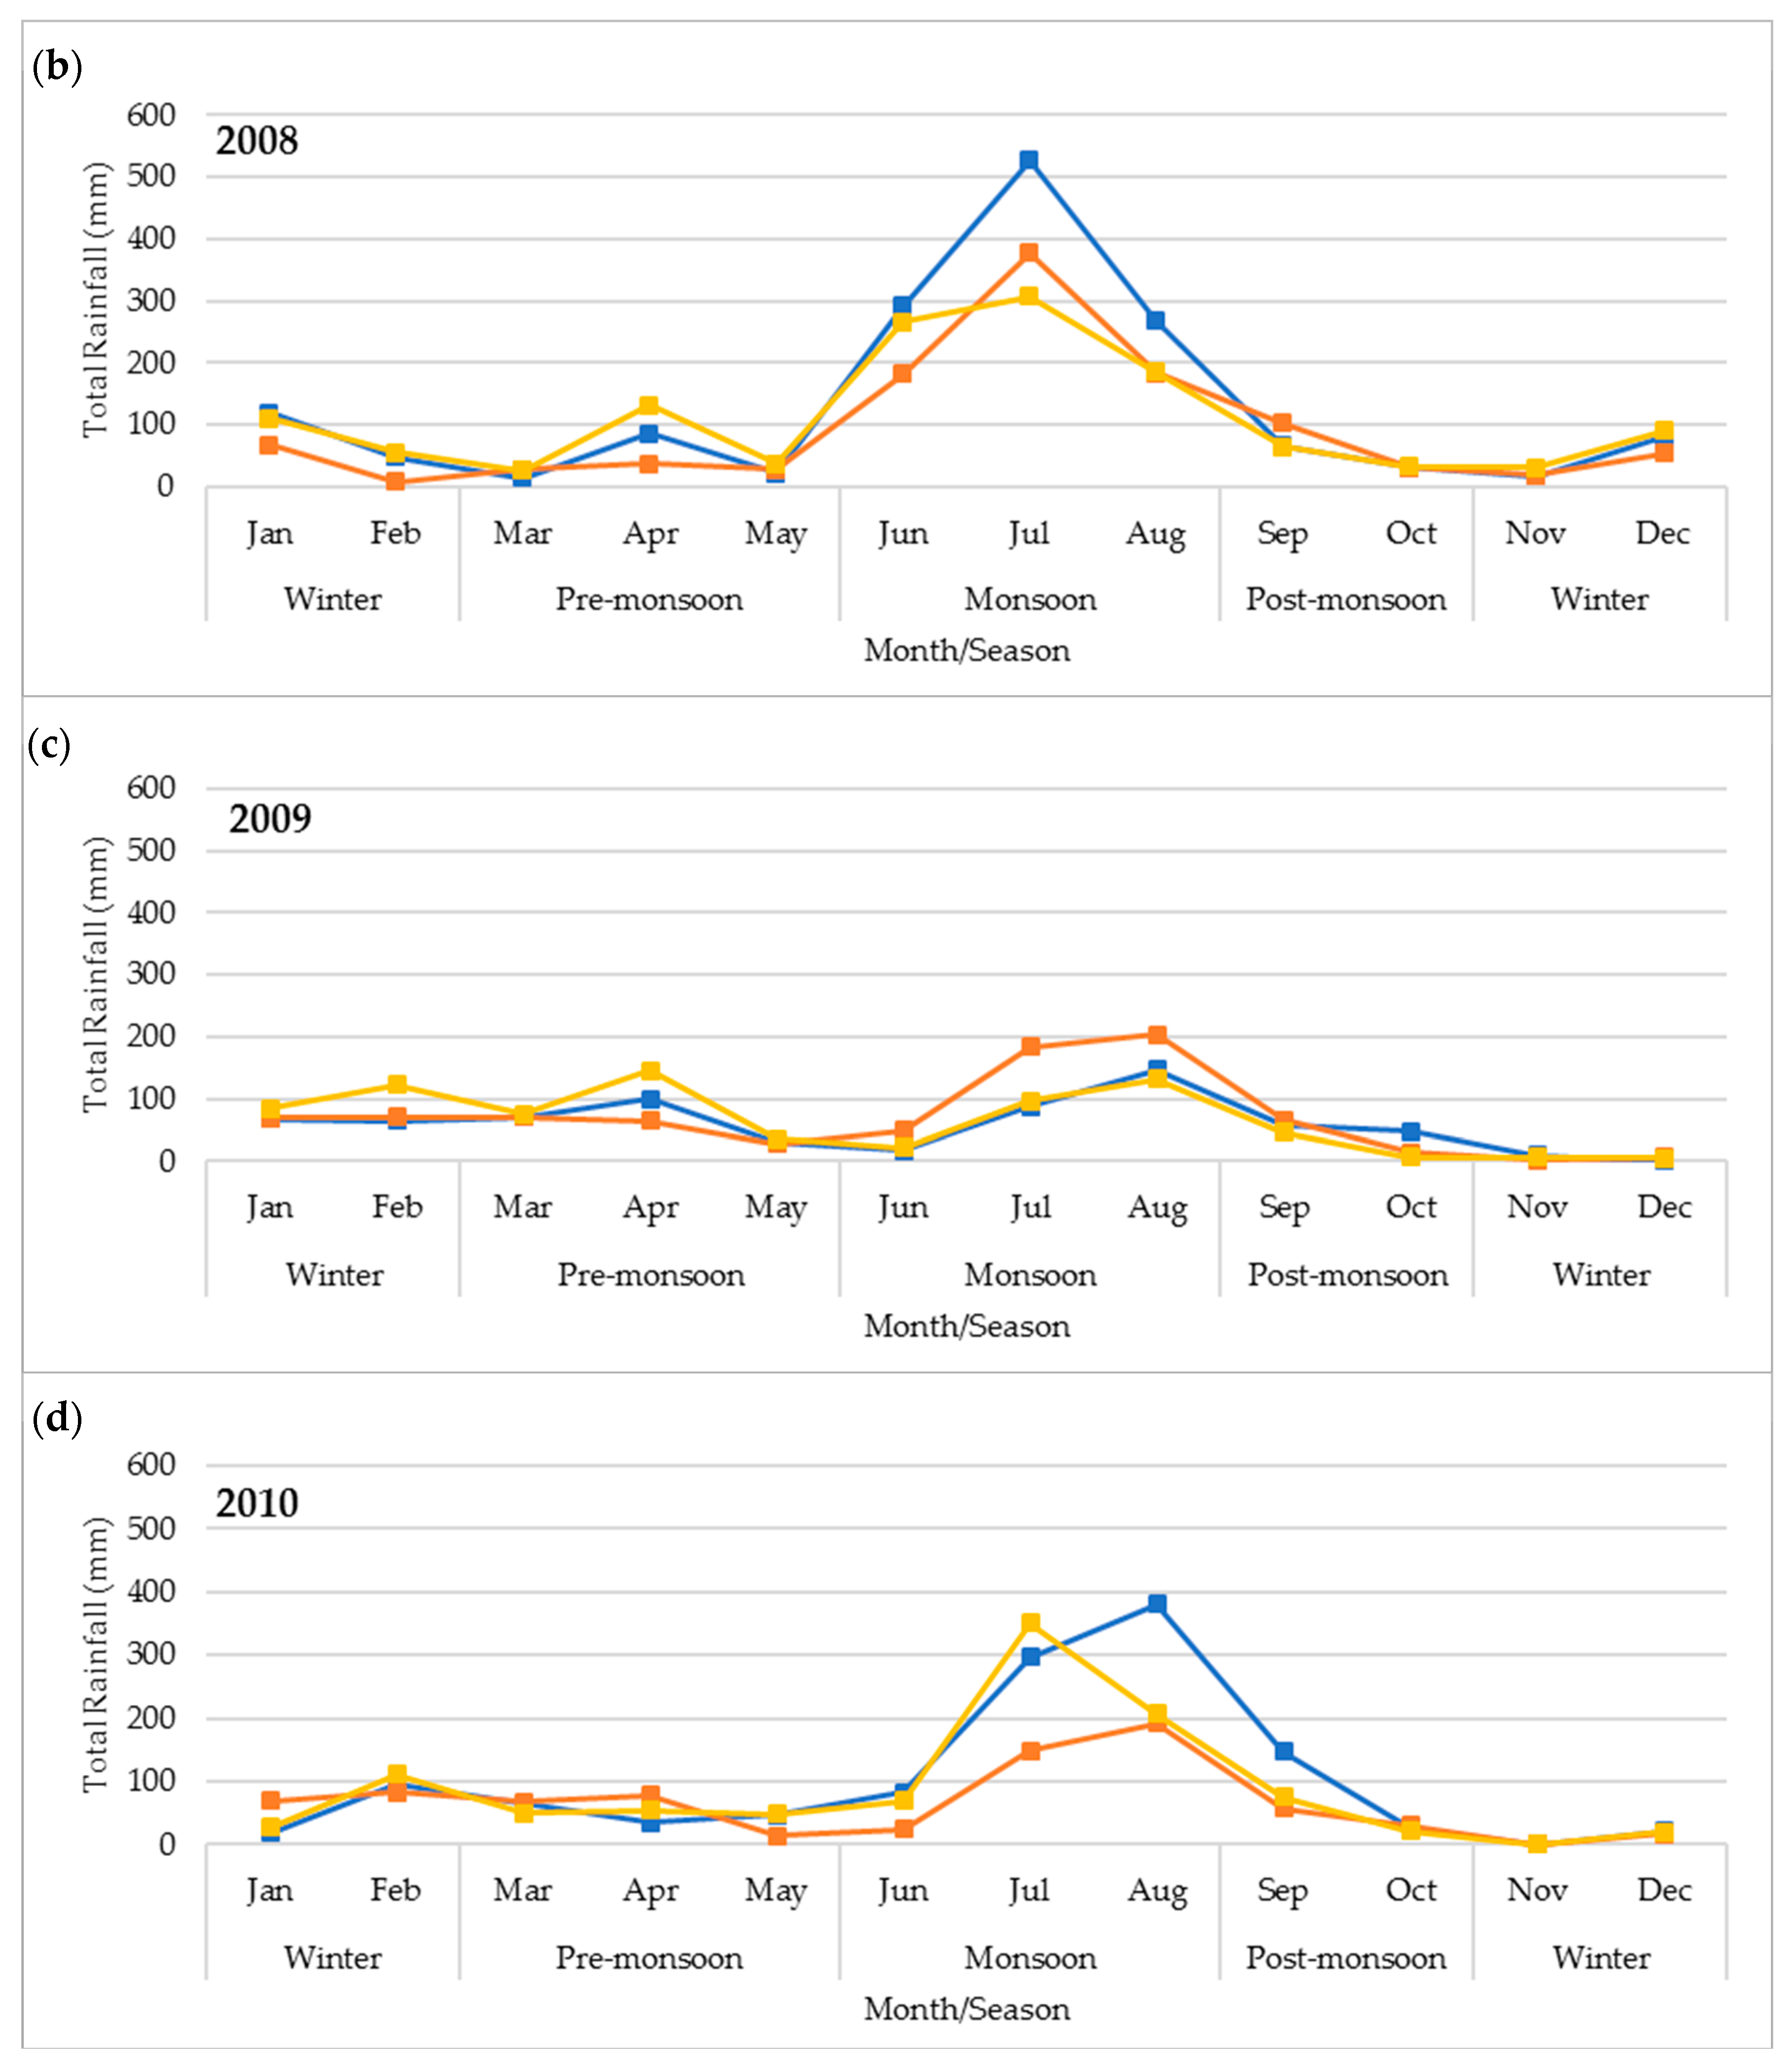
3.2.2. TMPA Validation across Different Seasons

Seasonal statistics are summarized in Table 5. The graphical presentation of validation statistics in different seasons is shown in Figure 9.
All seasons follow a similar trend, i.e., correlation improves, and a decrease in errors when transitioning from a short time window (3-h) to a larger time interval average (e.g., monthly). As per Figure 9a,b, 3B42RT underestimates rainfall in all seasons, while 3B42V7 underestimates rainfall in monsoon and post-monsoon seasons; and overestimates rainfall in winter and pre-monsoon at daily, decadal, and monthly rain rate averages. At 3-h time interval, 3B42V7 exhibits a similar pattern, except it slightly underestimates in winter. At a 3-h timescale, a maximum value of MBE (−1.44, −1.33), MAE (3.28, 3.24), and RMSE (6.31, 6.54) has been observed in the monsoon for 3B42RT and 3B42V7, respectively. Post-monsoon is another season where TMPA products highly underestimate three-hourly rain rates (see Table 5). The highest MBE, MAE, and RMSE values at all time intervals for both TMPA products are associated with the monsoon season. Correlation wise, at a 3-h time interval, monsoon and post-monsoon are the seasons where TMPA products have the highest CC values, i.e., 0.44 and 0.34 for 3B42RT, and 0.40, 0.40 for 3B42V7. In the pre-monsoon and winter seasons, CC values are less than 0.3 for both TMPA products. Figure 9e–h shows that the correlation between TMPA products and TRG is higher, while RMSE is reduced when moving from three-hourly towards monthly time intervals. At a 3-h interval, the correlation has the highest values in monsoon and post-monsoon seasons, while the RMSE values are also greater in these two seasons. For daily, decadal, and monthly time intervals, winter and pre-monsoon seasons dominate regarding better CC and lower RMSE for 3B42V7. 3B42RT behaves inconsistently when moving from three-hourly towards the monthly time interval. Standard deviation values across various seasons and timescales show that TMPA products mostly have a lower skill in capturing rainfall variability. The winter season is a specific season where TMPA products are affected more than TRG due to the anomaly in rainfall.
Figure 10 shows the time series of accumulated monthly rainfall. TMPA products and TRG follow a similar rainfall pattern for all years except the 2009 monsoon. In general, TMPA products overestimate in portions of February and April. These two months belong to winter and pre-monsoon seasons. In monsoon months, i.e., June, July, and August, TMPA products largely underestimate rainfall. However, in the 2009 monsoon, 3B42RT overestimates rainfall, which is an exception. The possible reason for this is the very low rainfall intensity and rainfall amount recorded for the monsoon in 2009. In post-monsoon, TMPA products exhibit relatively smaller overestimation. In November and December, rainfall from both measuring sources is quite comparable. The overall trend indicates that TMPA products heavily underestimate in wet periods.
Seasonal accumulated rainfall comparisons of TRG, 3B42RT, and 3B42V7 are shown in Figure 11. 3B42RT underestimates rainfall in all seasons (−10% in the winter season, −7% in the pre-monsoon season, −27% in the monsoon season, and −35% in the post-monsoon season). Contrarily, 3B42V7 overestimates rainfall in the winter (21%) and pre-monsoon (29%) seasons, while underestimates in the monsoon (−23%) and post-monsoon (−32%) seasons. Here, a negative sign indicates underestimation.

3.3. Diurnal Rainfall Analysis

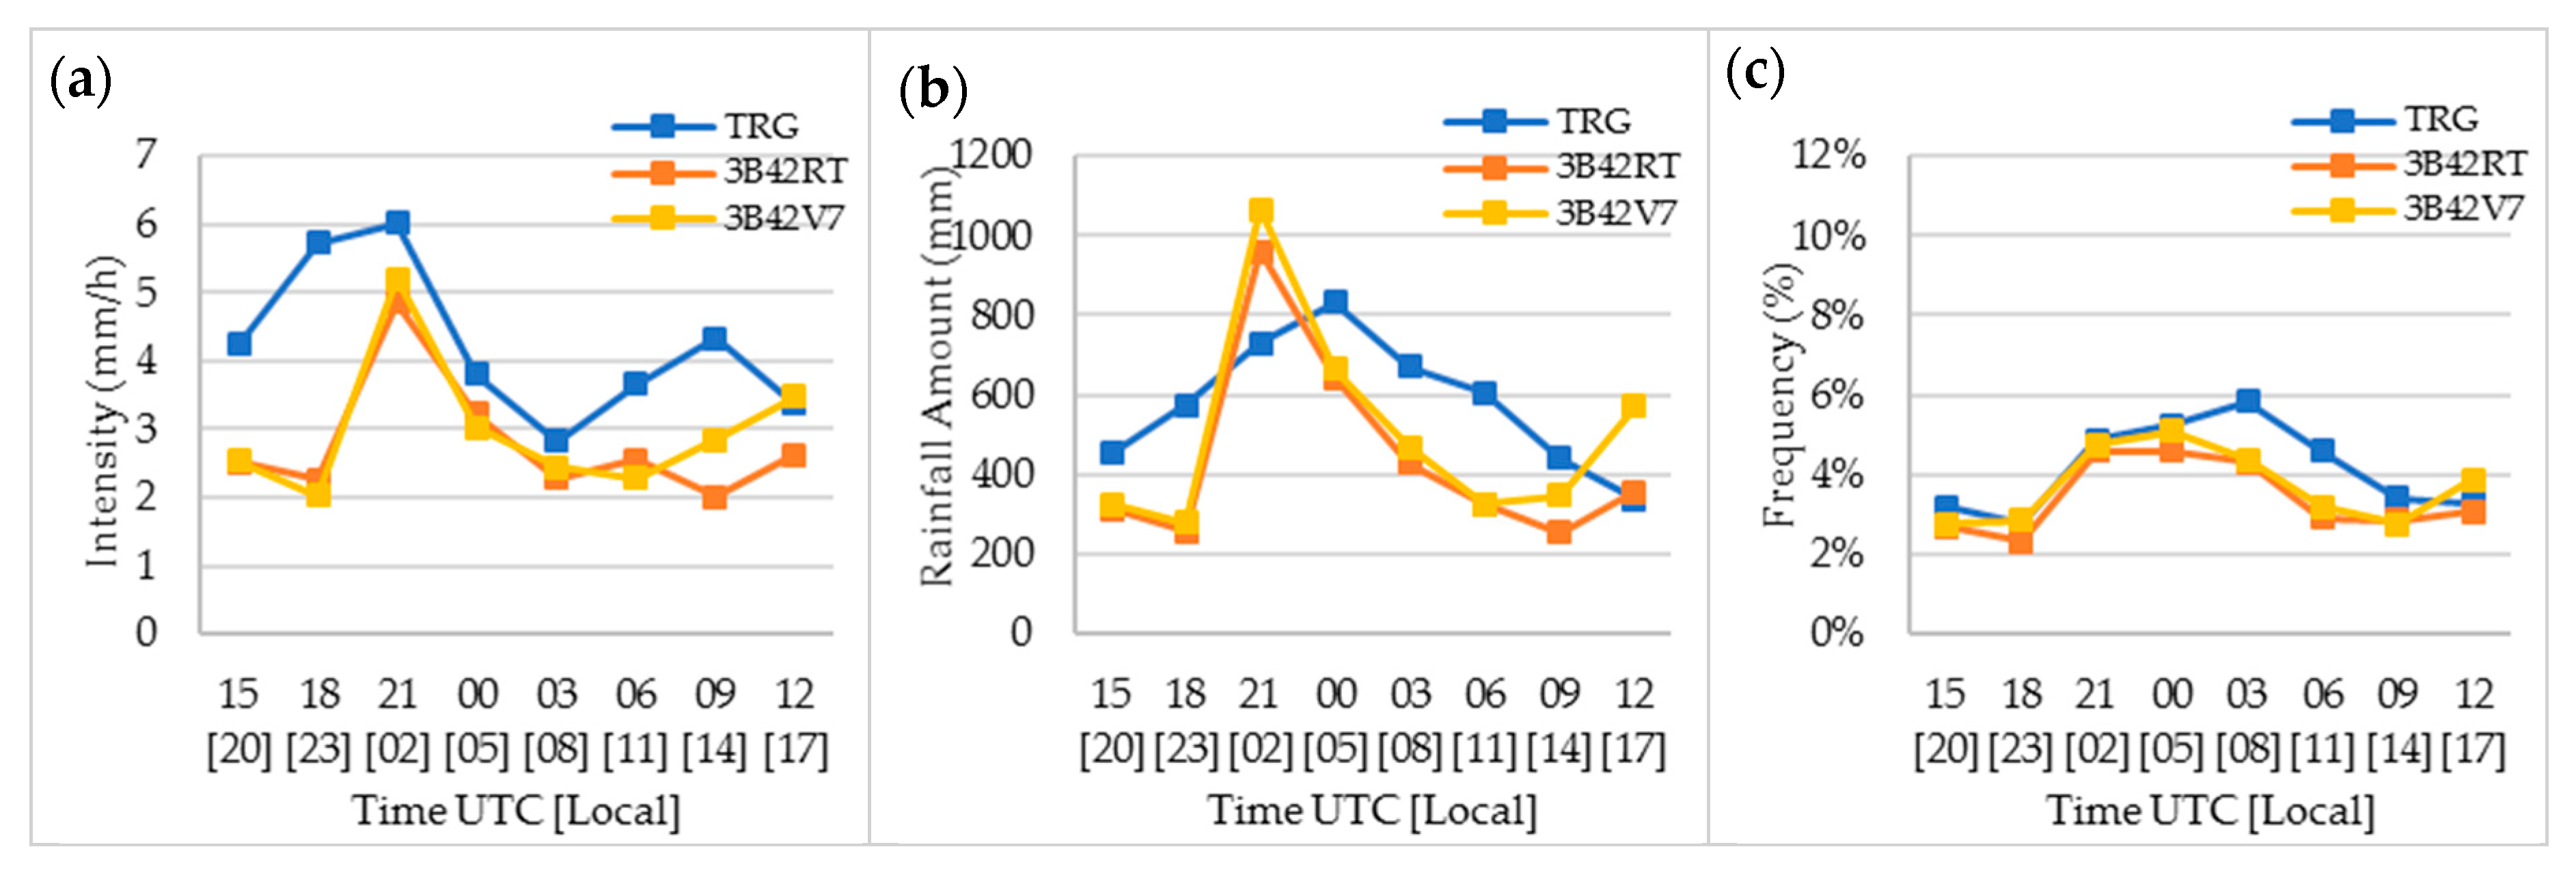
3.3.1. Diurnal Rainfall Analysis for Entire Study Period

The diurnal patterns in terms of average rainfall intensity, total rainfall amount, and frequency of rain occurrence over the entire period are shown in Figure 12. The results indicate that the TRG has higher rainfall intensities throughout the day, except for the evening (17:00 h local), where 3B42V7 has a slightly greater mean rainfall intensity. In terms of rainfall amount, both TMPA products overestimate around midnight, while 3B42V7 overestimates in the evening as well. The intensity curve of TRG clearly shows two peaks, one at midnight and another one in the afternoon. However, rainfall amount has a single strong peak in the morning (05:00 h local). A comparative analysis of Figure 12 reveals that Lai Nullah basin received a smaller number of rainy events in the evening, but these were intensive showers. Maximum rainfall amount was received between midnight and the morning, where rainfall intensities vary from high to low. TMPA products complement each other quite well, except for evening hours, but their agreement with TRG is quite weak. At a 02:00 h local time, TRG and TMPA products have similar frequencies, with TRG having higher rainfall intensities. But at this specific hour, TMPA rainfall amount exceeds TRG rainfall amount, which is quite unconventional. One of the basic reasons behind this exception is the difference in the calculation mechanism for total rainfall. TRG considers rain rates at each hour of the day to calculate the total three-hourly rainfall amount. TMPA products, on the other hand, have only one value of hourly rain rates for each 3-h interval. Consequently, hourly rain rates at each 3-h interval are multiplied by ‘3’ to get the three-hourly rainfall amount. The difference in rainfall amounts signifies a greater variation associated with TRG rainfall intensities between a 23:00 to 02:00 h local time, which TMPA products are unable to detect.

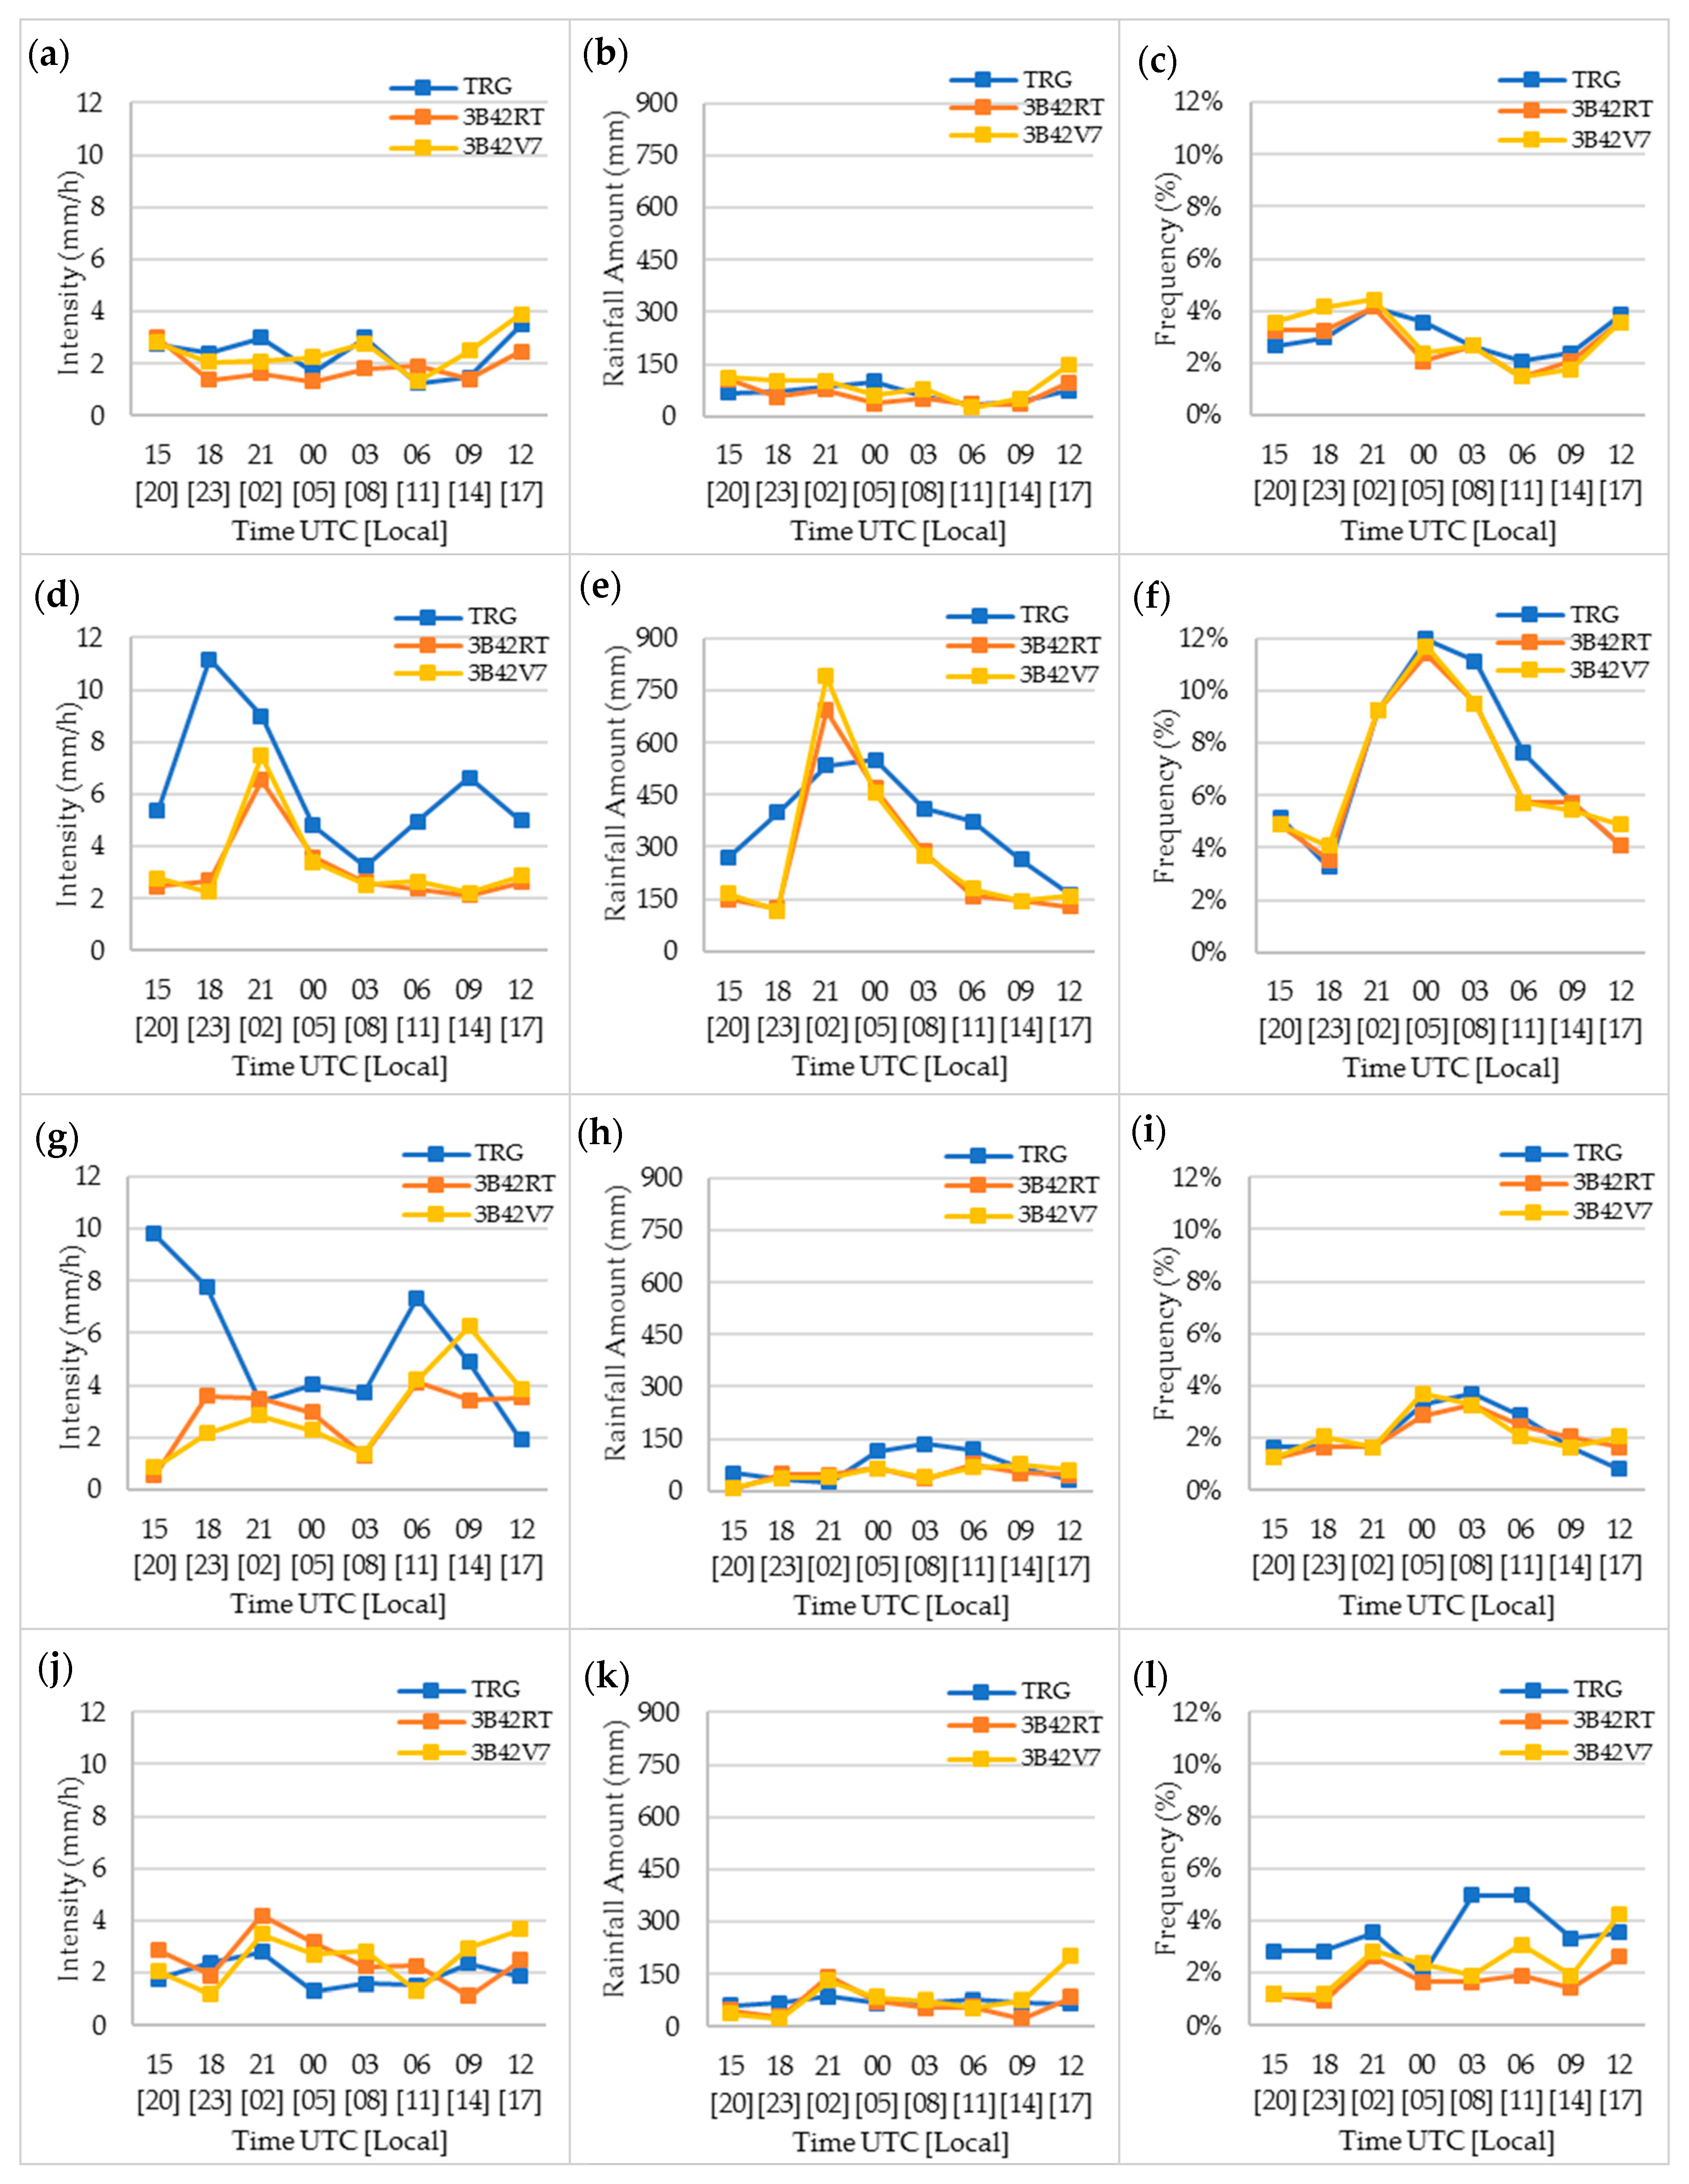
3.3.2. Seasonal Diurnal Rainfall Analysis

The season-wise diurnal cycle is depicted in Figure 13. In pre-monsoon seasons, TMPA products, especially 3B42V7, follow TRG curve patterns. The TMPA products underestimate rainfall in the morning and overestimate in the evening. The TRG has higher rainfall intensities and percentage frequency at midnight (02:00 h local time). TMPA products have higher percentage frequencies and rainfall intensities during evening hours.
As discussed earlier, the monsoon season is the wet season in Pakistan, and almost 60% of annual rainfall amount is received in this season. As a result, the monsoon season has a greater impact on rainfall patterns calculated for this entire period. Figure 10d,e displays the diurnal monsoon patterns, which are very similar to the overall time series patterns. It is notable that TRG has a higher percentage frequency during the daytime. Overall, the TMPA products underestimate rainfall, except for a single time slot, while their intensities are lower than TRG intensities. The rainfall intensity pattern in post-monsoon is quite dispersed. Even TMPA products mutually do not complement each other. TMPA products underestimate rainfall in morning and afternoon hours. The diurnal cycle of the winter season presents an altogether different trend, where TMPA products generally have higher rainfall intensities but lower percentage frequencies. The rainfall amount variation between 3B42V7 and TRG is greater in the evening, i.e., 17:00 h local time.

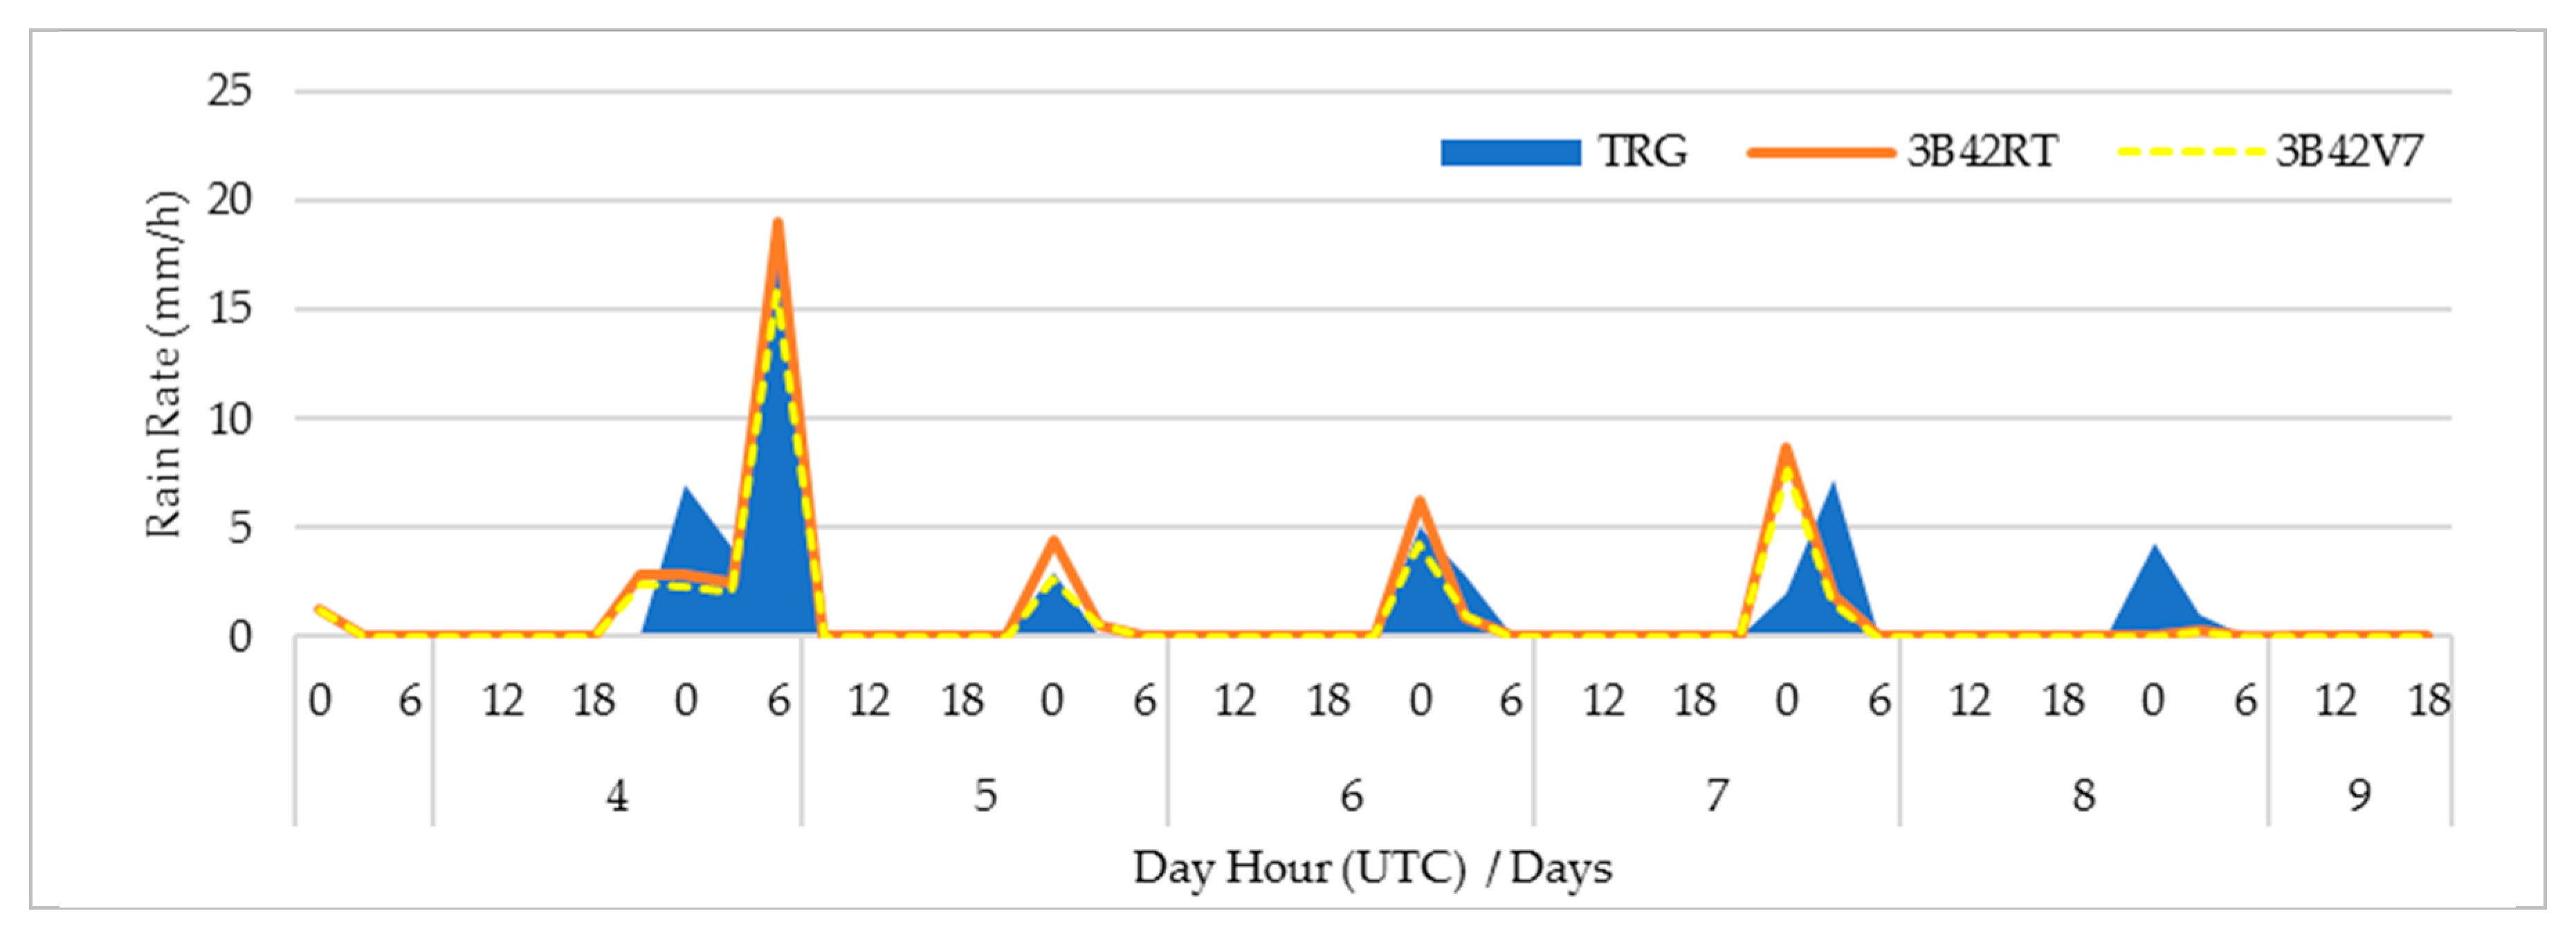
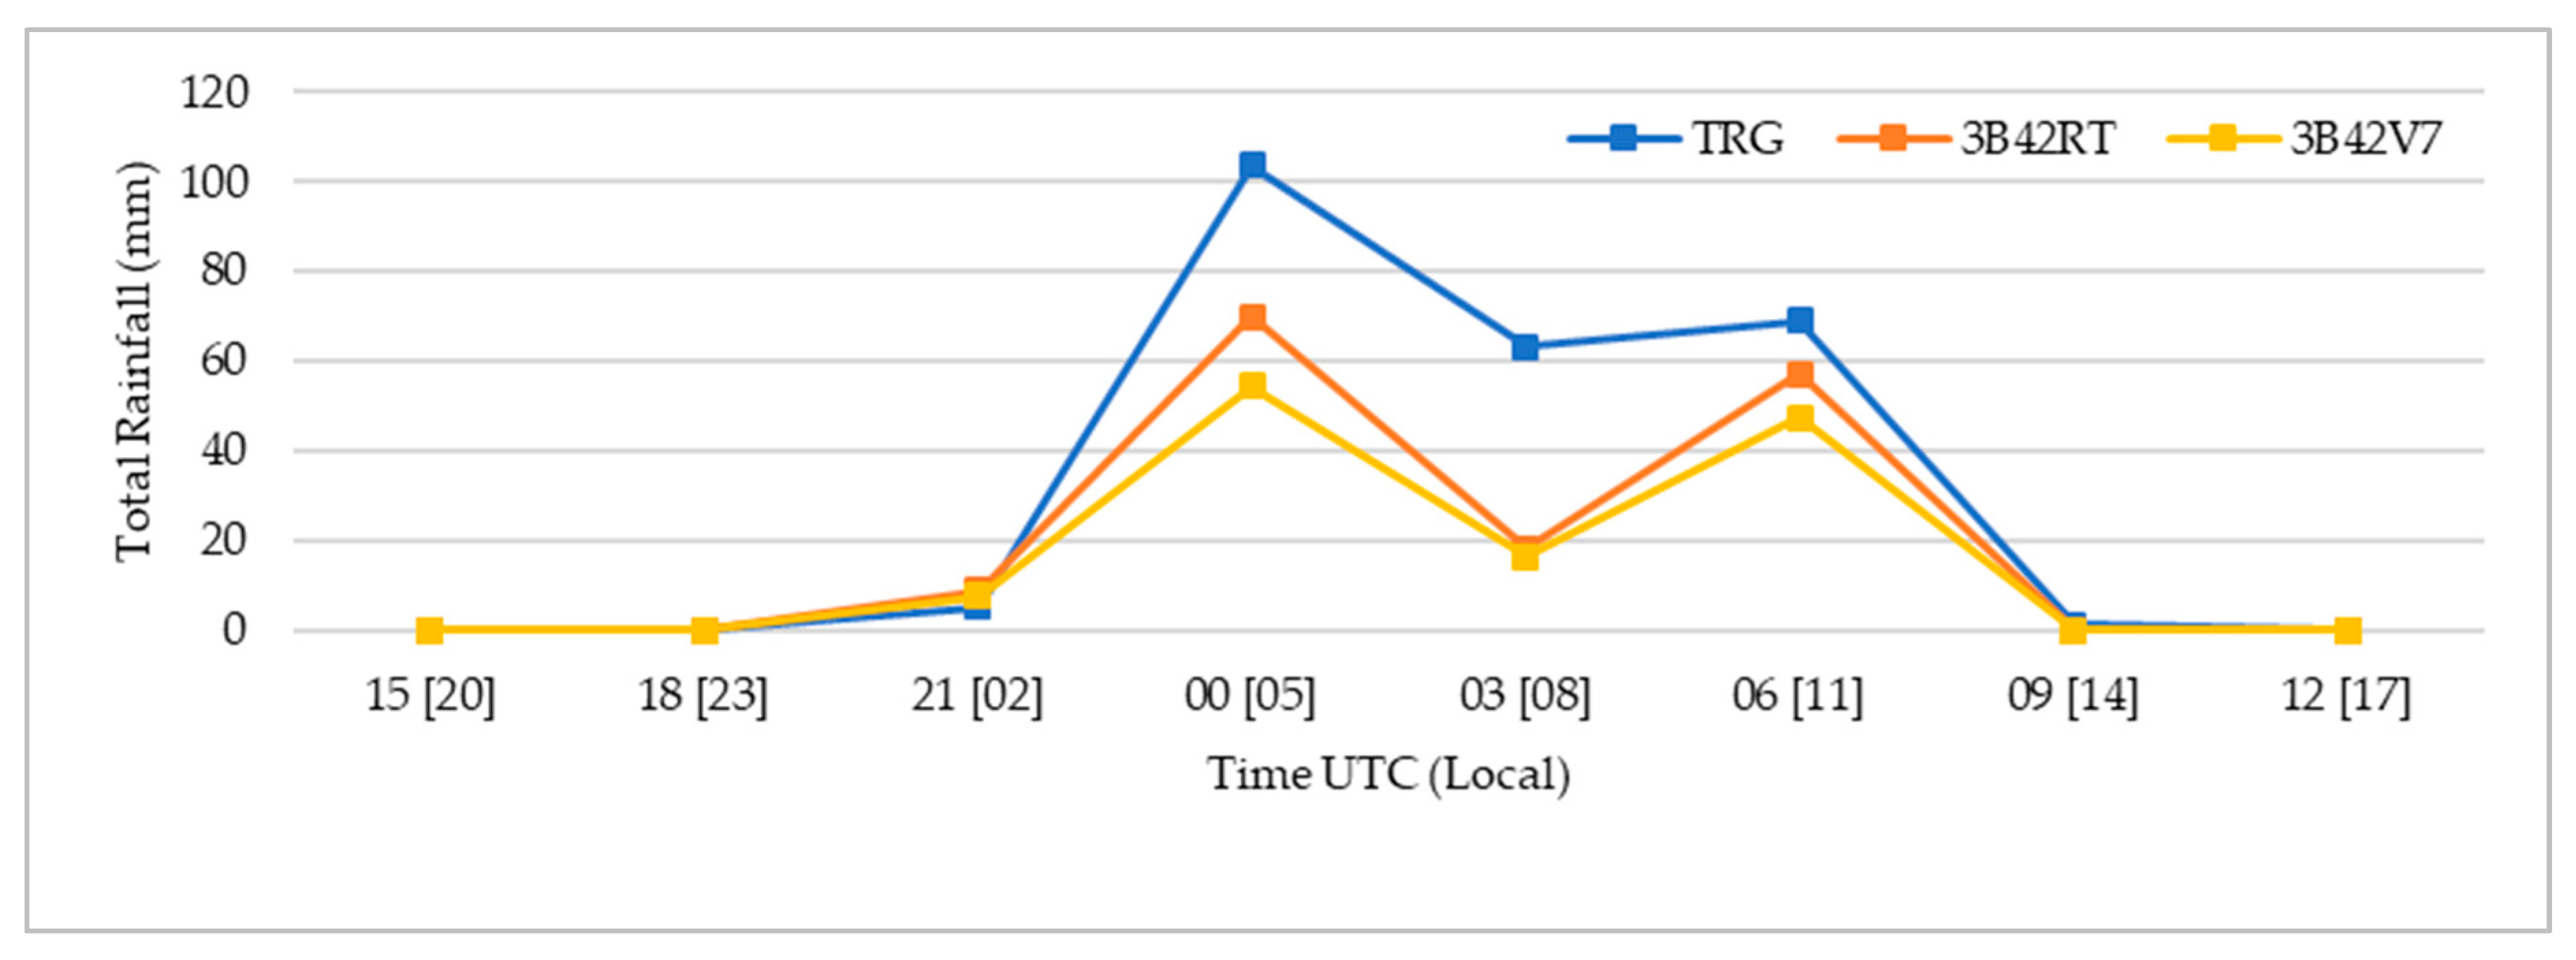
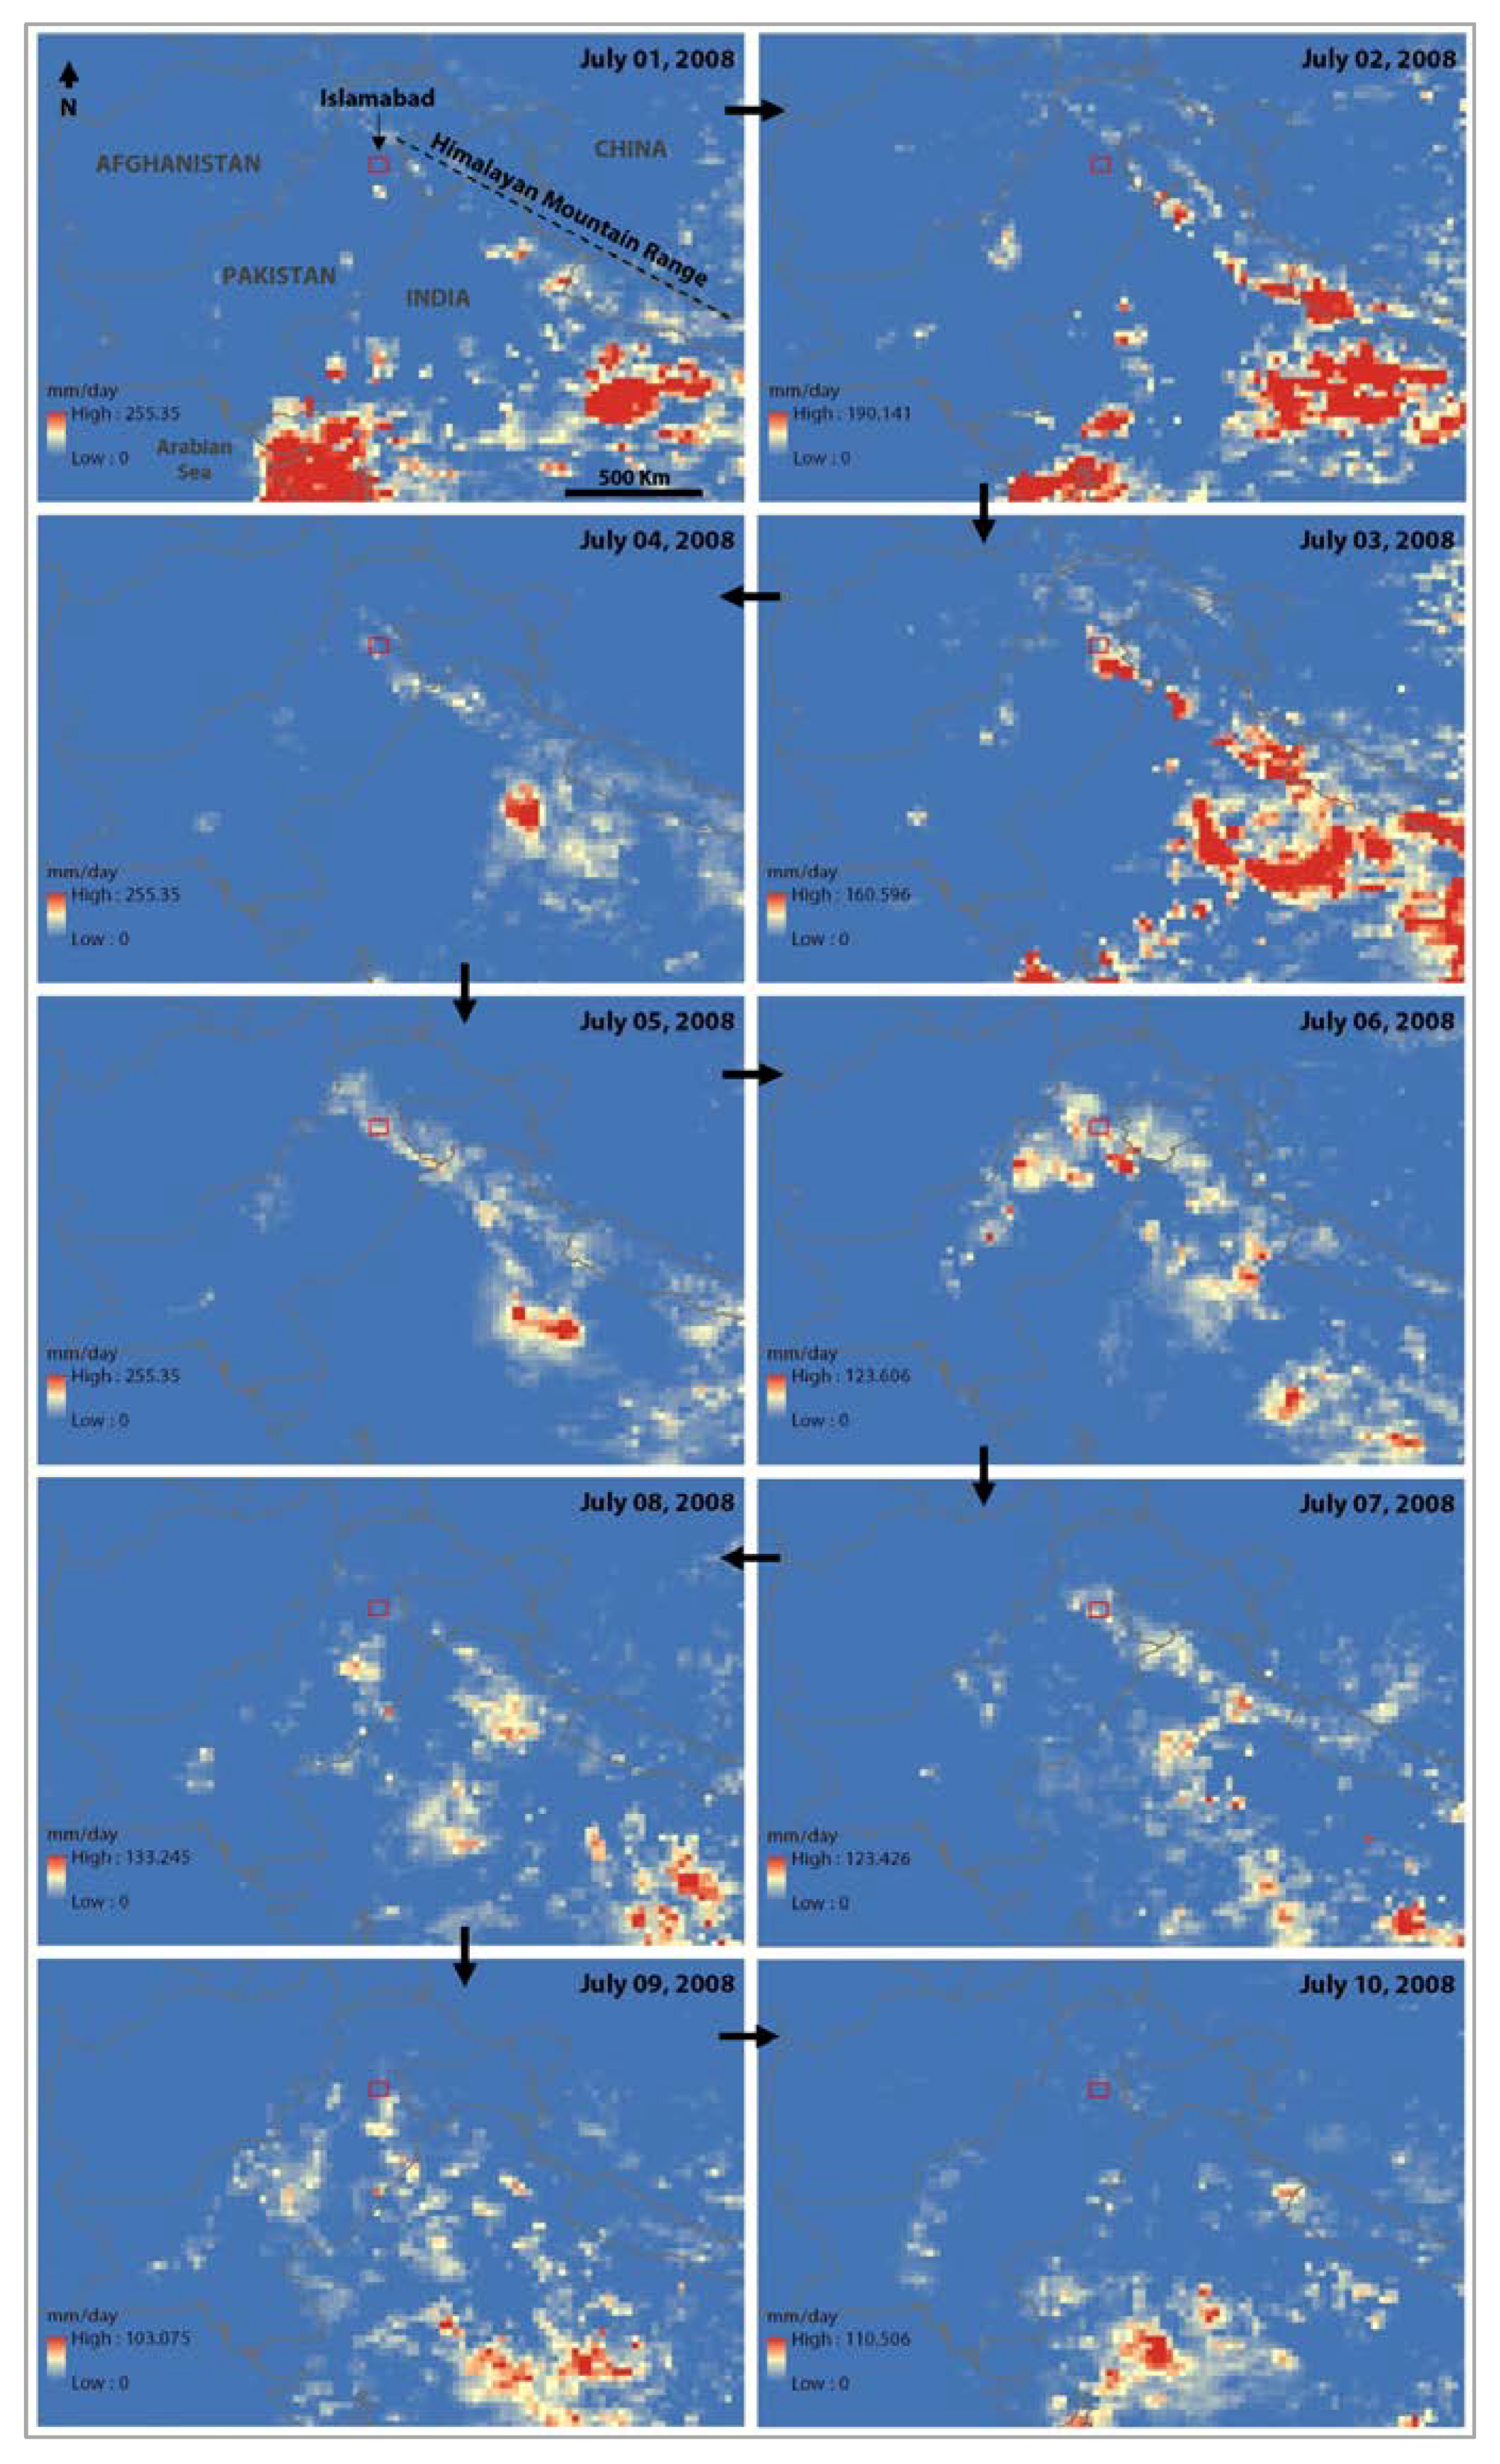
3.3.3. Case Study: Heavy Rainfall Event—July 2008

Afzal et al. [14] reported heavy rain events in Lai Nullah (current study area) during July 2008. Three-hourly rain rates (mm/h) for both TMPA products have been examined with TRG observations (Figure 14). Out of 48 events in six days, TRG detects ten rainy days, while both TMPA products sense 12 rainy days. TMPA products miss one rainy day and give three false alarms about TRG observations. The maximum rain rate observed by TRG is 18.8 mm/h on 5th July (6:00 h UTC, 11:00 h local), while the 3B43RT and 3B42V7 rain rate at that specific time slot is 19.1 mm/h and 15.8 mm/h, respectively.
The total rainfall amount for the event is shown in Figure 15. TMPA rainfall products follow a pattern similar to the TRG rainfall, but both products severely underestimated the total rain amount. In spite of monthly adjustments, 3B42V7 only estimated 52% of total rainfall. 3B42RT, on the other hand, estimated 64% of total rainfall.
Daily patterns of rainfall over the regional scale, starting from 1st of July 2008, are shown in Figure 16. These patterns are analyzed by using TMPAV7 daily rainfall data. The spatial rainfall patterns indicate that July 2008 heavy rainfall events in Lai Nullah basin were part of a Monsoon system that entered the north-east side of Pakistan from India. On 1 July 2008, a strong Monsoon system hit south-west India, and it propagated towards north-eastern parts of India. Finally, the system impacted the great Himalaya mountains and deflected along the Himalaya’s foothills towards Pakistan. It entered Pakistan on the 3rd of July and caused heavy rainfall events in Lai Nullah basin on the 4th of July and afterwards.

4. Discussion

Our study evaluates TMPA products at various temporal scales, including the best-offered one, i.e., the 3-h timescale. Overall, both of the TMPA products underestimated rainfall across the entire study period. However, 3B72V7 performed better than 3B42RT, which agrees with the finding of various recently conducted studies [53,54,57,77,78] in Pakistan. Further, our study strengthens the fact that the performance of TMPA products depends upon seasons and various timescales [16,79]. Categorical indices like bias, POD, FAR, CSI/TS, and SS values for 3B42V7 are −0.11, 0.65, 0.27, 0.52, 0.51, and 0.64, respectively. These scores are much better when compared to two erstwhile studies [48,52]. Categorical indices’ scores at different rainfall intensities reveal that the TMPA products detect plenty of spurious rain events at light rain rates (rain rates <2 mm/h). The value of FAR for light rain events is 0.76 for 3B42RT and 0.71 for 3B42V7. Figure 3a,b show that all fallacious alarms befall at rain intensities below 2 mm/h, which is concurrent with the findings of [47]. A possible reason for the high FAR at low rain rates could be wind induced errors during rain gauge observations. A score of FAR ameliorates and attains its ideal value when shifted from low rainfall intensities towards higher rainfall intensities by keeping the rain detection threshold constant, i.e., 0.1mm. TMPA’s performance in the categorization of various rainfall intensities has been examined in Figure 4. Results show that the TMPA products behave haphazardly and misclassify many ‘light rain’ events into ‘moderate’ and ‘heavy rain’ events and vice versa. Low standard deviation values for TMPA products can explain the inability of these products to detect variations in rainfall intensities. Overall, 3B42V7’s performance is better than 3B42RT in rain intensities classification.
Rainfall rates validation results for the entire study period (Table 4) show a very small value of CC = 0.41 for 3B42RT and CC = 0.38 for 3B42V7 at a three-hourly timescale for the entire time span. The CC value for 3B42V7 is smaller than the value calculated in [52] that gives an average value of CC = 0.45. The calculated MBE is −0.92 and −0.70 for 3B42RT and 3B42V7, respectively, which indicates an underestimation of TMPA products in rainfall measurements. Standard deviation values show that both TMPA products detect small variability in rainfall compared to reference rainfall data. However, 3B42V7 detects better variation in rain occurrence compared to 3B42RT. Our results second what Anjum et al. [54] concluded in their study, i.e., the inability of TMPA products to capture temporal variability. At daily, decadal, and monthly time scales, the correlation values between TMPA products and TRG rain rates increased to (0.48, 0.53), (0.79, 0.77), and (0.91, 0.90), respectively, which are compatible with the results of a couple of bygone studies [16,47]. However, CC values at a daily timescale are less than the values (0.57, 0.61) calculated by Anjum et al. [78]. The cumulative rainfall analysis shows an overall underestimation of TMPA products in measuring actual rainfall. By considering the standard definition of acceptable accuracy, i.e., ±10% of observed precipitation [43,44], 3B42RT exhibits more underestimation of rainfall (−24%) than 3B42V7 (−13%). Our result is aligned with the findings of Anjum et al. [54].
Figure 8 shows that the TMPA products’ performance is congruous in pre-monsoon, monsoon, and post-monsoon seasons. Nonetheless, these products have the poorest (or lowest) performance in the winter season, where the score for FAR is as high as 0.52 (for 3B42RT) and scores of all other indices are less than what is calculated in other seasons. Further, the value of the correlation coefficient is very low in winter for both TMPA products and these products overestimate rainfall in the winter season. Winter is a relatively dry season (occasional rainfall events and low rainfall intensities) in Pakistan. Therefore, the performance of the TMPA products in the dry season is insignificant, which is congruent to the findings of [47]. One possible reason for rainfall overestimation and high false alarms in winter is that raindrops may evaporate before reaching the surface in dry conditions. One more possibility is a higher concentration of atmospheric aerosols in the winter season, which may intrude the rainfall and subsequently diminish the precipitation amount observed by a surface rain gauge. A higher aerosol concentration, on the contrary, can increase the cloud drop size as well, which may eventually cause overestimation by a satellite sensor [80]. Another aspect of low agreement between satellite-based rainfall measurements and rain gauge observations in winter or at light rainfall intensities is the errors associated with in-situ rain gauge observations. Tipping bucket (TB) rain gauges may include both systematic as well as random errors at light rainfall intensities. Systematic error may include calibration error, wind-induced error, and sampling error (especially at high temporal sampling) [81]. Thus, at low rainfall intensities, uncertainties are not only associated with satellite measured rainfall, but may also lay with rain gauge observations. Error statistics show that MBE and RMSE have greater values in the monsoon season across all time scales, which agrees with the fact that TMPA maintains greater disparities in the wet season or at high rainfall intensities [43,44,45,47]. Both of the products largely underestimate rainfall in the monsoon season. High-intensity rain events are associated with the monsoon season, and such heavy rainfall intensities may cause signal attenuation of a passive microwave sensor, leading to underestimation in satellite-based precipitation products [80]. Figure 9 gives a good insight into the behavior of CC and RMSE between TMPA products’ rain rates and TRG rain rates at various temporal scales. It should be noted that 3B42RT has an inconsistent behavior at different time scales.
The diurnal rainfall analysis indicates an inconsistent pattern of TMPA products with respect to TRG diurnal pattern, which supports the results of a similar study [49] conducted in China. TMPA products are quite aligned in the pre-monsoon season, but behave differently in other seasons. Monsoon is the most crucial season in Pakistan as it receives a major portion of annual rainfall amount. In this season, the county faces a high frequency of floods. Lai Nullah also receives flash floods typically in the monsoon season. Monsoon diurnal analysis suggests that possible flooding hours are from 02:00 to 11:00 h local time. In these time slots, TRGs show the maximum rainfall amount, with a peak at 05:00 h local time. Also, the rainfall intensities in these time slots have greater variations. Thus, intensive rainfall intensities in these time slots may produce flash floods in Lai Nullah basin. But TMPA products, on the other hand, underestimate rainfall in identifiable time periods, which questions their ability to detect flash floods. This discrepancy has been further emphasized by the July 2008 heavy rainfall events case study. The spatial pattern shows that the July 2008 event was part of the monsoon system generated from the north-eastern directions (India and Nepal) of the country. The case study has shown that TMPA products severely underestimated rainfall in this short-duration hydrometeorological event. Similar results are presented by Anjum et al. during their study [54] on extreme heavy precipitation events over Swat River Basin. In our study, 3B42RT underestimated 36% of the total rainfall amount, while3B42V7, which is a monthly adjusted product, performed even worse and underestimated 48% percent of the total rainfall. Moreover, TMPA products are also not satisfactory in post-monsoon and winter seasons in terms of their diurnal performance.

5. Conclusions

The suitability of the TMPA three-hourly products is studied at the flash flooding site of Lai Nullah basin in Islamabad, Pakistan, using 10-min telemetric rain gauge data. Urban flash flooding is a localized and heterogeneous hydro-meteorological phenomenon and to predict such phenomena, a high spatio-temporal rainfall data in real or near-real time is crucial. The prediction of urban flash flooding is perplexing due to the dearth of good quality in-situ rainfall data. Further, many hydrological models need rainfall at high spatial and temporal resolutions. Satellite sensor-based products may prove to be a good substitute to in-situ rainfall data given that they have a reasonable accuracy. Accurate satellite-based rainfall datasets may assist the scientific community to eliminate rainfall data gaps issues. The current study examines both TMPA products, i.e., a near-real time product (3B42RT) and research version product (3B42V7). Both TMPA products are evaluated at their best possible temporal resolution, i.e., three-hourly rain rates, to check their suitability for flash flood early warnings and water-related modeling. In the current study, scores of categorical indices (POD, FAR, CSI, and SS) show that the performance of TMPA research version in the detection of rain/no-rain events is quite good and has the best scores in a post-monsoon season. However, the performance of the TMPA near-real time product is inferior to the research version. Both TMPA products perform least in the winter season and have the lowest scores for performance indices. Furthermore, the performance of TMPA products is questionable at light rain rates, but it improves at higher rain intensities. Regarding continuous statistical measures, the current study reveals that the correlation coefficient between TMPA (3B42RT, 3B42V7) estimates and telemetric rain gauge observations increases from a modest value (0.41, 0.38) at a three-hourly time interval to a high value (0.91, 0.90) at monthly averages. Moreover, higher mean absolute error and root mean square error are associated with TMPA at three-hourly rain rate measurement. Nevertheless, these errors are reduced at daily, decadal, and monthly rain rate averages. From a seasonal perspective, the TMPA research version underestimates rainfall in monsoon (wet period) and post-monsoon (relatively less wet period), while overestimates rainfall in winter and pre-monsoon (relatively dry seasons). The TMPA near-real time product continuedly underestimates rainfall over all the seasons. Moreover, monsoon and post-monsoon seasons have larger error values compared to winter and pre-monsoon seasons for both products. Values of the correlation coefficient suggest that TMPA estimates are not a substitute of rain gauge data at 3-h and daily time intervals in Pakistan. Diurnal analysis supported by a heavy rainfall case study suggests that the TMPA near-real time product alone is not a good option to predict a localized phenomenon like urban flash flooding in Pakistan. Both TMPA products have a low linear correlation with reference to in-situ rainfall data and higher bias errors at a three-hourly timescale. However, these products can be utilized in synergy with other rainfall datasets. Overall, both TMPA products are more useful at decadal and above decadal time scales, where these products show a significant value for the correlation coefficient (>0.7) with in-situ reference data and exhibit tolerable errors. In comparison, the TMPA research version shows more consistent behavior at various time scales, while the TMPA near-real-time version has severe issues with its consistency at different time scales. Thus, in circumstances when valid ground gauge data is available, TMPA data (near-real-time version in particular) below a decadal scale should be avoided in Pakistan, particularly in hilly/semi-hilly areas where a high probability of errors is associated with TMPA products due to complex topography. Nonetheless, for the extreme conditions like an area with very sparse rain gauge coverage or none at all, both TMPA rainfall products can be a beneficial source at daily and above daily scales. It is suggested to apply bias correction on both products when using them at daily or below daily timescales. Usage of the TMPA 3B42 near-real time product in critical applications like a land slide and flash floods early warning system, or water-related modeling, is not recommended due to higher errors associated with it, and its inconsistent linear relationship with in-situ rainfall data at various timescales. The TMPA research version, however, at a daily and more reliably, above daily time scale, is a good choice for understanding climate patterns, and it can also be used in applications like water-related modeling. Based on these findings, we intend to continue our work of evaluating satellite precipitation products over this flash flooding site with the GPM IMERG and CMORPH products over suitable periods.

Author Contributions

This study is part of a graduate thesis dissertation project by A.U.R., supervised by F.C. A.U.R. and F.C. designed the entire study framework. A.U.R. performed the analysis, compiled results, and co-wrote the manuscript under the guidance of F.C. W.A.Q. and S.G. supported in MATLAB scripting in preprocessing and data pairing of TMPA measurements and in telemetric rain gauge observations. I.S. provided a critical review of the study methodology and provided insights which helped further analysis of findings. K.F. helped in the compilation of results and manuscript writing.

Funding

This research received no external funding.

Acknowledgments

Authors would like to acknowledge the Pakistan Meteorological Department (PMD) for providing telemetric rain gauge data at a ten-minute timescale for Lai nullah basin Islamabad, Pakistan. Authors also acknowledge the National Aeronautics and Space Administration (NASA) and Japan Aerospace Exploration Agency (JAXA) for making TRMM data freely available at https://storm.pps.eosdis.nasa.gov/storm/. We also thank the anonymous referees for constructive suggestions which improved the quality of this work.

Conflicts of Interest

The authors declare no conflict of interest.

References

  1. Wang, W.; Lu, H.; Zhao, T.; Jiang, L.; Shi, J. Evaluation and comparison of daily rainfall from latest gpm and trmm products over the mekong river basin. IEEE J. Sel. Top. Appl. Earth Obs. Remote Sens. 2017, 10, 2540–2549. [Google Scholar] [CrossRef]
  2. Nasreen, Z.; Zeeshan, M. Environmental hazards faced by inhabitants of Nala Lai. Pak. Assoc. Anthropol. 2015, 27, 781–784. [Google Scholar]
  3. Shamim, N. Climate change, flood disasters, human displacement and changing lives and food patterns of marginalized people living in tributeries of Nullah Lai Rawalpindi. Explor. Islam. J. Soc. Sci. 2016, 2, 99–102. [Google Scholar]
  4. Hayat, A. Flash flood forecasting system for Lai Nullah basin (a case study of March 19, 2007 rainfall event). Pak. J. Meteorol. 2007, 4, 75–84. [Google Scholar]
  5. Ahmad, F.; Kazmi, S.F.; Pervez, T. Human response to hydro-meteorological disasters: A case study of the 2010 flash floods in Pakistan. J. Geogr. Reg. Plan. 2011, 4, 518–524. [Google Scholar]
  6. Butt, M. A view from Pakistan: Recurrent flash floods in areas surrounding Nullah Lai, Rawalpindi, Pakistan. Middle East J. Bus. 2014, 9, 29–32. [Google Scholar] [CrossRef]
  7. Hashmi, H.N.; Siddiqui, Q.T.M.; Ghumman, A.R.; Kamal, M.A.; Mughal, H.R. A critical analysis of 2010 floods in Pakistan. Afr. J. Agric. Res. 2012, 7, 1054–1067. [Google Scholar]
  8. Paulikas, M.J.; Rahman, M.K. A temporal assessment of flooding fatalities in Pakistan (1950–2012). J. Flood Risk Manag. 2015, 8, 62–70. [Google Scholar] [CrossRef]
  9. Wikipedia Lai Nullah. 2017. Available online: https://en.wikipedia.org/wiki/Lai_Nullah (accessed on 21 January 2018).
  10. Ahmad, B.; Kaleem, M.S.; Butt, M.J.; Dahri, Z.H. Hydrological modelling and flood hazard mapping of Nullah Lai. Proc. Pak. Acad. Sci. 2010, 47, 215–226. [Google Scholar]
  11. Kamal, A. Pakistan: Lai Nullah Basin Flood Problem Islamabad—Rawalpindi Cities; World Meteorological Organization: Geneve, Switzerland, 2004. [Google Scholar]
  12. Japan International Cooperation Agency. Basic Design Study Report on the Lai Nullah Flood Forecasting and Warning System Project in the Islamic Republic of Pakistan; Japan International Cooperation Agency: Tokyo, Japan, 2005.
  13. Siddiqui, Q.T.M.; Hashmi, H.N.; Ghumman, A.R.; Mughal, H.R. Flood Inundation Modeling for a Watershed in the Pothowar Region of Pakistan. Arab. J. Sci. Eng. 2011, 36, 1203–1220. [Google Scholar] [CrossRef]
  14. Afzal, M.; Zaman, Q. Case study: Heavy rainfall event over Lai Nullah catchment area. Pak. J. Meteorol. 2010, 6, 39–48. [Google Scholar]
  15. Rehman, H.; Chaudhry, A.G.; Nasir, A. Nala Lai and urban ecology: A study of dwellers and disaster management. Pak. Assoc. Anthropol. 2015, 27, 617–619. [Google Scholar]
  16. Iqbal, M.F.; Hussain, A. Validation of satellite based precipitation over diverse topography of Pakistan. Atmos. Res. 2018, 201, 247–260. [Google Scholar] [CrossRef]
  17. Siuki, S.K.; Saghafian, B.; Moazami, S. Comprehensive evaluation of 3-hourly TRMM and half-hourly GPM-IMERG satellite precipitation products. Int. J. Remote Sens. 2017, 38, 558–571. [Google Scholar] [CrossRef]
  18. Boegh, E.; Thorsen, M.; Butts, M.B.; Hansen, S.; Christiansen, J.S.; Abrahamsen, P.; Hasager, C.B.; Jensen, N.O.; van der Keur, P.; Refsgaard, J.C.; et al. Incorporating remote sensing data in physically based distributed agro-hydrological modelling. J. Hydrol. 2004, 287, 279–299. [Google Scholar] [CrossRef]
  19. Huffman, G.J. Global precipitation at one-degree daily resolution from multisatellite observations. J. Hydrometeorol. 2001, 2, 36–50. [Google Scholar] [CrossRef]
  20. Ebert, E.E. Methods for verifying satellite precipitation estimates. In Measuring Precipitation from Space: EURAINSAT and the Future; Levizzani, V., Bauer, P., Turk, F.J., Eds.; Springer: Dordrecht, The Netherlands, 2007; Volume 28, pp. 345–356. [Google Scholar]
  21. Huffman, G.J.; Adler, R.F.; Bolvin, D.T.; Gu, G.; Nelkin, E.J.; Bowman, K.P.; Hong, Y.; Stocker, E.F.; Wolff, D.B. The TRMM Multisatellite Precipitation Analysis (TMPA): Quasi-global, multiyear, combined-sensor precipitation estimates at fine scales. J. Hydrometeorol. 2007, 8, 38–55. [Google Scholar] [CrossRef]
  22. Joyce, R.J.; Janowiak, J.E.; Arkin, A.; Xie, P. CMORPH: A method that produces global precipitation estimates from passive microwave and infrared data at high spatial and temporal resolution. J. Hydrometeorol. 2004, 5, 487–503. [Google Scholar] [CrossRef]
  23. Hsu, K.-L.; Gao, X.; Sorooshian, S.; Gupta, H.V. Precipitation estimation from remotely sensed information using artificial neural networks. J. Appl. Meteorol. 1997, 36, 1176–1190. [Google Scholar] [CrossRef]
  24. Rauniyar, S.P.; Protat, A.; Kanamori, H. Uncertainties in TRMM-Era multisatellite-based tropical rainfall estimates over the Maritime Continent. Earth Space Sci. 2017, 4, 275–302. [Google Scholar] [CrossRef] [Green Version]
  25. Worqlul, A.W.; Yen, H.; Collick, A.S.; Tilahun, S.A.; Langan, S.; Steenhuis, T.S. Evaluation of CFSR, TMPA 3B42 and ground-based rainfall data as input for hydrological models, in data-scarce regions: The upper Blue Nile Basin, Ethiopia. Catena 2017, 152, 242–251. [Google Scholar] [CrossRef]
  26. Roh, W.; Satoh, M.; Nasuno, T. Improvement of a cloud microphysics scheme for a global nonhydrostatic model using trmm and a satellite simulator. J. Atmos. Sci. 2017, 74, 167–184. [Google Scholar] [CrossRef]
  27. Hong, Y.; Adler, R.F.; Negri, A.; Huffman, G.J. Flood and landslide applications of near real-time satellite rainfall products. Nat. Hazards 2007, 43, 285–294. [Google Scholar] [CrossRef] [Green Version]
  28. Yoshimot, S.; Amarnath, G. Applications of satellite-based rainfall estimates in flood inundation modeling—A case study in Mundeni Aru River Basin, Sri Lanka. Remote Sens. 2017, 9, 998. [Google Scholar] [CrossRef]
  29. Ricko, M.; Carton, J.A.; Birkett, C. Climatic effects on lake basins. Part I: Modeling tropical lake levels. J. Clim. 2011, 24, 2983–2999. [Google Scholar] [CrossRef]
  30. Wu, H.; Adler, R.F.; Hong, Y.; Tian, Y.; Policelli, F. Evaluation of global flood detection using satellite-based rainfall and a hydrologic model. J. Hydrometeorol. 2012, 13, 1268–1284. [Google Scholar] [CrossRef]
  31. Kirschbaum, D.; Adler, R.; Adler, D.; Peters-Lidard, C.; Huffman, G. Global distribution of extreme precipitation and high-impact landslides in 2010 relative to previous years. J. Hydrometeorol. 2012, 13, 1536–1551. [Google Scholar] [CrossRef]
  32. Liu, X.; Liu, F.M.; Wang, X.X.; Li, X.D.; Fan, Y.Y.; Cai, S.X.; Ao, T.Q. Combining rainfall data from rain gauges and TRMM in hydrological modelling of Laotian data-sparse basins. Appl. Water Sci. 2017, 7, 1487–1496. [Google Scholar] [CrossRef]
  33. Froidurot, S.; Diedhiou, A. Characteristics of wet and dry spells in the West African monsoon system. Atmos. Sci. Lett. 2017, 18, 125–131. [Google Scholar] [CrossRef]
  34. De Jesús, A.; Breña-Naranjo, J.A.; Pedrozo-Acuña, A.; Yamanaka, V.H.A. The use of TRMM 3B42 product for drought monitoring in Mexico. Water (Switzerland) 2016, 8, 325. [Google Scholar] [CrossRef]
  35. Yong, B.; Liu, D. Global view of real-time TRMM multisatellite precipitation analysis: Implications for its successor global precipitation measurement mission. Bull. Am. Meteorol. Soc. 2015, 96, 283–296. [Google Scholar] [CrossRef]
  36. Prakash, S.; Mitra, A.K.; AghaKouchak, A.; Pai, D.S. Error characterization of TRMM Multisatellite Precipitation Analysis (TMPA-3B42) products over India for different seasons. J. Hydrol. 2015, 529, 1302–1312. [Google Scholar] [CrossRef]
  37. Wu, H.; Adler, R.F.; Tian, Y.; Huffman, G.J.; Li, H.; Wang, J. Real-time global flood estimation using satellite-based precipitation and a coupled land surface and routing model. Water Resour. Res. 2014, 50, 2693–2717. [Google Scholar] [CrossRef] [Green Version]
  38. Chang, L.T.-C.; McAneney, J.; Cheung, K.K.W. Case study of trmm satellite rainfall estimation for landfalling tropical cyclones: Issues and challenges. Trop. Cyclone Res. Rev. 2013, 2, 109–123. [Google Scholar]
  39. Prakash, S.; Mahesh, C.; Gairola, R.M.; Pal, P.K. Comparison of high-resolution TRMM-based precipitation products during tropical cyclones in the North Indian Ocean. Nat. Hazards 2012, 61, 689–701. [Google Scholar] [CrossRef]
  40. National Space Development Agency. TRMM Data Users Handbook; National Space Development Agency of Japan: Saitama, Japan, 2001.
  41. Kidd, C.; Levizzani, V. Status of satellite precipitation retrievals. Hydrol. Earth Syst. Sci. 2011, 15, 1109–1116. [Google Scholar] [CrossRef] [Green Version]
  42. Moazami, S.; Golian, S.; Kavianpour, M.R.; Hong, Y. Comparison of PERSIANN and V7 TRMM Multi-satellite Precipitation Analysis (TMPA) products with rain gauge data over Iran. Int. J. Remote Sens. 2013, 34, 8156–8171. [Google Scholar] [CrossRef]
  43. Almazroui, M. Calibration of TRMM rainfall climatology over Saudi Arabia during 1998–2009. Atmos. Res. 2010, 99, 400–414. [Google Scholar] [CrossRef]
  44. Islam, M.N.; Das, S.; Uyeda, H. Calibration of TRMM derived rainfall over Nepal during 1998–2007. Open Atmos. Sci. J. 2010, 4, 12–23. [Google Scholar] [CrossRef]
  45. Islam, M.N.; Uyeda, H. Use of TRMM in determining the climatic characteristics of rainfall over Bangladesh. Remote Sens. Environ. 2007, 108, 264–276. [Google Scholar] [CrossRef]
  46. Cai, Y.; Jin, C.; Wang, A.; Guan, D.; Wu, J.; Yuan, F.; Xu, L. Comprehensive precipitation evaluation of TRMM 3B42 with dense rain gauge networks in a mid-latitude basin, northeast, China. Theor. Appl. Climatol. 2016, 126, 659–671. [Google Scholar] [CrossRef]
  47. Scheel, M.L.M.; Rohrer, M.; Huggel, C.; Villar, D.S.; Silvestre, E.; Huffman, G.J. Evaluation of TRMM Multi-satellite Precipitation Analysis (TMPA) performance in the Central Andes region and its dependency on spatial and temporal resolution. Hydrol. Earth Syst. Sci. 2011, 15, 2649–2663. [Google Scholar] [CrossRef] [Green Version]
  48. Kotsıfakıs, K.; Felonı, E.; Kotronı, V.; Baltas, E. Evaluation of the Version 7 TRMM Multi-Satellite Precipitation Analysis (TMPA) 3B42 product over Greece. In Proceedings of the 15th International Conference on Environmental Science and Technology, Rhodes, Greece, 31 August–2 September 2017. [Google Scholar]
  49. Yuan, W.; Li, J.; Chen, H.; Yu, R. Intercomparison of summer rainfall diurnal features between station rain gauge data and TRMM 3B42 product over central eastern China. Int. J. Climatol. 2012, 32, 1690–1696. [Google Scholar] [CrossRef]
  50. Sohn, B.J.; Han, H.J.; Seo, E.K. Validation of satellite-based high-resolution rainfall products over the Korean Peninsula using data from a dense rain gauge network. J. Appl. Meteorol. Climatol. 2010, 49, 701–714. [Google Scholar] [CrossRef]
  51. Villarini, G. Evaluation of the research-version TMPA rainfall estimate at its finest spatial and temporal scales over the Rome metropolitan area. J. Appl. Meteorol. Climatol. 2010, 49, 2591–2602. [Google Scholar] [CrossRef]
  52. Sapiano, M.R.P.; Arkin, P.A. An intercomparison and validation of high-resolution satellite precipitation estimates with 3-hourly gauge data. J. Hydrometeorol. 2009, 10, 149–166. [Google Scholar] [CrossRef]
  53. Hussain, Y.; Sathe, F.; Hussain, M.B.; Martinez, H.E. Performance of CMORPH, TMPA, and PERSIANN rainfall datasets over plain, mountainous, and glacial regions of Pakistan. Theor. Appl. Climatol. 2017, 131, 1–14. [Google Scholar] [CrossRef]
  54. Anjum, M.N.; Ding, Y.; Shangguan, D.; Ijaz, M.W.; Zhang, S. Evaluation of high-resolution satellite-based real-time and post-real-time precipitation estimates during 2010 extreme flood event in Swat River Basin, Hindukush Region. Adv. Meteorol. 2016, 2016, 1–8. [Google Scholar] [CrossRef]
  55. Anjum, M.N.; Ding, Y.; Shangguan, D.; Tahir, A.A.; Iqbal, M.; Adnan, M. Comparison of two successive versions 6 and 7 of TMPA satellite precipitation products with rain gauge data over Swat Watershed, Hindukush Mountains, Pakistan. Atmos. Sci. Lett. 2016, 17, 270–279. [Google Scholar] [CrossRef] [Green Version]
  56. Khan, S.I.; Hong, Y.; Gourley, J.J.; Huelsing, H.K.; Khattak, M.U.; Vergara, H.J. Spatial and diurnal variability of monsoon systems assessed by TRMM rain rate over Indus Basin. IEEE J. Sel. Top. Appl. Earth Obs. Remote Sens. 2015, 8, 4325–4335. [Google Scholar] [CrossRef]
  57. Khan, S.I.; Hong, Y.; Gourley, J.J.; Khattak, M.U.K.; Yong, B.; Vergara, H.J. Evaluation of three high-resolution satellite precipitation estimates: Potential for monsoon monitoring over Pakistan. Adv. Sp. Res. 2014, 54, 670–684. [Google Scholar] [CrossRef]
  58. Ali, M.; Khan, S.J.; Aslam, I.; Khan, Z. Simulation of the impacts of land-use change on surface runoff of Lai Nullah Basin in Islamabad, Pakistan. Landsc. Urban Plan. 2011, 102, 271–279. [Google Scholar] [CrossRef]
  59. Jarraud, M. Measurement of precipitation. In Guide to Meteorological Instruments and Methods of Observation (WMO-No. 8), 7th ed.; World Meteorological Organisation: Geneva, Switzerland, 2008. [Google Scholar]
  60. Liu, Z. Comparison of versions 6 and 7 3-hourly TRMM multi-satellite precipitation analysis (TMPA) research products. Atmos. Res. 2015, 163, 91–101. [Google Scholar] [CrossRef]
  61. Huffman, G.J.; Adler, R.F.; Bolvin, D.T.; Nelkin, E.J. The TRMM multi-satellite precipitation analysis (TMPA). In Satellite Rainfall Applications for Surface Hydrology; Springer: New York, NY, USA, 2010; pp. 3–22. [Google Scholar]
  62. Prakash, S.; Gairola, R.M. Validation of TRMM-3B42 precipitation product over the tropical Indian Ocean using rain gauge data from the RAMA buoy array. Theor. Appl. Climatol. 2014, 115, 451–460. [Google Scholar] [CrossRef]
  63. Porcù, F.; Milani, L.; Petracca, M. On the uncertainties in validating satellite instantaneous rainfall estimates with raingauge operational network. Atmos. Res. 2014, 144, 73–81. [Google Scholar] [CrossRef]
  64. Yu, S.; Eder, B.; Dennis, R.; Chu, S.-H.; Schwartz, S.E. New unbiased symmetric metrics for evaluation of air quality models. Atmos. Sci. Lett. 2006, 7, 26–34. [Google Scholar] [CrossRef] [Green Version]
  65. Tang, G.; Zeng, Z.; Long, D.; Guo, X. Statistical and hydrological comparisons between trmm and gpm level-3 products over a midlatitude basin: Is day-1 IMERG a good successor for TMPA 3B42V7? J. Hydrometeorol. 2016, 17, 121–137. [Google Scholar] [CrossRef]
  66. Kumar, D.; Gautam, A.K.; Palmate, S.S.; Pandey, A.; Suryavanshi, S.; Rathore, N.; Sharma, N. Evaluation of TRMM multi-satellite precipitation analysis (TMPA) against terrestrial measurement over a humid sub-tropical basin, India. Theor. Appl. Climatol. 2017, 129, 783–799. [Google Scholar] [CrossRef]
  67. Feidas, H.; Porcu, F.; Puca, S.; Rinollo, A.; Lagouvardos, C.; Kotroni, V. Validation of the H-SAF precipitation product H03 over Greece using rain gauge data. Theor. Appl. Climatol. 2018, 131, 377–398. [Google Scholar] [CrossRef]
  68. Yin, S.; Chen, D.; Xie, Y. Diurnal variations of precipitation during the warm season over China. Int. J. Climatol. 2009, 29, 1154–1170. [Google Scholar] [CrossRef] [Green Version]
  69. Jeong, J.H.; Walther, A.; Nikulin, G.; Chen, D.; Jones, C. Diurnal cycle of precipitation amount and frequency in Sweden: Observation versus model simulation. Tellus Ser. A Dyn. Meteorol. Oceanogr. 2011, 63, 664–674. [Google Scholar] [CrossRef]
  70. Pfeifroth, U.; Trentmann, J.; Fink, A.H.; Ahrens, B. Evaluating satellite-based diurnal cycles of precipitation in the African tropics. J. Appl. Meteorol. Climatol. 2016, 55, 23–39. [Google Scholar] [CrossRef]
  71. Haider, K.; Khokhar, M.F.; Chishtie, F.; RazzaqKhan, W.; Hakeem, K.R. Identification and future description of warming signatures over Pakistan with special emphasis on evolution of CO2 levels and temperature during the first decade of the twenty-first century. Environ. Sci. Pollut. Res. 2017, 24, 7617–7629. [Google Scholar] [CrossRef]
  72. Hussain, S.; Xianfang, S.; Hussain, I.; Jianrong, L.; Mei, H.D.; Hu, Y.L.; Huang, W. Controlling factors of the stable isotope composition in the precipitation of Islamabad, Pakistan. Adv. Meteorol. 2015, 2015, 1–11. [Google Scholar] [CrossRef]
  73. Ali, N.; Khan, E.U.; Akhter, P.; Hussain, S. Wet depositional fluxes of 210Pb- and 7Be-bearing aerosols at two different altitude cities of North Pakistan. Atmos. Environ. 2011, 45, 5699–5709. [Google Scholar] [CrossRef]
  74. Imran, A.; Zaman, Q.; Afzal, M. Temporal trends in the peak monsoonal precipitation events over Northeast Pakistan. Pakistan J. Meteorol. Vol. 2013, 10, 19–30. [Google Scholar]
  75. Madhura, R.K.; Krishnan, R.; Revadekar, J.V.; Mujumdar, M.; Goswami, B.N. Changes in western disturbances over the Western Himalayas in a warming environment. Clim. Dyn. 2014, 44, 1157–1168. [Google Scholar] [CrossRef]
  76. Rain Measurement. 2018. Available online: http://wiki.sandaysoft.com/a/Rain_measurement (accessed on 10 March 2018).
  77. Ali, A.F.; Xiao, C.; Anjum, M.N.; Adnan, M.; Nawaz, Z.; Ijaz, M.W.; Sajid, M.; Farid, H.U. Evaluation and comparison of TRMM multi-satellite precipitation products with reference to rain gauge observations in Hunza River Basin, Karakoram Range, Northern Pakistan. Sustainability 2017, 9, 1954. [Google Scholar] [CrossRef]
  78. Anjum, M.N.; Ding, Y.; Shangguan, D.; Ahmad, I.; Ijaz, M.W.; Farid, H.U.; Yagoub, Y.E.; Zaman, M.; Adnan, M. Performance evaluation of latest integrated multi-satellite retrievals for Global Precipitation Measurement (IMERG) over the northern highlands of Pakistan. Atmos. Res. 2018, 205, 134–146. [Google Scholar] [CrossRef]
  79. Muhammad, W.; Yang, H.; Lei, H.; Muhammad, A.; Yang, D. Improving the Regional Applicability of Satellite Precipitation Products by Ensemble Algorithm. Remote Sens. 2018, 10, 577. [Google Scholar] [CrossRef]
  80. Qin, Y.; Chen, Z.; Shen, Y.; Zhang, S.; Shi, R. Evaluation of satellite rainfall estimates over the Chinese mainland. Remote Sens. 2014, 6, 11649–11672. [Google Scholar] [CrossRef]
  81. Tokay, A.; Wolff, D.B.; Wolff, K.R.; Bashor, P. Rain gauge and disdrometer measurements during the Keys Area Microphysics Project (KAMP). J. Atmos. Ocean. Technol. 2003, 20, 1460–1477. [Google Scholar] [CrossRef]
Figure 1. Map of study area showing (a) location of TRGs and TMPA pixel area, (b) elevation, and (c) population density (persons per square kilometer). (Data sources: ASTER 30-m Digital Elevation Model for topography, LandScan 2011 for population density).
Remotesensing 10 02040 g001
Figure 2. TMPA categorical skill scores at the three-hourly time scale.
Remotesensing 10 02040 g002
Figure 3. Performance indices as a function of an increasing rain intensity for (a) 3B42RT and (b) 3B42V7. (c) The number of event occurrences in percentage at various rainfall thresholds.
Remotesensing 10 02040 g003
Figure 4. Performance in the detection of rainfall intensities by (a) 3B42RT and (b) 3B42V7. (c) Performance comparison of 3B42RT and 3B42V7.
Remotesensing 10 02040 g004
Figure 5. Scatterplots of 3B42RT (left column) and 3B42V7 (right column) rain rates versus TRG rain rates at (a,b) 3-h interval, (c,d) mean daily, and (e,f) mean decadal. The dotted line shows the linear relationship.
Remotesensing 10 02040 g005aRemotesensing 10 02040 g005b
Figure 6. Scatterplots of 3B42RT (left column) and 3B42V7 (right column) rain rates versus TRG rain rates for (a,b) 365 calendar days and (c,d) 12 calendar months. The dotted line shows the linear relationship.
Remotesensing 10 02040 g006aRemotesensing 10 02040 g006b
Figure 7. Accumulated rainfall comparison between TMPA and TRG at annual time scales.
Remotesensing 10 02040 g007
Figure 8. Season-wise various indices score for (a) 3B42RT, (b) 3B42V7, and (c) Bias scores for both TMPA products. Statistics have been calculated for hourly instantaneous rain rates at a 3-h timescale. The dotted lines show scores for the entire period (2007–2010).
Remotesensing 10 02040 g008
Figure 9. Season-wise validation statistics for 3B42RT (left column) and 3B42V7 (right column) (a,b) MBE, (c,d) MAE, (e,f) RMSE, and (g,h) CC at different time intervals. The dotted lines show validation scores for the entire time span (2007–2010).
Remotesensing 10 02040 g009aRemotesensing 10 02040 g009b
Figure 10. Monthly accumulated rainfall pattern of TMPA and TRG for the (a) year 2007, (b) year 2008, (c) year 2009, and (d) year 2010.
Remotesensing 10 02040 g010aRemotesensing 10 02040 g010b
Figure 11. Accumulated rainfall comparison between TMPA and TRG at the seasonal timescale.
Remotesensing 10 02040 g011
Figure 12. Diurnal cycle of precipitation: (a) average rainfall intensity, (b) total rainfall amount, and (c) frequency of rainfall occurrence.
Remotesensing 10 02040 g012
Figure 13. Season-wise diurnal precipitation patterns for: (ac) pre-monsoon, (df) monsoon, (gi) post-monsoon and (jl) winter seasons. Rainfall intensities are in the left column, the rainfall amount is in the middle, and rainfall frequency is in the right column.
Remotesensing 10 02040 g013
Figure 14. Heavy rain event in July 2008: (a) rain rate (mm/h) pattern for TRG, 3B42RT, and 3B42V7 data at the three-hourly time interval.
Remotesensing 10 02040 g014
Figure 15. Total rainfall amount calculated from 4 July 2008 to 9 July 2008.
Remotesensing 10 02040 g015
Figure 16. Daily rainfall patterns at the regional scale; from 1 July 2008 to 10 July 2008. Red box approximates study area location.
Remotesensing 10 02040 g016
Table 1. PMD telemetric rain gauges’ specifications.
SNNameDistrictCoordinatesElevation (m)
Longitude (E)Latitude (N)
1SaidpurIslamabad73°03′51″33°44′33″668
2GolraIslamabad72°58′55″33°41′38″556
3PMDIslamabad73°03′51″33°40′59″531
4BokraIslamabad73°00′39″33°37′38″528
5RAMCRawalpindi73°05′07″33°38′53″508
6ChaklalaRawalpindi73°05′60″33°36′27″506
Table 2. List of the statistical indices used in the evaluation and validation of TMPA Products.
Type Statistical IndexEquationPerfect ValueDescription
Categorical Statistical MeasuresBiasBias = H + FA H + M − 10H = hits (rain at both)
FA = false alarms (rain at measured and no-rain at observed)
M = misses (no-rain at measured and rain at observed)
Z = zeros (no-rain at both)
N = total events
Probability of Detection (POD)POD = H H + M 1
False Alarm Ratio (FAR)FAR = FA H + FA 0
Threat Score (TS)TS = H H + M + FA 1
Equitable Threat Score (ETS)ETS = H H Rand H + M + FA H Rand
HRand = ( H + M ) × ( H + FA ) N
Skill Score (SS)SS = Z × H FA × M Z + FA × M + H 1
Continuous Statistical MeasuresMean Bias Error (MBE)MBE = 1 n   1 n ( M O ) 0n = number of samples,
M = measured value (TMPA)
O = observed value (TRG),
X = data element (X = M for TMPA products and X = O for TRG)
Bar on variable shows mean value
Mean Absolute Error (MAE)MAE = 1 n   1 n | M O | 0
Root Mean Square Error (RMSE)RMSE = 1 n ( M O ) 2 n 0
Correlation Coefficient (CC)CC = 1 n ( M M ¯ )   ( O O ¯ ) 1 n ( M M ¯ ) 2 1 n ( O O ¯ ) 2 1
Standard Deviation (SD)SD = 1 n ( X X ¯ ) 2 n NA
Table 3. Classification of rainfall intensities.
SNRain CategoryThreshold (mm/h)
1Light rain<1
2Moderate rain1–4
3Heavy rain4–16
4Very heavy rain16–50
5Extreme rain>50
Table 4. Continuous statistics for hourly rain rates (mm/h). Rain rate values at 3-h interval are instantaneous. Daily and above daily rain rates are averaged over time.
TimescaleRain Rate (mm/h)SD (mm/h)MBE (mm/h)MAE (mm/h)RMSE (mm/h)CC
TRG3B42TRG3B423B423B423B423B42
RTV7 RTV7RTV7RTV7RTV7RTV7
3-h Interval2.421.501.725.182.863.30−0.92−0.702.472.464.885.010.410.38
Mean Daily0.400.300.350.650.510.60−0.10−0.050.350.340.610.610.480.53
Mean Decadal0.160.120.140.220.140.16−0.04−0.020.080.070.140.140.790.77
Mean Monthly0.140.110.120.170.110.12−0.03−0.020.060.080.090.080.910.90
Table 5. Validation statistics at different time scales in different seasons. Rain rate values at a 3-h interval are instantaneous. Daily and above daily rain rates are averaged over time.
TimescaleRain Rate (mm/h)SD (mm/h)MBE (mm/h)MAE (mm/h)RMSE (mm/h)CC
TRG3B42TRG3B423B423B423B423B42
RTV7 RTV7RTV7RTV7RTV7RTV7
Pre-monsoon3-h1.281.021.412.191.592.16−0.260.131.471.582.462.590.190.29
Mean Daily0.170.160.220.300.270.39−0.010.050.180.200.320.330.380.58
Mean Decadal0.070.060.080.090.060.11−0.010.010.040.030.060.050.740.95
Mean Monthly0.070.060.090.040.030.06−0.010.020.030.020.040.030.460.92
Monsoon3-h3.442.002.116.803.574.14−1.44−1.333.283.246.316.540.440.40
Mean Daily0.590.430.450.840.640.75−0.16−0.140.480.450.780.800.490.51
Mean Decadal0.340.240.260.300.190.20−0.10−0.080.160.160.230.240.700.65
Mean Monthly0.330.240.260.210.140.14−0.09−0.070.130.100.150.140.850.83
Post-monsoon3-h2.951.671.725.472.512.97−1.28−1.232.662.635.315.170.340.40
Mean Daily0.450.290.300.610.430.50−0.16−0.150.380.350.620.590.380.48
Mean Decadal0.120.080.080.120.060.09−0.04−0.040.070.050.110.080.570.83
Mean Monthly0.100.070.070.100.050.07−0.03−0.030.050.030.080.050.590.94
Winter3-h1.210.901.201.642.022.10−0.31−0.011.691.642.532.480.070.24
Mean Daily0.240.210.290.370.390.44−0.030.050.290.260.480.400.200.54
Mean Decadal0.080.070.090.090.060.10−0.010.020.050.030.080.050.570.85
Mean Monthly0.060.050.070.050.040.06−0.010.010.020.020.030.030.790.94

