Development of Himawari-8/Advanced Himawari Imager (AHI) Land Surface Temperature Retrieval Algorithm


Department of Atmospheric Science, Kongju National University, 56, Gongjudaehak-ro, Gongju-si, Chungcheongnam-do 32588, Korea
*
Author to whom correspondence should be addressed.
Remote Sens. 2018, 10(12), 2013; https://doi.org/10.3390/rs10122013
Submission received: 25 October 2018
/
Revised: 5 December 2018
/
Accepted: 8 December 2018
/
Published: 12 December 2018
(This article belongs to the Section Atmospheric Remote Sensing)
Abstract
:We developed land surface temperature (LST) retrieval algorithms based on the time of day and water vapor content using the Himawari-8/AHI (Advanced Himawari Imager) data, which is the Japanese next generation geostationary satellite. To develop the LST retrieval algorithms, we simulated the spectral radiance using the radiative transfer model (MODTRAN4) by applying the atmospheric profiles (SeeBor), diurnal variation of LST and air temperature, spectral emissivity of land surface, satellite viewing angle, and spectral response function of Himawari-8/AHI. To retrieve the LST from Himawari-8 data, a linear type of split-window method was used in this study. The Himawari-8 LST algorithms showed a high correlation coefficient (0.996), and a small bias (0.002 K) and root mean square error (RMSE) (1.083 K) between prescribed LSTs and estimated LSTs. However, the accuracy of LST algorithms showed a slightly large RMSE when the lapse rate was larger than 10 K, and the brightness temperature difference was greater than 6 K. The cross-validation of Himawari-8/AHI LST using the MODIS (Terra and Aqua Moderate Resolution Imaging Spectroradiometer) LST showed that annual mean correlation coefficient, bias, and RMSE were 0.94, +0.45 K, and 1.93 K, respectively. The performances of LST algorithms were slightly dependent on the season and time of day, generally better during the night (warm season) than during the day (cold season).
1. Introduction
Land surface temperature (LST) is affected by the solar zenith angle (SZA), albedo, land cover, soil moisture, and so on [1,2,3], and is an important biophysical parameter of the Earth’s surface that regulates sensible and latent heat fluxes between the surface and the atmosphere. It is therefore important to obtain quantitative and periodic observational LST data for use in a variety of studies, such as those analyzing surface urban heat islands of large cities, making drought predictions for agricultural purposes, and estimating soil moisture [4,5,6,7,8,9].
LST is highly variable, both spatially and temporally, owing to nonuniform surface properties such as vegetation, altitude, and soil moisture, and it is thus not possible to make in situ observations that are sufficiently accurate and high resolution [10,11]. Thus, LST is regularly observed only at very few special observatories. Currently, LST data, which are required by a variety of applications, are obtained from satellite data observed at a high spatial resolution and short time intervals.
Attempts to retrieve LST using satellite data have been the basis of many studies conducted since the 1970s, and some studies have focused on techniques for retrieving sea surface temperatures (SSTs) from thermal infrared radiation and extending them to LST [12,13,14,15,16,17]. Specifically, a number of algorithms have been developed for retrieving LST from data acquired by different satellites, such as National Oceanic and Atmospheric Administration (NOAA)/Advanced Very High-Resolution Radiometer (AVHRR), Terra and Aqua Moderate Resolution Imaging Spectroradiometer (MODIS), and Landsat Thematic Mapper (TM), which provide adequately high temporal and spatial resolution data, regardless of geographical features [15,18,19,20,21,22,23]. Furthermore, with the substantial advances made in the spatial resolution, temporal frequency and radiometric resolution of geostationary meteorological satellites, many studies have begun to employ associated data to retrieve LST [24,25,26,27,28,29]. In Korea, the National Meteorological Satellite Center (NMSC) operationally retrieves LST using the Communication, Ocean, Meteorological Satellite (COMS), which is Korea’s first geostationary multipurpose satellite [30,31,32].
A new generation of meteorological satellites equipped with improved sensors have recently been developed and launched by countries such as the United States, China, Japan, and the European Union (EU), including the Geostationary Operational Environmental Satellite-16 (GOES-16, previously known as GOES-R), Meteosat Third Generation (MTG), Himawari-8/9, and Feng Yun-4A (FY-4A) [33,34,35]. Also, the Korean Meteorological Administration (KMA) plans to launch the GeoKompsat-2 Atmosphere (GK-2A), which is equipped with an Advanced Meteorological Imager (AMI), in December 2018. The United States’ GOES-16 Advanced Baseline Imager (ABI) group of NOAA’s National Environmental Satellite, Data, and Information Service (NESDIS), and the EU’s Sentinel-3 Sea and Land Surface Temperature Radiometer (SLSTR) group specify that LST is one of the primary outputs [28,29,36]. Although various studies on surface–atmosphere interactions are being performed in East Asia and there is a growing demand for high-resolution and high-accuracy LST data, there is a limited number of countries or institutes that officially provides LST data. Although the KMA provides LST data retrieved from the COMS satellite, its mission ends in 2019. Therefore, retrieval and services of LST data from the Himawari-8/Advanced Himawari Imager (AHI) and GK-2A/AMI data are necessary to provide the LST continuously and utilize the new capability of these two satellites [37].
GK-2A/AMI is the geostationary meteorological satellite that will replace the COMS when it is launched in 2018. In this study, we developed an LST retrieval algorithm using data from Himawari-8/AHI with the aim of providing LST data for the East Asia region and the GK-2A/AMI observation region. The contents of this paper are as follows. Data properties and research methods relating to the LST retrieval algorithm are described in Section 2, and the LST retrieval processes and results are presented in Section 3. We also present direct and indirect validation results using in situ data and other satellite based LST data in Section 3. Furthermore, we discuss the current retrieval status, limitations of the algorithm, and plans for future improvements in Section 4.
2. Data and Methods
2.1. Data
In this research, we used Himawari-8/AHI data provided by the KMA/NMSC. Himawari-8 is Japan’s next-generation geostationary meteorological satellite that was launched in 2014 and has been in operation since July 2015. It is located at 140.2°E longitude and is equipped with an AHI sensor that has 16 channels. To retrieve LST from Himawari-8/AHI data, we used data from channels 13 (Ch. 13, 10.41 μm) and 15 (Ch. 15, 12.38 μm) and their spectral response functions (SRFs), in addition to land/sea and cloud masking data provided by the NMSC. Figure 1 shows the SRFs of the thermal infrared channels of Himawari-8/AHI. The Himawari-8/AHI has observation periods of 10 min, full disk observation modes, and spatial resolutions of approximately 2 km at nadir. The observation area of Himawari-8/AHI is characterized by different land cover types, including tropical forests and desert areas, and by different climate conditions according to the geographic location and season. Figure 2 shows the spatial distribution of Himawari-8 LST over the full disk observation area. The analysis period used in this study was one year, from September 2015 to August 2016. The output from the GK-2A cloud detection algorithm provided by the NMSC was applied to the Himawari-8/AHI data as cloud masking data [38], and the temporal and spatial resolutions of the cloud masking data are 1 h and approximately 2 km at its nadir, respectively.
The LST retrieval methods from satellite data can be simply divided into two types based on the assumption of known land surface emissivity (LSE) [13,14,39,40] and LST retrieval with unknown LSE [16,41,42,43,44,45,46,47,48]. In this research, we used the generalized split-window method to retrieve the LST and assumed that LSE was already known [13,23]. The LSE data used in this study were derived from [49], which is the modified version of the vegetation cover method (VCM) in Reference [50], and these were then re-gridded for the Himawari-8 observation area. The temporal resolution of the LSE is 8 days and the spatial resolution is 2 km.
LST retrieval methods typically consider several atmospheric and land surface factors that affect LST within the area observed by the satellite. Simulated data are then constructed by performing the radiative transfer model (RTM) using various conditions including atmospheric profiles, viewing geometry, and LSE and reference LST data. Furthermore, a multiple regression between the reference LST and the estimated brightness temperature of satellite was then conducted [51,52,53]. The SeeBor version 5.0 data were used as the atmospheric profiles [54,55]; these data provide profiles of temperature, moisture, and ozone, and represent 15,704 global profiles obtained from NOAA-88, the ECMWF 60 L training set, TIGR-3, ozonesondes, and radiosondes [55].
In situ observed LST data for the Himawari-8 observation area are very limited. In this study, we used data from one in situ Baseline Surface Radiation Network (BSRN) station over Tateno (Japan) to validate the retrieved LST. It was thus necessary to conduct a cross-validation for the algorithm to verify its ability to retrieve LST, and MODIS (MOD/MYD11_L2 Swath Products collection 6) high-quality LST data were used for the indirect validation of retrieved LST data [56]. The intensive validation of MODIS LST data with in situ observed LST data throughout the United States showed that the root mean square error (RMSE) is less than 1.0 K [57,58,59,60]. MODIS LST data are swath data with a spatial resolution of 1 km at nadir, and LST data are obtained at 5-min intervals as the polar orbiting satellite, Terra/Aqua moves along its orbit.
2.2. Methodology
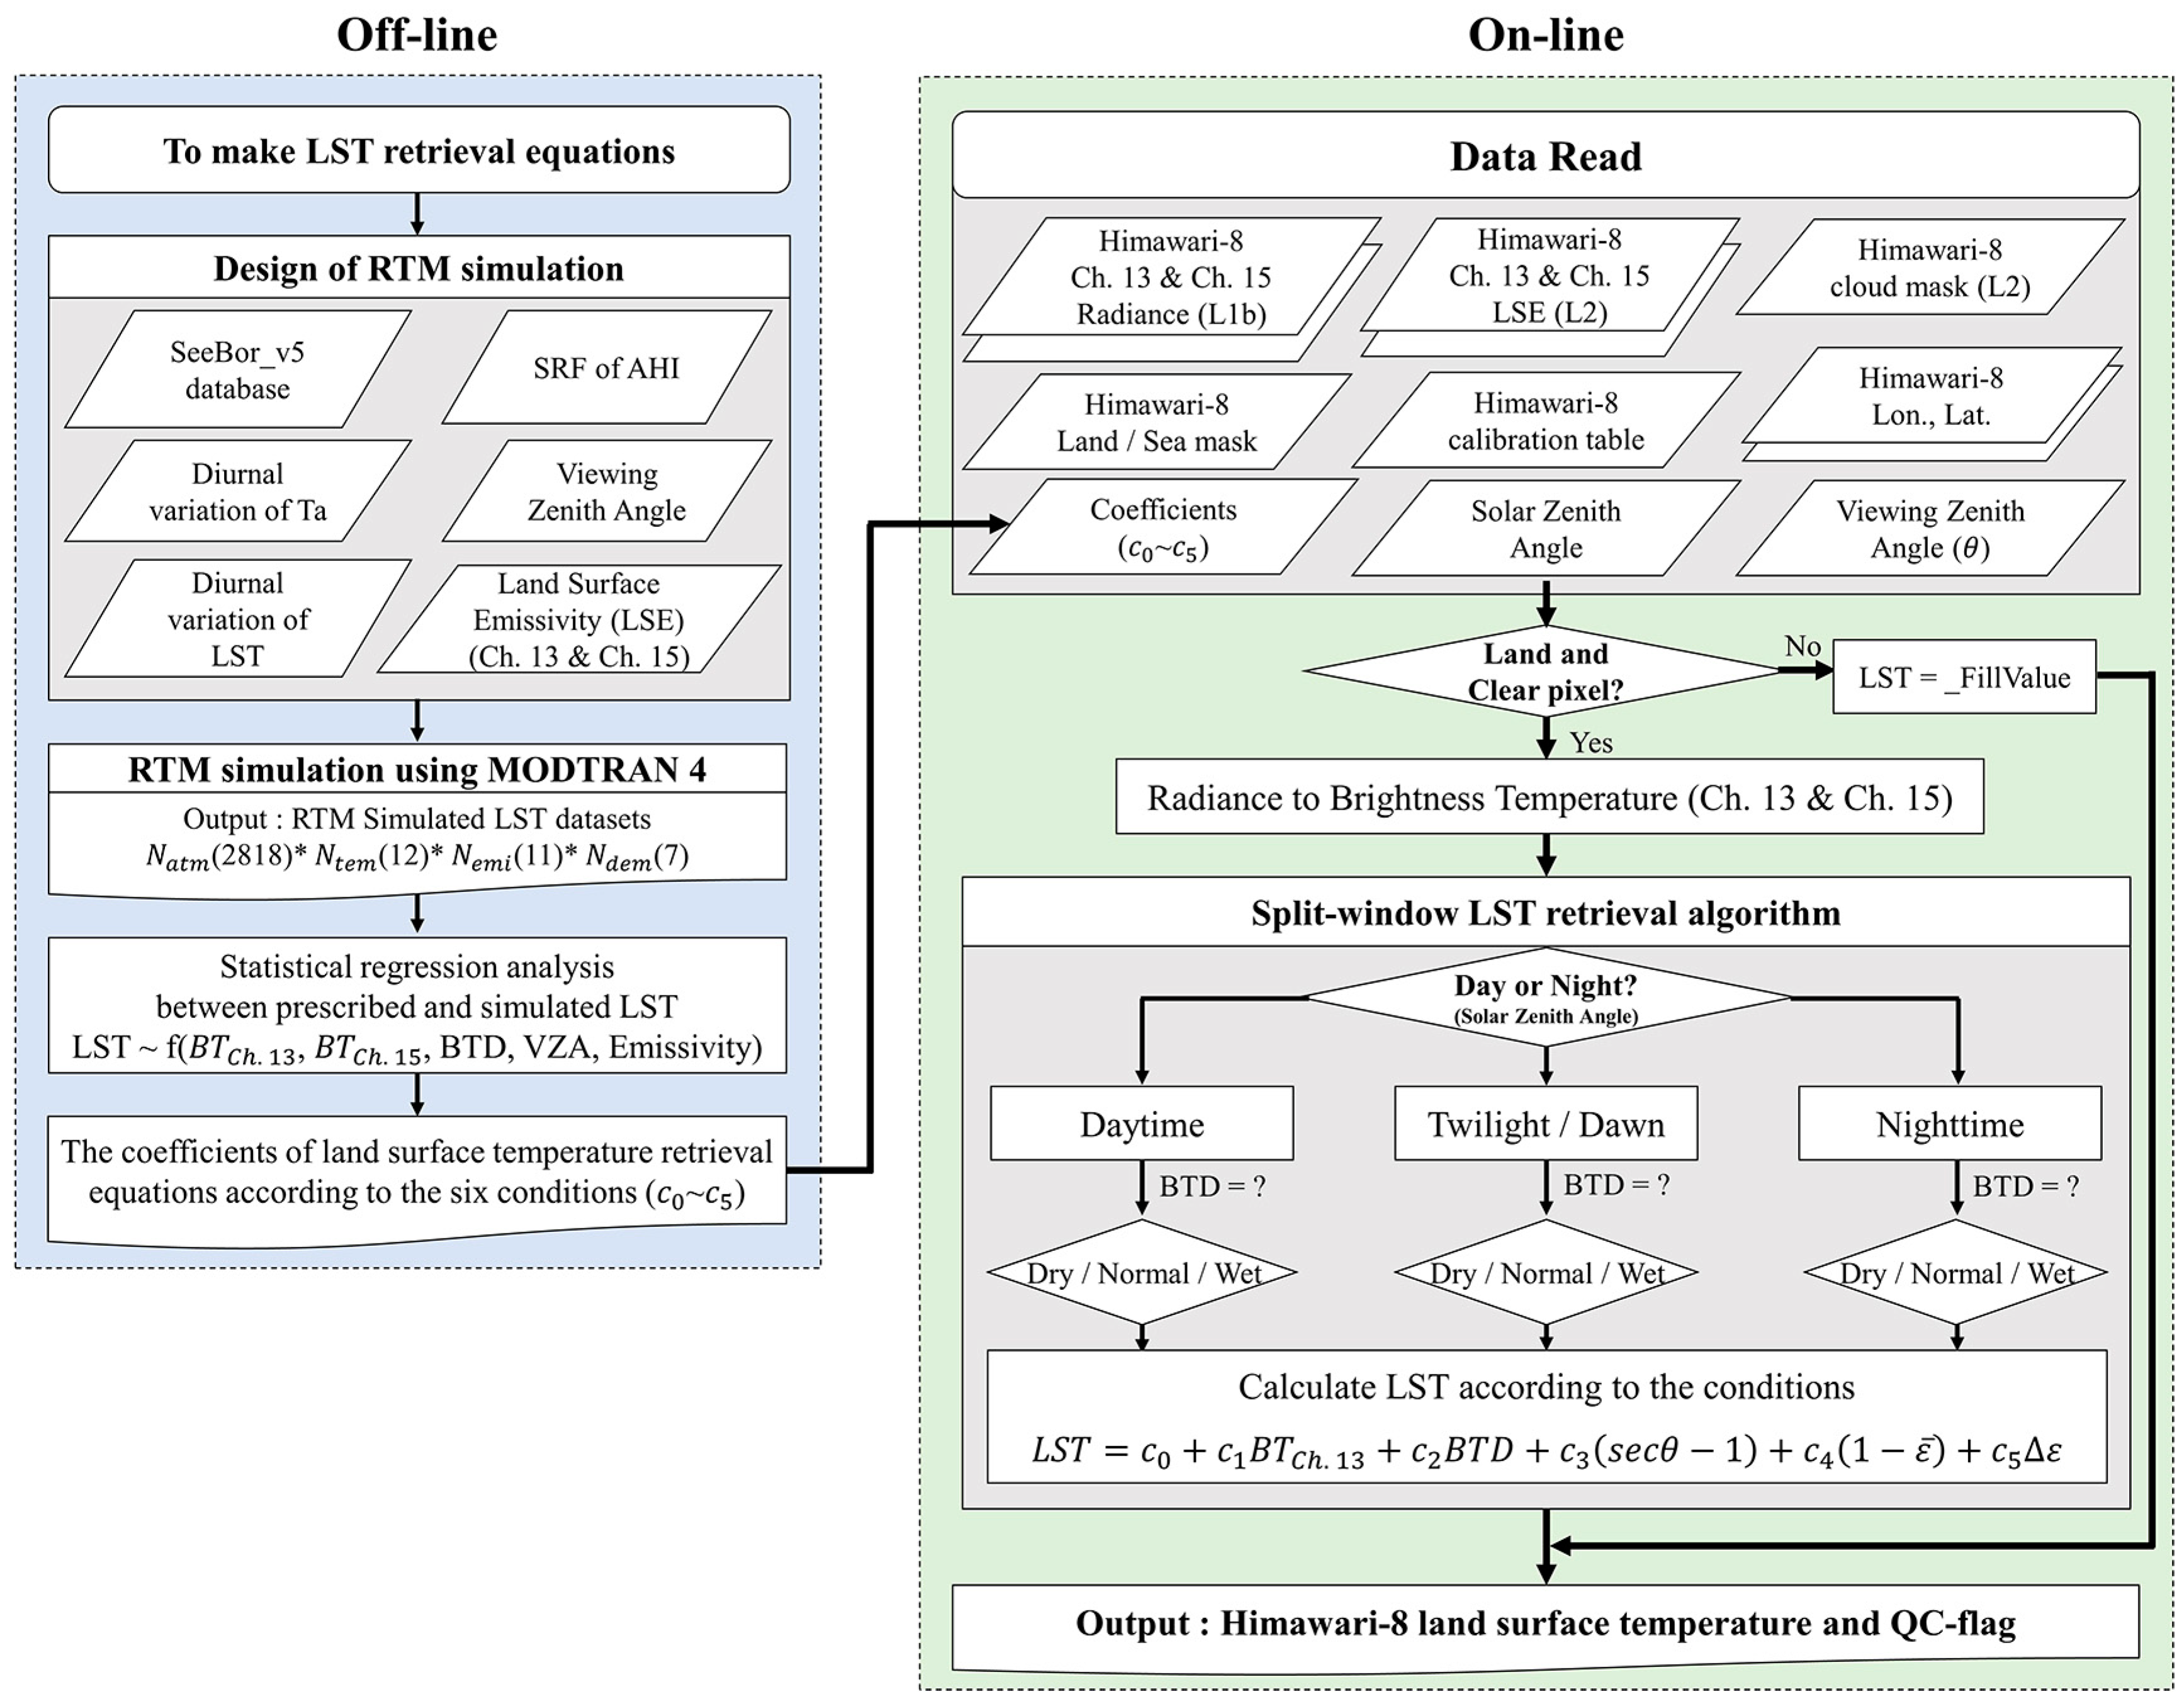
The Himawari-8/AHI LST retrieval algorithm developed in this research consisted of four sequential steps, as shown in Figure 3. To produce the LST database that corresponds to Himawari-8/AHI satellite observations, simulation data were generated using a variety of atmospheric and surface conditions prescribed in the RTM. The RTM used in this study is MODTRAN4 and the detailed documentation about the MODTRAN4 is found in Reference [54]. The accuracy of LST retrievals is mainly influenced by the air temperature (Ta) lapse rate near the surface and the moisture in the atmosphere [11,23,24,32,61]. In consideration of this, we separated the simulation data generated through the MODTRAN 4 simulation according to the air temperature lapse rate (difference between LST and Ta) and atmospheric moisture amount derived from the brightness temperature difference (BTD) between channels 13 and 15, and then determined the LST retrieval coefficients. The LST retrieval formulas were then used to estimate LST, which was subsequently compared to the reference LST to evaluate the accuracy of LST retrieval formulas. The developed LST retrieval formulas were directly applied to Himawari-8/AHI data to retrieve LST, and MODIS LST data were used for indirect validation.
To construct simulation data through the RTM simulations needed for the determination of the LST retrieval coefficients of multiple regression equations, consideration of various impacting factors is necessary [26,30,51,52,62,63,64,65]. In this research, we used the SRF of the Himawari-8/AHI and 2818 profiles from the 15704 SeeBor v5.0 profiles, for which the viewing zenith angle (VZA) of Himawari-8/AHI is less than 50°. This angle was chosen because the quality of the LST data is significantly lower with an increase in the VZA. The RTM conditions used in these simulations are shown in Table 1.
RTM simulations were conducted separately for day and night. We assumed that diurnal variations of LST (Ta − 6 K to Ta + 16 K) were greater than that of air temperature (Ta). Because the observation area of Himawari-8/AHI is composed of various types of land cover, such as desert and semi-desert [66], the conditions for separating day from night were based on the larger LST diurnal variations during day time than night time, as shown in previous studies (Day: Ta − 2 K to Ta +16 K; Night: Ta − 6 K to Ta + 2K) [22,30,67]. To minimize the errors caused by fixed Ta, we included diurnal variations in Ta based on the assumption that they were equal to half of the LST variation. The lapse rate clearly depends on the land surface conditions (such as land cover, leaf area index, and soil moisture) for the same SZA. We used overlap conditions in the range [Ta − 2 K:Ta + 2 K] between day and night to consider the diversity of the lapse rate. Furthermore, to account for the different effects of water vapor, we developed LST retrieval equations separately according to total water vapor. In this process, separation criteria were derived manually by visually inspecting RMSE variations according to the amount of water vapor (can be represented BTD) in one regression equation. In this study, separation of day and night was based on the temperature lapse rate in the RTM simulation as shown in Figure 4; however, the SZA of each pixel was used to separate day from night when LST was retrieved from Himawari-8/AHI data. As in many studies, threshold angles for the day and night separation are 80° and 100°, respectively. The pixels with SZA between 80° and 100° were regarded as the dawn and twilight period, and the LST of these pixels were recalculated as the linear average of the two LST algorithms (the day and night LST algorithms).
Figure 4 shows the RMSE values according to factors affecting LST retrieval. Results show that RMSE values are mostly affected by the BTD, regardless of the other impacting factors. To reflect the strong impact of BTD on LST retrieval, we developed the LST retrieval algorithm as a function of BTD and constructed dry (BTD ≤ 0 K), normal (0 K ≤ BTD ≤ 6 K), and moist (BTD > 6 K) algorithms because the BTD stands for the total atmospheric water vapor.
In this research, a linear type of split-window method was developed to retrieve LST from Himawari-8/AHI data. The split-window method uses the difference in absorption between two adjacent infrared channels to correct for atmospheric effects. This algorithm is expressed as a combination of simple linear formulas with various impacting factors (e.g., BTD, LSE, and VZA) [19,23,68]. Split-window methods provide relatively high accuracies and retrieval efficiencies; they are therefore applied to the various satellites and used in many LST retrievals [24,26,28,32,35,68,69]:
where and are the brightness temperatures of channels 13 and 15, respectively; is the VZA; is the mean LSE of infrared channels 13 and 15; is the difference in LSE between channels 13 and 15; and , , , , , and are the regression coefficients for each LST retrieval formula. Here, channels 13 and 15 refer to channels 13 (10.41 μm) and 15 (12.38 μm), respectively, of Himawari-8/AHI. Coefficients of multiple regression algorithms according to the lapse rate and water vapor amount are shown in Table 2.
Validation methods of the retrieved LST from satellites are temperature-based (T-based), radiance-based (R-based), and cross-validation-based methods [10]. In this study we used T-based and cross-validation methods. T-based validation methods use LST from an in situ observation site within the satellite observation area to validate the accuracy of the estimated LST [27,70,71,72]. In situ observed LST is point observation data; hence, the land surface that corresponds to the satellite’s spatial resolution must be uniform; however, as the surface is typically complex, spatial representation problems can occur. Cross-validation methods verify the retrieved LST using LST obtained from other satellites, which is useful in areas where it is difficult to apply T-based and R-based validation methods [57]. The spatial and temporal variability of LST is large; therefore, when satellite-retrieved LST is validated using cross-validation methods, rigorous spatial–temporal collocations must be performed. It is therefore necessary to consider the differences between the two satellites, such as their observation time, spatial resolution, cloud detection, and the LSE data used when retrieving the LST. The cross-validation method has the advantage of being able to compare a certain point in an area observed by two satellites, but it also has limitations in that the LST data obtained from the other satellite for validation can also contain errors. To evaluate LST accuracy, most previous research has used both temperature-based validation and the cross-validation method, or has used cross-validation for areas where there are no in situ observatories [18,32,57,58,73].
For temporal collocation, Himawari-8 cloud mask information is provided at regular intervals from the NMSC; therefore, we used MODIS LST information observed at the same time (within ±5 min). For spatial collocation, we took a simple mean of the clear pixels from the nearest 3 × 3 MODIS pixels surrounding a Himawari-8 pixel (if more than five clear pixels were present).
3. Results
3.1. Results of Radiative Transfer Model Simulation
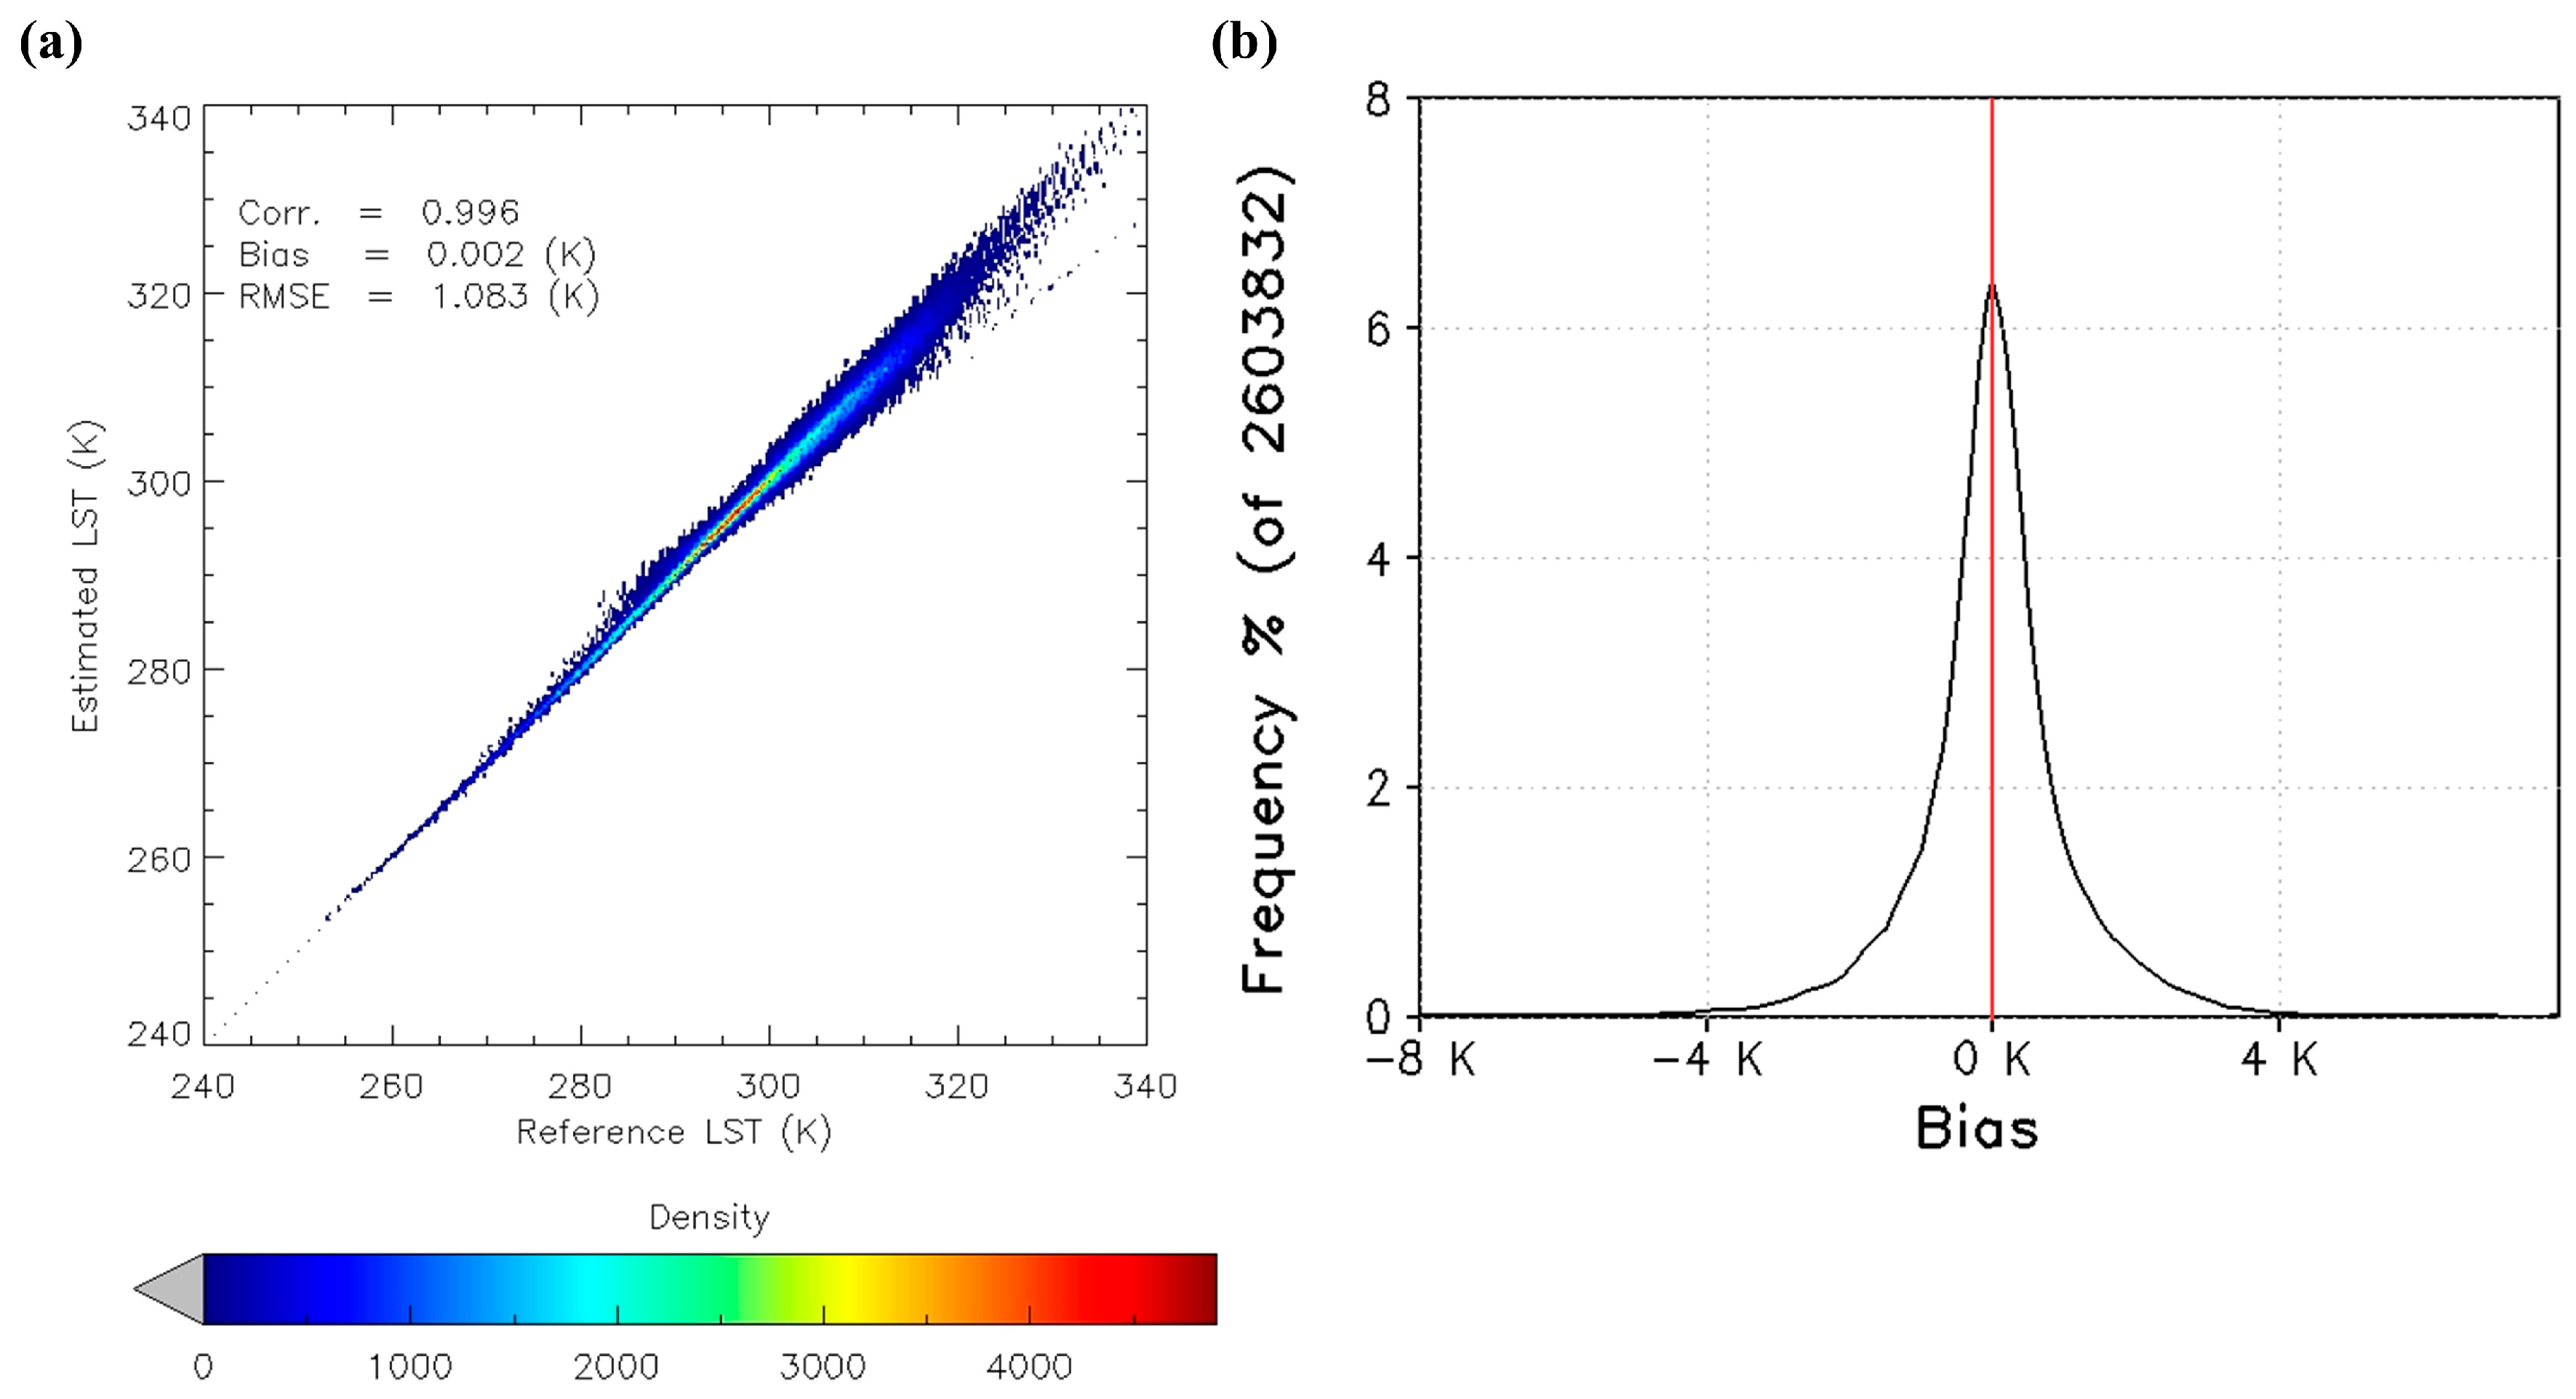
To evaluate the accuracy of the Himawari-8/AHI LST retrieval algorithms, we compared the estimated LST obtained using regression equations with the reference LST inputted to the RTM (shown in Table 1). Figure 5 shows the scatter plot and histogram of these values obtained from the RTM reference LST and retrieved LST.
As shown in the scatter plot, there is a good match over a wide range from 250 K to 330 K. The correlation coefficient, bias, and RMSE were 0.996, 0.002 K, and 1.083 K, respectively; these results all confirm that LST was well estimated. However, problems occurred in the 300 K to 320 K range, where the LST algorithm underestimated LST compared to the reference LST. The frequency distribution of bias showed an almost normal distribution with 0 K as the center, and no systematic error was observed.
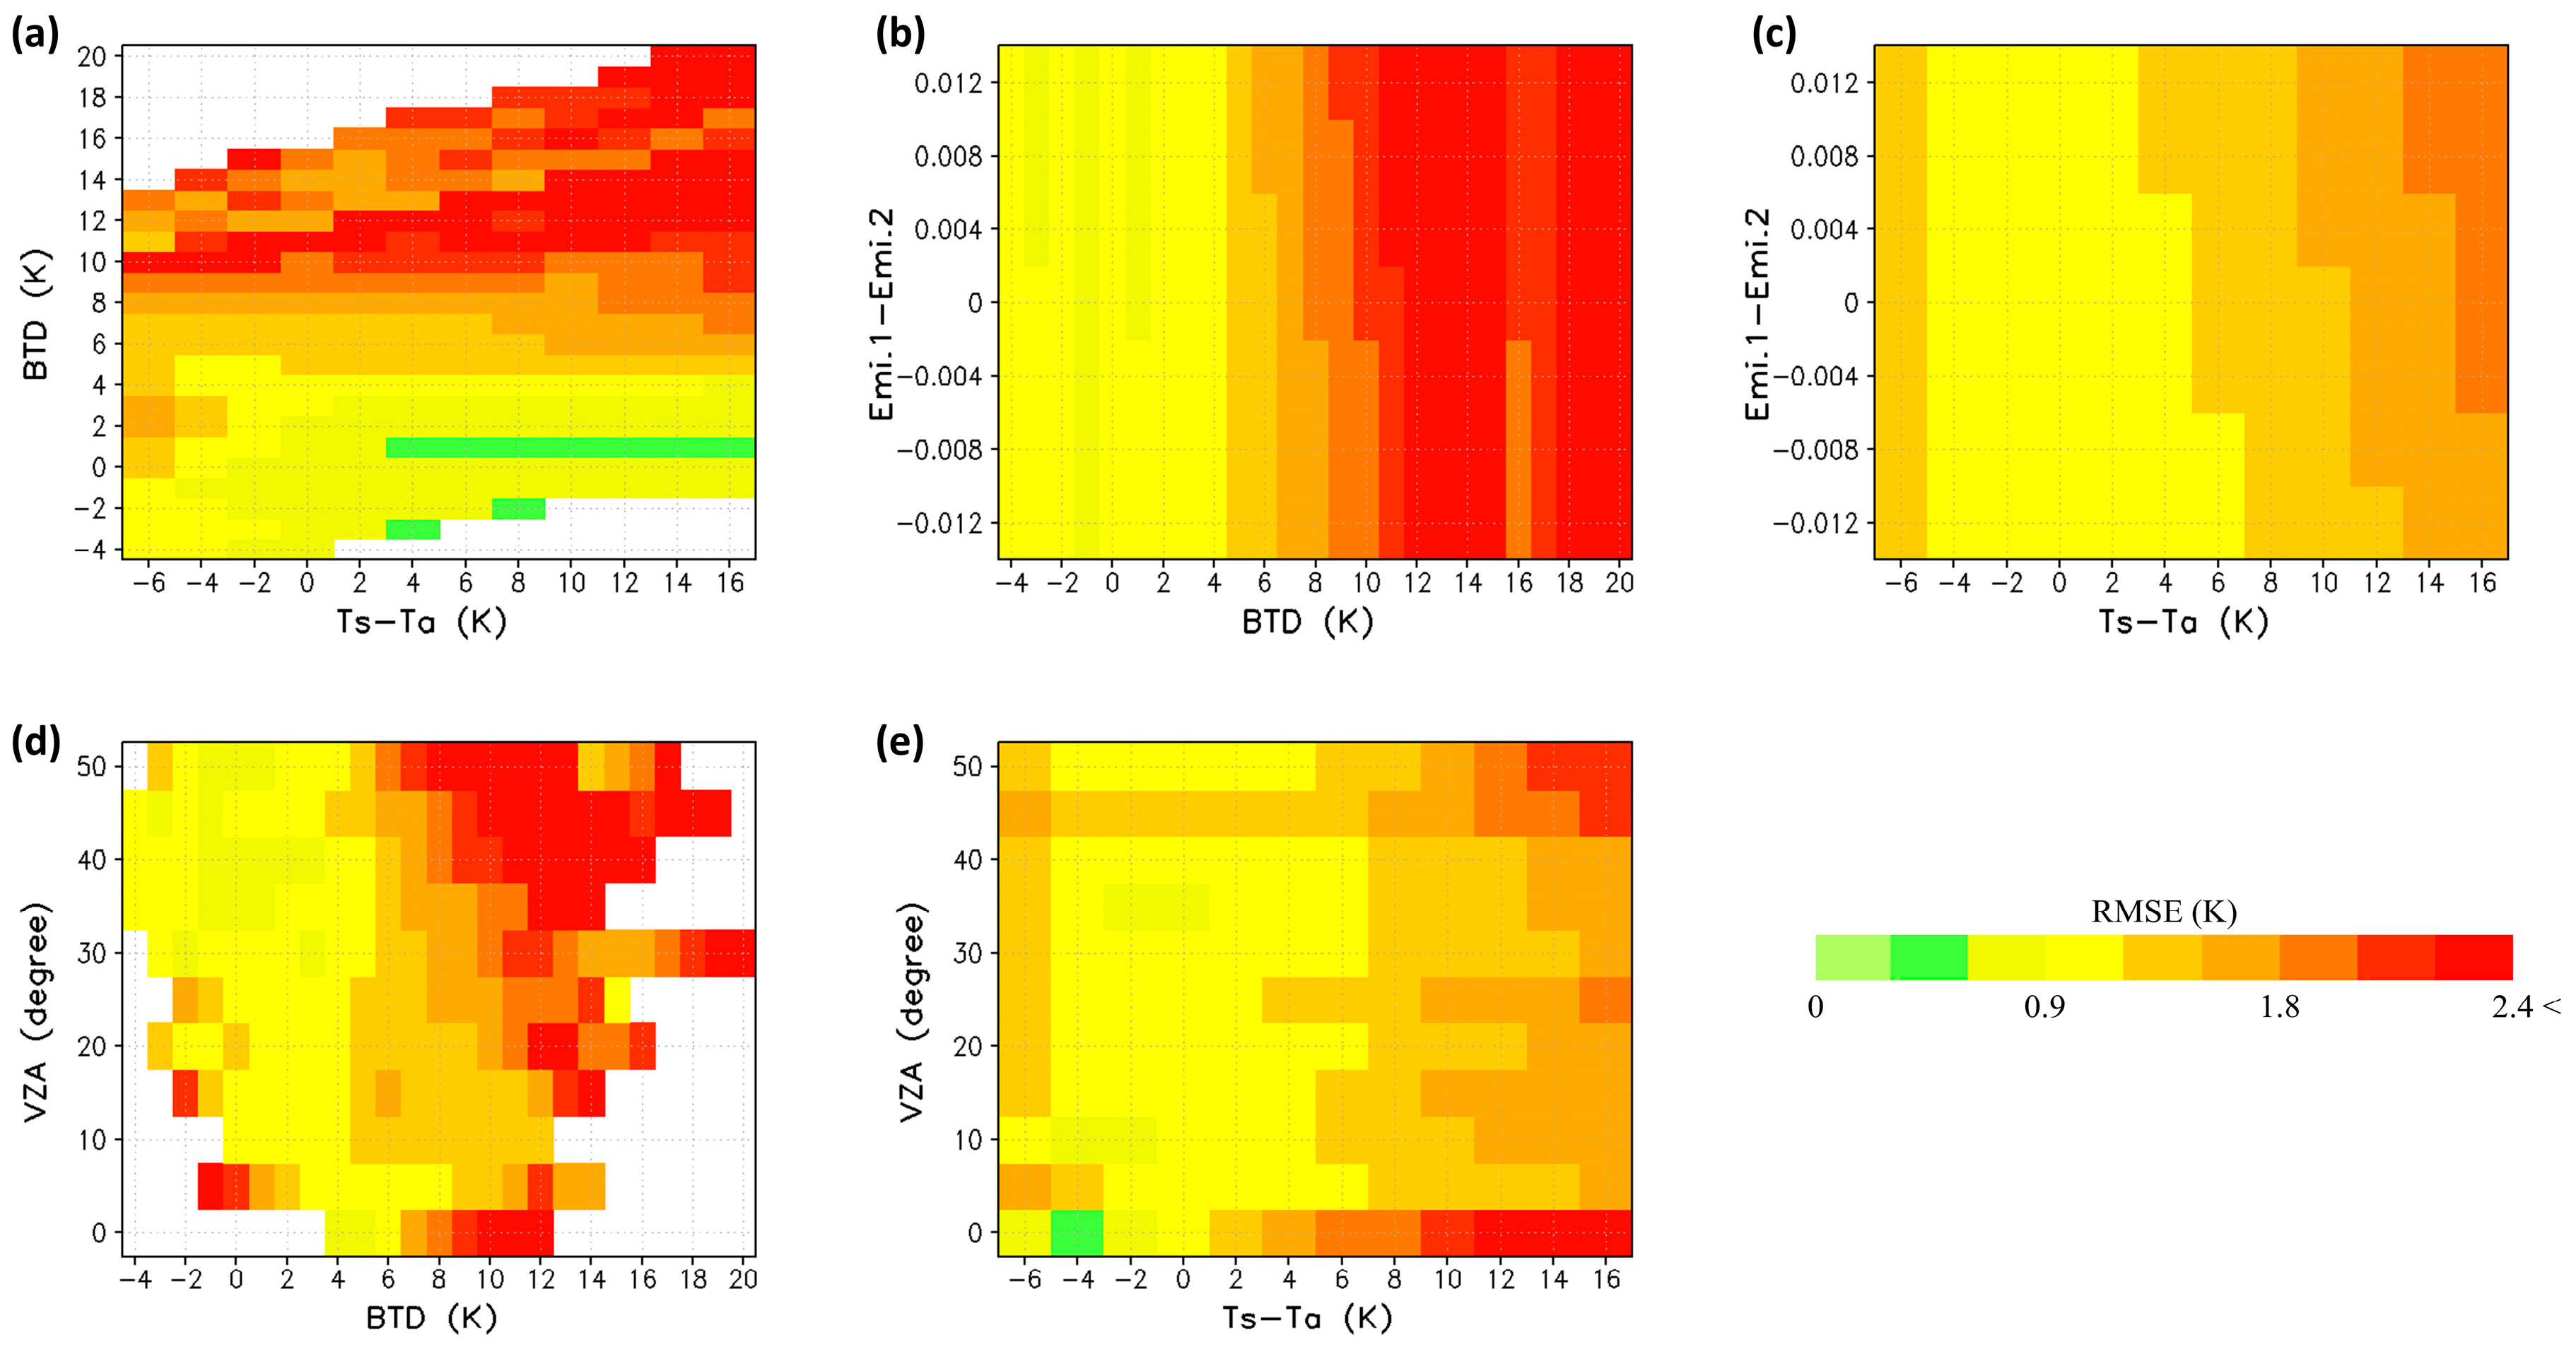
Figure 6 shows the distribution of RMSEs for Himawari-8 LST retrieval algorithms based on various impacting factors. The areas shown in white indicate a lack of data for a range, and the RMSE could therefore not be shown. In general, the RMSE increased and the accuracy decreased when the BTD was greater than 6 K. Ch. 13 was more (less) sensitive to aerosols (water vapor) than Ch. 15. Therefore, the brightness temperature difference between Ch. 13 and Ch. 15 indicate the relative amounts of aerosols and water vapor in the atmosphere: larger positive and negative values indicate larger amounts of water vapor and aerosols in the atmosphere, respectively. Moreover, when the VZA was above 40° and the BTD was above 8 K, there was a significant increase in the RMSE. This is because when a geostationary satellite located at the equator observes the Earth’s surface, there is an increase in the optical path length to the Earth’s surface with an increase in the VZA; the atmospheric attenuation effect then increases, which lowers the retrieval accuracy. These effects are more significant in South East Asia because of the combined effects of a large VZA and a large water vapor content. The distribution of RMSE according to the BTD and lapse rate varies greatly, rather than the emissivity difference.
3.2. Cross-Validation Results Using MODIS LST
To evaluate the Himawari-8/AHI LST retrieval algorithms, LSTs were retrieved for one year from September 2015 to August 2016, a period in which both Himawari-8/AHI Level 1B data and NMSC cloud detection output were available. As LST can only be retrieved when skies are clear and cloudless, we used Himawari-8/AHI cloud masking data, which was produced by the GK-2A cloud detection algorithm development team [38].
Figure 7 shows Himawari-8 and MODIS LSTs at 1500 UTC on December 12, 2015 and the differences between the two temperatures. The spatial distributions were similar (spatial correlation coefficient: 0.994), and the differences between the two temperatures were mostly within ±2 K. The MODIS LST was retrieved for the south-central region of China, probably because of differences between the cloud detection algorithms in the two data sets. In the scatter plot, the LST covered a wide range from 250 K to 300 K, and matches were good for LSTs greater than 270 K; however, the Himawari-8 LST showed a slight overestimation for LST less than 270 K compared to MODIS LST. The bias and RMSE of the case were −0.332 K and 1.089 K, respectively.
Figure 8 shows the two LSTs at 0300 UTC on February 8, 2016. Their spatial distributions and temperature ranges were similar, but the estimated Himawari-8 LST tended to be higher than the MODIS LST over the entire analysis area. In particular, there was a systematic warm bias (+1.6 K) between +0 K and +4 K in southeast China and Taiwan, which is believed to affect the overall retrieval accuracy. As a result, the RMSE and correlation coefficient were not good at 1.88 K and 0.936, respectively.
Figure 9 shows the Himawari-8 and MODIS LSTs at 1500 UTC on May 4, 2016. The spatial patterns of the two LSTs were generally in good agreement overall from Tibet’s plateau region to Hanoi in Vietnam and then to southeast China. As a result, the accuracy of the retrieved LST from Himawari-8/AHI data was relatively reasonable (corr.: 0.984, bias: −0.679 K, RMSE: 1.213 K). The scatter plot also showed that there was a good match between the two LSTs for a wide range of LSTs from 265 K to 305 K.
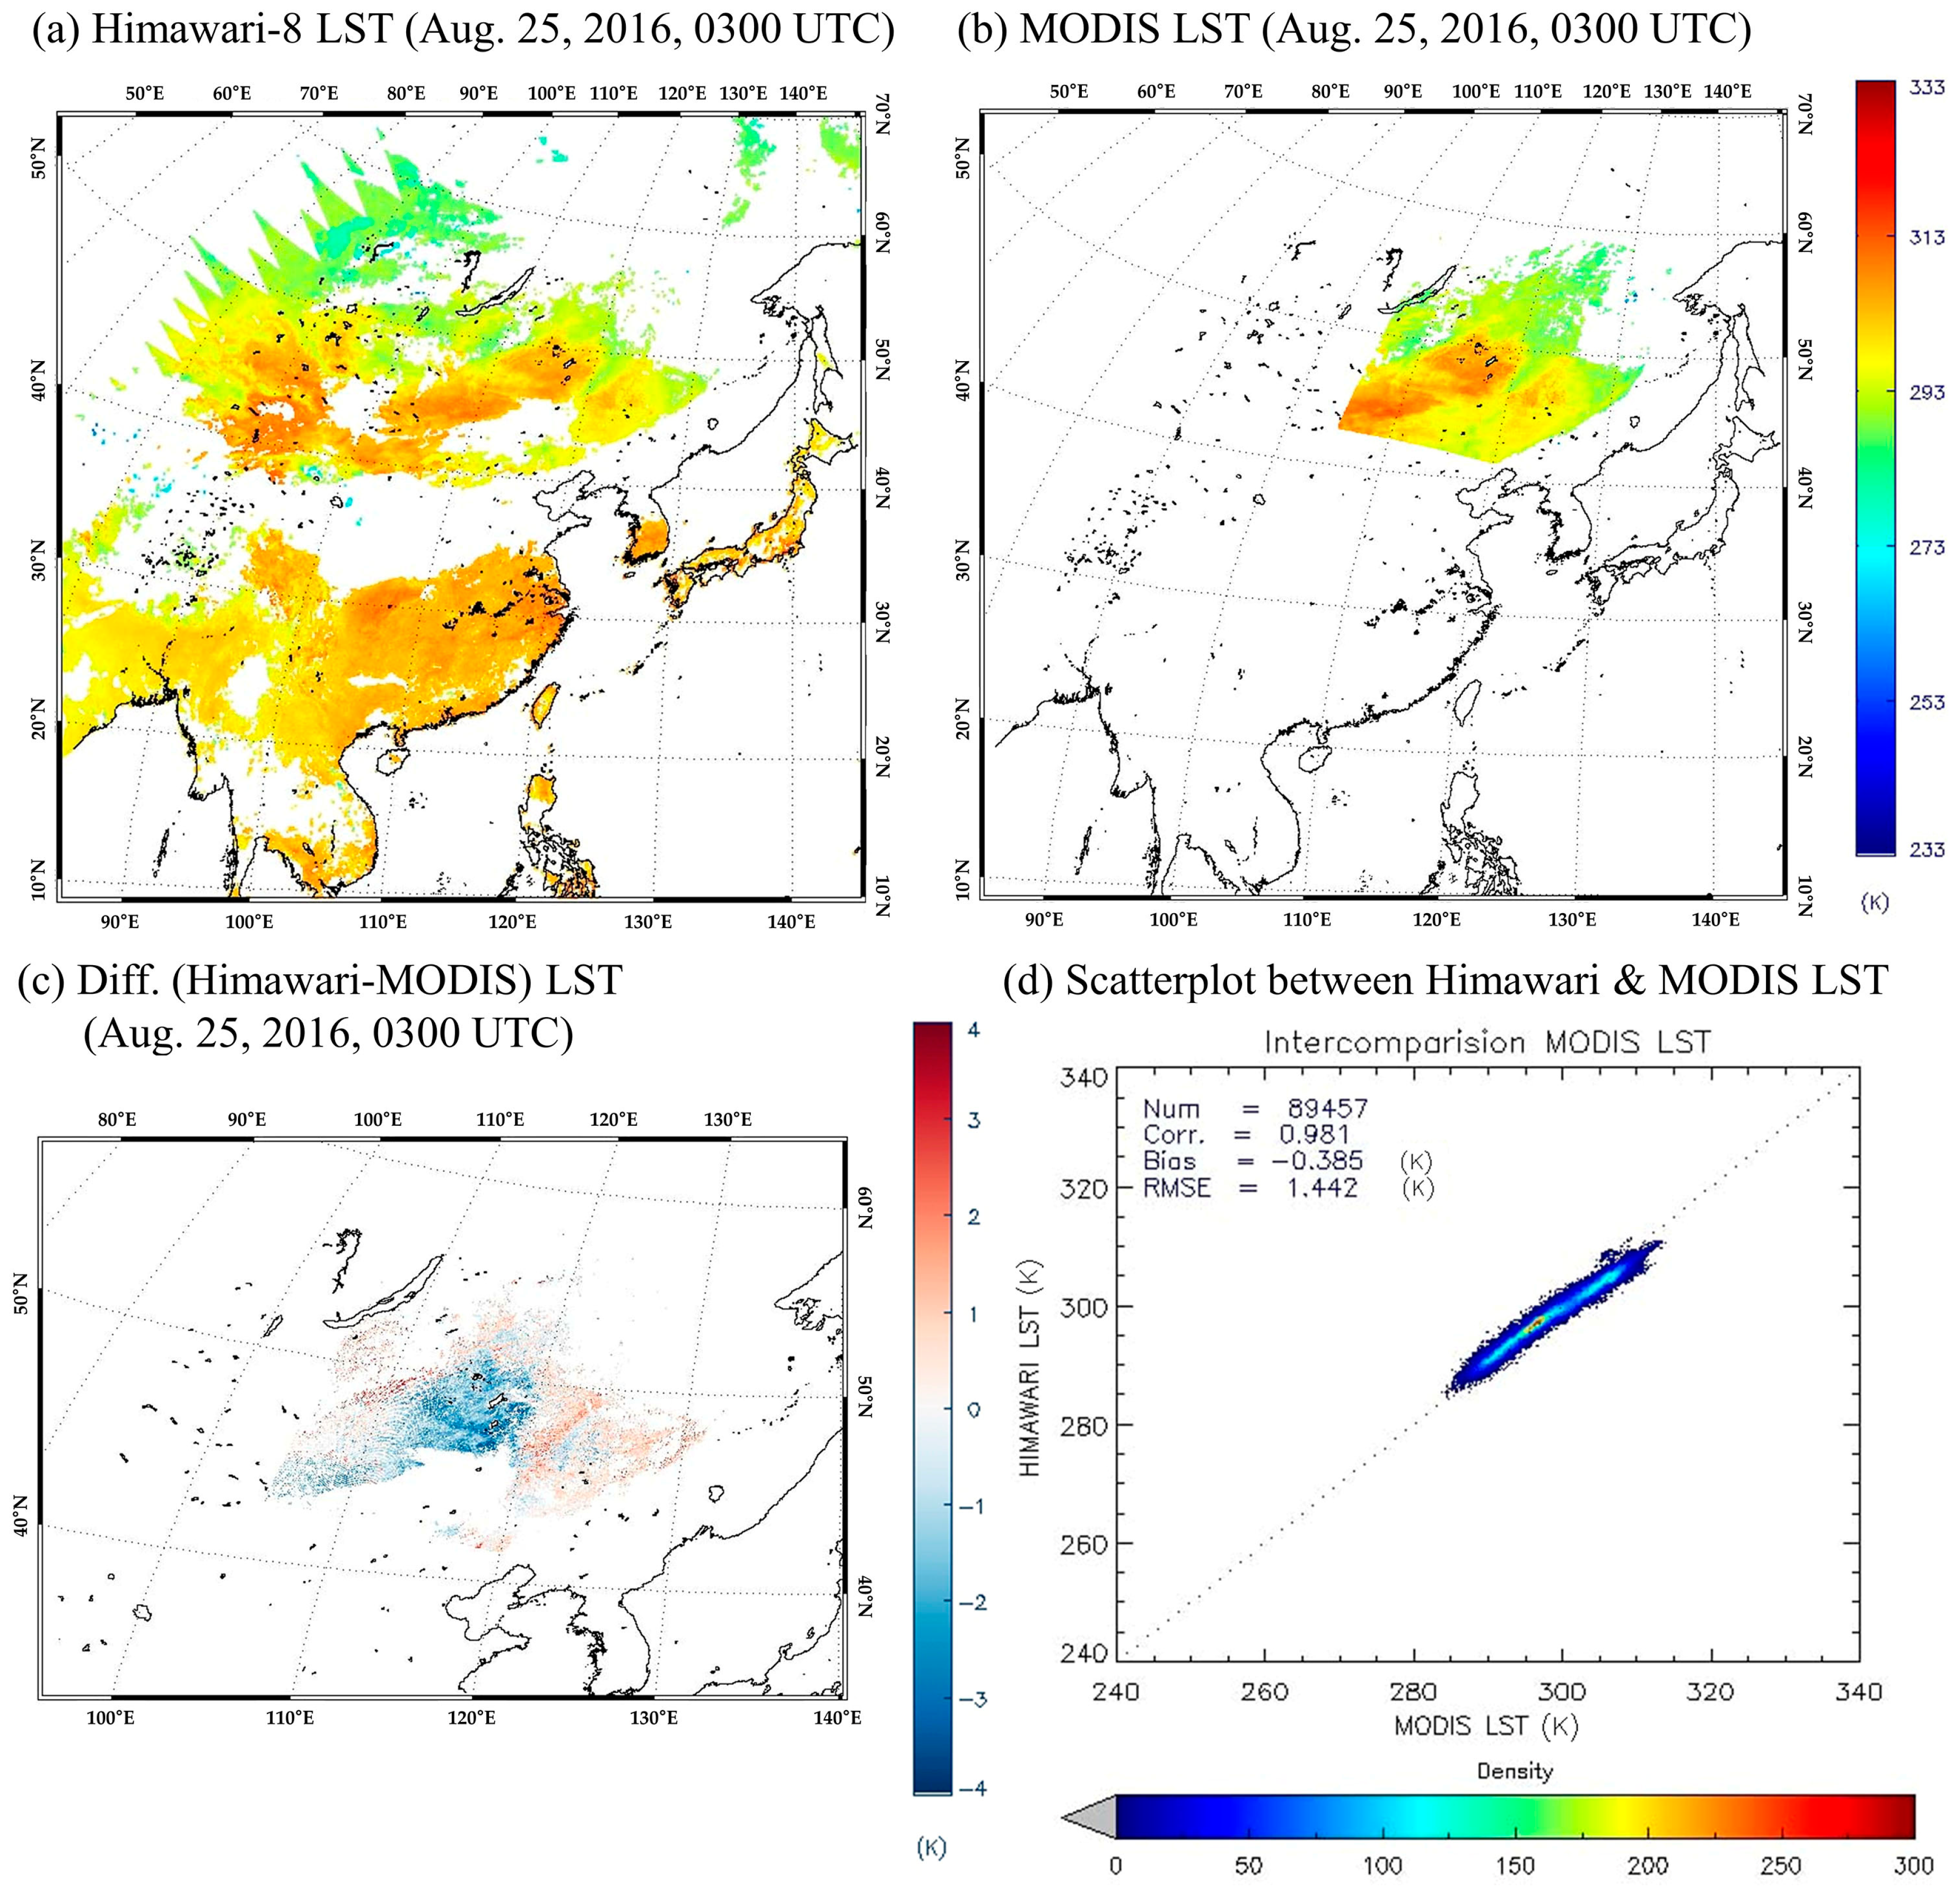
Figure 10 shows the spatial distribution and scatter plot of LST for 0300 UTC on August 25, 2016. A discontinuity was observed in the spatial distribution of Himawari-8 LST compared to that of MODIS over Northeastern China and Mongolia; this was related to the different cloud-masking algorithms. The large spatial gradient of LST in the Mongolian region was mainly caused by land cover differences (desert (Hunsandake Desert), semi-desert, and grass). As shown in the spatial distribution of LST differences, the scatter plot also shows that our algorithm overestimates and underestimated LST in a range of less than 290 K and greater than 310 K, respectively.
To further quantitatively analyze the Himawari-8 LST algorithm, we retrieved LST for one year, from September 2015 to August 2016, and compared the results with MODIS LST collection 6 products, as shown in Table 3. As previously mentioned, the Himawari-8 cloud masking data can only be obtained every hour; therefore, validation was conducted only when it matched MODIS LST in spatial-temporal conditions, and the dates of analysis thus differed between the months. The correlation coefficient between the Himawari-8 LST and MODIS LST during the daytime was greater than 0.9 for each month except November 2015, which showed a relatively low correlation. Overall, the correlation between the two LSTs was higher for nighttime than for the daytime: the RMSE for daytime was less than 2.7 K in spring (March, April, and May), 2.6 K in summer (June, July, and August), 2.6 K in autumn (September, October, and November), but over 2.9 K in winter (December and January), with the exception of February 2016. However, the RMSE at nighttime was less than 1.9 K for all months. The combined results of daytime and nighttime, the monthly biases, and the RMSEs of the winter (December, January, and February: DJF) season were slightly larger than other seasons. These results show that it was necessary to improve the accuracy of the Himwari-8 LST algorithm by conducting a detailed error analysis, particularly for winter (DJF).
LSE is impacted by various factors, such as the spatiotemporal changes in vegetation, soil moisture, and snow cover. In this study, we used climatological LSE data, which means that the quality of retrieved LST could be affected by the erroneous prescription of LSE data, particularly for the northern and high mountain regions where snow is frequent in winter. It is also known that estimated MODIS LST is about 2 K to 3 K lower than in situ data in bare soil and desert areas, and this also needed to be considered in the analysis [53,56,74,75]. Furthermore, MODIS LST data are remotely sensed data from a satellite, which also may have errors.
3.3. In Situ Validation Results Using Baseline Surface Radiation Network (BSRN)
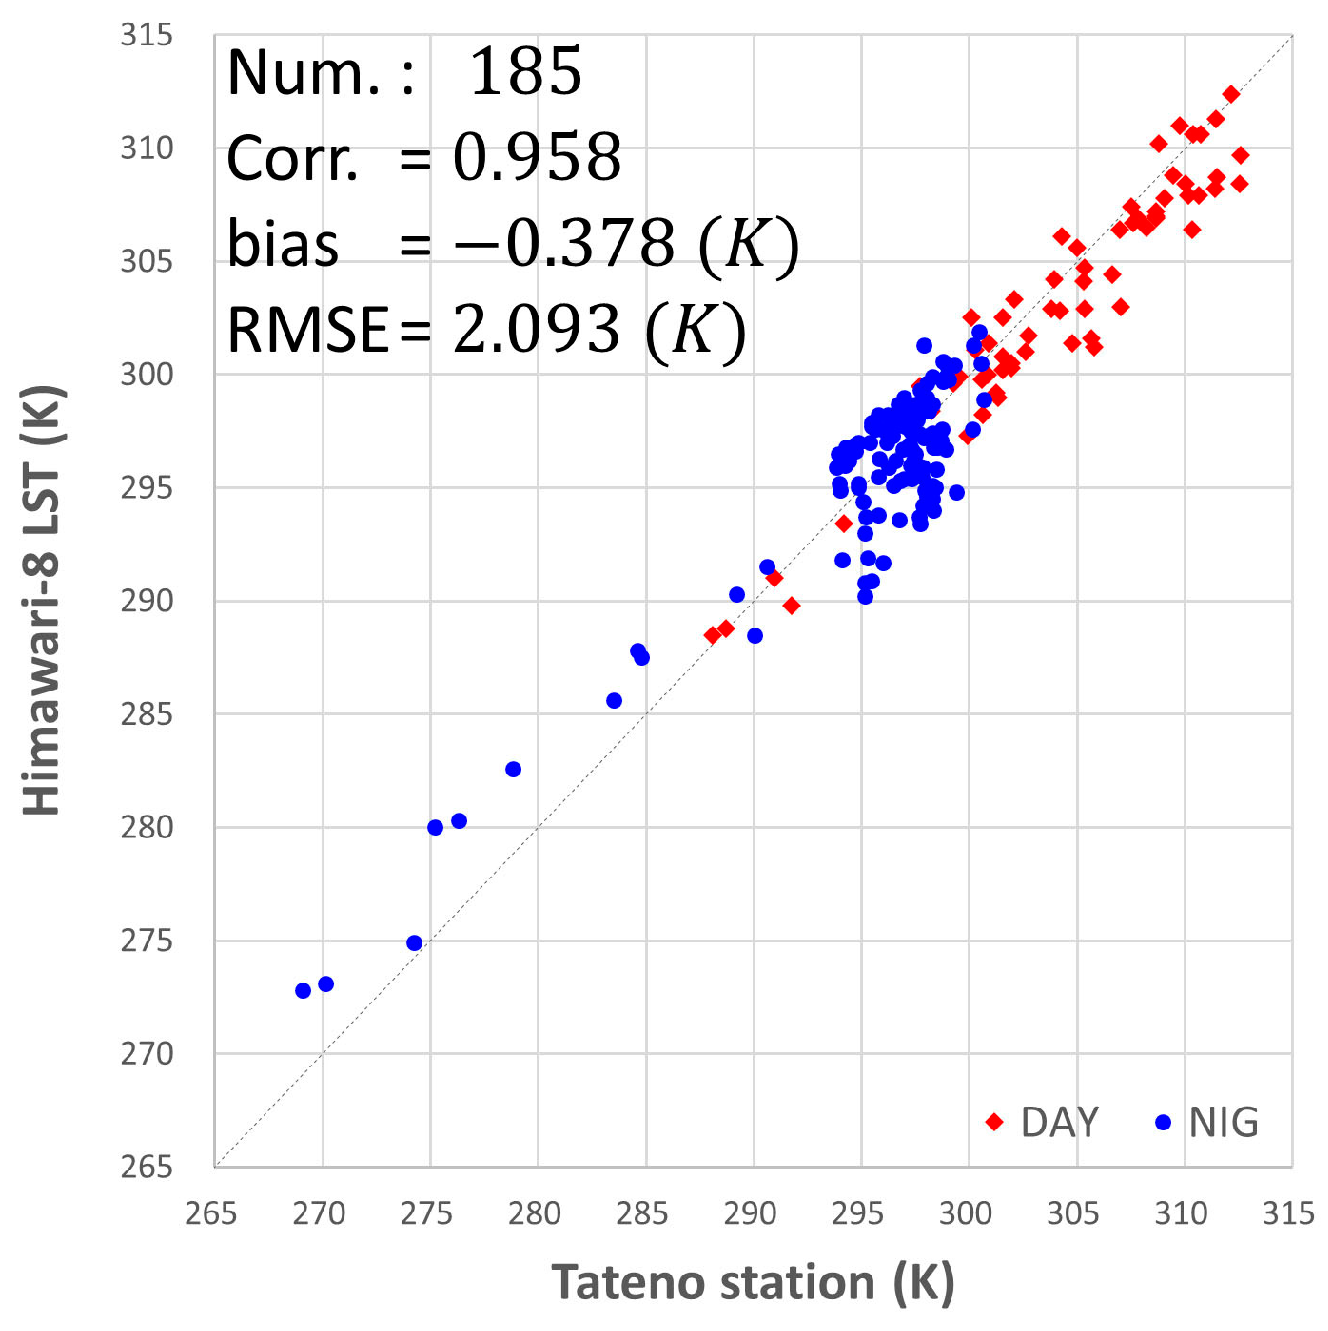
To evaluate the Himawari-8/AHI LST retrieval algorithms, we validated Himawari-8/AHI LST using ground-observed LST data obtained at Tateno station (Japan), which is located at 140.126°E and 36.058°N [76]. Measured upward longwave radiation data from the BSRN station over Tateno were converted into LST using the Stefan–Boltzmann law and a blackbody assumption. Ground LST data used for validation included 185 scenes, 63 daytime cases, and 122 nighttime cases, respectively. Figure 11 shows the scatterplot between the Himawari-8 LST and the converted Tateno station LST according to daytime and nighttime, which shows that the two LSTs were well matched within ±5 K. However, Himawari-8 LST was slightly lower (higher) than Tateno station LST during the daytime above 295 K (nighttime except for 290–300 K). The relatively large warm bias at night indicates that the Himawari-8/AHI LST algorithm had a tendency of overestimating the LST, although this warm bias was partly caused by the blackbody assumption of the Tateno station.
4. Discussion
In this study, we developed a split-window type LST retrieval algorithm using channels 13 and 15 from Himawari-8/AHI satellite data. To develop the LST retrieval algorithm, we generated a database using RTM simulations that considered factors affecting LST retrieval in the Himawari-8/AHI observation area; these included the vertical atmospheric profile, LSE, VZA, and brightness temperature differences. The RTM used in this research was MODTRAN4 [54].
The split-window method uses the difference in absorption between two adjacent infrared channels to correct for atmospheric effects [23]. The next-generation geostationary meteorological satellites (Himawari-8/AHI, GOES-16/ABI, and GK-2A/AMI) have three IR channels (Ch. 13–15) corresponding to the atmospheric window. Of the three available IR channels, we selected channels 13 and 15, because channel 13 is less sensitive to water vapor than channel 14. Furthermore, the regression results between Ch. 13 and Ch. 15 were better than those between Ch. 14 and Ch. 15 when using the same conditions, as shown in Figure 12. Also, despite using a non-linear algorithm, Yamamoto et al. (2018) showed the combined use of channels 13 and 15 lead to a lower LST estimation error due to surface emissivity [37].
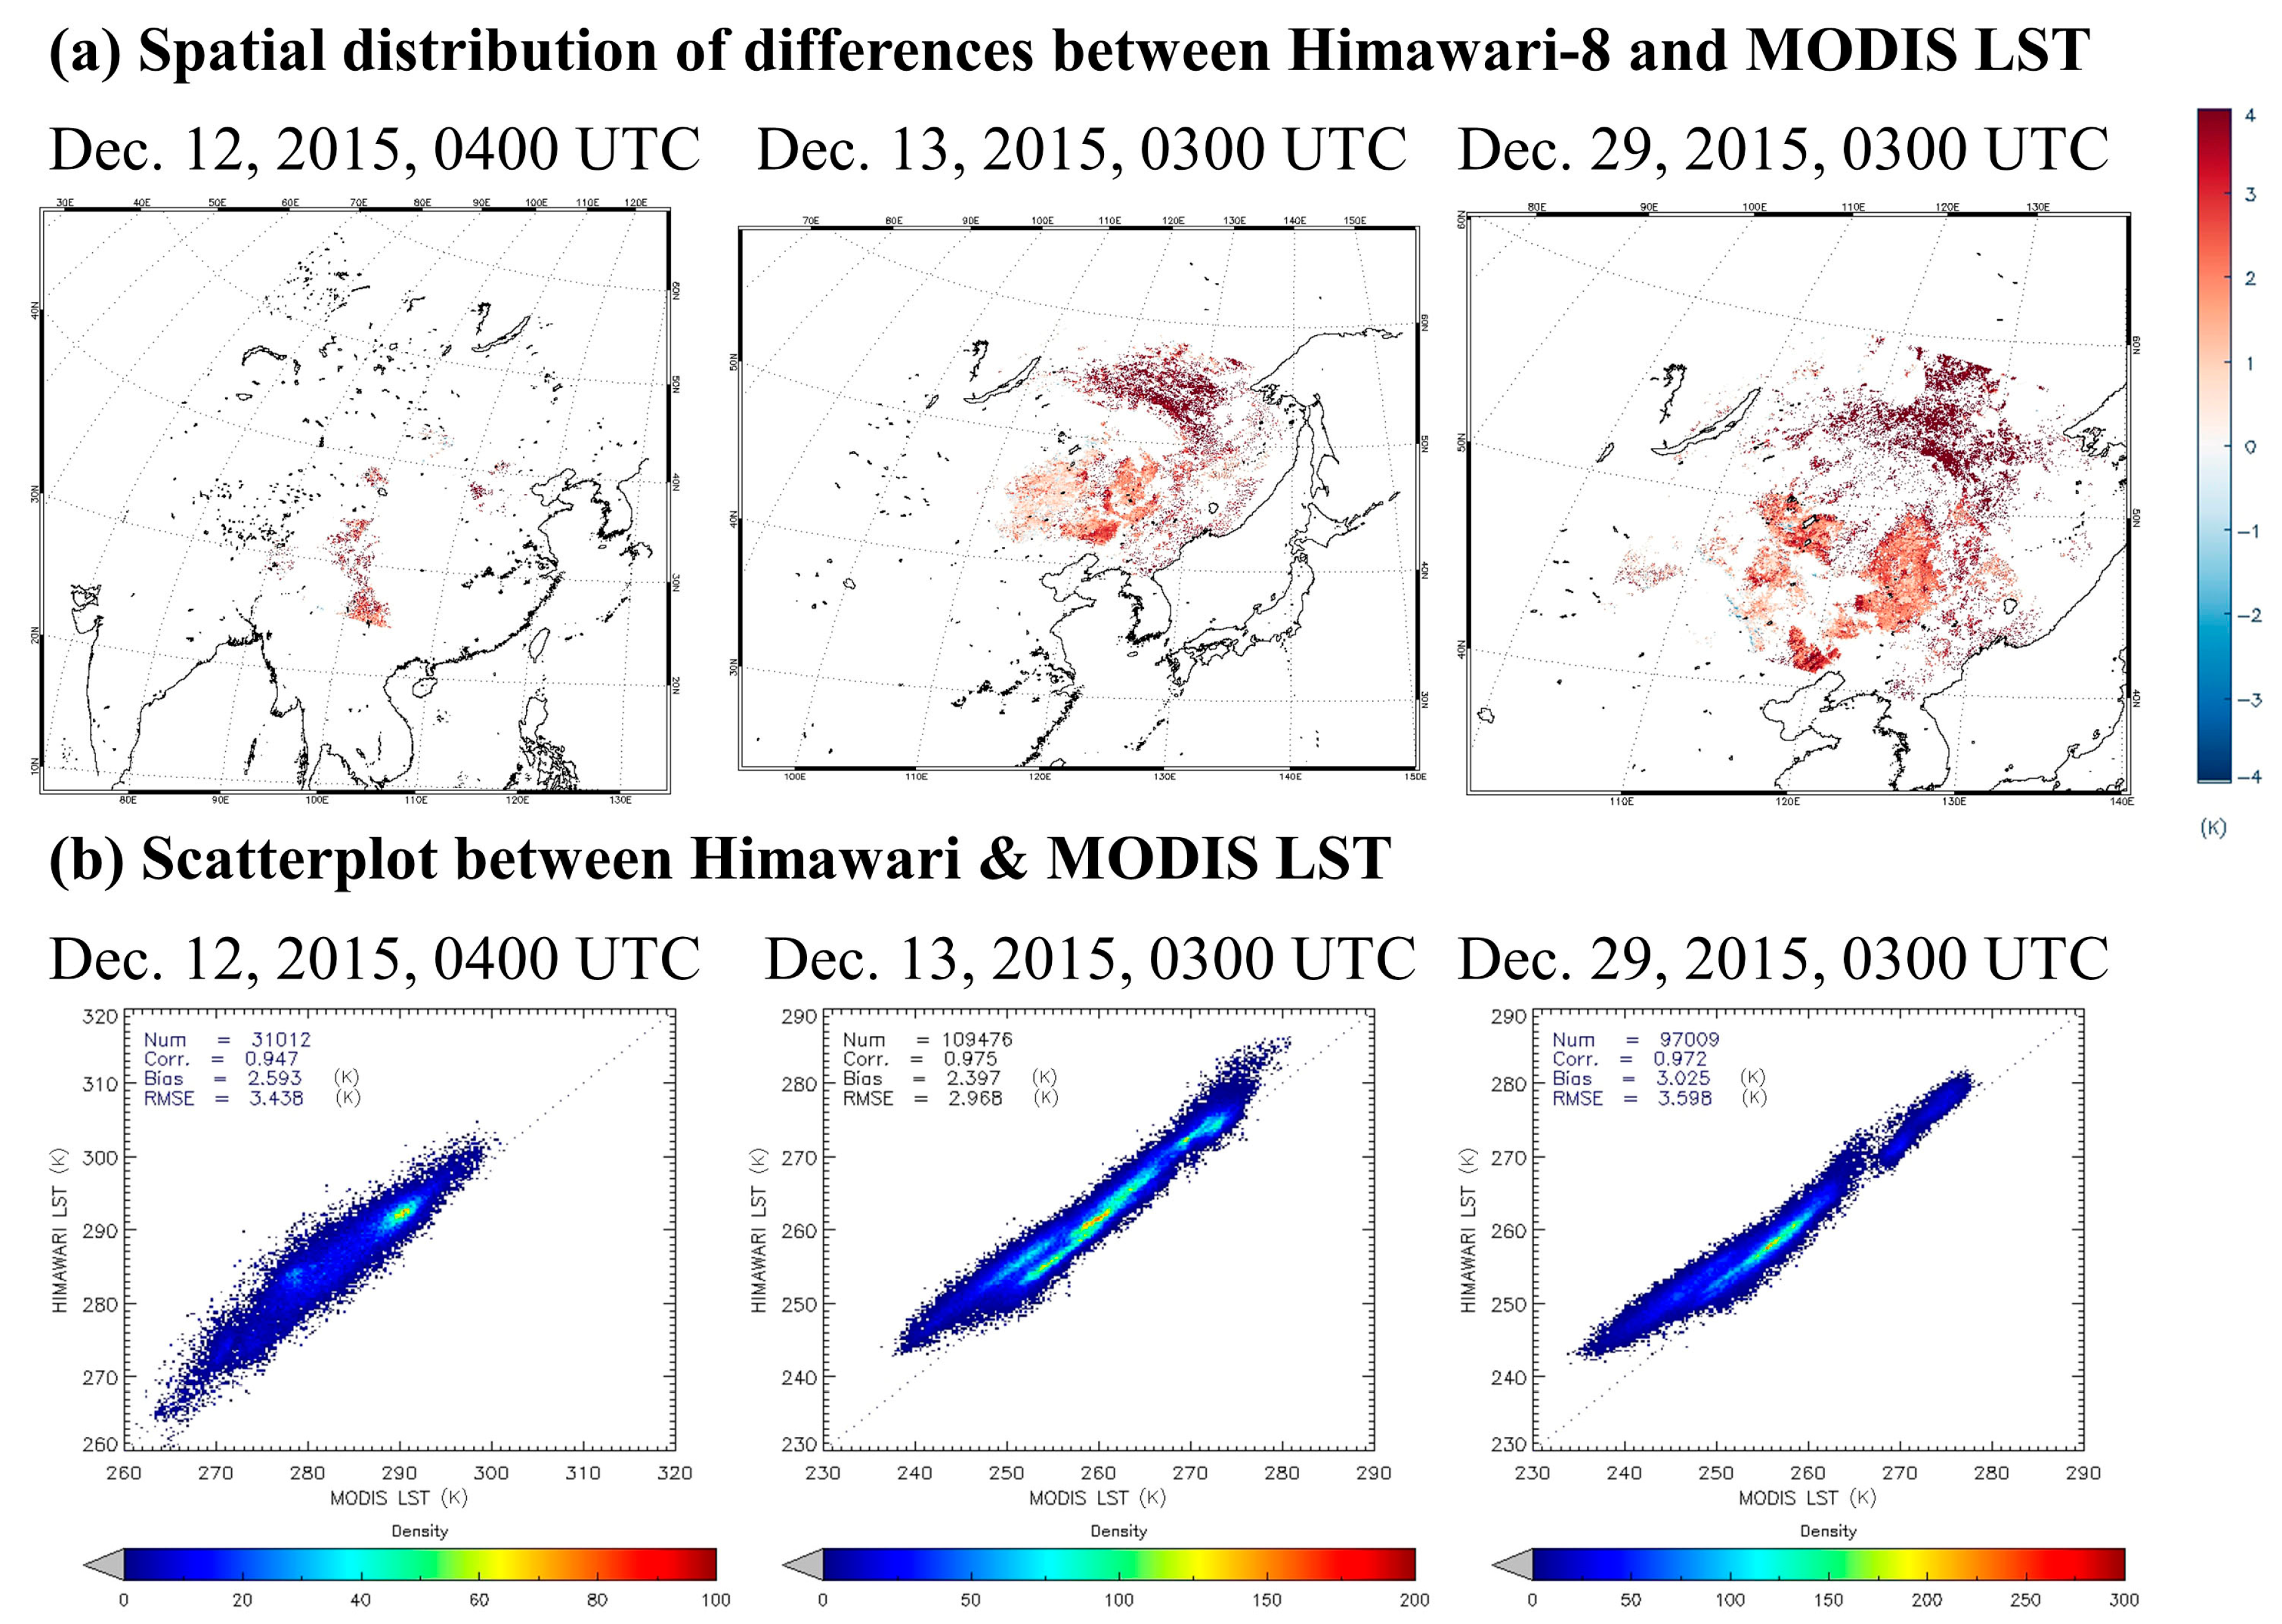
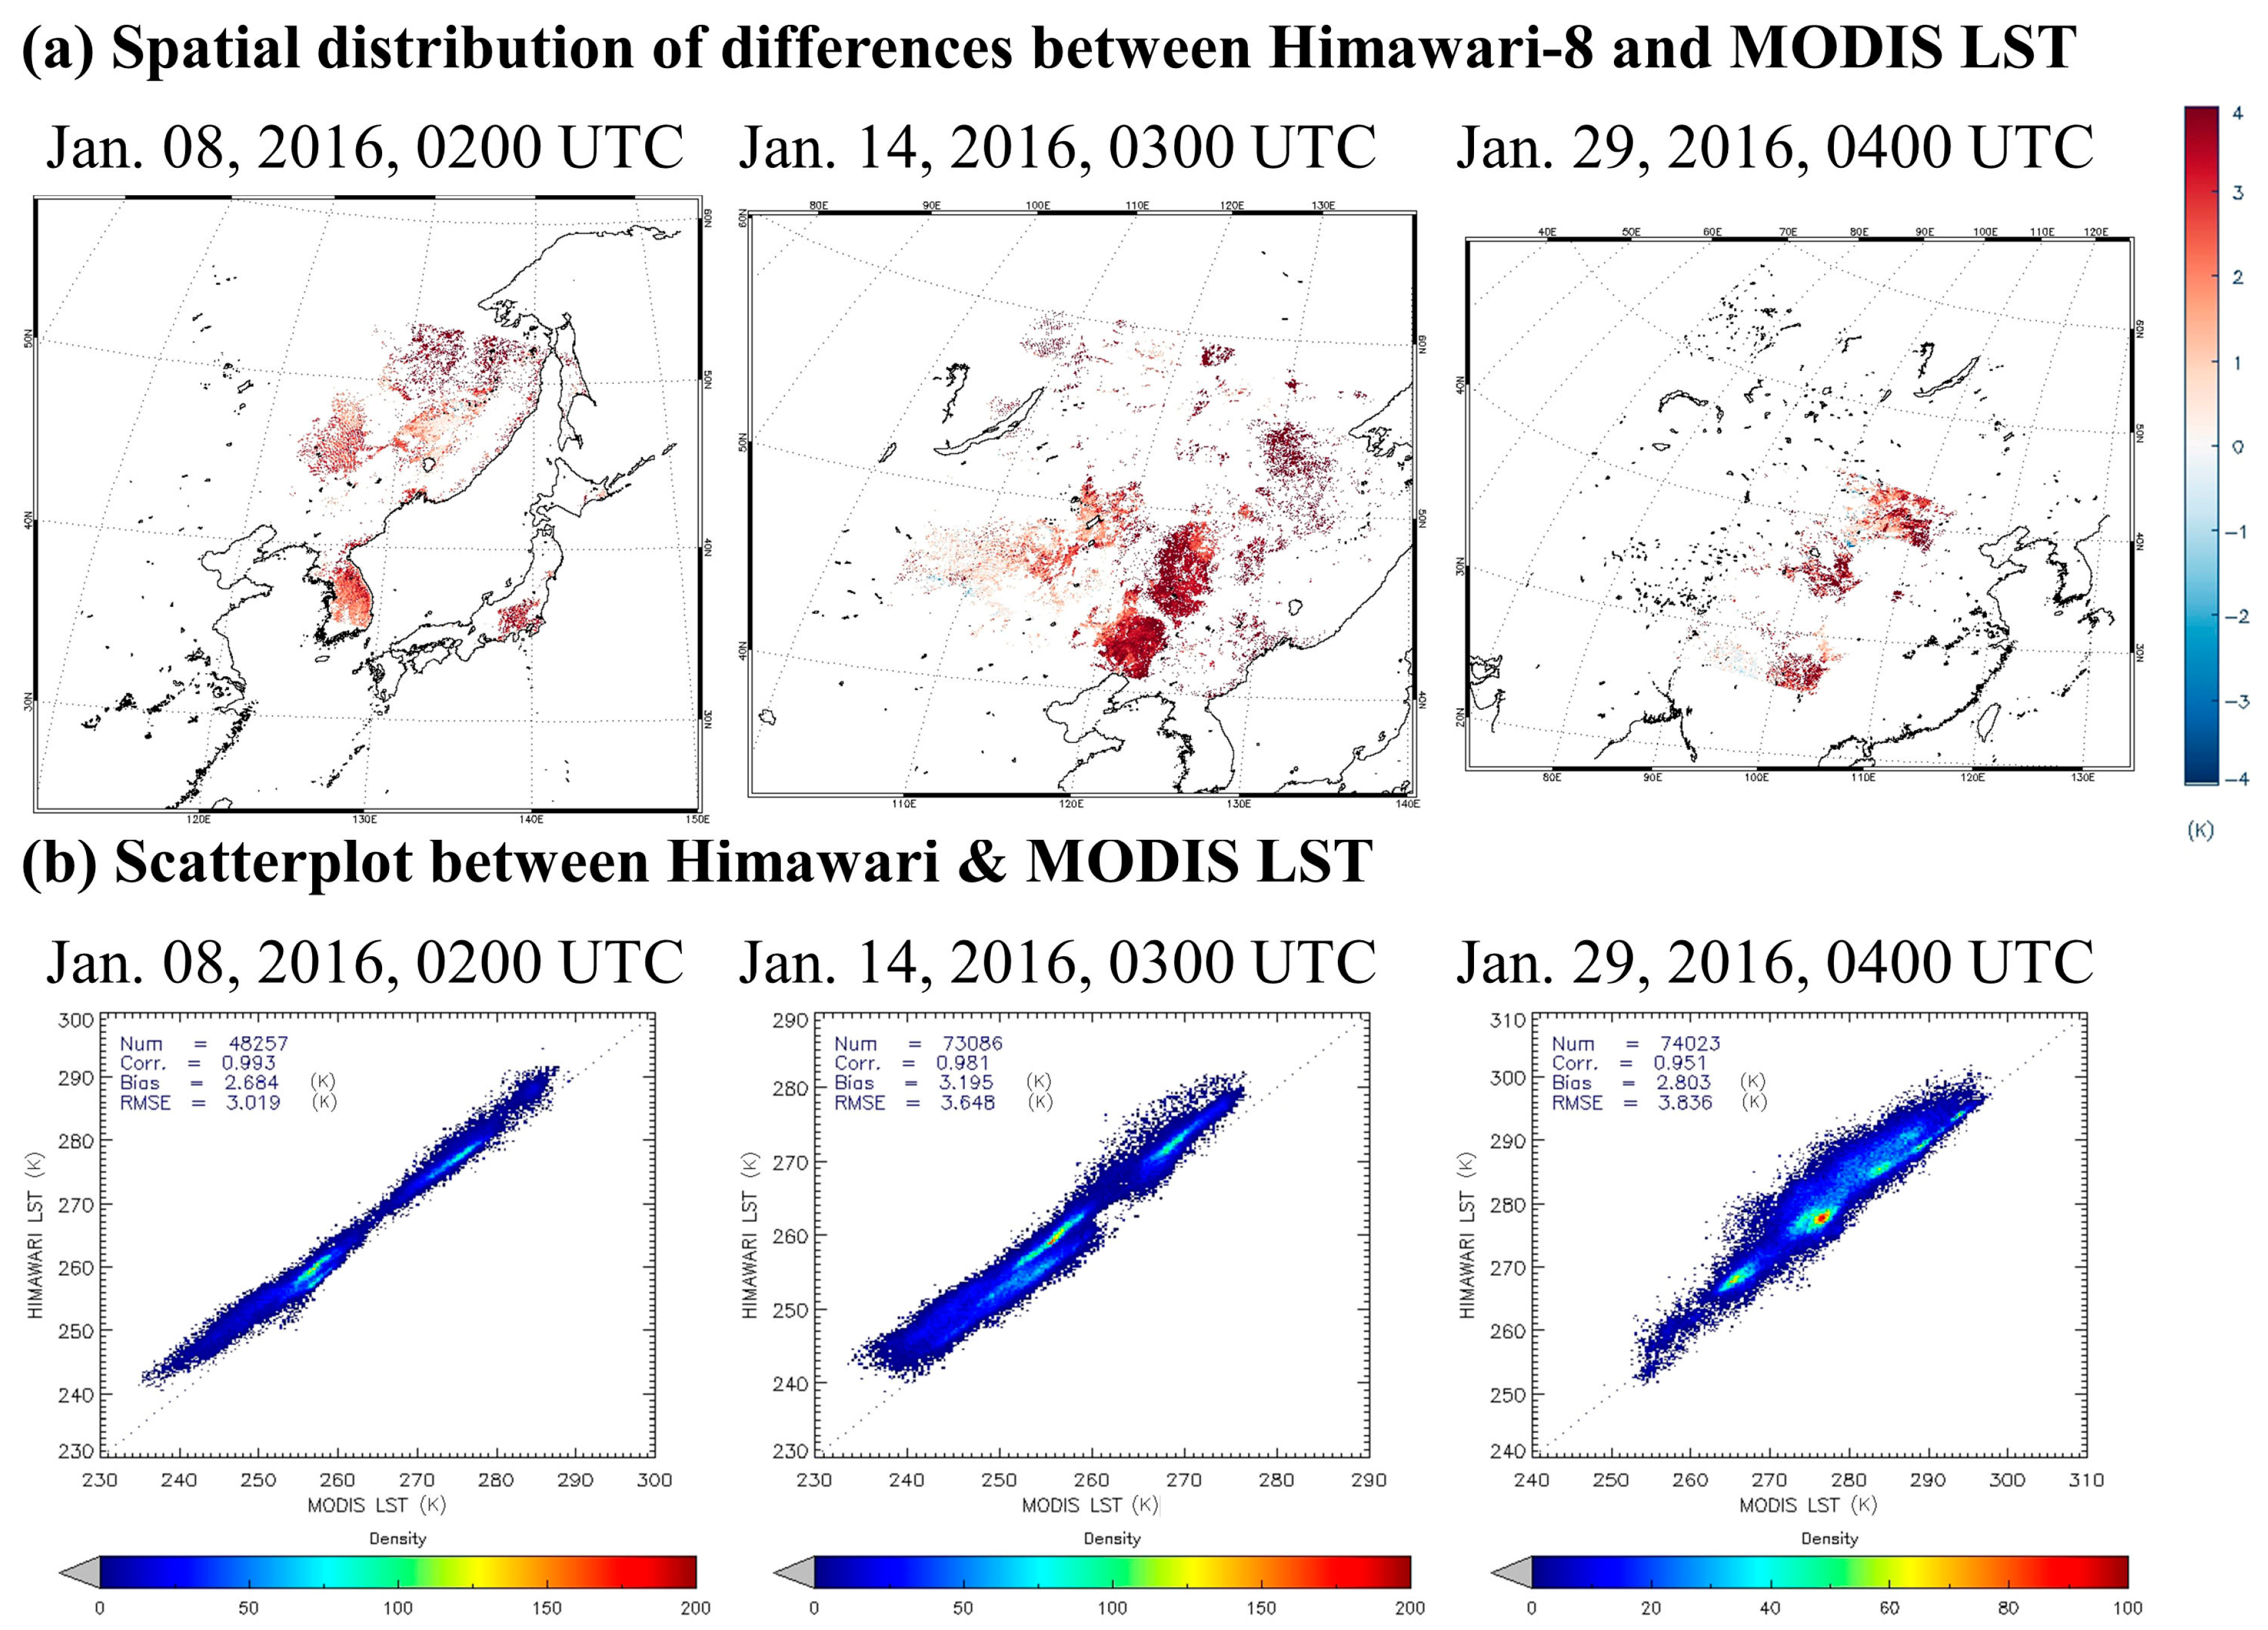
Inter-comparison results between Himawari-8 LST and MODIS LST collection 6 showed that Himawari-8 LSTs were systematically warmer than MODIS LST during the winter season, as shown in Table 3. To analyze the systematic warm bias during daytime in December 2015 and January 2016, the spatial distribution of the differences between Himawari-8 and MODIS are shown in scatter plots for six selected daytime cases in Figure 13 and Figure 14. Himawari-8 LSTs were shown to be systematically warmer than MODIS LST, irrespective of the case used or the geographic location. In particular, Himawari-8 LSTs are significantly warmer (by ≈3 K) than MODIS LST in the regions of northeast China and Russia where LST was colder than 275 K. These results are similar to those of a previous study that retrieved LST from Meteosat Second Generation (MSG)/Spinning Enhanced Visible and InfraRed Imager (SEVIRI) data and produced results that were systematically warmer by approximately 2.0 K during the daytime than MODIS LST [77]. These results suggest that the cold MODIS LST during daytime in winter is one of the causes of the systematic warm bias of Himawari LST. Emissivity differences between the two were caused by the different considerations of snow cover, and these also affect the systematic warm bias. Therefore, a detailed analysis of emissivity differences and the characteristics of MODIS LST during daytime in winter were required to analyze the causes of the systematic warm biases found in this study.
There are limited available in situ observed LST data for the Himawari-8 observation area, and this study used only one in situ set of data obtained from BSRN station over Tateno (Japan). When converting upward longwave radiation at Tateno station to LST, we assumed the blackbody and that the broadband surface emissivity of Tateno station was 1.0, which caused a slight underestimation of LST. According to the previous research, which provided an R-based validation for the MSG/SEVIRI LST algorithm, validation results showed RMSEs smaller than 1.2 K for the LSA SAF product [78]. The study [78] also showed that biases were reduced after replacing input land surface emissivity data. To quantitatively evaluate the accuracy of the Himawari-8 LST algorithm, it is thus necessary to provide additional validation using various in situ databases (e.g., Fluxnet, Surface Radiation Budget Network (SURFRAD), BSRN, Atmospheric Radiation Measurement (ARM)).
The sensitivity analysis for the impacting factors, such as land surface emissivity and the channel noises, are very important steps for the evaluation of the LST retrieval algorithms. In this study, we did not perform the sensitivity analysis for the various impacting factors, so we could not estimate the relative contribution of each factor, including the channel noises, for the retrieval errors of LST. According to the Himawari-8/AHI radiometric calibration results, the current standard errors for the standard brightness temperature (Tb) of channels 13 and 15 were less than 0.1 K when compared to Infrared Atmospheric Sounding Interferometer (IASI)/A, IASI/B, Atmospheric Infrared Sounder (AIRS), and Cross-track Infrared Sounder (CrIS) [79]. When we take into consider the degradation of sensor quality with time, the sensitivity analysis to the channel noises is necessary. Therefore, we are planning to perform the sensitivity analysis to the various impacting factors in the next study.
5. Conclusions
To retrieve LST from the GK-2A/AMI data of Korea’s next-generation geostationary meteorological satellite, which is scheduled for launch in December 2018, an LST retrieval algorithm was developed using the Himawari-8/AHI, as the two satellites have similar orbits and sensor characteristics. It is considered that the LST retrieval algorithms developed in this study will contribute to enabling LST measurements prior to the GK-2A/AMI launch in 2018. To develop the LST retrieval algorithm, we generated a database using RTM simulations. Using reference LST and estimated LST databases, we developed six LST retrieval equations through multiple regression and consideration of day/night and atmospheric conditions. A comparison between LST estimated from the RTM and reference LST used as input data found a correlation coefficient, bias, and RMSE of 0.996, 0.002 K, and 1.083 K, respectively, which demonstrates that the developed LST retrieval algorithms provided reasonable results.
MODIS LSTs were used to indirectly validate retrieved LST from the Himawari-8/AHI data over a one-year period (September 2015 to August 2016). Overall, the Himawari-8 LST and MODIS LST showed similar spatial distributions with differences between the two LSTs within ±4 K. A comparison between Himawari-8 LST and MODIS LST showed a spatial correlation coefficient, bias, and RMSE of 0.94, +0.45 K, and 1.93 K, respectively. Overall, the results of the Himawari-8 LST and MODIS LST were more similar during the night (warm season) than during the day (cold season). In addition, a validation was conducted using ground observed LST data at BSRN station over Tateno, and results showed the performance of the current LST retrieval algorithm to be comparable with that of other LST retrieval algorithms (corr.: 0.958; bias: −0.378 K; RMSE: 2.093 K). However, the Himawari LST showed a systematic warm bias during the daytime in winter compared to MODIS LST, which is similar to the results shown in a previous study [77].
High spatiotemporal resolution LSTs retrieved from next-generation geostationary satellite data can provide the input data required to calculate land–atmosphere interactions in different types of numerical/climatological models, in addition to verifying the model results. It is also considered that they can be used in a variety of research focusing on surface urban heat islands, agricultural drought prediction, and soil moisture estimations.
Author Contributions
Investigation, Y.-Y.C.; Methodology, M.-S.S.; Supervision, M.-S.S.; Writing-original draft preparation, Y.-Y.C.; Writing-review and editing, M.-S.S. and Y.-Y.C. All authors contributed extensively to the work presented in this paper.
Funding
This work was supported by “Development of Scene Analysis & Surface Algorithms” project, funded by ETRI, which is a subproject of “Development of Geostationary Meteorological Satellite Ground Segment (NMSC-2018-01)” program funded by NMSC (National Meteorological Satellite Center) of KMA (Korea Meteorological Administration).
Acknowledgments
We are thankful to the National Meteorological Satellite Centre of Korea Meteorological Administration (KMA) for providing Himawari-8 data.
Conflicts of Interest
The authors declare no conflict of interest.
References
- Dash, P.; Göttsche, F.; Olesen, F.; Fischer, H. Land Surface Temperature and Emissivity Estimation from Passive Sensor Data: Theory and Practice-Current Trends. Int. J. Remote Sens. 2002, 23, 2563–2594. [Google Scholar] [CrossRef]
- Corbari, C.; Sobrino, J.; Mancini, M.; Hidalgo, V. Land Surface Temperature Representativeness in a Heterogeneous Area through a Distributed Energy-Water Balance Model and Remote Sensing Data. Hydrol. Earth Syst. Sci. 2010, 14, 2141. [Google Scholar] [CrossRef]
- Park, S.K.; Sungmin, O.; Cassardo, C. Soil temperature response in Korea to a changing climate using a land surface model. Asia-Pac. J. Atmos. Sci. 2017, 53, 457–470. [Google Scholar] [CrossRef]
- Karnieli, A.; Agam, N.; Pinker, R.T.; Anderson, M.; Imhoff, M.L.; Gutman, G.G.; Panov, N.; Goldberg, A. Use of NDVI and Land Surface Temperature for Drought Assessment: Merits and Limitations. J. Clim. 2010, 23, 618–633. [Google Scholar] [CrossRef]
- Leng, P.; Song, X.; Li, Z.; Wang, Y.; Wang, R. Toward the Estimation of Surface Soil Moisture Content using Geostationary Satellite Data Over Sparsely Vegetated Area. Remote Sens. 2015, 7, 4112–4138. [Google Scholar] [CrossRef]
- Liao, W.; Liu, X.; Wang, D.; Sheng, Y. The Impact of Energy Consumption on the Surface Urban Heat Island in China’s 32 Major Cities. Remote Sens. 2017, 9, 250. [Google Scholar] [CrossRef]
- Rozenstein, O.; Agam, N.; Serio, C.; Masiello, G.; Venafra, S.; Achal, S.; Punkrin, E.; Karnieli, A. Diurnal emissivity dynamics in bare versus biocrusted sand dunes. Sci. Total Environ. 2015, 506, 422–429. [Google Scholar] [CrossRef]
- Koo, M.S.; Baek, S.; Seol, K.H.; Cho, K. Advances in land modeling of KIAPS based on the Noah Land Surface Model. Asia-Pac. J. Atmos. Sci. 2017, 53, 361–373. [Google Scholar] [CrossRef]
- Barat, A.; Kumar, S.; Kumar, P.; Sarthi, P.P. Characteristics of Surface Urban Heat Island (SUHI) over the Gangetic Plain of Bihar, India. Asia-Pac. J. Atmos. Sci. 2018, 54, 205–214. [Google Scholar] [CrossRef]
- Prata, A.; Caselles, V.; Coll, C.; Sobrino, J.; Ottle, C. Thermal Remote Sensing of Land Surface Temperature from Satellites: Current Status and Future Prospects. Remote Sens. Rev. 1995, 12, 175–224. [Google Scholar] [CrossRef]
- Li, Z.; Tang, B.; Wu, H.; Ren, H.; Yan, G.; Wan, Z.; Trigo, I.F.; Sobrino, J.A. Satellite-Derived Land Surface Temperature: Current Status and Perspectives. Remote Sens. Environ. 2013, 131, 14–37. [Google Scholar] [CrossRef]
- McMillin, L.M. Estimation of Sea Surface Temperatures from Two Infrared Window Measurements with Different Absorption. J. Geophys. Res. 1975, 80, 5113–5117. [Google Scholar] [CrossRef]
- Becker, F.; Li, Z. Temperature-Independent Spectral Indices in Thermal Infrared Bands. Remote Sens. Environ. 1990, 32, 17–33. [Google Scholar] [CrossRef]
- Prata, A.J. Land Surface Temperatures Derived from the Advanced Very High Resolution Radiometer and the along-track Scanning Radiometer: 1. Theory. J. Geophys. Res. Atmos. 1993, 98, 16689–16702. [Google Scholar] [CrossRef]
- Gillespie, A.; Rokugawa, S.; Matsunaga, T.; Cothern, J.S.; Hook, S.; Kahle, A.B. A Temperature and Emissivity Separation Algorithm for Advanced Spaceborne Thermal Emission and Reflection Radiometer (ASTER) Images. IEEE Trans. Geosci. Remote Sens. 1998, 36, 1113–1126. [Google Scholar] [CrossRef]
- Peres, L.F.; DaCamara, C.C. Emissivity Maps to Retrieve Land Surface Temperature from MSG/SEVIRI. IEEE Trans. Geosci. Remote Sens. 2005, 43, 1834–1844. [Google Scholar] [CrossRef]
- Wang, N.; Li, Z.; Tang, B.; Zeng, F.; Li, C. Retrieval of Atmospheric and Land Surface Parameters from Satellite Based Thermal Infrared Hyperspectral Data using a Neural Network Technique. Int. J. Remote Sens. 2013, 34, 3485–3502. [Google Scholar] [CrossRef]
- Göttsche, F.; Olesen, F.; Trigo, I.F.; Bork-Unkelbach, A.; Martin, M.A. Long Term Validation of Land Surface Temperature Retrieved from MSG/SEVIRI with Continuous in-Situ Measurements in Africa. Remote Sens. 2016, 8, 410. [Google Scholar] [CrossRef]
- Price, J.C. Land Surface Temperature Measurements from the Split Window Channels of the NOAA 7 Advanced Very High Resolution Radiometer. J. Geophys. Res. Atmos. 1984, 89, 7231–7237. [Google Scholar] [CrossRef]
- Moran, M.S.; Jackson, R.D. Assessing the Spatial Distribution of Evapotranspiration using Remotely Sensed Inputs. J. Environ. Qual. 1991, 20, 725–737. [Google Scholar] [CrossRef]
- Kerr, Y.H.; Lagouarde, J.P.; Imbernon, J. Accurate Land Surface Temperature Retrieval from AVHRR Data with use of an Improved Split Window Algorithm. Remote Sens. Environ. 1992, 41, 197–209. [Google Scholar] [CrossRef]
- Ulivieri, C.; Castronuovo, M.; Francioni, R.; Cardillo, A. A Split Window Algorithm for Estimating Land Surface Temperature from Satellites. Adv. Space Res. 1994, 14, 59–65. [Google Scholar]
- Wan, Z.; Dozier, J. A Generalized Split-Window Algorithm for Retrieving Land-Surface Temperature from Space. IEEE Trans. Geosci. Remote Sens. 1996, 34, 892–905. [Google Scholar]
- Prata, A.; Cechet, R. An Assessment of the Accuracy of Land Surface Temperature Determination from the GMS-5 VISSR. Remote Sens. Environ. 1999, 67, 1–14. [Google Scholar]
- Sun, D.; Pinker, R.T. Estimation of Land Surface Temperature from a Geostationary Operational Environmental Satellite (GOES-8). J. Geophys. Res. Atmos. 2003, 108. [Google Scholar] [CrossRef]
- Sobrino, J.; Romaguera, M. Land Surface Temperature Retrieval from MSG1-SEVIRI Data. Remote Sens. Environ. 2004, 92, 247–254. [Google Scholar]
- Pinker, R.T.; Sun, D.; Hung, M.; Li, M.; Basara, J.B. Evaluation of Satellite Estimates of Land Surface Temperature from GOES Over the United States. J. Appl. Meteorol. Climatol. 2009, 48, 167–180. [Google Scholar]
- Yu, Y.; Tarpley, D.; Privette, J.L.; Goldberg, M.D.; Raja, M.R.V.; Vinnikov, Y.; Xu, Y. Developing Algorithm for Operational GOES-R Land Surface Temperature Product. IEEE Trans. Geosci. Remote Sens. 2009, 47, 936–951. [Google Scholar]
- Sobrino, J.; Jiménez-Muñoz, J.; Brockmann, C.; Ruescas, A.; Danne, O.; North, P.; Heckel, A.; Davies, W.; Berger, M.; Merchant, C. Land Surface Temperature Retrieval from Sentinel 2 and 3 Missions. In Proceedings of the Sentinel-3 OLCI/SLSTR and MERIS/(A) ATSR Workshop, Frascati, Italy, 15–19 October 2012. [Google Scholar]
- Cho, A.; Suh, M. Evaluation of Land Surface Temperature Operationally Retrieved from Korean Geostationary Satellite (COMS) Data. Remote Sens. 2013, 5, 3951–3970. [Google Scholar] [Green Version]
- Cho, A.; Choi, Y.; Suh, M. Improvements of a COMS Land Surface Temperature Retrieval Algorithm Based on the Temperature Lapse Rate and Water Vapor/Aerosol Effect. Remote Sens. 2015, 7, 1777–1797. [Google Scholar] [Green Version]
- Choi, Y.Y.; Suh, M.S. Improvement of COMS land surface temperature retrieval algorithm by considering diurnal variation of air temperature. Korean J. Remote Sens. 2016, 32, 435–452. (In Korean) [Google Scholar] [CrossRef] [Green Version]
- Schmit, T.J.; Gunshor, M.M.; Menzel, W.P.; Gurka, J.J.; Li, J.; Bachmeier, A.S. Introducing the Next-Generation Advanced Baseline Imager on GOES-R. Bull. Am. Meteorol. Soc. 2005, 86, 1079–1096. [Google Scholar] [CrossRef]
- Choi, Y.; Ho, C. Earth and Environmental Remote Sensing Community in South Korea: A Review. Remote Sens. Appl. 2015, 2, 66–76. [Google Scholar] [CrossRef]
- Bessho, K.; Date, K.; Hayashi, M.; Ikeda, A.; Imai, T.; Inoue, H.; Kumagai, Y.; Miyakawa, T.; Murata, H.; Ohno, T.; et al. An Introduction to Himawari-8/9—Japan’s New-Generation Geostationary Meteorological Satellites. J. Meteorol. Soc. Jpn. 2016, 94, 151–183. [Google Scholar] [CrossRef]
- Xu, H.; Yu, Y.; Tarpley, D.; Gottsche, F.; Olesen, F. Evaluation of GOES-R Land Surface Temperature Algorithm using SEVIRI Satellite Retrievals with in Situ Measurements. IEEE Trans. Geosci. Remote Sens. 2014, 52, 3812–3822. [Google Scholar] [CrossRef]
- Yamamoto, Y.; Ishikawa, H.; Oku, Y.; Hu, Z. An algorithm for land surface temperature retrieval using three thermal infrared bands of Himawari-8. J. Meteorl. Soc. Jpn. 2018, 96, 59–76. [Google Scholar] [CrossRef]
- Lee, B.I.; Chung, S.R.; Baek, S. Development of cloud detection algorithm for GK-2A/AMI. In Proceedings of the 7th Asia-Oceania/2nd AMS-Asia/2nd KMA Meteorological Satellite User’s Conference, Songdo City, Korea, 24–27 October 2016. [Google Scholar]
- Sobrino, J.A.; Li, Z.L.; Stoll, M.P.; Becker, F. Improvements in the split-window technique for land surface temperature determination. IEEE Trans. Geosci Remote Sens. 1994, 32, 243–253. [Google Scholar] [CrossRef]
- Jiménez-Muñoz, J.C.; Sobrino, J.A. A generalized single-channel method for retrieving land surface temperature from remote sensing data. J. Geophys. Res. Atmos. 2003, 108. [Google Scholar] [CrossRef] [Green Version]
- Valor, E.; Caselles, V. Mapping land surface emissivity from NDVI: Application to European, African, and South American areas. Remote Sens. Environ. 1996, 57, 167–184. [Google Scholar] [CrossRef]
- Snyder, W.C.; Wan, Z.; Zhang, Y.; Feng, Y.Z. Classification-based emissivity for land surface temperature measurement from space. Int. J. Remote Sens. 1998, 19, 2753–2774. [Google Scholar] [CrossRef]
- Wan, Z. MODIS Land-Surface Temperature Algorithm Theoretical Basis Document (LST ATBD); Institute for Computational Earth System Science: Santa Barbara, CA, USA, 1999. [Google Scholar]
- Li, Z.; Petitcolin, F.; Zhang, R. A physically based algorithm for land surface emissivity retrieval from combined mid-infrared and thermal infrared data. Sci. China Ser. E 2000, 43, 23–33. [Google Scholar] [CrossRef]
- Gillespie, A.R.; Abbott, E.A.; Gilson, L.; Hulley, G.; Jiménez-Muñoz, J.C.; Sobrino, J.A. Residual errors in ASTER temperature and emissivity standard products AST08 and AST05. Remote Sens. Environ. 2011, 115, 3681–3694. [Google Scholar] [CrossRef]
- Masiello, G.; Serio, C.; De Feis, I.; Amoroso, M.; Venafra, S.; Trigo, I.F.; Watts, P. Kalman filter physical retrieval of surface emissivity and temperature from geostationary infrared radiances. Atmos. Meas. Tech. 2013, 6, 3613–3634. [Google Scholar] [CrossRef] [Green Version]
- Masiello, G.; Serio, C.; Venafra, S.; Liuzzi, G.; Göttsche, F.; Trigo, I.F.; Watts, P. Kalman filter physical retrieval of surface emissivity and temperature from SEVIRI infrared channels: A validation and intercomparison study. Atmos. Meas. Tech. 2015, 8, 2981–2997. [Google Scholar] [CrossRef]
- Blasi, M.G.; Liuzzi, G.; Masiello, G.; Serio, C.; Telesca, V.; Venafra, S. Surface parameters from SEVIRI observations through a Kalman filter approach: Application and evaluation of the scheme to the southern Italy. Tethys J. Weather Clim. West. Mediterr. 2016, 13, 1–19. [Google Scholar] [CrossRef]
- Park, K.H.; Suh, M.S. Improvement of infrared channel emissivity data in COMS observation area from recent MODIS data (2009–2012). Korean J. Remote Sens. 2014, 30, 109–126. (In Korean) [Google Scholar] [CrossRef]
- Caselles, E.; Valor, E.; Abad, F.; Caselles, V. Automatic classification-based generation of thermal infrared land surface emissivity maps using AATSR data over Europe. Remote Sens. Environ. 2012, 124, 321–333. [Google Scholar] [CrossRef] [Green Version]
- Verhoef, W.; Bach, H. Simulation of hyperspectral and directional radiance images using coupled biophysical and atmospheric radiative transfer models. Remote Sens. Environ. 2003, 87, 23–41. [Google Scholar] [CrossRef]
- Guanter, L.; Richter, R.; Kaufmann, H. On the application of the MODTRAN4 atmospheric radiative transfer code to optical remote sensing. Int. J. Remote Sens. 2009, 30, 1407–1424. [Google Scholar] [CrossRef]
- Jiménez-Muñoz, J.C.; Sobrino, J.A.; Mattar, C.; Franch, B. Atmospheric correction of optical imagery from MODIS and Reanalysis atmospheric products. Remote Sens. Environ. 2010, 114, 2195–2210. [Google Scholar] [CrossRef]
- Berk, A.; Anderson, G.; Acharya, P.; Chetwynd, J.; Bernstein, L.; Shettle, E.; Matthew, M.; Adler-Golden, S.M. MODTRAN4 User’s Manual; Air Force Research Laboratory: Hanscom AFB, MA, USA, 1999. [Google Scholar]
- Borbas, E.; Seemann, S.W.; Huang, H.-L.; Li, J.; Menzel, W.P. Global Profile Training Database for Satellite Regression Retrievals with Estimates of Skin Temperature and Emissivity. In Proceedings of the 14th International ATOVS Study Conference, Beijing, China, 25–31 May 2005; pp. 763–770. [Google Scholar]
- Wan, Z. New refinements and validation of the collection-6 MODIS land-surface temperature/emissivity product. Remote Sens. Environ. 2014, 140, 36–45. [Google Scholar] [CrossRef]
- Trigo, I.F.; Monteiro, I.T.; Olesen, F.; Kabsch, E. An assessment of remotely sensed land surface temperature. J. Geophys. Res. Atmos. 2008, 113. [Google Scholar] [CrossRef] [Green Version]
- Coll, C.; Wan, Z.; Galve, J.M. Temperature-based and radiance-based validations of the V5 MODIS land surface temperature product. J. Geophys. Res. Atmos. 2009, 114. [Google Scholar] [CrossRef] [Green Version]
- Frey, C.M.; Kuenzer, C.; Dech, S. Quantitative comparison of the operational NOAA-AVHRR LST product of DLR and the MODIS LST product V005. Int. J. Remote Sens. 2012, 33, 7165–7183. [Google Scholar] [CrossRef]
- Wang, K.; Liang, S. Evaluation of ASTER and MODIS land surface temperature and emissivity products using long-term surface longwave radiation observations at SURFRAD sites. Remote Sens. Environ. 2009, 113, 1556–1565. [Google Scholar] [CrossRef]
- Dash, P. Land Surface Temperature and Emissivity Retrieval from Satellite Measurements. FZKA. 2005. Available online: http://d-nb.info/97521960x/34/ (accessed on 25 October 2018).
- Sobrino, J.A.; Jiménez-Muñoz, J.C.; Paolini, L. Land surface temperature retrieval from LANDSAT TM 5. Remote Sens. Environ. 2004, 90, 434–440. [Google Scholar] [CrossRef]
- Atitar, M.; Sobrino, J.A. A split-window algorithm for estimating LST from Meteosat 9 data: Test and comparison with in situ data and MODIS LSTs. IEEE Geosci. Remote Sens. Lett. 2009, 6, 122–126. [Google Scholar] [CrossRef]
- Jiménez-Muñoz, J.C.; Sobrino, J.A. A single-channel algorithm for land-surface temperature retrieval from ASTER data. IEEE Geosci. Remote Sens. Lett. 2010, 7, 176–179. [Google Scholar] [CrossRef]
- Chen, Y.; Duan, S.B.; Ren, H.; Labed, J.; Li, Z.L. Algorithm Development for Land Surface Temperature Retrieval: Application to Chinese Gaofen-5 Data. Remote Sens. 2017, 9, 161. [Google Scholar] [CrossRef]
- Han, K.-S.; Park, Y.-Y.; Yeom, J.-M. Detection of change in vegetation in the surrounding desert areas of North China and Mongolia with multi-temporal satellite images. Asia-Pac. J. Atmos. Sci. 2015, 51, 173–181. [Google Scholar] [CrossRef]
- Oyoshi, K.; Akatsuka, S.; Takeuchi, W.; Sobue, S. Hourly LST Monitoring with Japanese Geostationary Satellite MTSAT-1R over the Asia-Pacific Region. Asian J. Geoinform. 2014, 14, 1–13. [Google Scholar]
- Trigo, I.F.; Peres, L.F.; DaCamara, C.C.; Freitas, S.C. Thermal land surface emissivity retrieved from SEVIRI/Meteosat. IEEE Trans. Geosci. Remote Sens. 2008, 46, 307–315. [Google Scholar] [CrossRef]
- Tang, B.; Bi, Y.; Li, Z.L.; Xia, J. Generalized split-window algorithm for estimate of land surface temperature from Chinese geostationary FengYun meteorological satellite (FY-2C) data. Sensors 2008, 8, 933–951. [Google Scholar] [CrossRef]
- Prata, A.J. Land surface temperatures derived from the Advanced Very High Resolution Radiometer and the along-track scanning radiometer: 2. Experimental results and validation of AVHRR algorithms. J. Geophys. Res. Atmos. 1994, 99, 13025–13058. [Google Scholar] [CrossRef]
- Wan, Z.; Zhang, Y.; Zhang, Q.; Li, Z.L. Validation of the land-surface temperature products retrieved from Terra Moderate Resolution Imaging Spectroradiometer data. Remote Sens. Environ. 2002, 83, 163–180. [Google Scholar] [CrossRef] [Green Version]
- Coll, C.; Galve, J.M.; Sanchez, J.M.; Caselles, V. Validation of Landsat-7/ETM+ thermal-band calibration and atmospheric correction with ground-based measurements. IEEE Trans. Geosci. Remote Sens. 2010, 48, 547–555. [Google Scholar] [CrossRef]
- Sobrino, J.A.; Jiménez-Muñoz, J.C.; Sòria, G.; Ruescas, A.B.; Danne, O.; Brockmann, C.; Ghent, D.; Remedios, J.; North, P.; Merchant, C.; et al. Synergistic use of MERIS and AATSR as a proxy for estimating Land Surface Temperature from Sentinel-3 data. Remote Sens. Environ. 2016, 179, 149–161. [Google Scholar] [CrossRef]
- Wan, Z.; Li, Z.L. Radiance-based validation of the V5 MODIS land-surface temperature product. Int. J. Remote Sens. 2008, 29, 5373–5395. [Google Scholar] [CrossRef]
- Wan, Z. New refinements and validation of the MODIS land-surface temperature/emissivity products. Remote Sens. Environ. 2008, 112, 59–74. [Google Scholar] [CrossRef]
- Ijima, O. Basic and Other Measurements of Radiation at Station Tateno (2016–08); Aerological Observatory, Meteorological Agency: Tokyo, Japan, 2016; Available online: https://doi.org/10.1594/PANGAEA.867410 (accessed on 25 October 2018).
- Qian, Y.G.; Li, Z.L.; Nerry, F. Evaluation of land surface temperature and emissivities retrieved from MSG/SEVIRI data with MODIS land surface temperature and emissivity products. Int. J. Remote Sens. 2013, 34, 3140–3152. [Google Scholar] [CrossRef]
- Niclòs, R.; Galve, J.M.; Valiente, J.A.; Estrela, M.J.; Coll, C. Accuracy assessment of land surface temperature retrievals from MSG2-SEVIRI data. Remote Sens. Environ. 2011, 115, 2126–2140. [Google Scholar] [CrossRef]
- Okuyama, A.; Takahashi, M.; Date, K.; Hosaka, K.; Murata, H.; Tabata, T. Validation of Himawari-8/AHI radiometric calibration based on two years of in-orbit data. J. Meteorl. Soc. Jpn. 2018, 96, 91–109. [Google Scholar] [CrossRef]
Figure 1.
Relative spectral response function of Himawari-8/AHI infrared channels.
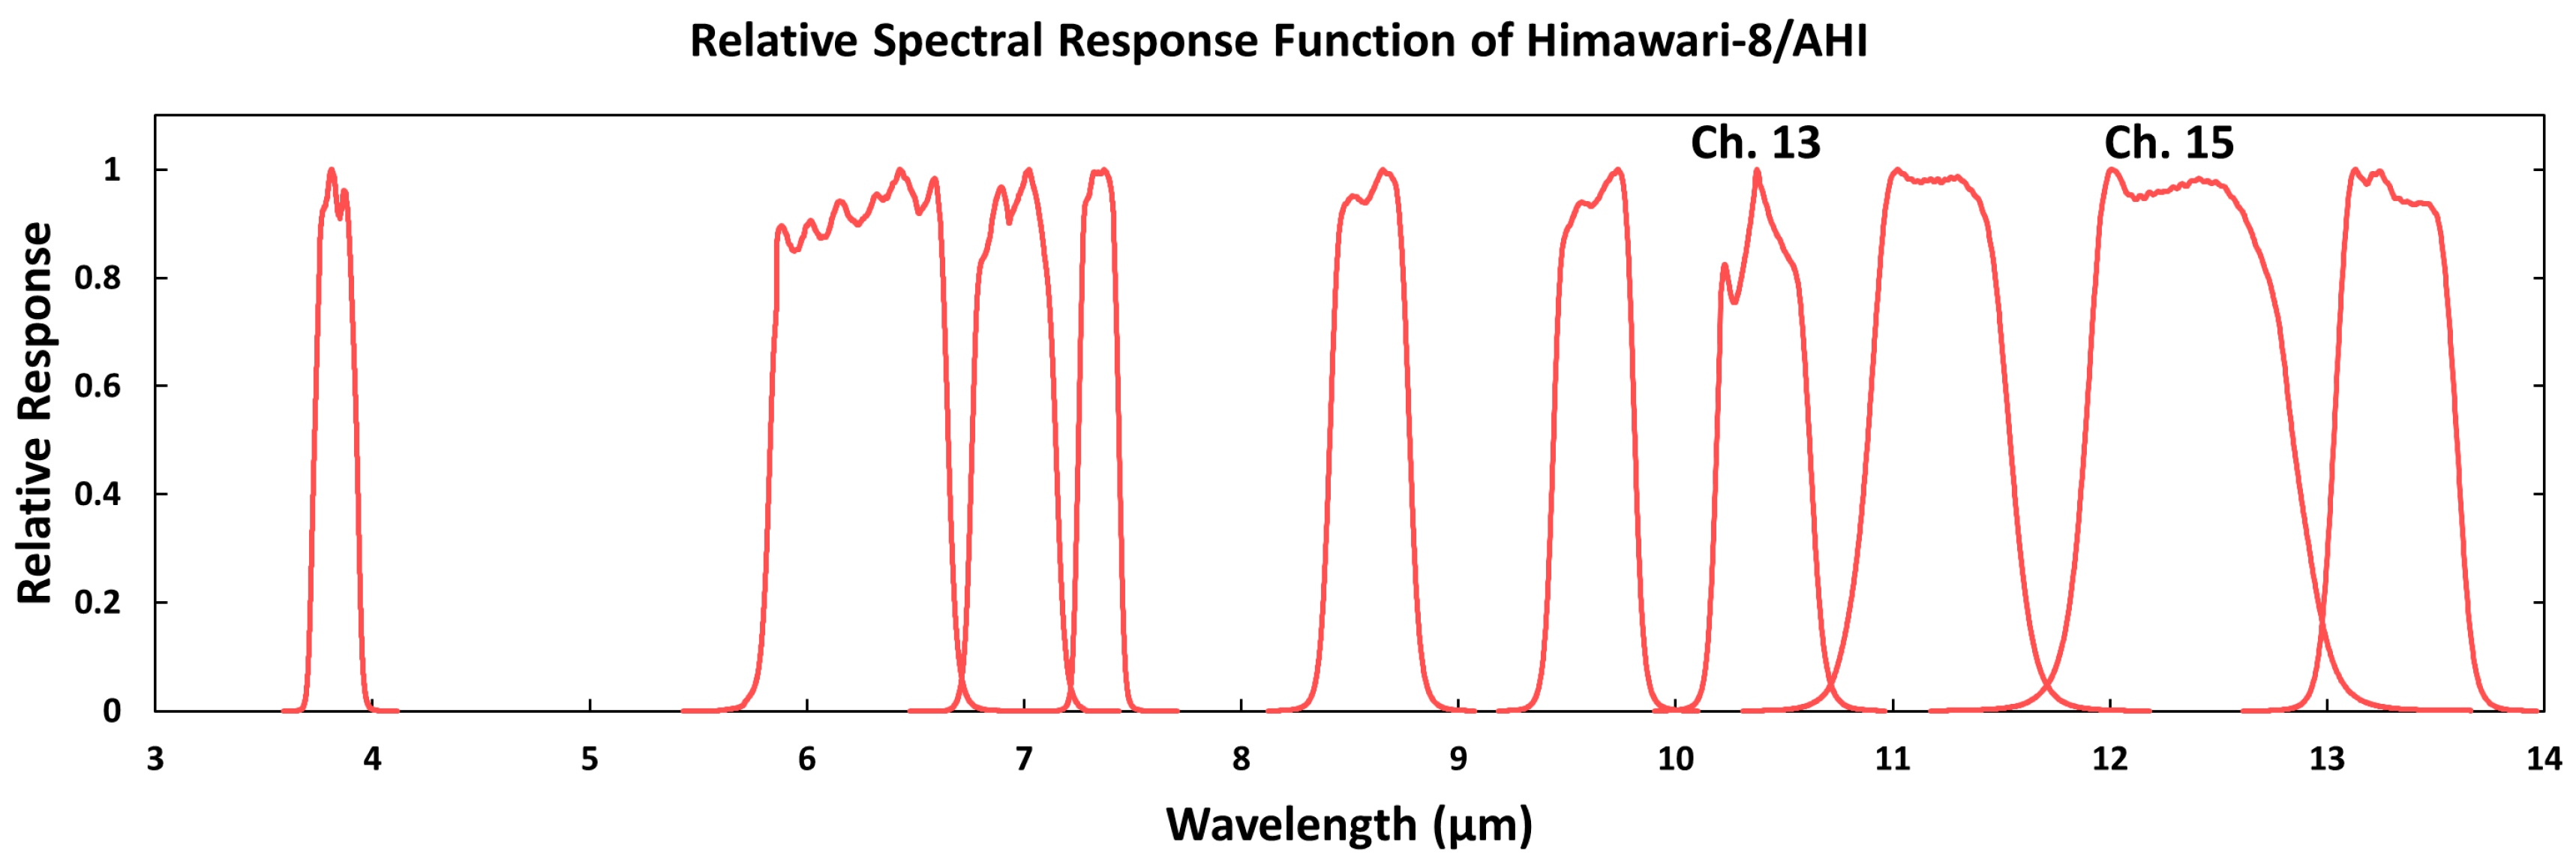
Figure 2.
Sample image of LST retrieved from Himawari-8/AHI data.
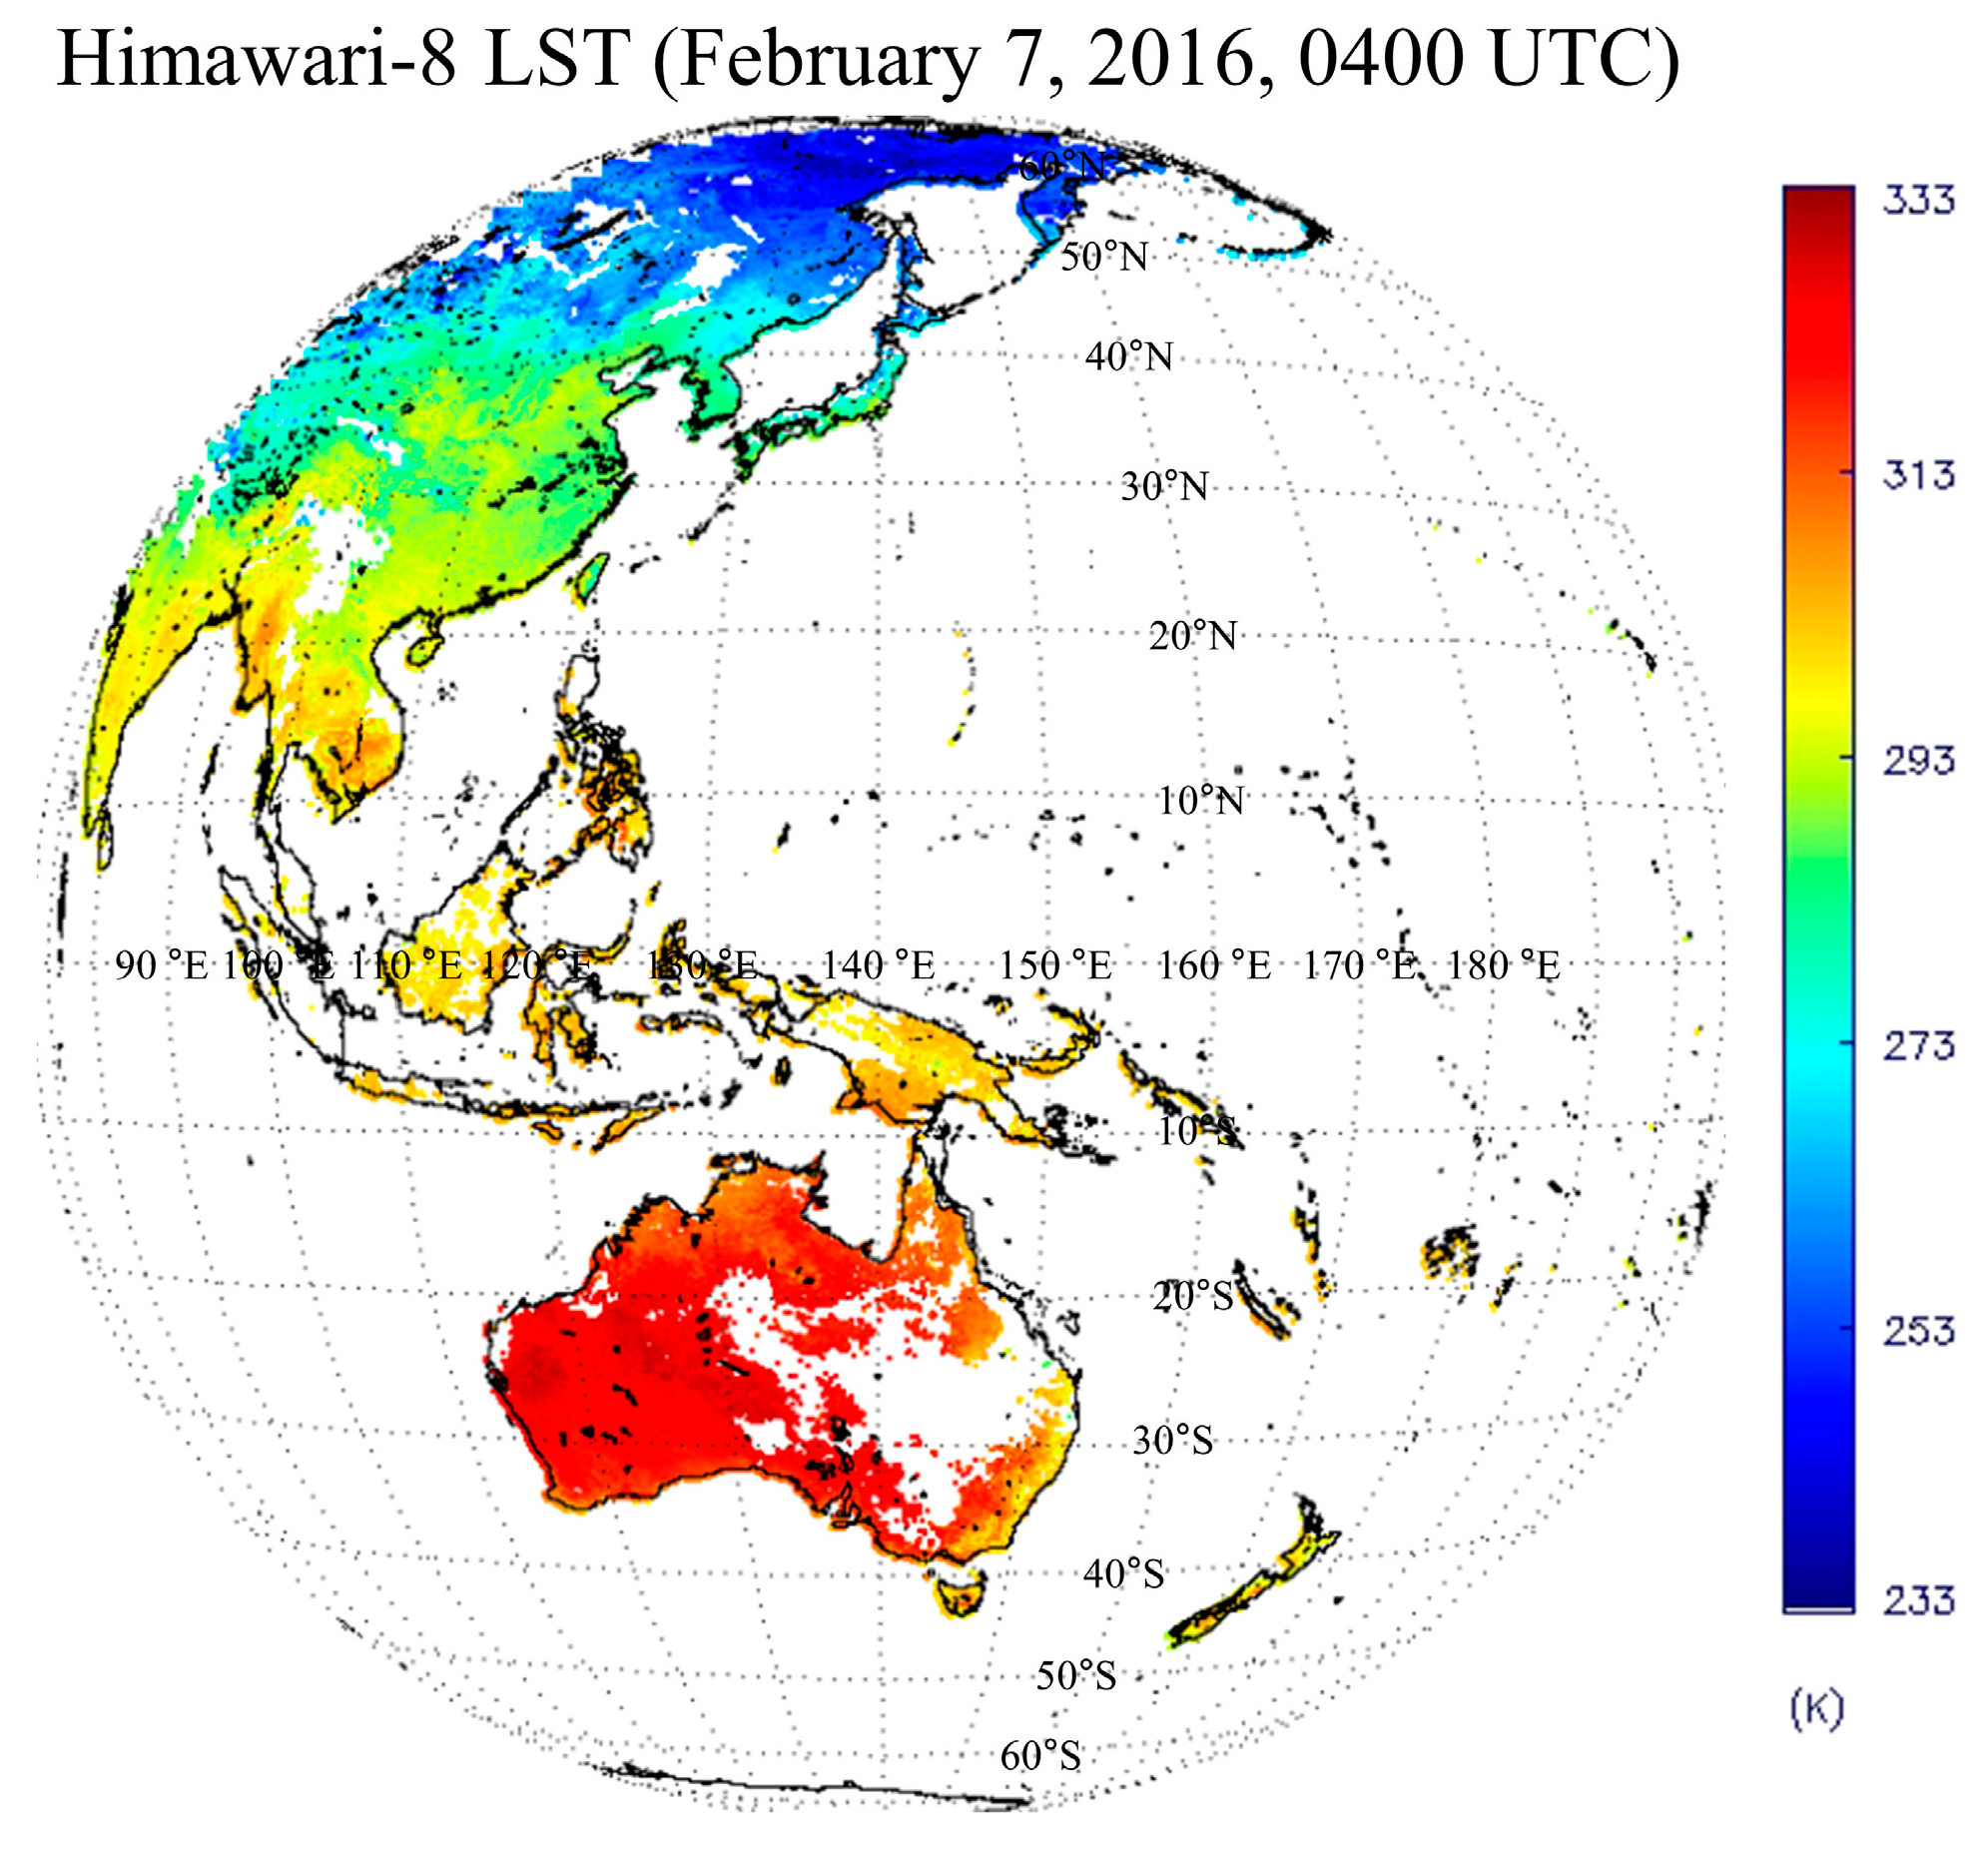
Figure 3.
Flowchart of LST retrieval process from Himawari-8/AHI.
Figure 4.
Distribution of RMSEs between LST calculated from radiative transfer model simulated brightness temperature and prescribed LST according to different impacting factors: (a) brightness temperature difference (BTD) and surface lapse rate, (b) emissivity difference and BTD, (c) satellite viewing zenith angle (VZA) and BTD.
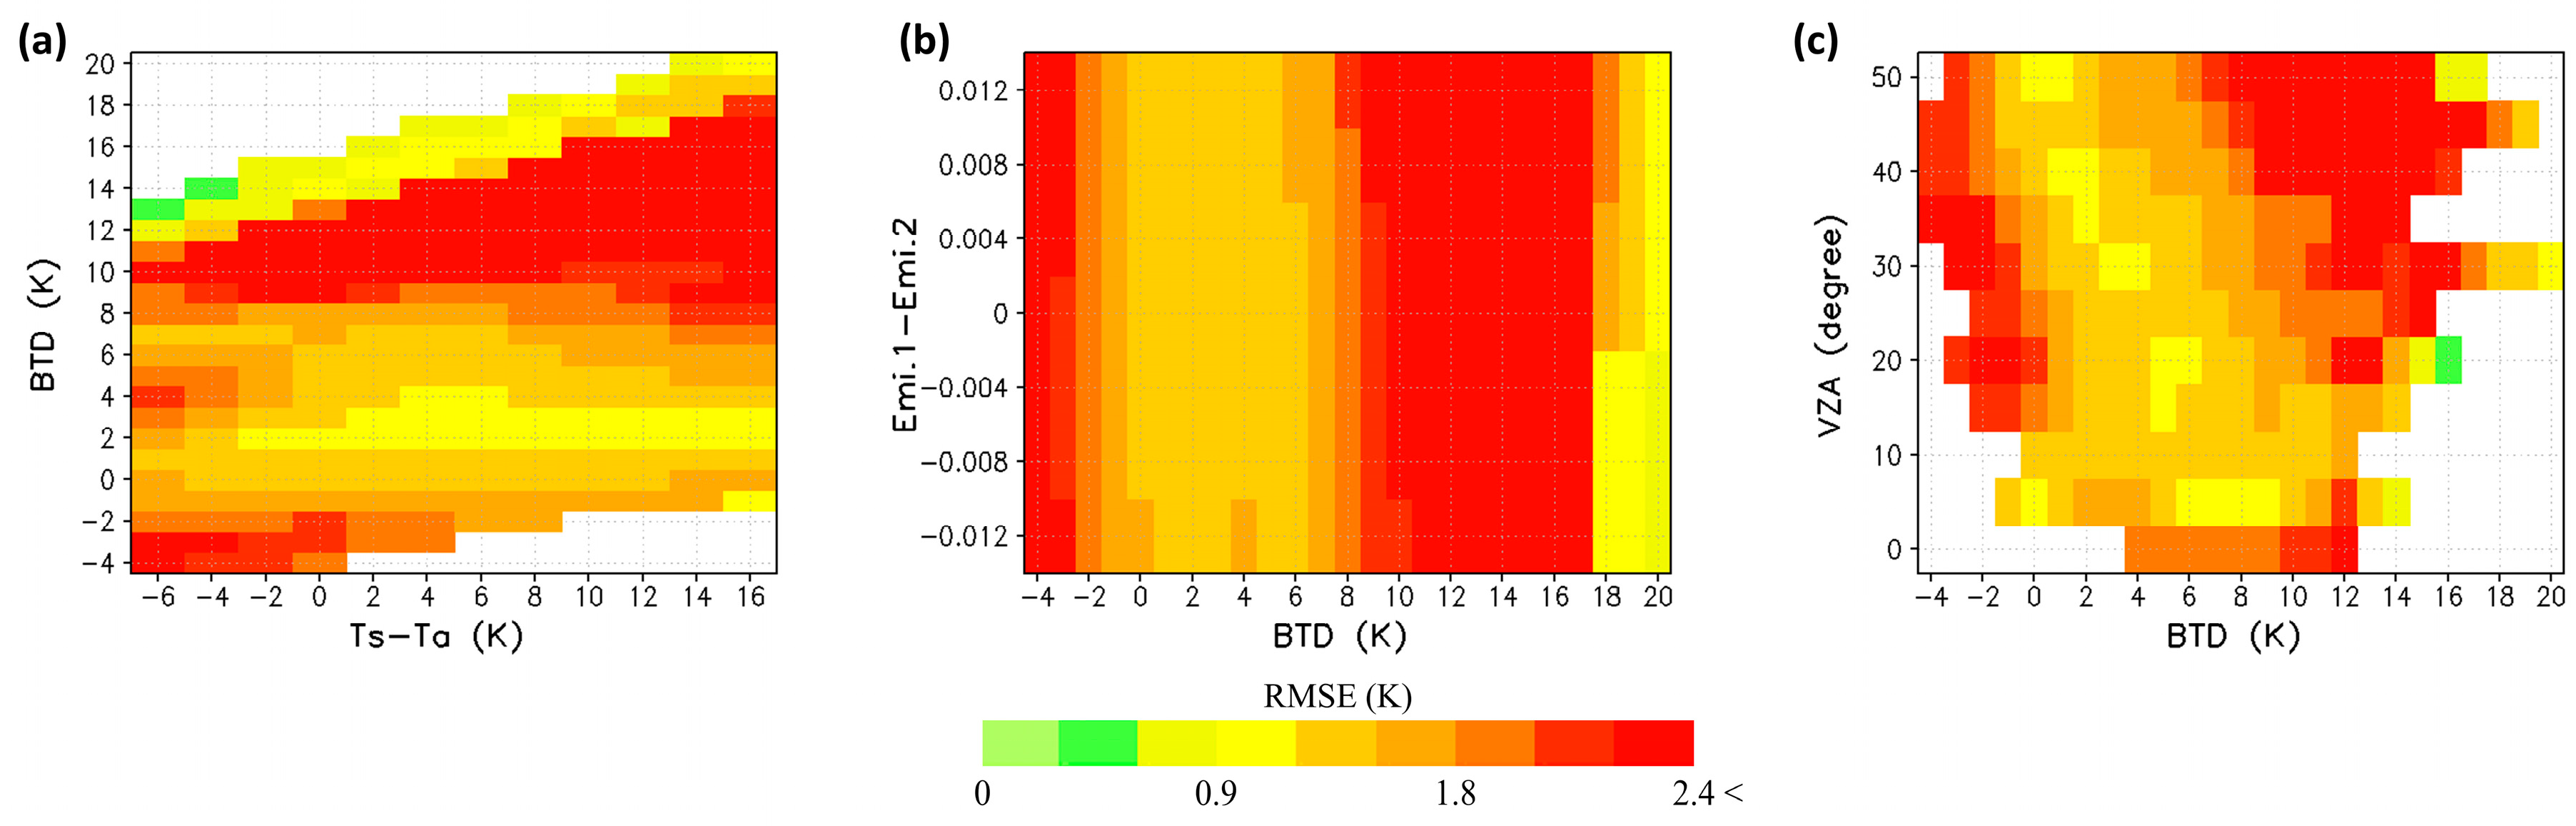
Figure 5.
(a) Scatter plot and (b) histogram showing differences between the reference LST and estimated LST using the Himawari-8/AHI LST retrieval algorithm.
Figure 5.
(a) Scatter plot and (b) histogram showing differences between the reference LST and estimated LST using the Himawari-8/AHI LST retrieval algorithm.

Figure 6.
Distribution of RMSEs for the Himawari-8 LST retrieval algorithms based on various impacting factors: (a) brightness temperature differences (BTD) and surface lapse rate, (b) emissivity difference and BTD, (c) emissivity difference and surface lapse rate, (d) satellite viewing zenith angle (VZA) and BTD, and (e) VZA and surface lapse rate.
Figure 7.
Spatial distribution of (a) Himawari-8 LST, (b) MODIS LST, (c) their differences, and (d) scatter plot between Himawari-8 and MODIS LST for December 12, 2015, 1500 UTC.
Figure 7.
Spatial distribution of (a) Himawari-8 LST, (b) MODIS LST, (c) their differences, and (d) scatter plot between Himawari-8 and MODIS LST for December 12, 2015, 1500 UTC.

Figure 8.
Same as Figure 7 except for February 8, 2016, 0300 UTC.
Figure 8.
Same as Figure 7 except for February 8, 2016, 0300 UTC.
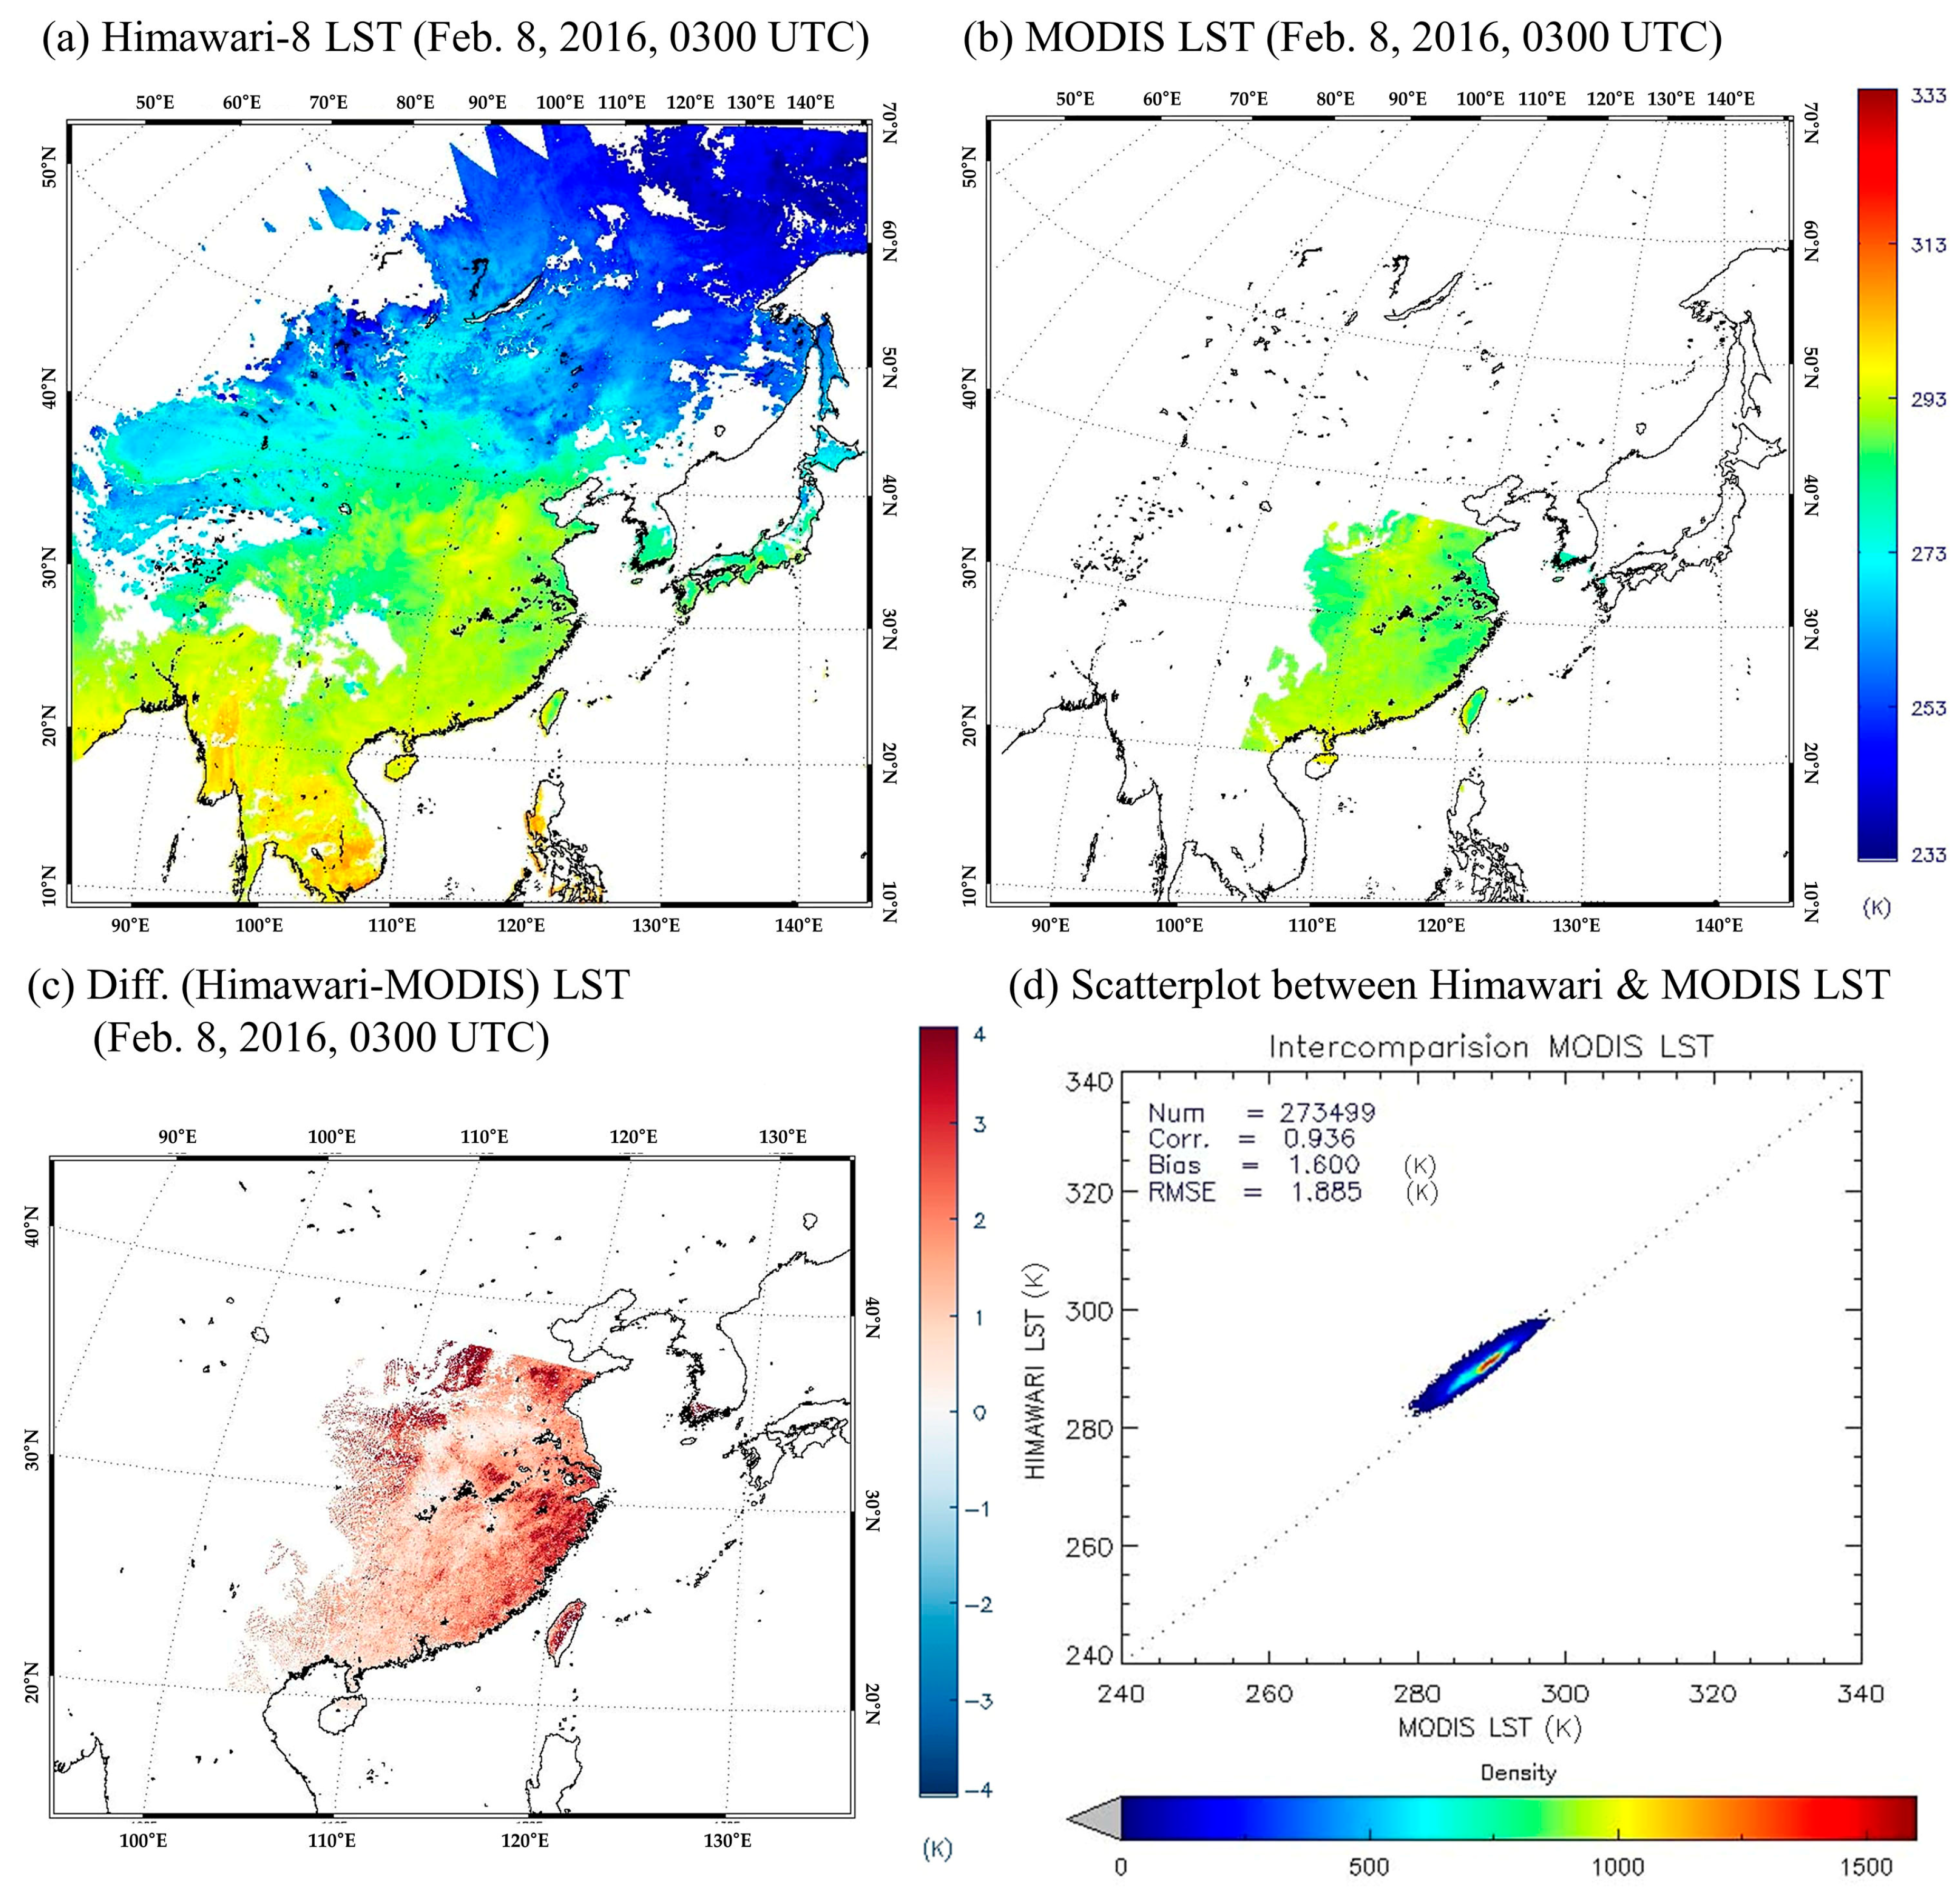
Figure 9.
Same as Figure 7 except for May 4, 2016, 1500 UTC.
Figure 9.
Same as Figure 7 except for May 4, 2016, 1500 UTC.
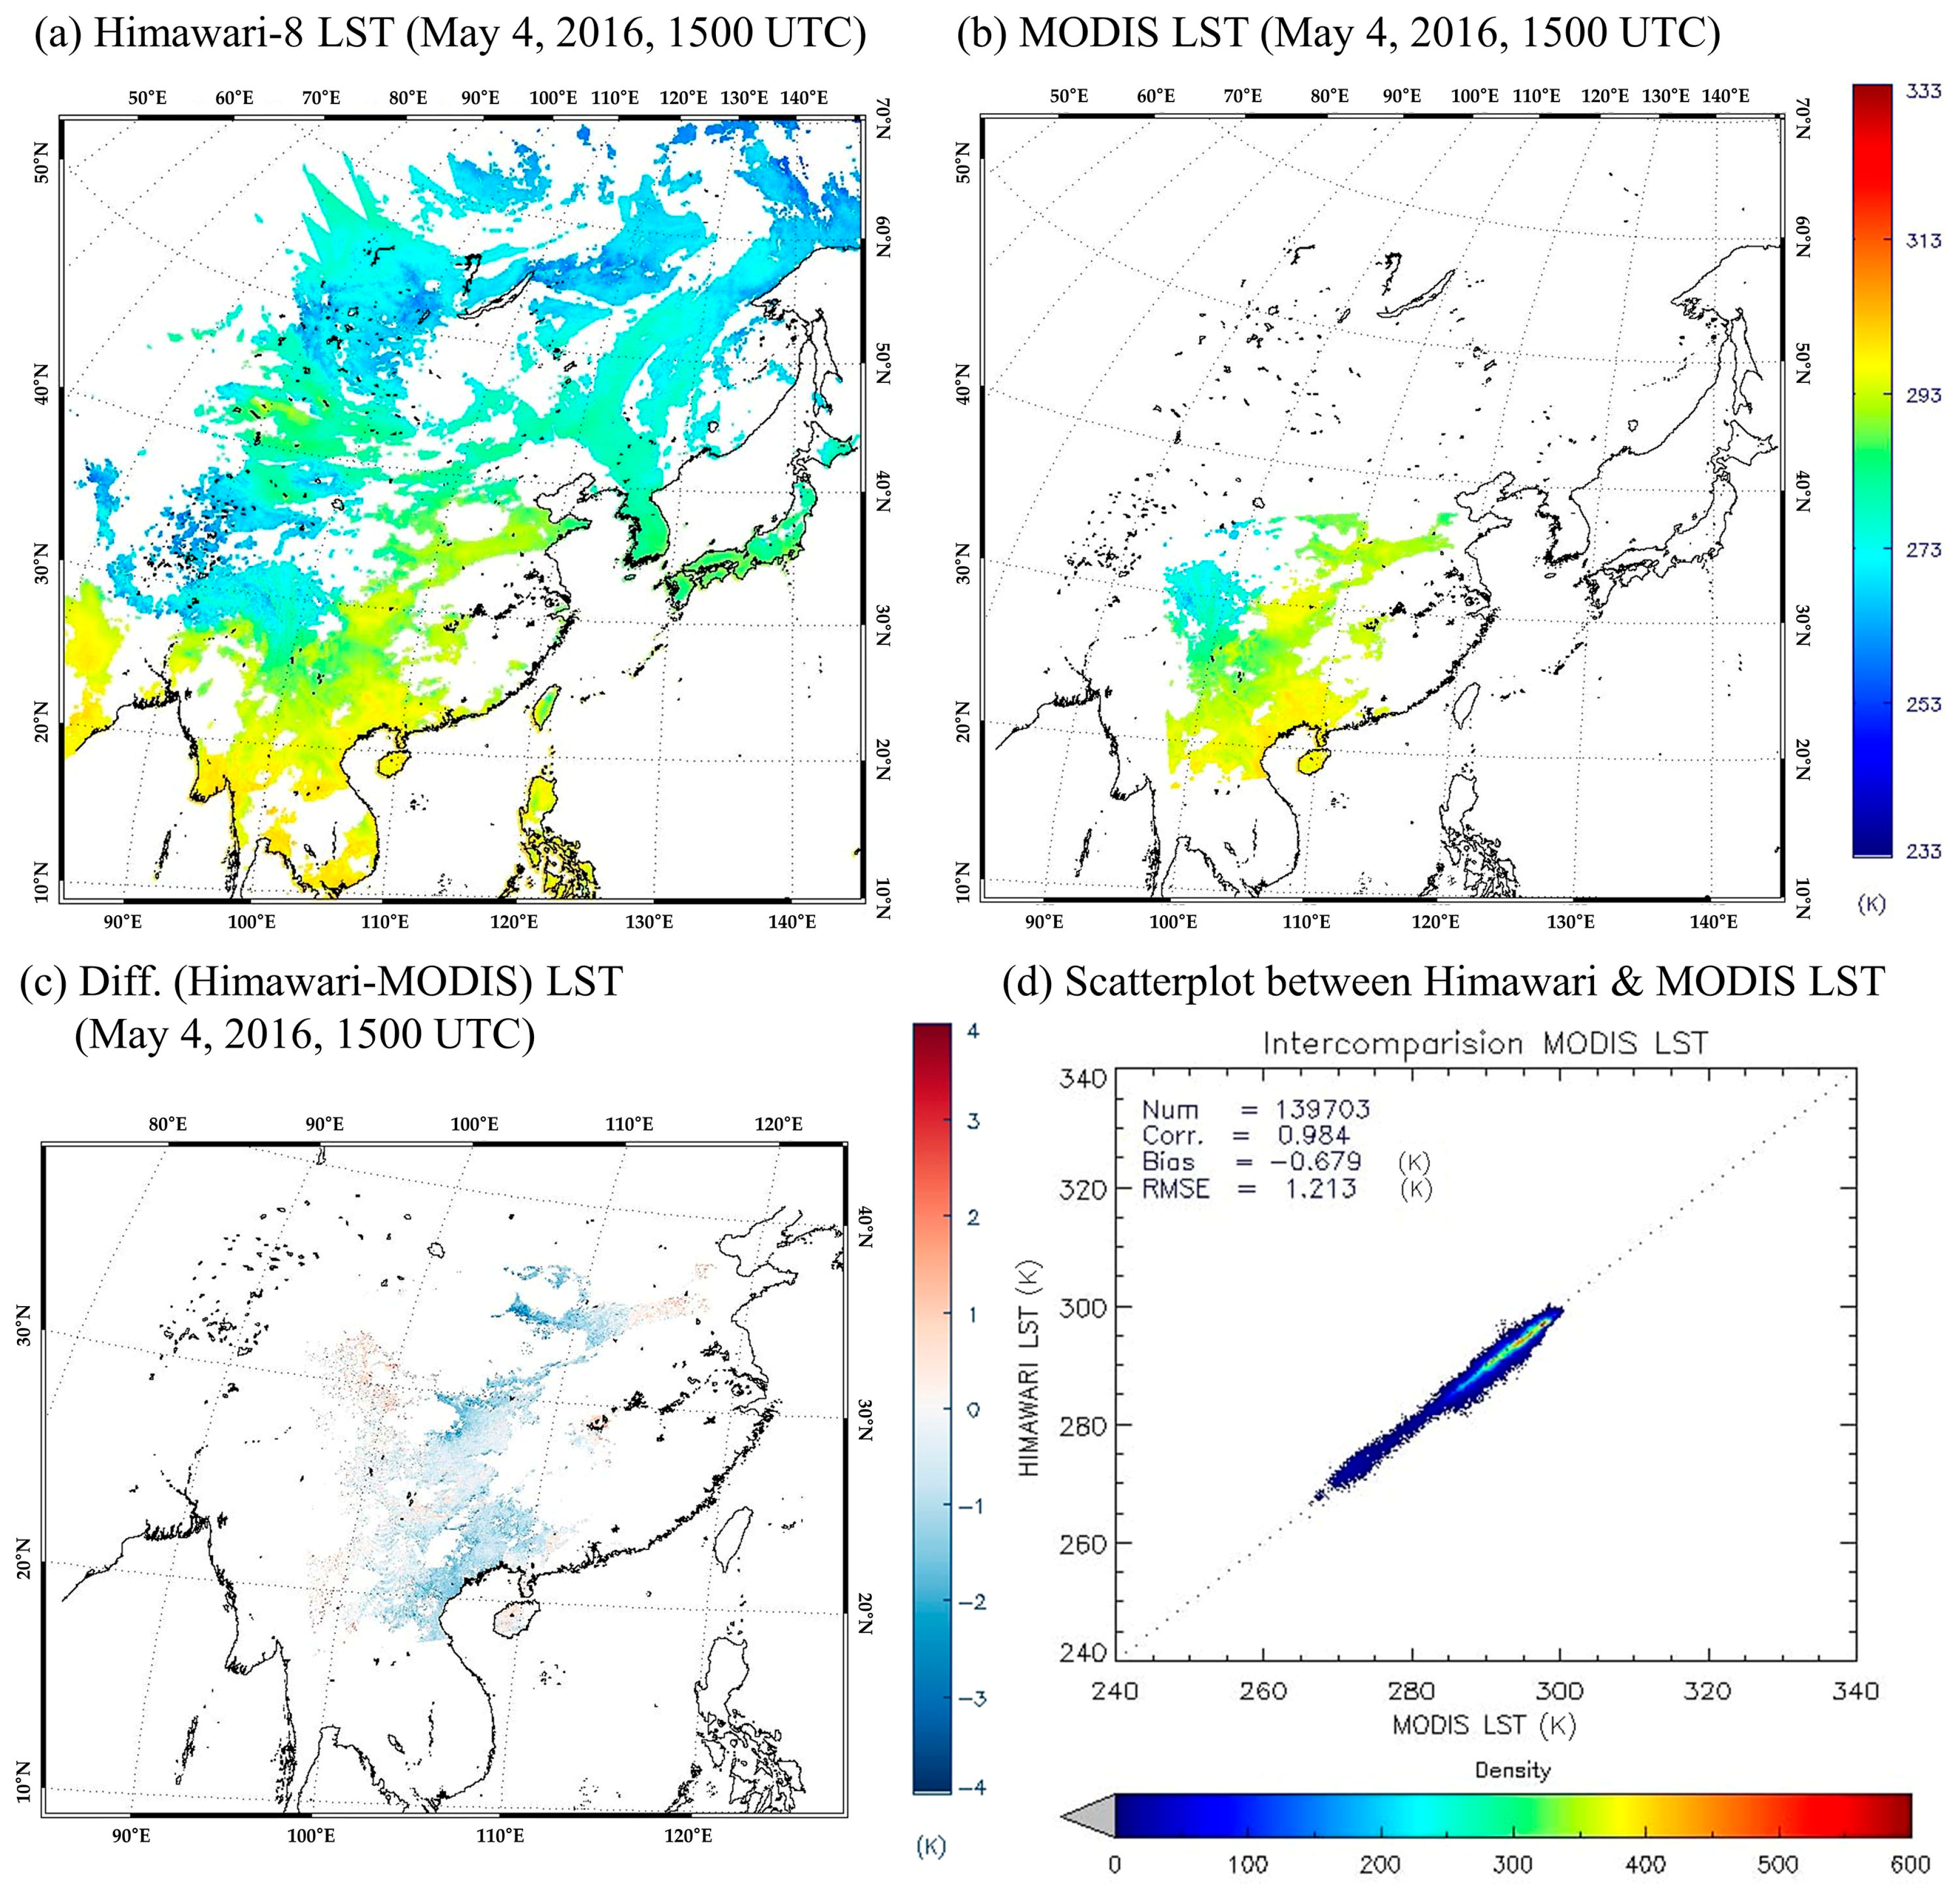
Figure 10.
Same as Figure 7 except for August 25, 2016, 0300 UTC.
Figure 10.
Same as Figure 7 except for August 25, 2016, 0300 UTC.

Figure 11.
Scatter plot between Himawari-8 LST and Tateno station Baseline Surface Radiation Network LST (red square symbol: daytime; blue circle symbol: nighttime).
Figure 11.
Scatter plot between Himawari-8 LST and Tateno station Baseline Surface Radiation Network LST (red square symbol: daytime; blue circle symbol: nighttime).
Figure 12.
Scatter plot between reference LST and estimated LST from RTM simulation using Himawari-8/AHI LST retrieval algorithm: (a) channels 13 and 15, and (b) channels 14 and 15.
Figure 12.
Scatter plot between reference LST and estimated LST from RTM simulation using Himawari-8/AHI LST retrieval algorithm: (a) channels 13 and 15, and (b) channels 14 and 15.
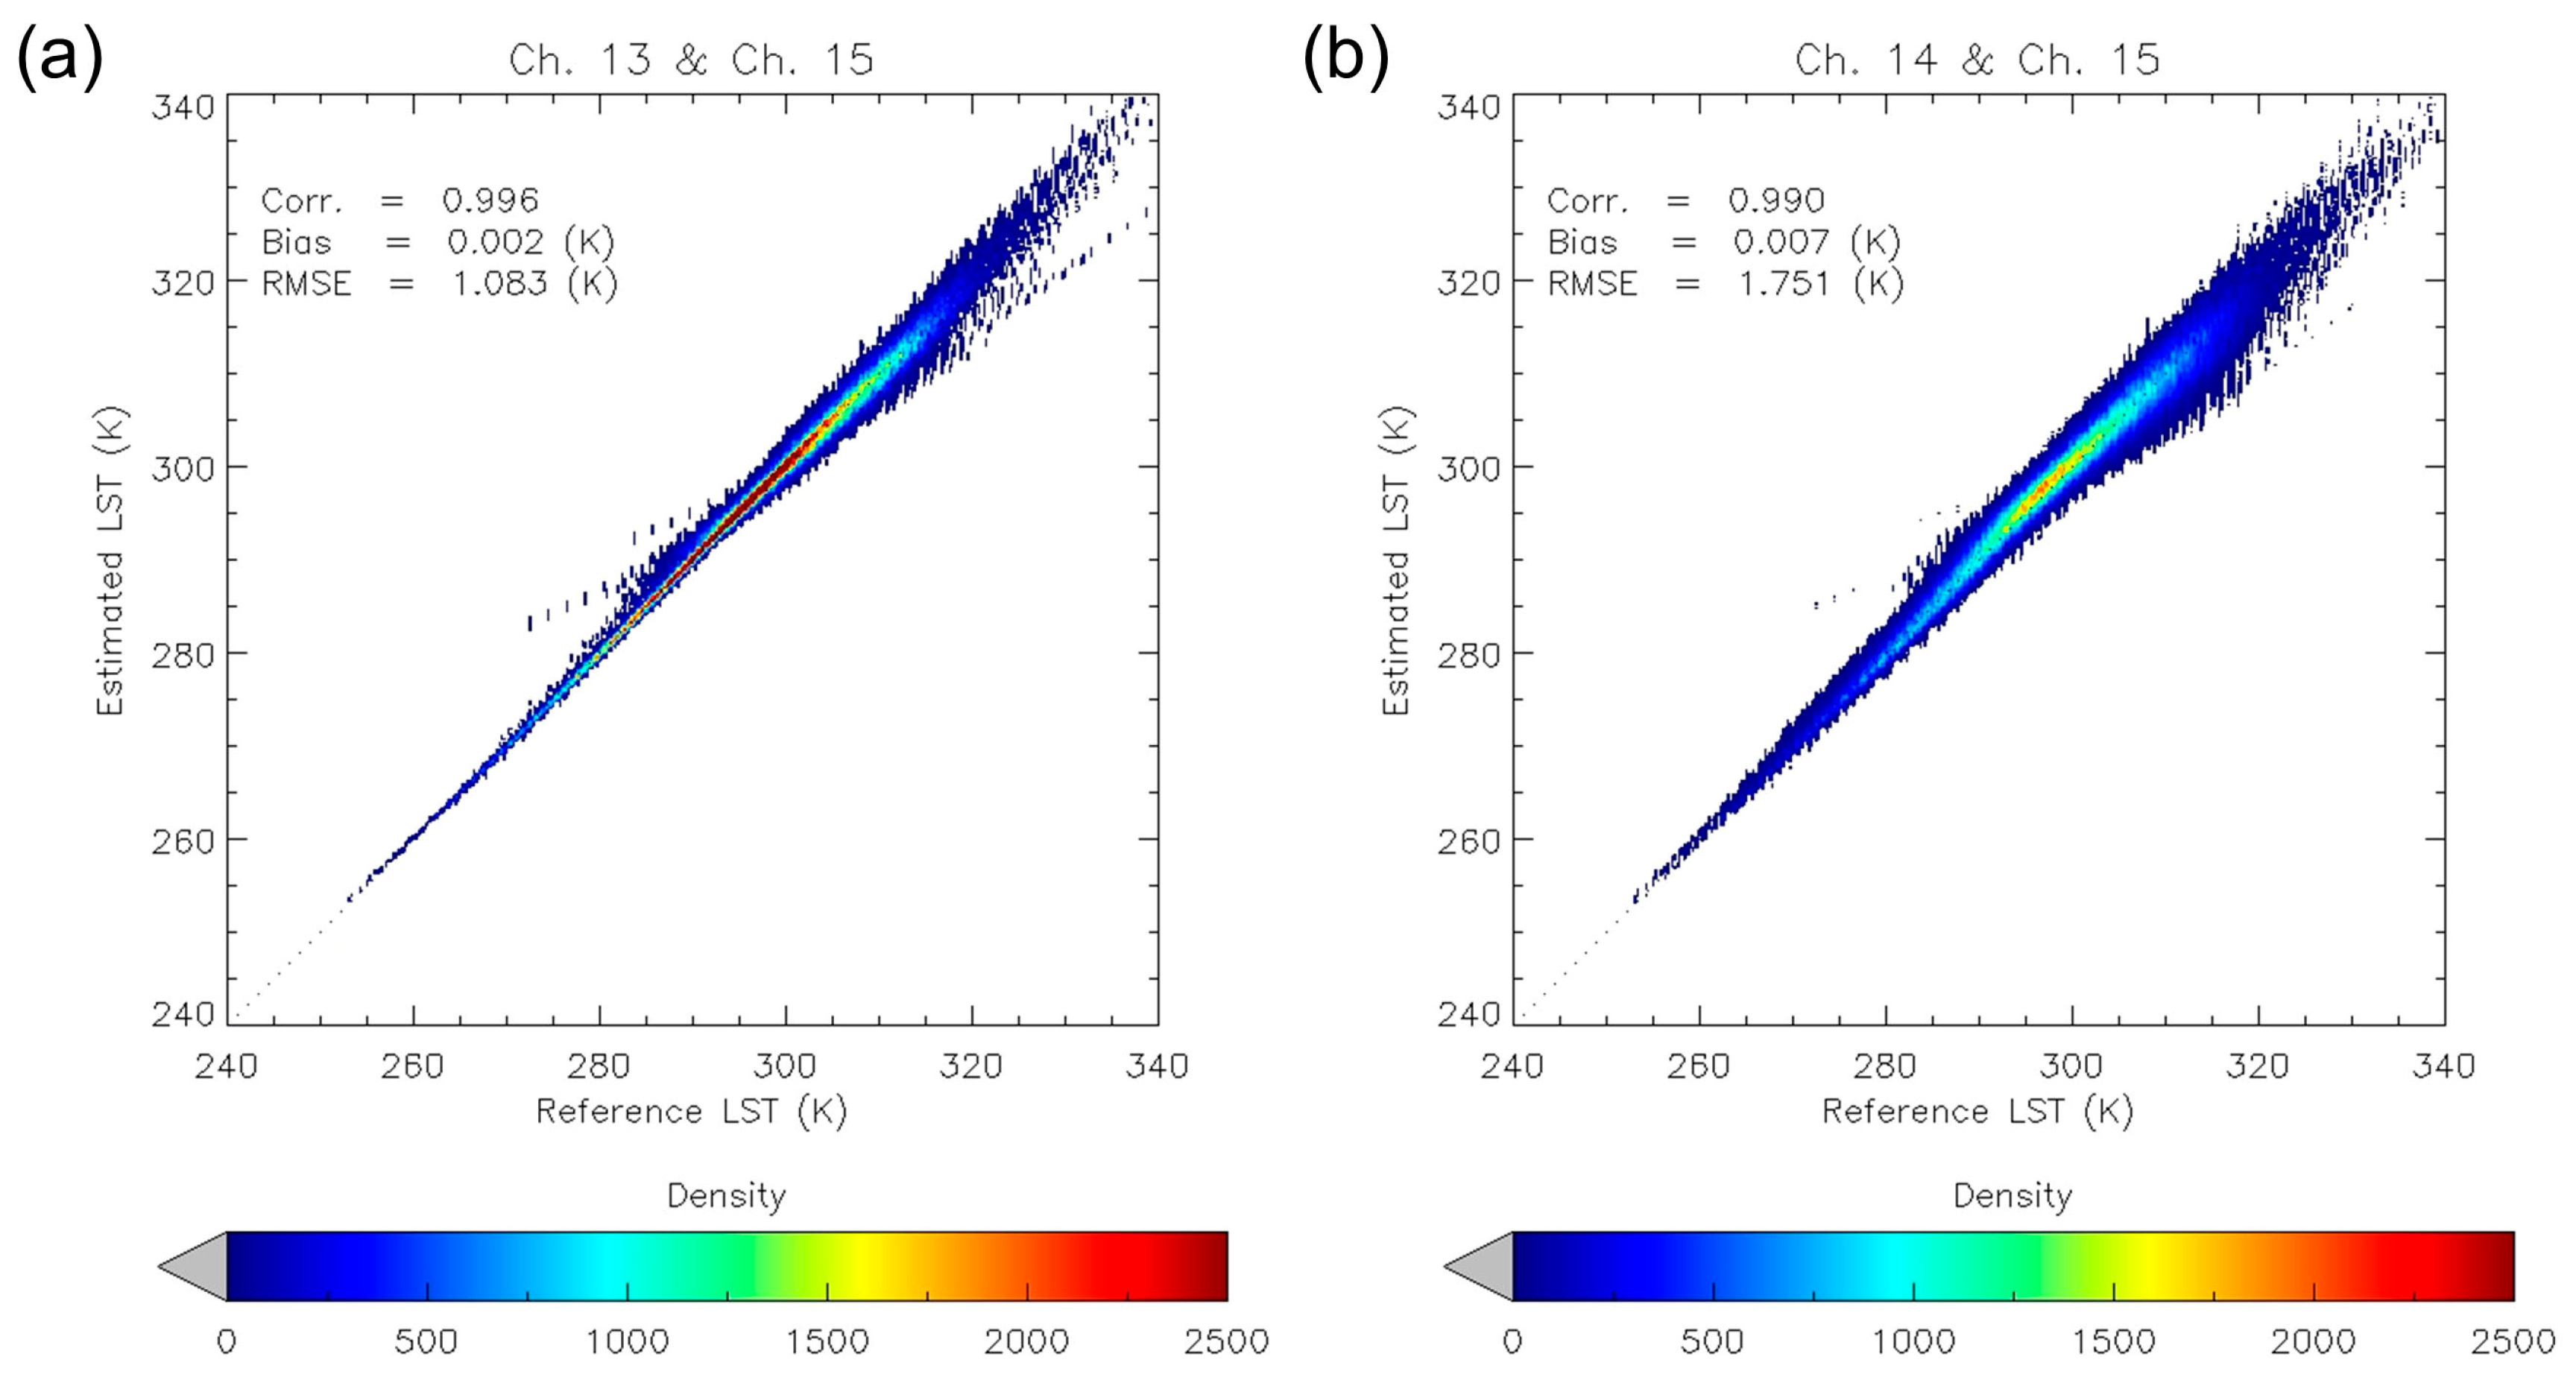
Figure 13.
(a) Spatial distribution of differences between Himawari-8 and MODIS LST, and (b) scatter plot between Himawari-8 and MODIS LST in daytime during winter for selected days.
Figure 13.
(a) Spatial distribution of differences between Himawari-8 and MODIS LST, and (b) scatter plot between Himawari-8 and MODIS LST in daytime during winter for selected days.
Figure 14.
Same as Figure 13 except for the selected days.
Figure 14.
Same as Figure 13 except for the selected days.

Table 1.
Input conditions of RTM simulation according to impacting factors.
| Impacting Factors | Conditions |
|---|---|
| Atmospheric Profiles | 2818 SeeBor profiles (version 5) |
| (Viewing zenith angle < 50 °) | |
| Land Surface Temperature | Day: Ta − 2 K to Ta + 16 K (a step of 2 K) |
| Night: Ta − 6 K to Ta + 2 K (a step of 2 K) | |
| Air Temperature | Ta′ = Ta + (LST − Ta)/2 |
| Land Surface Emissivity | : 0.9478–0.9968 (a step of 0.0049) |
| −0.012 0.012 (a step of 0.004) | |
| If () > 1, = 0.9999 |
Table 2.
Coefficients of Himawari-8/AHI LST retrieval coefficients according to the conditions.
| Conditions | |||||||
|---|---|---|---|---|---|---|---|
| Day | Moist | 67.1857 | 0.7448 | 2.07 | 1.096 | 63.061 | −75.1606 |
| Normal | 8.926 | 0.9651 | 0.9364 | −0.1385 | 56.8638 | −63.8708 | |
| Dry | 15.3567 | 0.9461 | 1.1996 | −1.411 | 48.5137 | −68.3093 | |
| Night | Moist | 44.5826 | 0.8205 | 2.0427 | 1.6411 | 58.5399 | −59.1371 |
| Normal | 12.1778 | 0.9535 | 0.9278 | −0.095 | 51.2696 | −51.8349 | |
| Dry | 20.3004 | 0.9279 | 1.0879 | −1.4883 | 47.2503 | −61.7212 | |
Table 3.
Results of comparison between Himawari-8 LST data and MODIS LST products (collection 6) from September 2015 to August 2016.
Table 3.
Results of comparison between Himawari-8 LST data and MODIS LST products (collection 6) from September 2015 to August 2016.
| Month | Day | Night | Total (Day + Night) | |||||||||
|---|---|---|---|---|---|---|---|---|---|---|---|---|
| # of Scene | Corr. | Bias (K) | RMSE (K) | # of Scene | Corr. | Bias (K) | RMSE (K) | # of Scene | Corr. | Bias (K) | RMSE (K) | |
| Sep 2015 | 6 | 0.92 | 0.90 | 1.71 | 6 | 0.97 | −0.48 | 1.31 | 12 | 0.95 | 0.12 | 1.48 |
| Oct 2015 | 5 | 0.92 | 1.45 | 2.57 | 7 | 0.97 | 0.07 | 1.14 | 12 | 0.95 | 0.53 | 1.62 |
| Nov 2015 | 6 | 0.86 | 0.95 | 2.55 | 5 | 0.98 | 0.06 | 1.66 | 11 | 0.93 | 0.48 | 2.08 |
| Dec 2015 | 7 | 0.95 | 1.97 | 2.96 | 5 | 0.99 | 0.40 | 1.48 | 12 | 0.96 | 1.52 | 2.53 |
| Jan 2016 | 5 | 0.95 | 2.94 | 3.66 | 3 | 0.99 | −0.55 | 1.13 | 8 | 0.96 | 2.44 | 3.30 |
| Feb 2016 | 3 | 0.94 | 1.46 | 2.01 | 3 | 0.98 | 1.09 | 1.89 | 6 | 0.96 | 1.28 | 1.95 |
| Mar 2016 | 6 | 0.88 | 1.06 | 2.62 | 3 | 0.99 | 0.17 | 1.34 | 9 | 0.92 | 0.72 | 2.13 |
| Apr 2016 | 8 | 0.90 | 0.50 | 2.63 | 5 | 0.97 | 0.11 | 1.09 | 13 | 0.93 | 0.33 | 1.94 |
| May 2016 | 6 | 0.92 | −0.14 | 2.59 | 3 | 0.96 | −0.43 | 1.28 | 9 | 0.93 | −0.25 | 2.07 |
| Jun 2016 | 3 | 0.94 | −0.82 | 2.54 | 4 | 0.97 | −0.38 | 1.26 | 7 | 0.96 | −0.49 | 1.58 |
| Jul 2016 | 5 | 0.92 | −0.82 | 2.51 | 5 | 0.88 | −0.04 | 1.39 | 10 | 0.89 | −0.23 | 1.66 |
| Aug 2016 | 6 | 0.91 | −0.19 | 1.94 | 4 | 0.95 | −0.38 | 1.27 | 10 | 0.94 | −0.30 | 1.56 |
| Total day and Average | 66 | 0.92 | 0.92 | 2.54 | 53 | 0.96 | −0.01 | 1.34 | 119 | 0.94 | 0.45 | 1.93 |
© 2018 by the authors. Licensee MDPI, Basel, Switzerland. This article is an open access article distributed under the terms and conditions of the Creative Commons Attribution (CC BY) license (http://creativecommons.org/licenses/by/4.0/).
Share and Cite
MDPI and ACS Style
Choi, Y.-Y.; Suh, M.-S. Development of Himawari-8/Advanced Himawari Imager (AHI) Land Surface Temperature Retrieval Algorithm. Remote Sens. 2018, 10, 2013. https://doi.org/10.3390/rs10122013
AMA Style
Choi Y-Y, Suh M-S. Development of Himawari-8/Advanced Himawari Imager (AHI) Land Surface Temperature Retrieval Algorithm. Remote Sensing. 2018; 10(12):2013. https://doi.org/10.3390/rs10122013
Chicago/Turabian StyleChoi, Youn-Young, and Myoung-Seok Suh. 2018. "Development of Himawari-8/Advanced Himawari Imager (AHI) Land Surface Temperature Retrieval Algorithm" Remote Sensing 10, no. 12: 2013. https://doi.org/10.3390/rs10122013
Note that from the first issue of 2016, this journal uses article numbers instead of page numbers. See further details here.