An Overall Assessment of JPSS-2 VIIRS Radiometric Performance Based on Pre-Launch Testing
by

Hassan Oudrari
1,*, 
Jeff McIntire
1,
Xiaoxiong Xiong
2,
James Butler
2,
Qiang Ji
1,
Thomas Schwarting
1 and
Amit Angal
1 1
Science Systems and Applications, Inc., Lanham, MD 20706, USA
2
NASA Goddard Space Flight Center, Greenbelt, MD 20771, USA
*
Author to whom correspondence should be addressed.
Remote Sens. 2018, 10(12), 1921; https://doi.org/10.3390/rs10121921
Submission received: 4 October 2018
/
Revised: 24 November 2018
/
Accepted: 27 November 2018
/
Published: 30 November 2018
(This article belongs to the Collection Visible Infrared Imaging Radiometers and Applications)
Abstract
:The Visible Infrared Imaging Radiometer Suite (VIIRS) on-board the second Joint Polar Satellite System (JPSS) completed its sensor level testing in February 2018. The JPSS-2 (J2) mission is scheduled to launch in 2022 and will be very similar to its two predecessor missions, the Suomi National Polar-orbiting Partnership (SNPP) mission, launched on 28 October 2011 and JPSS-1 (renamed NOAA-20) launched on 18 November 2017. VIIRS instrument has 22 spectral bands covering the spectrum between 0.4 and 12.6 μm: 14 reflective solar bands (RSB), 7 thermal emissive bands (TEB) and one day-night band (DNB). It is a cross-track scanning radiometer capable of providing global measurements through observations at two spatial resolutions, 375 m and 750 m at nadir for the imaging bands and moderate bands, respectively. This paper will provide an overview of J2 VIIRS characterization methodologies and calibration performance during the pre-launch testing phases performed by the National Aeronautics and Space Administration (NASA) VIIRS Characterization Support Team (VCST) to evaluate the at-launch baseline radiometric performance and generate the parameters needed to populate the sensor data record (SDR) Look-Up-Tables (LUTs). Our analysis results confirmed the good performance of J2 VIIRS, in general as good as previous VIIRS instruments and all non-compliances are expected to have low impact on data quality. Key sensor performance metrics include the signal to noise ratio (SNR), radiance dynamic range, reflective and emissive bands calibration performance, polarization sensitivity, spectral performance, response versus scan-angle (RVS) and scattered light response. A set of performance metrics generated during the pre-launch testing program will be compared to both the SNPP and JPSS-1 VIIRS sensors.
1. Introduction
The Visible Infrared Imaging Radiometer Suite (VIIRS) instrument onboard the second Joint Polar Satellite System (JPSS-2 or J2) was built by Raytheon Space and Airborne Systems (SAS) (El Segundo, California) and has completed its sensor level testing to assess its radiometric, spectral and spatial performance.
This VIIRS instrument is the third flight unit of its series and its design is very similar to the previous missions, the Suomi-National Polar-Orbiting Partnership (SNPP) and JPSS-1 which were launched on 28 October 2011 and 18 November 2017, respectively. Both SNPP and JPSS-1 VIIRS have been collecting high quality remote sensing data [1,2,3,4] and have contributed not only to the continuity of the climate data record initiated by other spaceborne Earth observing instruments but have also supported many crucial environmental, economic and scientific applications [5,6,7,8]. In addition to J2, the JPSS program is expected to launch two more VIIRS instruments in the next decade, JPSS-3 (J3) and JPSS-4 (J4).
The main objectives of this paper are to describe key J2 VIIRS radiometric and spectral performances of interest to the large scientific community using VIIRS products. All of the calibration and characterization results are based on the data analysis accomplished by the NASA VIIRS Characterization Support Team (VCST), working closely with other teams, including government, academia and sensor vendor teams. Our assessments will provide a concise and clear overview of the J2 VIIRS radiometric and spectral performance based on pre-launch testing, with a very brief description of the methodologies adopted to generate these assessments. Comparison to previous instruments is an area of high interest, shedding light on areas that have major performance differences (i.e., sensor anomalies), as well as presenting the magnitude of the expected impact and adopted mitigation approaches.
J2 VIIRS design and testing program will be presented in Section 2. The summary of VIIRS pre-launch testing and sensor performance will be presented in Section 3 for all the reflective solar bands (RSB) and thermal emissive bands (TEB), focusing on key performance metrics such as the signal-to-noise (SNR), dynamic range, polarization sensitivity, relative spectral response (RSR) and scattered light contamination which will be addressed as stray light and near field response (NFR). A summary and conclusion of J2 VIIRS pre-launch radiometric and spectral performance as well as future performance enhancements will be presented in the last section, Section 4.
2. J2 VIIRS Sensor Design and Testing Program
The VIIRS sensor is a scanning radiometer designed to study Earth surface and atmospheric variables as well as imagery and provides moderate-resolution, radiometrically accurate images of the globe daily: once in a day-mode for all VIIRS bands and once in night-mode for twelve bands (M7, M8, M10–M16, I4–I5 and DNB).
2.1. Sensor Design and Improvements
The VIIRS sensor was designed to collect radiometric and imaging data in twenty two (22) spectral bands covering the visible and infrared spectral region between 0.4 to 12.6 μm (Table 1). These spectral bands are distributed on three (3) focal plane assemblies (FPAs): the visible near-infrared (VisNIR) having bands M1–M7 and I1–I2, the short-mid wave infrared (SMWIR) having bands M8–M13 and I3–I4 and the longwave infrared (LWIR) having bands M14–M16 and I5. The DNB is located on a separate focal plane based on CCD technology.
The VIIRS operates in a polar, sun-synchronous orbit with a nominal altitude of 828 km at an inclination angle of approximately 98 degrees relative to the equator (1:30 PM local equatorial crossing time, ascending node) [9,10]. The moderate resolution bands (M-bands) and imaging resolution bands (I-bands) have a spatial resolution at nadir of ~750 m and ~375 m respectively, while the ground swath is ~3040 km. Each M-band and I-band has 16 and 32 detectors respectively, aligned parallel to the direction of spacecraft motion to image the Earth with footprints adjacent to each other.
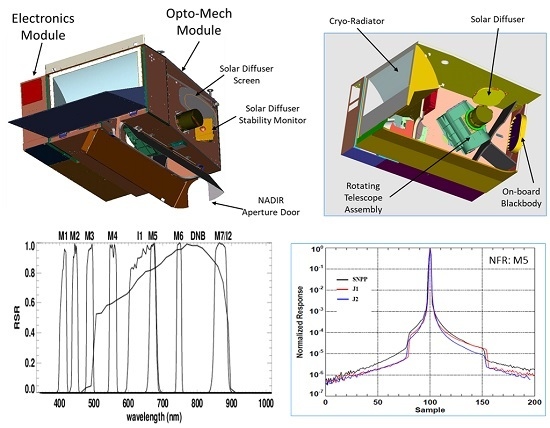
Currently there are three VIIRS flight units with nearly identical designs. SNPP and J1 VIIRS sensors are operating on-orbit, while J2 VIIRS has just completed its sensor level testing. All VIIRS instruments have similar on-board calibrators [10]: a Spectralon® solar diffuser (SD) to calibrate the RSB, a solar diffuser stability monitor (SDSM) to track the SD spectral degradation, a V-groove blackbody (BB) to calibrate the TEB and a space view (SV) to be used for background subtraction (Figure 1).
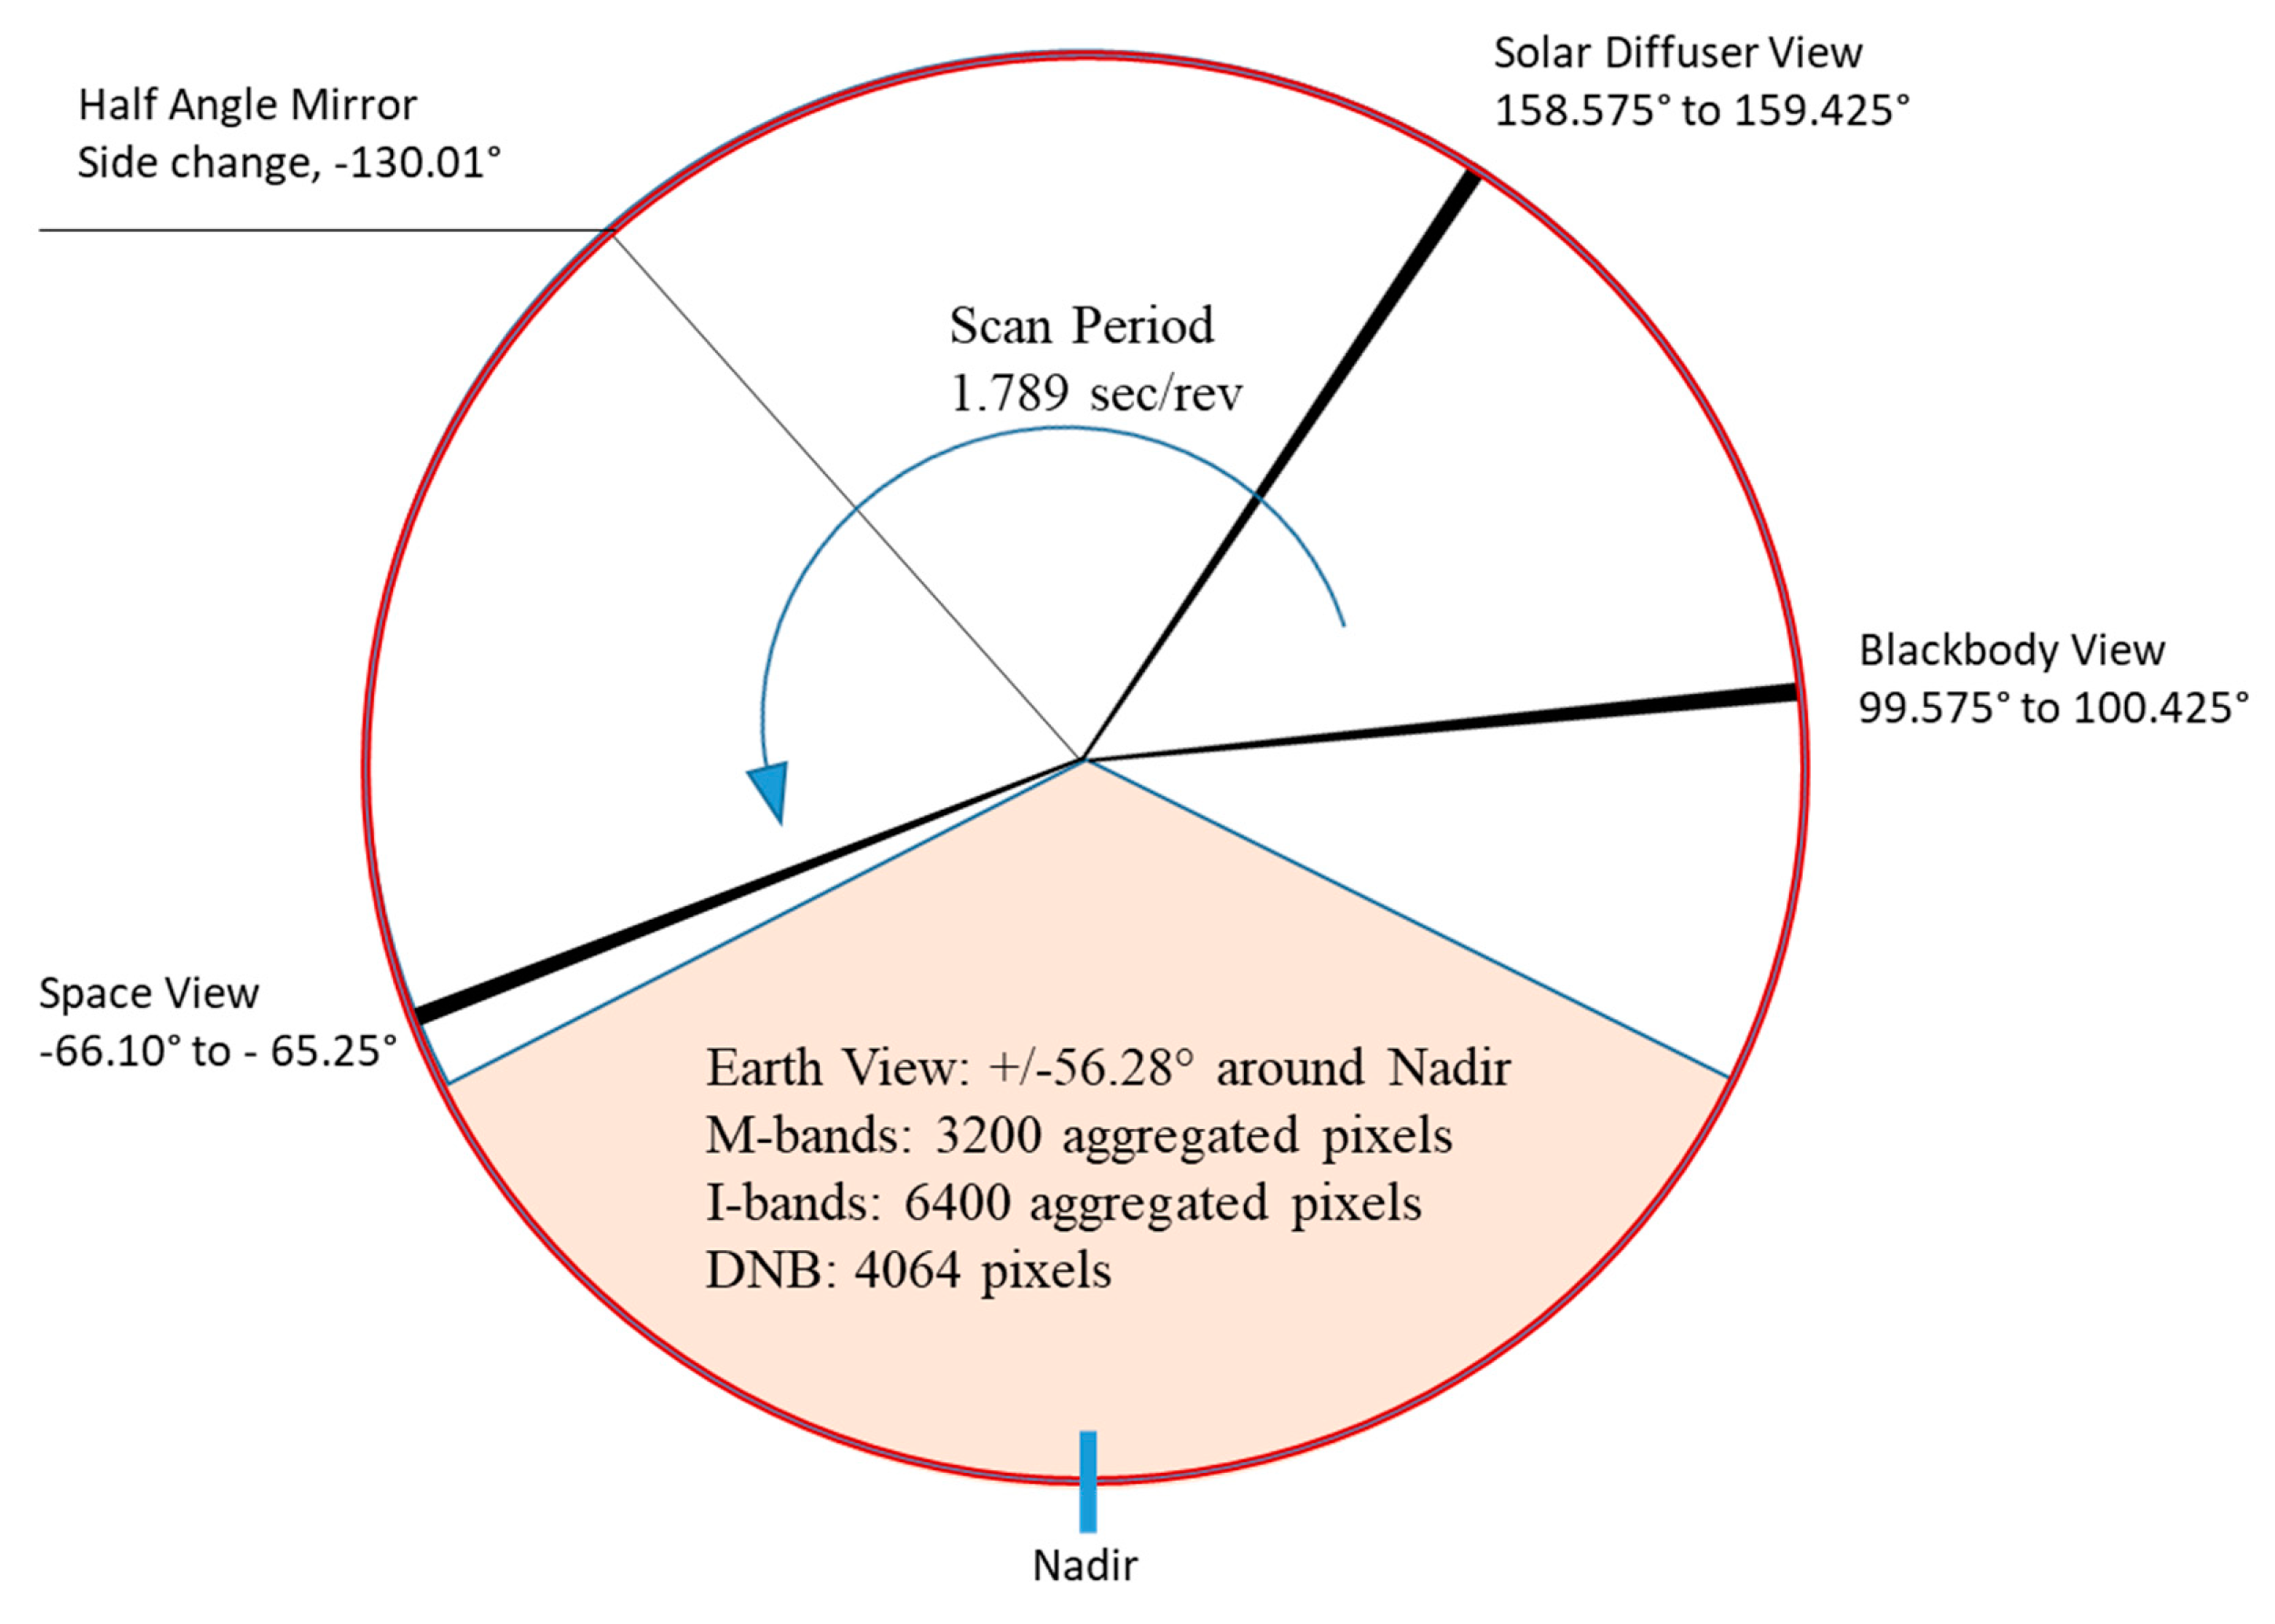
Figure 2 describes the four viewing sectors from a full VIIRS scanning rotation (~1.78 s), starting with the Earth View, then the 3 calibration views when looking at the on-board calibrators: the blackbody, the solar diffuser and the space view. The graph shows also the angle where the HAM changes side since it rotates at half the speed of the telescope and this angle position is located between the SD and the SV. During on-orbit operations, VIIRS TEB calibration is performed per scan while the RSB calibration is performed once per orbit over the south-pole when the SD is fully illuminated by the Sun. The SV position is the area where the rotating telescope assembly (RTA) is looking at deep-space to collect dark offset values for each scan.
2.2. Sensor Testing Program and Improvements
a. Sensor Testing Description:
Similar to the previous VIIRS sensors, J2 VIIRS went through a comprehensive and intensive testing program to characterize all key areas in support of the sensor data records (SDRs) and environmental data records (EDRs) quality. The testing was performed in two major phases: Ambient (April–August 2016) and Thermal Vacuum (June to October 2017) phases, generating a large set of calibration and characterization data in quasi flight-like conditions to understand the instrument performance, verify compliance with performance requirements and to populate the look-up-tables for on-orbit calibration and operation. Lessons-learned from the testing of the previous two flight units were implemented to enhance efficiency of the testing program, while generating all necessary performance data for each band, detector, gain stage, half angle mirror (HAM) side, electronic side and instrument temperature.
All J2 VIIRS baseline testing was completed successfully without any major issue. In the ambient environment, key performance data collected included polarization, response versus scan-angle, relative spectral response (VisNIR bands and DNB), stray light contamination and near field response, while key performances in Thermal Vacuum (TV) environment cover RSB and TEB calibration, radiometric stability, gain transition, relative spectral response (bands on the two cold focal planes, SMWIR and LWIR). Spatial performance measurements were also assessed in ambient and TV but these performances will be presented in a separate paper.
Measurements collected during TV testing at three (3) temperature plateaus (instrument temperature), cold, nominal and hot, cover a large range of on-orbit conditions and will be extensively used in numerous areas, such as the sensor requirements verification, the generation of on-orbit calibration LUTs used by the SDR algorithm, the tuning of various modules that constitute the sensor model and the investigation of anomalies discovered during the performance testing that were expected to affect instrument performance once on-orbit.
Two decisions were made upfront as soon as there were enough and consistent measurements to ensure better understanding of the sensor radiometry. The first decision was to set electronics side A as the primary electronics, even though both sides revealed quit similar performance. The second decision was to set the cold focal plane operating temperature set point. Special testing was completed to confirm that the cold FPA (CFPA) temperature of 82 K will be sufficient to ensure a proper cryo-cooler margin at the end of life. These decisions will define how the instrument will be operated on-orbit and therefore drove the sensor TV testing procedures and configurations.
b. Sensor Improvements:
While designing an instrument strict engineering processes are followed to ensure high quality performance on-orbit. However, it is very common in the space industry to face unexpected marginal performances or even issues that could hamper the data quality. In the case of VIIRS series, SNPP, J1 and J2, while no severe issues were encountered, multiple areas where modifications were necessary to enhance instrument performance were identified. In some cases, the lower than expected performance was due to component manufacturing issues but in some other cases the design was modified to achieve the desired quality.
The VIIRS sensor improvements started from SNPP VIIRS and continued to J1 and J2 sensors, each time learning from the issues and anomalies identified from previous sensors. The list of key issues and sensor changes made to reduce or eliminate these identified performance shortcomings are described in Table 2. Only those items bearing a major impact on the sensor performance are shown in the table.
3. J2 VIIRS Pre-Launch Performance
A brief description of J2 performance testing and assessment will be presented in this section as performed by the VCST, focusing on the radiometric and spectral testing. Most of J1 performance assessments will be compared to the sensor requirements and to previous VIIRS sensors, SNPP and/or J1. A short overview of the data analysis methodologies will be presented for key performance metrics, which are very similar among all three sensors.
Because of the huge amount of test data collected during J2 VIIRS testing, we have limited our analysis by focusing on a few key performance metrics, including the radiometric calibration (RSB and TEB), dynamic range, SNR, noise equivalent temperature difference (NEdT), polarization sensitivity, RSR, RVS, NFR and scattered light. Most of the calibration performances derived from TV testing are from nominal temperature plateau, which is the closest to the expected on-orbit conditions.
3.1. RSB Radiometric Calibration
The reflective solar bands calibration was performed at three instrument temperatures and for each gain stage, detector, HAM side and electronic side. Two reference light sources were used in this testing, the 100-cm diameter spherical integrating source (SIS100) and the three mirror collimator (TMC) SIS (very bright source), to calibrate all RSB. Only the SIS100 is traceable to the National Institute of Standards and Technology (NIST) and has a radiance monitor to correct for signal fluctuations and drifts. SIS100 measurements are used to cross-calibrate the TMC SIS over the radiance region of overlap between the two sources. The TMC SIS is used only for M1–M3 low gain (LG) as the SIS100 is not bright enough to cover the full dynamic range of these bands. In addition, the space view source (SVS) was used to collect the dark offset needed to generate the background corrected detector response or digital number (dn) as:
where c0, c1 and c2 are the calibration coefficients.
L = c0 + c1·dn + c2·dn2
Instead of fitting to Equation (1) directly, the attenuator approach previously described in Reference [9] was used to mitigate the impact of the source instability on VIIRS calibration accuracy. The radiance measurements were performed with and without an attenuator screen inserted into the optical path. The attenuator screen is an opaque plate with small holes to allow a fraction of light through (transmittance of ~56%). The time between attenuator in and out is very short to minimize the effect of source instability on the measurements.
Consequently, the ratio of the detected spectral radiances with and without the attenuator is equal to the attenuator transmittance (τ), as:
where dnin and dnout denote the dn with and without the attenuator, respectively. A 3-sigma outlier rejection criteria is used during the calculation.
To facilitate the data regression, Equation (2) is rewritten as:
where and
The model parameters τ, and are determined through a non-linear least-square process and the linear coefficient or gain is determined by inverting Equation (1) and averaging over the selected source levels:
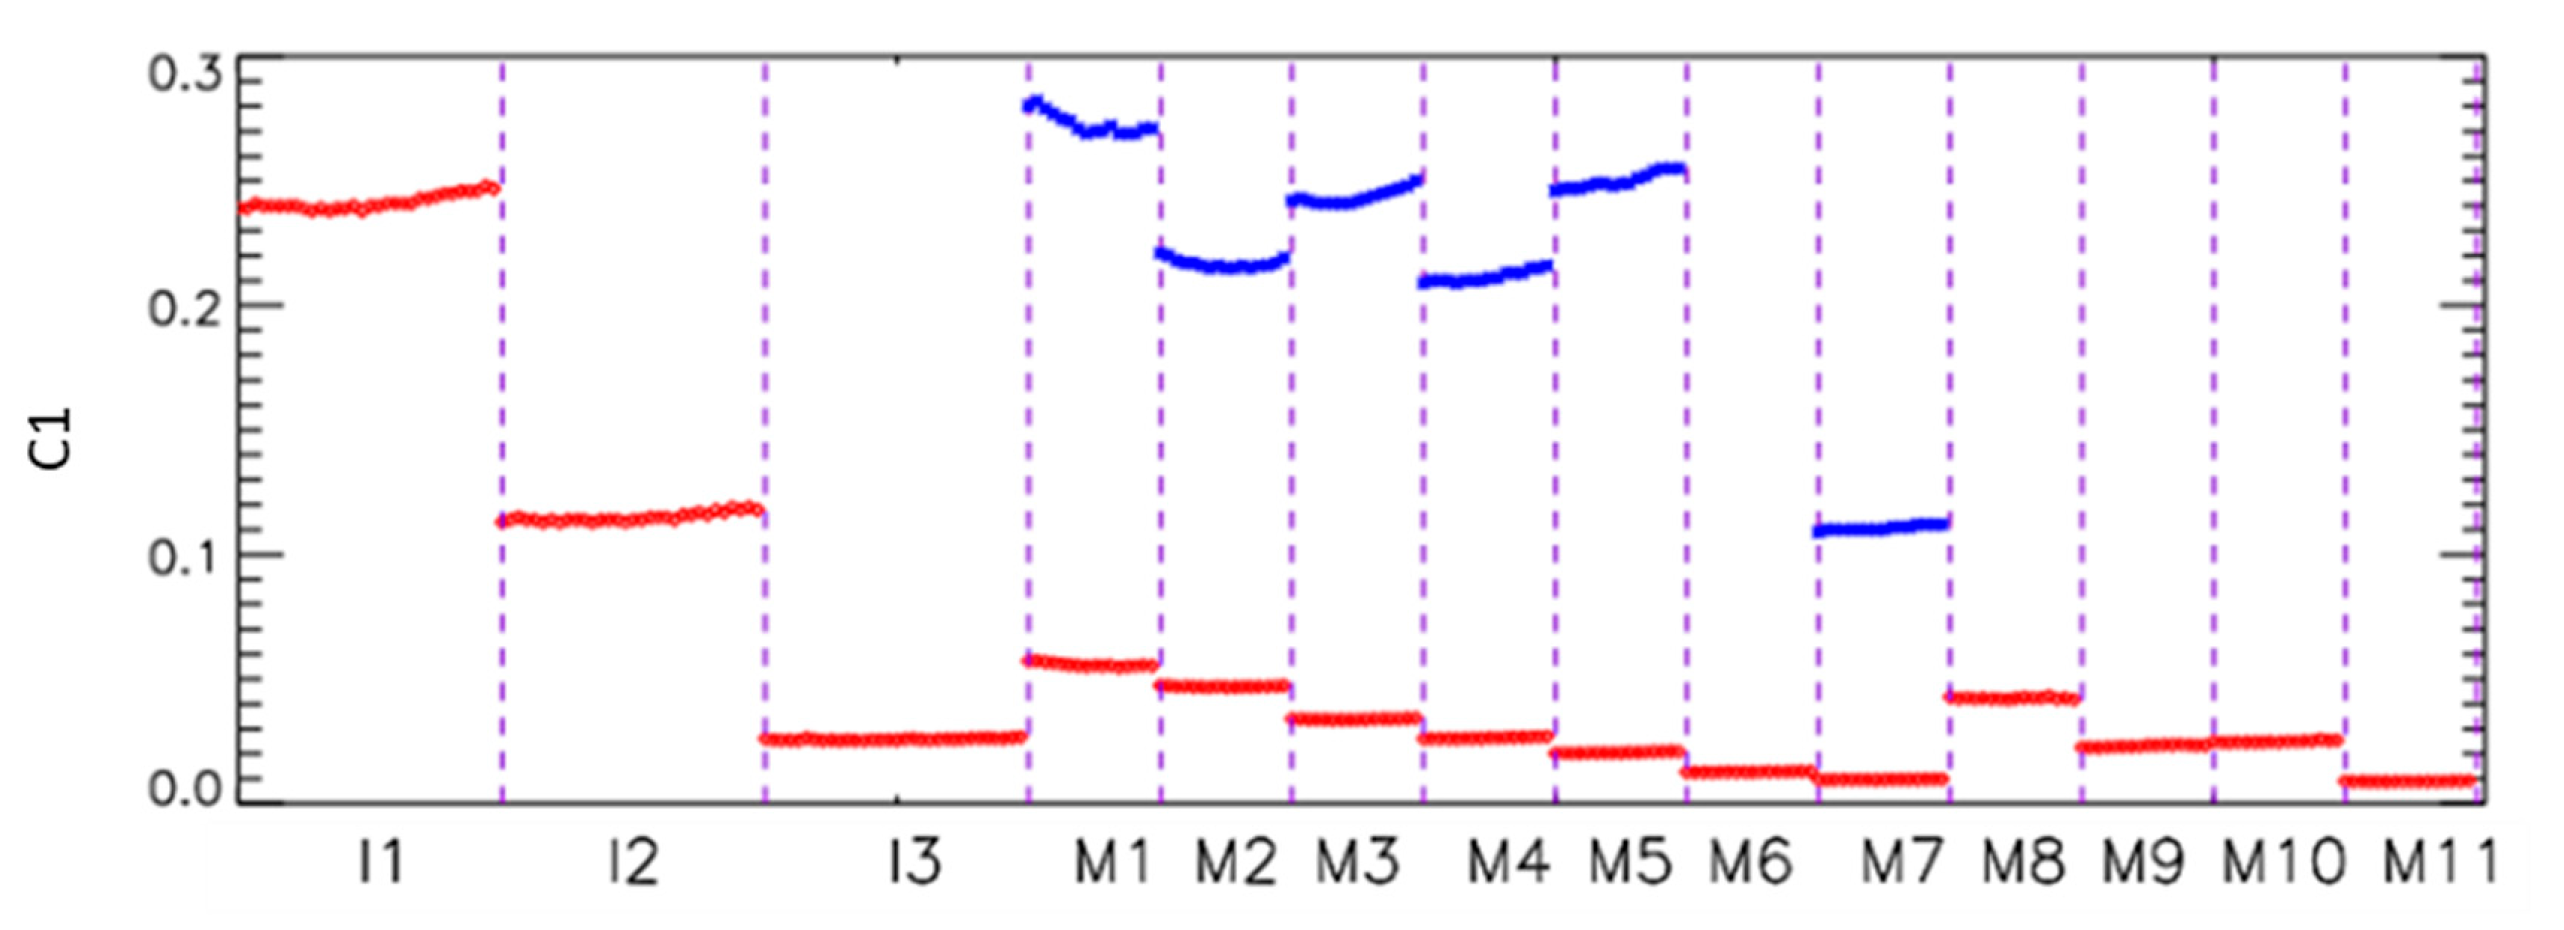
The RSB radiometric calibration coefficients are derived in TV at the cold, nominal and hot temperature plateaus for each detector, HAM side, gain stage and electronic side and will be implemented into the SDR LUTs to support on-orbit calibration [11].
Figure 3 shows the detector based calibration coefficients, c1, c0/c1 and c2/c1, at Nominal temperature plateau. Similar to J1 and SNPP VIIRS RSB calibration, the c0/c1 coefficient is very small and is on the order of 10−1, except for M3 band where it varies between 2 and −4. This M3 behavior is associated with the uncertainties from TMC calibration. The c2/c1 coefficients are also very small for all bands and gain stages, reflecting excellent linearity of the VIIRS radiometric response, in general on the order of 10−6. Few bands, M2, M3 and M7 are showing slightly large detector-to-detector c2/c1 variability but this is expected to have small effect on the calibration performance.
a. SNR Calculation and Performance
The detector SNR was calculated for each SIS100 radiance level by dividing the sample averaged dn over scans by the standard deviation as:
where M, N are the total number of samples and scans respectively. This approach was more accurate than the one based on scan averaging because of the large SIS-100 spatial non-uniformity in the scan direction.
To facilitate the computation of the SNR at any radiance level and to smooth out the variability in the SNR over radiance levels, the SNR is fit to the following mathematical form:
where ki are the fitting coefficients. This equation is used to derive the SNR at any radiance and verify requirement compliance at Ltyp.
As expected, all J2 VIIRS RSB are compliant with SNR requirements at Ltyp with very good margins as shown in Table 3, with M5 showing the smallest margin (51%) and I3 the largest margin (2867%). The comparison between the three VIIRS instruments shows very similar performance for all RSB. The per-detector analysis did not show any out of family or noisy detectors, unlike J1 which has one very noisy detector, I3 detector 4 that required a special mitigation plan to eliminate associated striping observed in I3 imagery. It is also important to state that SNR requirement for M11 has changed, from 10 (at Ltyp = 0.12) for SNPP VIIRS to 90 (at Ltyp = 1) for both J1 and J2 VIIRS.
b. Dynamic Range
J2 VIIRS radiometric dynamic range was verified to ensure compliance with sensor requirements. These results are shown in Table 4, as well as a comparison to J1 and SNPP performance. It is clear that all bands have achieved compliance with good margins. Band M8 was not compliant for both previous instruments but is now compliant for J2 with a very small margin (~1%). The highest margin is shown for M5, at about 40%. It is worth noting that since SNPP suffered from the RTA mirror coating degradation on-orbit [12], therefore decreasing the radiometric sensitivity for some bands from their pre-launch measurements. SNPP bands in the near infrared and short-wave infrared saw a large increase in their dynamic range during the first year after SNPP launch. This variation in the sensor sensitivity allowed SNPP M8 and I3 dynamic range to become compliant shortly after launch. The mirror coating degradation issue was eliminated for both J1 and J2 VIIRS sensors; hence, the dynamic range was quite stable since J1 mission launch and it is expected to be very stable for J2 VIIRS as well. For the dual gain bands, the high gain Lsat shown in Table 4 represents the radiance transition (Ltrans) from high gain to low gain. The requirement for Ltrans is to be within +50% above high gain Lmax for bands M1–M5 and M7. As shown in Table 4, all dual gain bands are compliant with this requirement, with margin values between 7% (M3) and 36% (M1).
c. RSB Calibration Uncertainties
The top level requirement for VIIRS RSB is to limit the absolute radiometric calibration uncertainty to 2% of the reflectance when viewing a uniform scene at Ltyp. This uncertainty analysis was completed based on contributors which have been constrained by sensor-level requirements while others are based on the sensor vendor allocations. A process was developed to combine all uncertainty estimates has shown that the spectral reflectance accuracy (2%) was met for all RSB except M1 (2.40%) [13], primarily due to the on-orbit calibration uncertainty introduced by the SDSM filter red leak. This M1 non-compliance is expected to vary on-orbit because of the SD’s degradation. However, the monthly lunar calibrations planned post-launch provide a reliable validation therefore mitigating the uncertainties associated with the SDSM. [14]
While it is important to describe how the reflective bands are calibrated pre-launch and post-launch to fully understand the VIIRS calibration performance, this paper is solely focused on pre-launch performance and we will summarize the radiometric uncertainty of J2 VIIRS sensor against three key radiometric specifications: (1) the radiometric response uniformity, (2) the characterization uncertainty and (3) the radiometric stability.
(1) Radiometric Response Uniformity
The radiometric response uniformity (RRU) assesses the ability of the sensor calibration to eliminate detector-to-detector stripping in the Earth scene imagery. The detector RRU requirement is defined as follows:
where d is the detector in the band, is the detector radiance and is the band-averaged radiance. RRU is derived for each source radiance level for all RSB and is required to be less than unity between Lmin and 0.9 Lmax.
RRU derived from J2 TV testing was observed to be generally consistent over the whole dynamic range for most cases. J2 RRU derived at Ltyp was seen to comply with the specification (<1). However, many non-compliances were observed as we go further away from the calibration tie-point (on-orbit SD radiance). While the source non-uniformity could be a major contributor to these RRU non-compliances, it is important to know that both previous VIIRS sensors, SNPP and J1, had comparable RRU limitations, at either ends of the dynamic range. It is also important to indicate that since this requirement is relative to a very small value of NEdL (excellent noise performance), there was a general agreement to set these non-compliances at low risk for the on-orbit data products.
(2) Radiometric Characterization Uncertainty
Another key performance metric contributing to the radiometric uncertainty is the detector response characterization uncertainty (RCU), which is based on the fitting residual between the true and the estimated radiance (i.e., goodness of the fit) within a dynamic range [Lmin, Lmax] and specified to be less than 0.3%. Results indicate that compliance with this requirement was extremely challenging for all VIIRS RSB over the dynamic range, quite consistent with RSB performance from the previous two VIIRS instruments on SNPP and J1. Similar to RRU, these non-compliances are considered low risk and occur mainly at low and very high radiances.
(3) Radiance Stability
The VIIRS RSB are calibrated on-orbit using SD views once per orbit and it is known that the instrument temperature varies over the orbit when the instrument goes through the day and night sides of the Earth. It is therefore important to characterize the system’s response as a function of the temperature, time and voltage and to verify if the instrument complies with stability requirement of 0.3% over 90 min (one orbit). The stability testing is performed during the transition between the three temperature plateaus (thermal stability), at each plateau (temporal stability) and during sensitivity testing with respect to a typical BUS voltage profile (voltage stability).
For these tests, the SIS-100 is used at a single radiance level, four (4) 200 W lamps and a drift-corrected radiance is used to derive the instrument gain which was monitored throughout the duration of the test. In the case of the VisNIR bands, the response change is correlated with the VisNIR FPA temperature and in the case of Short Wave Infrared (SWIR) bands it is correlated with the Opto-Mechanical Module (OMM) temperature.
The stability analysis results from all temperature plateaus and transitions have shown excellent J2 VIIRS stability performance as a function of temperature, time and voltage (much smaller than 0.3%) and very similar to SNPP and J1 sensors. Typically, the VIIRS temperature varies by only 2 to 3 degrees Kelvin within one orbit and hence the stability criterion is expected to be met with very large margins if the instrument performs as expected on orbit. These measurements will be used to derive the temperature-dependent coefficients needed in the on-orbit operational processing.
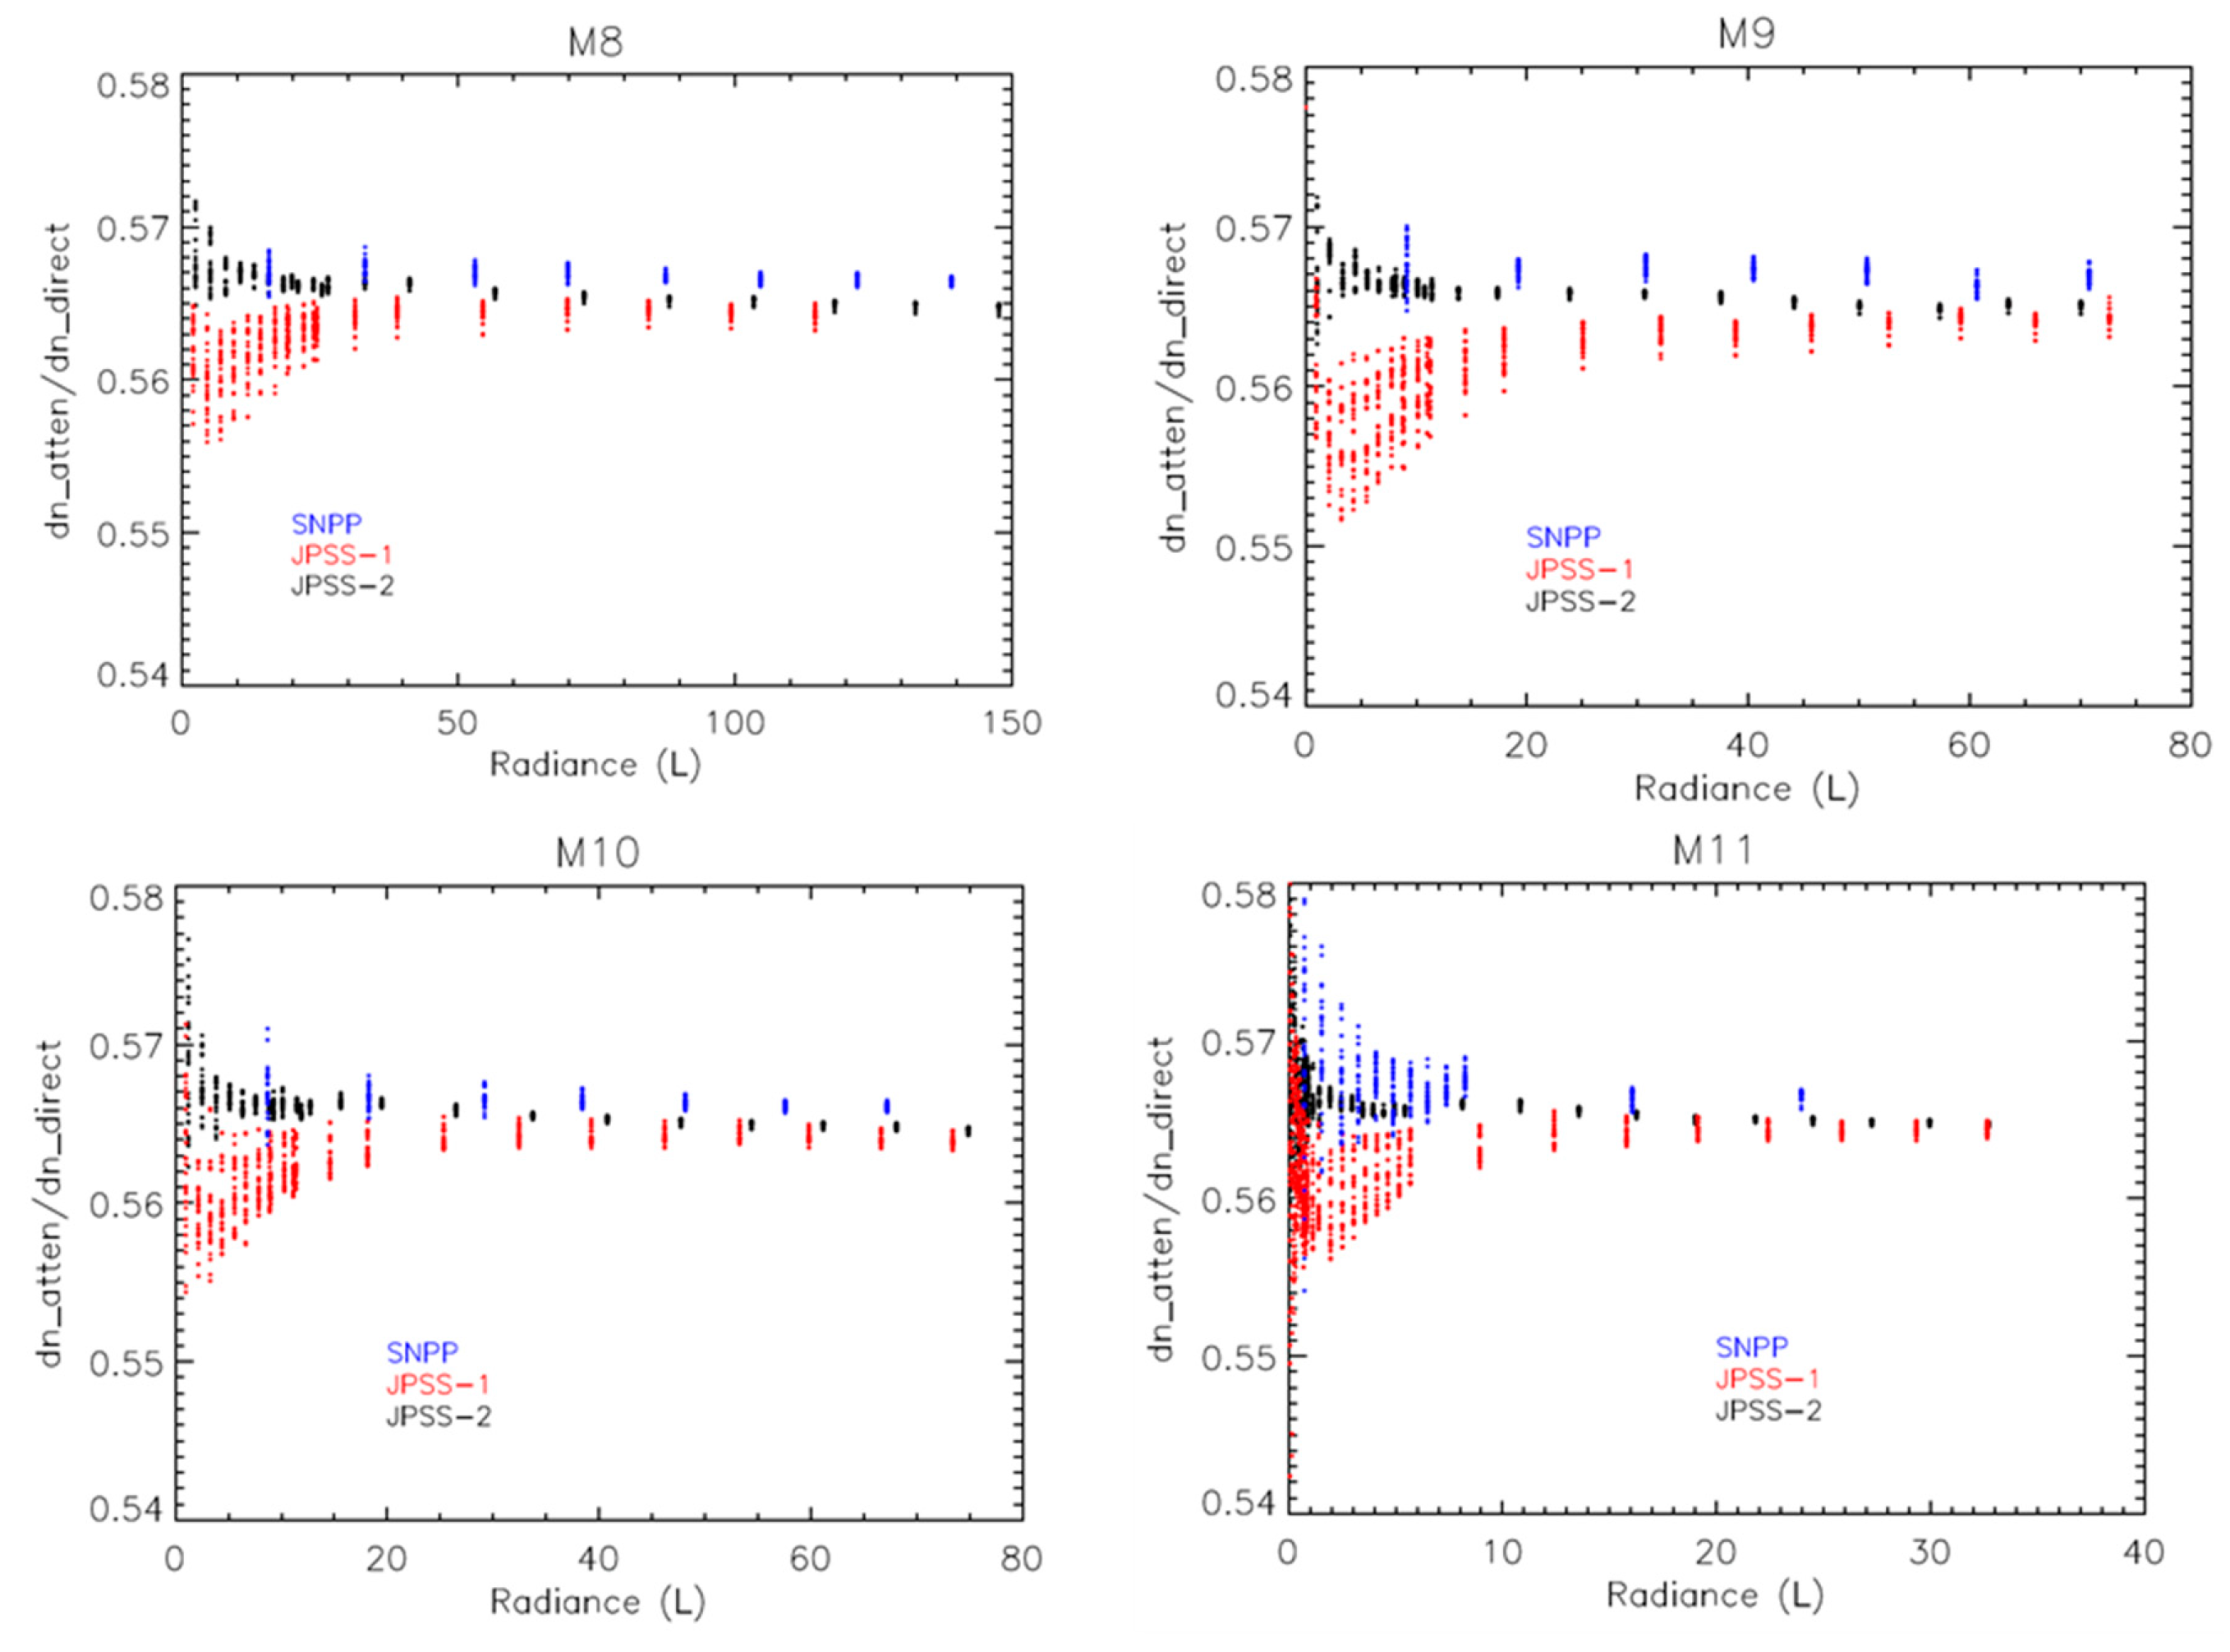
d. SWIR Linearity at low radiance
While SNPP SWIR had as expected radiometric linearity at low radiance values, J1 did show much higher non-linearity that was a concern during the pre-launch testing. The issue was investigated and the root-cause was identified in one of the electronics voltages. Since it was too late in the testing program to fix it in J1 VIIRS, a mitigation approach was developed based on a third order polynomial equation, which was implemented and used successfully in the J1 on-orbit operational calibration processing. A hardware fix was implemented for J2 SWIR bands and special attention was paid during TV testing to verify that this resolution had eliminated the non-linearity issue as shown in Figure 4, where the J2 SWIR (M8–M11) ratio between attenuator in (dn_atten) and out (dn_direct) shows much smaller non-linearity at low radiances compared to J1 and SNPP.
e. DNB Spatial Performance and Linearity Issue
J1 VIIRS data analysis showed a larger than expected non-linear response at low radiances values for the DNB high gain A and B (HGA, HGB) aggregation modes 21 to 32 (edge of scan). The mid-gain stage also showed non-linearity features but to a much lower extent. This DNB non-linearity issue was caused by two incorrect biases set in the focal plane interface electronics and were both corrected in the J2 VIIRS sensor.
Figure 5 shows the DNB response (dn) for HGB in aggregation mode 32 (most affected) and also provides a good representation of the non-linearity improvement for J2 compared to J1 DNB. Similar improvement was also observed for all other aggregation modes. SNPP DNB has similar non-linearity performance as J2 DNB, therefore it is not shown in Figure 5.
While J1 had to implement a mitigation approach on-orbit to remove the impact of DNB non-linearity at the expense of spatial resolution (Option 21) [15], J2 DNB will continue to use its baseline calibration on-orbit (high spatial resolution for aggregation modes) and is expected to generate high quality DNB data products.
3.2. Thermal Emissive Bands (TEB) Calibration
In total, four (4) blackbody sources were used during pre-launch radiometric testing. VIIRS thermal band calibration is referenced to the blackbody calibration source (BCS), a NIST traceable source, with an uncertainty less than 0.06 K at 10 μm and 300 K. Since the BCS maximum temperature is 345 K and this temperature range was inadequate to calibrate M13 low gain, an additional high temperature blackbody, the three mirror collimator (TMC) blackbody was used outside of the TV chamber, with a maximum temperature of about 763 K. In addition, a cold BB source (controlled at ~90 K) was used to simulate the deep space view (used for background subtraction) and was located inside the thermal vacuum chamber. The fourth blackbody source was the OBC, located in the VIIRS instrument and described in Section 2.
The radiometric testing for the thermal bands can be divided into two parts: performance and stability. For the performance testing, the sources (either internal or external) were cycled through a series of discrete temperature levels; for stability testing, the source temperatures remained fixed while the instrument conditions were varied. The performance tests were used to determine the calibration coefficients relating the detector response to the radiance and to derive a number of performance metrics, such as the NEdT, the absolute radiometric difference (ARD), the radiometric characterization uncertainty and the radiometric response uniformity. The BCS and TMC were cycled through their respective temperature ranges, while the OBC was fixed at 292 K.
It is important to note that, due to a cryo-cooler margin concern, J2’s CFPA baseline temperature was set to 82 K, while J1 and SNPP CFPA temperature is 80.5 K and 80 K respectively. Besides the baseline testing performed with the CFPA at 82 K, there were additional special and limited tests in which the BB temperature was cycled at a lower CFPA temperature, 78 K and 80 K, to better characterize its impact on the TEB calibration and performance.
The instrument stability was tested as a function of time (at each plateau), temperature (during transitions between plateaus) and with respect to a typical BUS voltage profile (variation over one orbit).
The radiance reaching the detector is the sum of the source radiance and contributors along the optical path (i.e., the RTA, HAM and aft optics). The path difference radiance between the two sources (BCS and SV) is calculated as:
The reflectance factors represent the total reflectance of the RTA mirrors. The RVS is the scan-angle dependent relative reflectance of the HAM. The temperature of each source is determined from one or more thermistors and the radiances of the sources are determined via Planck’s law convolved over the actual VIIRS RSR of each spectral band over the extended band-pass.
The path difference radiance is modeled as a quadratic polynomial in the offset corrected digital response, or
The retrieved Earth View (EV) radiance for the BCS is determined by inverting Equation (7), or
The TEB radiometric calibration coefficients were determined for all detectors, HAM sides, electronics sides and temperature plateaus [16]. This analysis has shown TEB performing as expected, with radiometric fitting dominated by the linear term (gain), while both offset and non-linear term are very small, on the order of 10−1 and less than 10−7 respectively.
a. NEdT performance
The radiometric sensitivity was determined by fitting the SNR to the path difference source radiance and is computed via the equation below:
The derivative is of Planck’s equation with respect to the source temperature. The NEdT was determined at all source levels and the value at Ttyp was determined by fitting the SNR as a function of path difference radiance. As shown in Table 5, at nominal plateau, all TEB band averaged NEdTs meet the specification with good margins. Similar performance was observed for all detectors within a band, while data from three temperature plateaus has shown a small dependence of NEdT to sensor temperature. Overall, J2 TEB performance is in general comparable to J1 and SNPP. The smallest and greatest NEdT margins were observed for M14 (84%) and I4 (676%) respectively. Detector noise variability is very small for all bands, unlike the other previous instruments where a few out-of-family detectors were observed, such as M12 detector 1 for SNPP; and M15 detector 4 and M16B detector 5 for J1.
b. Dynamic Range
Table 5 shows the J2 maximum temperature derived at nominal plateau and comparison to the specification and previous VIIRS sensors, J1 and SNPP. All bands have saturation values above the specified Lmax and comparable to J1 and SNPP. For J2 and J1, digital saturation occurred first for all bands, while for SNPP two bands, M12 and I4, exhibit analog saturation before digital saturation. While M13 low gain saturation was not observed in TV testing (due to source limitations), the data from ambient testing has shown saturation for this band to be about 652 K, 670 K and 654 K, for J2, J1 and SNPP VIIRS respectively. On-orbit M13 LG is expected to saturate within a couple of degrees of the ambient-derived saturation values. The overall analysis of thermal data collected in TV are showing J2 TEB saturation values are consistent over electronics sides and temperature plateaus and the variation range is limited to within 3 K.
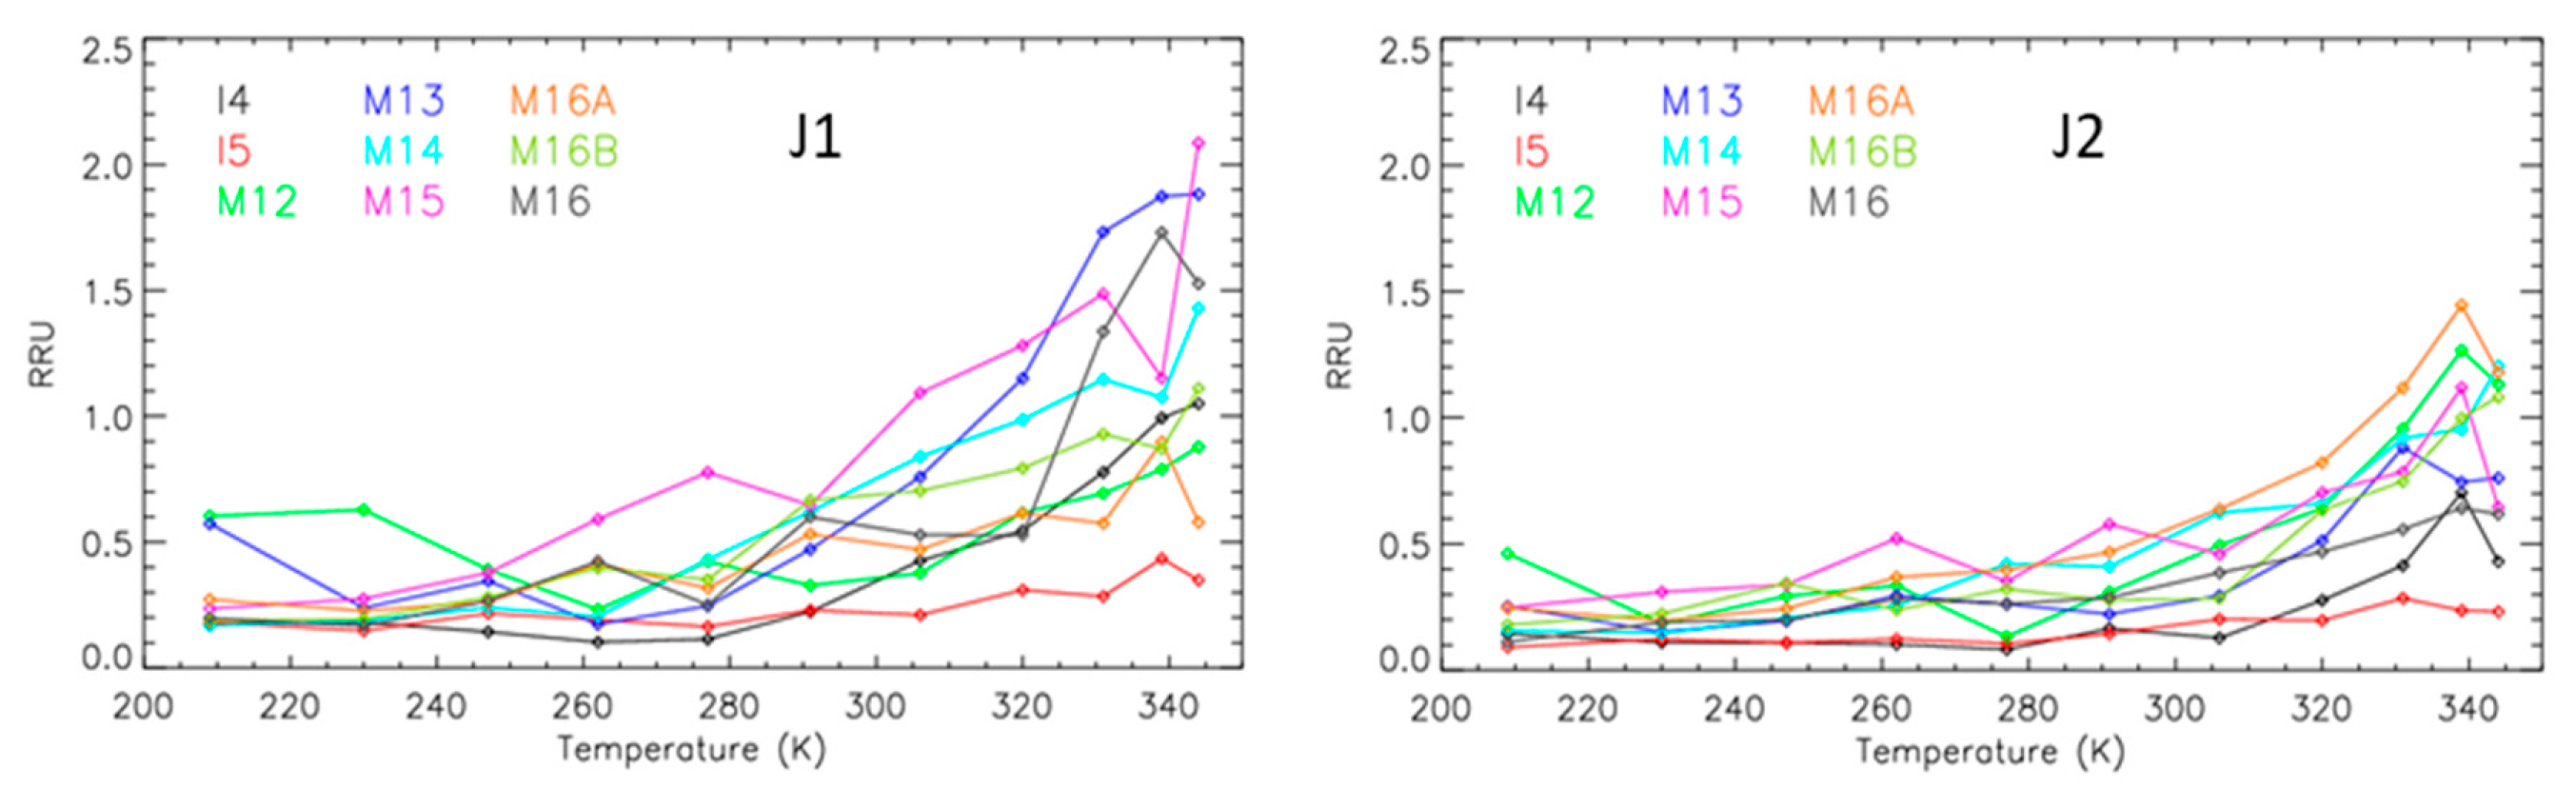
c. Radiometric Response Uniformity (striping)
Similar to RSB, the RRU represents the detector-to-detector uniformity (or striping) and is quantified by the following equation:
where the average EV retrieved radiance, is over all detectors in a band and NEdL is derived from Equation (10). The sensor specification is met if the RRU is less than unity within the radiance range from Lmin to 0.9 Lmax.
Figure 6 shows the detector-to-detector striping performance represented by the RRU metric as a function of scene temperature for all emissive bands. We can easily see that the risk of striping increases with temperature for all TEB bands, because the deviation of the detector retrieved radiance from the band average increases with temperature while the NEdL levels off. Results derived per HAM side, electronics side and temperature plateau have shown some performance variations, with RRU for some bands reaching up to 1.5 at highest temperatures (larger than 320 K). We should also emphasize the difficulty to meet this requirement for both J1 and SNPP since VIIRS TEB have a very good noise performance (stringent requirement).
d. Absolute Radiometric Difference (Uncertainty)
One approach to assess TEB calibration uncertainty is called the absolute radiance difference (ARD), which is the percent difference between the retrieved radiance (through the calibration algorithm) and the BCS radiance (true radiance), formulated as:
The band averaged ARD for J2 TEB derived at nominal plateau are shown in Table 6. As expected, the ARD results show excellent performance for all TEB, meeting specification with quite good margins under all conditions. Table 6 also shows the temperature errors associated with the ARD values. These temperature errors represent a good reference for science community providing products based on the temperature measurement generated through VIIRS calibration algorithm. Overall, J2 ARD and temperature error estimates are showing full compliance and in general TEB performance is similar to or better than J1 and SNPP.
3.3. Other Performance Characterization
J2 VIIRS testing program included intensive testing in ambient and TV to characterize the instrument and provide valuable inputs needed to build and validate a sensor model which make it possible to understand and simulate VIIRS sensor performance under various conditions and to support the investigation of anomalies and issues. Some of these key metrics that are important include the sensor polarization sensitivity, relative spectral response, response versus scan-angle, near field response and stray light contamination.
a. Polarization Sensitivity
J2 VIIRS polarization sensitivity was characterized in ambient using an integrating sphere combined with a sheet polarizer at eleven different scan angles in the 400 to 900 nm range covering all VisNIR bands (M1–M7, I1–I2) [17]. The sheet polarizer was mounted on a rotary stage and was rotated in 15 degree increments from 0 to 360 degrees. Additionally, a long wavelength spectral blocking filter was placed in the optical path during the M1–M3 testing to eliminate near infrared out-of-band (OOB) contributions. Using a Fourier series, the polarization sensitivity was derived for all VisNIR bands, detectors, HAM sides and eleven scan angles (−55, −45, −37, −30, −20, −15, −8, 4, 22, 45, 55). Only the zeroth and second order terms derived from the Fourier transform have non-negligible values, which is an indication of the high quality polarization measurements.
J2 VIIRS polarization sensitivity factors have revealed that all bands are meeting specification except band M1, showing sensitivity of up to 4.83%, larger than the specification of 3%, while J1 VIIRS had four bands showing non-compliance, M1–M4 and SNPP showed all bands compliant with polarization requirements (Figure 7). The sensor vendor did an extensive investigation and found based on the polarization modeling that the main drivers are the HAM, a dichroic beam splitter and the filter bandpass [18,19]. In the case of J1, the polarization issues were linked to the spectral filter redesign (the redesign was requested to reduce optical crosstalk observed in SNPP), while the J2 polarization issue is linked to the Dichroic #1 (build-to-build variation) [20].
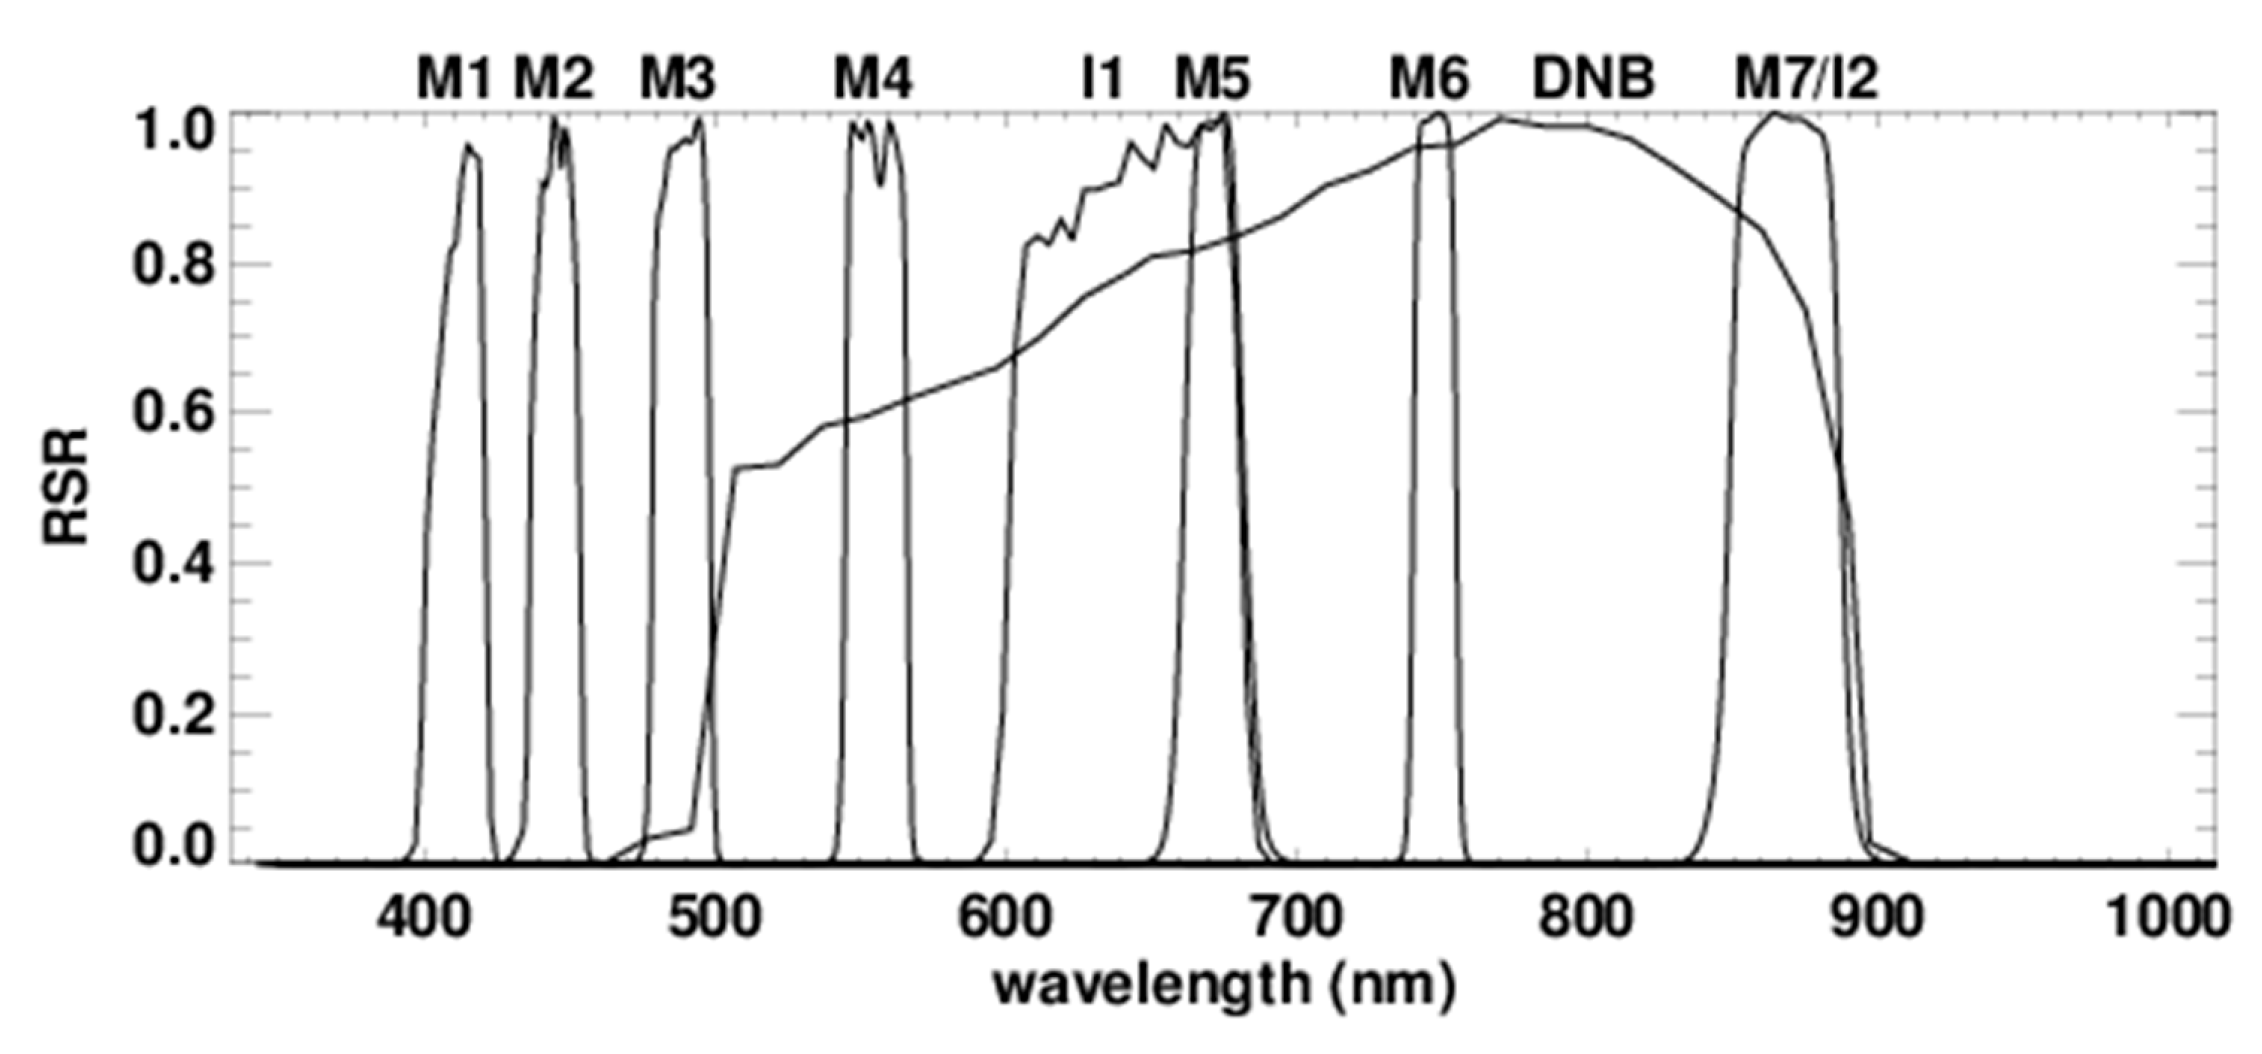
b. Relative Spectral Response (RSR)
Similar to J1 and SNPP, J2 VIIRS spectral testing used the SpMA (Spectral Measurement Assembly), which is a double monochromator source to illuminate VIIRS single row of detectors. The spectral testing was performed in ambient for the VisNIR bands and in the TV environment for the SMWIR and LWIR bands. Each spectral band was illuminated separately with light from the monochromator exit slit image, measuring spectral response over a spectral region covering approximately the dichroic spectral bandpass. A reference detector data set was used to correct VIIRS spectral data for the spectral shape of the source and then normalized to the peak response to determine the VIIRS RSR. An extensive effort was performed to exclude any low quality data and then to determine each band’s center wavelength, Full Width Half Maximum (FWHM) bandwidth, 1% response points (right and left points of the bandpass) and the Integrated OOB (IOOB) metrics. J2 VIIRS spectral characterization was completed successfully during the summer of 2017. Analysis completed by the government data analysis working group team based on various runs of the source calibration data, SNR thresholds and visual inspection led to the release of a high quality J2 VIIRS RSR data set (Version 1, stitched in-band and OOB) in August 2018. This RSR version includes detector-based and band-averaged data without the spectral smile correction. Figure 8 shows the in-band RSR for VisNIR and DNB (top), SMWIR (middle) and LWIR (bottom). As noted previously, the redesign of the VisNIR filters in both J1 and J2 led to major enhancements in terms of IOOB reduction as shown in Figure 9 where we compare the M1 full RSR (in-band and OOB) between J2, J1 and SNPP sensors. Compliance with the band center, bandwidth, extended band-pass and IOOB requirements were calculated for all bands on a per detector basis. Table 7 provides a band average summary of J2 spectral performance for all bands, showing only four minor non-compliances; M9 band center, M14 and I5 bandwidth and DNB MGS IOOB. We also found that few detectors have shown minor non-compliances in two bans, bands M13 for band center and DNB LGS for band center and bandwidth. Also shown in Table 7 are J1 and SNPP non-compliances in shaded and underlined cells respectively. The spectral analysis has shown good enhancements of J2 IOOB bands compared to J1 and SNPP. Most other non-compliances are either similar to J1 and SNPP or are considered low risk to the SDR and EDR data quality. Additional RSR testing was performed for VisNIR and SWIR bands in ambient environment using a NIST traceable laser source, the Goddard Laser for Absolute Measurements of Radiance (GLAMR). Further enhancements to the VisNIR and SWIR RSRs are expected before J2 mission launch, which will be based on the combination of best quality measurements from the SpMA and the GLAMR sources and this new version of J2 RSR data set is expected to be released in late 2018.
c. Response Versus Scan-angle (RVS)
The RVS testing was performed during the summer of 2016 under ambient conditions using the SIS 100 for the RSB and the laboratory ambient blackbody (LABB) and the OBC for the TEB. J2 VIIRS RVS testing was very similar to the previous sensor build and only a brief description is included here. VIIRS was placed on a rotating table with the scan plane perpendicular to gravity. This allowed the instrument to view external sources by rotating the instrument while keeping the illumination level constant. Data taken at twelve angles-of-incidence (AOI) were used to fit the RVS function, which is a quadratic polynomial in AOI, after correcting for source drift and background radiances [21,22].
Figure 10 shows J2 band-average RVS functions for HAM side A and comparison to J1. The variation in the RSB RVS for M1–M11 and I1–I3 is generally small (left and middle plots) and similar to SNPP and J1, varying by less than 1.5% (M1 has the largest variation) over the full operational AOI range of 28.6° to 60.2°. All RSB had maximum uncertainties lower than 0.05% which was determined here as the average fitting residuals [22], much lower than the RVS uncertainty target of 0.3%. Our analysis has shown that J2 VIIRS RVS differences between HAM sides are very small for all bands. This is an improvement upon J1 VIIRS RVS where four bands (M1, M2, M7 and I2) have shown large RVS differences between HAM sides.
The J2 band averaged RVS for the MWIR bands (M12–M13 and I4) and the LWIR bands (M14–M16 and I5) are plotted in the middle and right panels of Figure 10 respectively. The MWIR RVS is generally small varying by less than 0.5% over the full AOI range, comparable to SNPP and J1. In contrast, the LWIR RVS changes by up to 10%, 6% and 3% for M14, M15 and M16 respectively, over the range of AOI. All of these J2 RVS results are consistent with both J1 and SNPP. The TEB RVS maximum uncertainty was propagated through a least squares fitting routine, which provides estimates of the uncertainty on the fitting coefficients as well as covariances. This uncertainty was lower than 0.2% (target value), except in few angles for two bands, I4 and I5, where the maximum uncertainty reached 0.26% and 0.23% respectively. Overall, J2 RVS performance is comparable to both J1 and SNPP performance.
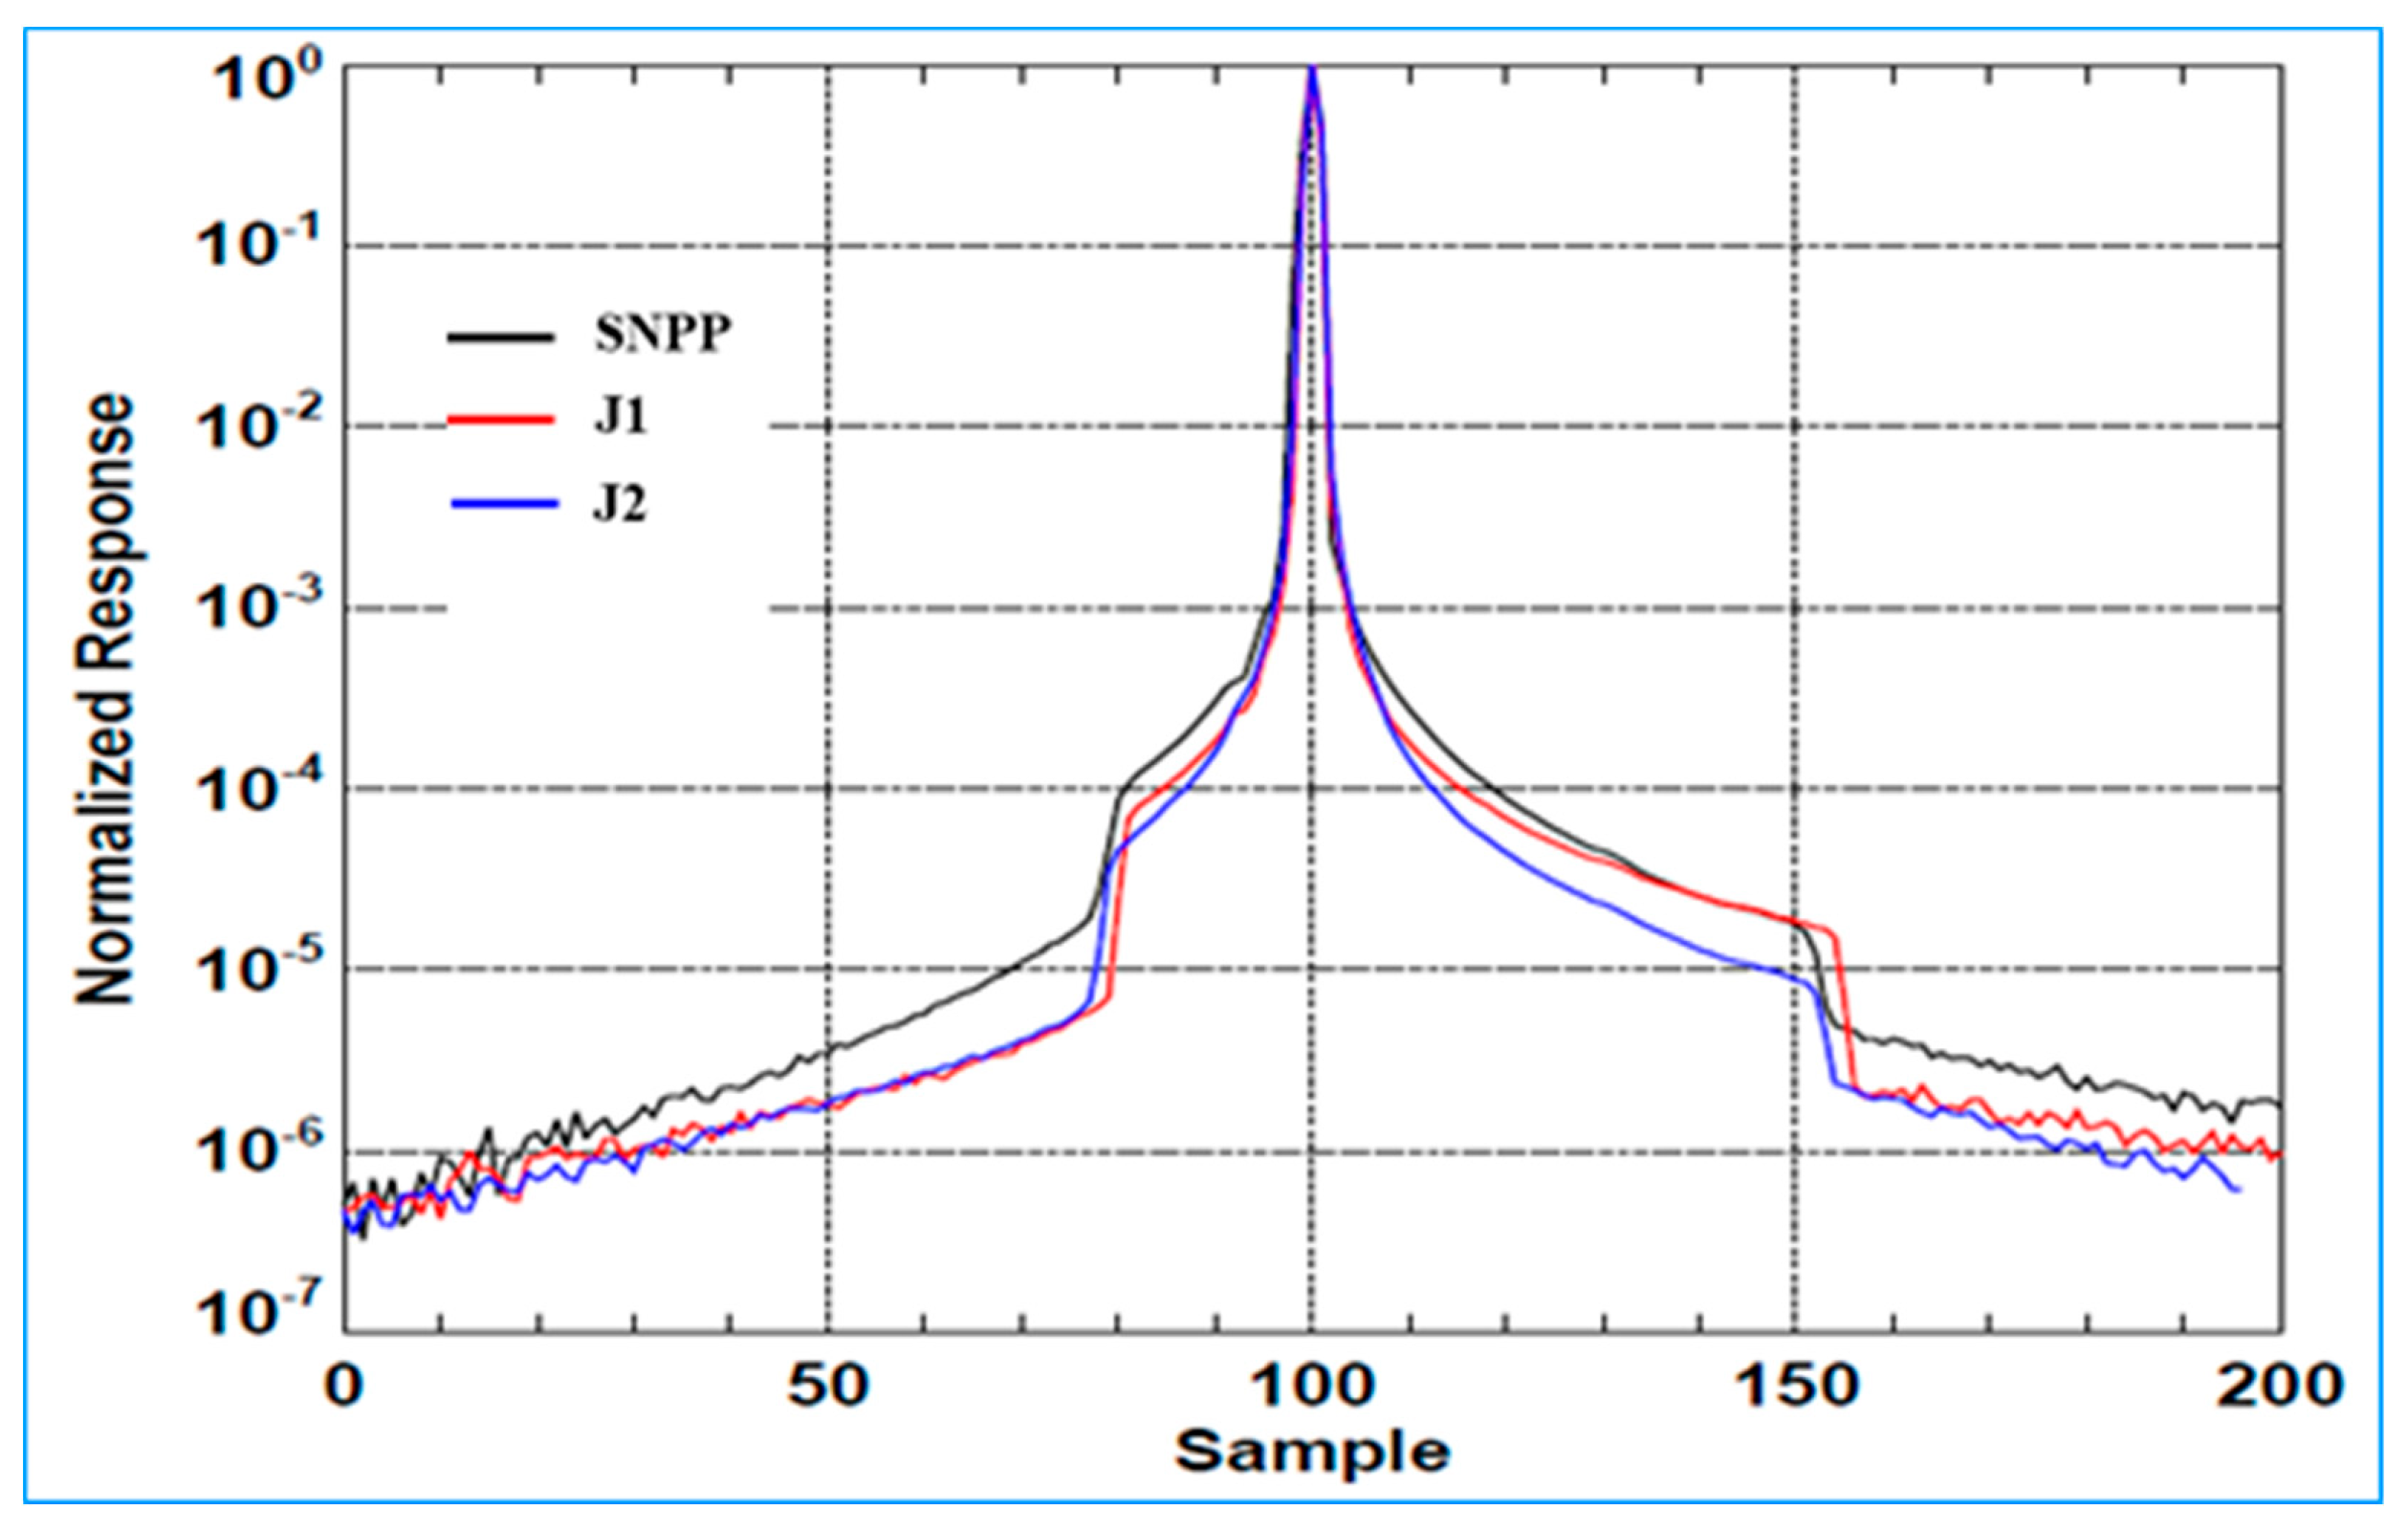
e. Near-Field Response (NFR)
The Scatter Measurement Assembly (ScMA) light source was used with a slit and a band-pass filter to measure the sensor NFR, which was defined as scattered light originating from within 4 degrees of the RTA line of sight [23]. The VIIRS NFR is limited by the absolute radiometric calibration uncertainty requirement for structured scenes which sets the maximum allowable response at a specified angle limit coming off a 12 by 12 milliradian bright target located in a uniform scene of radiance Ltyp for each band. To estimate the structured scene response, a Harvey-Shack BRDF scattering model [24,25] was used to fit the measured response profile and remove test artifacts and noisy samples. Figure 11 compares the normalized response for band M5 detector 8 between J2, J1 and SNPP, which represents a typical profile observed in the VIIRS NFR measurements when the sensor is scanning the source through a vertical slit reticle. For all three instruments, J2, J1 and SNPP, the NFR is shown falling off rapidly from the peak with additional sharp drops observed around the field baffle locations. In this example, the M5 NFR drops to about 0.1% within 5 samples of the peak, which corresponds to approximately 1.25 km at the at nadir on the Earth surface and the field baffle reduces the NFR further by about one order of magnitude. The NFR is estimated for each detector and the results show good detector uniformity within the same band. The NFR requirement states that the maximum allowable scattered radiance, as a fraction of typical scene radiance, at the specified angular distance from a bright target shall be less than the specified value. The band averaged VIIRS NFR performance is summarized in Table 8, including the bright target radiance (Lbright), the specification (Lspec) and the ratio Lscat//Lspec for J2, J1 and SNPP VIIRS. The results show all J2 VIIRS bands meet the specification (Lscat/Lspec < 1) with margin at the beginning of life and increased improvements upon previous sensors.
f. Stray Light Response (SLR)
The far field stray light testing was performed using a radiometrically calibrated 1000 W studio lamp and is defined as the light originating from the region between 4 and 62.5 degrees from the sensor boresight. During this testing, the VIIRS telescope was staring at a cavity type blackbody while the lamp was moved through 33 equally distanced hemispherical positions around the instrument to evaluate the angular stray light distribution. The lamp positions covered roughly equally divided annulus out to 62.5 degrees off nadir to simulate the earthshine reaching VIIRS detectors at J2 on-orbit operating altitude. In order to get better representation of the stray light contamination as seen on-orbit, the measured instrument response was scaled by the ratio of the studio lamp irradiance and a model of bright cloud irradiance.
While using a bright cloud, the VIIRS far-field stray light assessments should represent a worst-case scenario for VIIRS on-orbit measurements. The measured instrument response at each lamp position was weighted by the corresponding annulus, then aggregated over all positions to estimate the total stray light contribution from the specified worse-case scenario. These measurements were derived at nadir and at the edge-of-scan to obtain stray light estimates at different scan angles.
Table 9 shows the estimated J2 VIIRS far field stray light input factors for each RSB: the dnspec, the dnstray and the ratio dnstray/dnspec. The sensor test data analysis showed all RSB meet the stray light requirement with large margins at the beginning of life (dnstray/dnspec); margins are between 50% (M7) and 91% (I3). Furthermore, test results indicate that the stray light rejection is comparable between J2, J1 and SNPP. A noticeable difference is that the stray light in SNPP is much stronger along track than along scan direction; whereas in J1 and J2, the stray light is more evenly distributed over all angles. Another difference is that band M11 is compliant for J2 and J1 because of the Ltyp requirement change, from 0.12 (SNPP) to 1.0 Wm−2sr−1μm−1 (J1 and J2).
4. Summary
The pre-launch testing program has provided a complete and comprehensive test data set needed to characterize and calibrate the J2 VIIRS sensor. Comprehensive radiometric performance was presented in this paper based on the NASA VCST data analysis effort, with support from sensor vendor and other government teams. All of J2 VIIRS 22 spectral bands have shown very good performance in all testing configurations and environments. The key radiometric performance metrics discussed included SNR, dynamic range, NEdT, gain transition, response versus-scan, relative spectral response and scattered light. In general J2 VIIRS was comparable to J1 and SNPP VIIRS and issues observed in J1, such as the polarization non-compliance (M1–M4) and non-linearity in the DNB and SWIR bands were corrected in J2 VIIRS, except M1 polarization which was improved but still not compliant. It was also observed that J2 VIIRS’s many non-compliances are due to design or sources limitations and most of them are common to all VIIRS units (J2, J1 and SNPP) with some variations due to testing configurations. Once all data analyses were reviewed, a series of inputs were generated to populate the on-orbit SDR algorithm, such as the calibration coefficients and the RSR LUTs. Based on these results, J2 VIIRS instrument is expected to provide high quality data products post-launch, comparable to the previous two sensors or better, in support of various science disciplines and applications.
Author Contributions
The co-authors have all provided valuable contributions to this paper as follows: H.O.: Was the lead author who provided the outline of the paper, contributed to the introduction, the sensor design and the sensor testing and the compilation of the final paper. J.M.: Provided the thermal emissive bands performance assessment, the response versus scan-angle performance and the polarization sensitivity assessment. X.X.: Contributed to the sensor design and testing description and the review of the paper at multiple phases to enhance quality and consistency. J.B.: Provided the contribution to the sensor design and testing description and the review of the paper at multiple phases to enhance quality and consistency. Q.J.: Provided the reflective solar bands performance, the stray light performance and near field performance assessments. T.S.: Provided the relative spectral response assessments and contributions to the near field response performance and DNB calibration. A.A.: Contributed to the reflective solar bands performance and the editing of the manuscript’s plots and tables.
Funding
This research received no external funding.
Acknowledgments
The authors of this paper would like to thank the VIIRS team members from Raytheon, NOAA, Aerospace Corporation, NASA Science Team and University of Wisconsin team for their valuable contributions to VIIRS testing and performance verification effort. We also want to thank James McCarthy of Stellar Solutions as well as previous VCST members for their valuable support to the VIIRS program and to the pre-launch calibration and characterization effort.
Conflicts of Interest
The authors declare no conflict of interest. The founding sponsors had no role in the design of the study; in the collection, analyses, or interpretation of data; in the writing of the manuscript and in the decision to publish the results. Figure 1 in this paper represents the sensor design based on the publicly released photos we have for VIIRS instrument. Indeed, almost similar graphs are shown is multiple published paper because it is based on the same photos available. Therefore, this graph does not have copyright restriction.
References
- Xiong, X.; Butler, J.; Chiang, K.; Efremova, B.; Fulbright, J.; Lei, N.; McIntire, M.; Oudrari, H.; Wang, Z.; Wu, A. Assessment of S-NPP VIIRS on-Orbit Radiometric Calibration and Performance. Remote Sens. 2016, 8, 84. [Google Scholar] [CrossRef]
- Cao, C.; Blonski, S.; Wang, W. Progress in the calibration/validation of VIIRS on Suomi NPP and J1. In Proceedings of the 2016 IEEE International Geoscience and Remote Sensing Symposium (IGARSS), Beijing, China, 10–15 July 2016; pp. 2937–2940. [Google Scholar]
- Cao, C.; De Luccia, F.J.; Xiong, X.; Wolfe, R.; Weng, F. Early On-Orbit Performance of the Visible Infrared Imaging Radiometer Suite Onboard the Suomi National Polar-Orbiting Partnership (S-NPP) Satellite. IEEE Trans. Geosci. Remote Sens. 2013, 52, 1142–1156. [Google Scholar] [CrossRef]
- Blonski, S.; Cao, C. Suomi NPP VIIRS Reflective Solar Bands Operational Calibration Reprocessing. Remote Sens. 2015, 7, 16131–16149. [Google Scholar] [CrossRef] [Green Version]
- Liu, Y.; Yu, Y.; Yu, P.; Göttsche, F.M.; Trigo, I.F. Quality Assessment of S-NPP VIIRS Land Surface Temperature Product. Remote Sens. 2015, 7, 12215–12241. [Google Scholar] [CrossRef] [Green Version]
- Wang, W.; Jiang, L.; Liu, X.; Son, S.; Sun, J.; Shi, W.; Tan, L.; Mikelsons, K.; Wang, X.; Lance, L. VIIRS ocean color products: A progress update. In Proceedings of the 2016 IEEE International Geoscience and Remote Sensing Symposium (IGARSS), Beijing, China, 10–15 July 2016; pp. 5848–5851. [Google Scholar]
- Román, M.O.; Wang, Z.; Sun, Q.; Kalb, V.; Miller, S.D.; Molthan, A.; Schultz, L.; Belle, J.; Stokes, E.C.; Pandey, B.; et al. NASA’s Black Marble nighttime lights product suite. Remote Sens. Environ. 2018, 210, 113–143. [Google Scholar] [CrossRef]
- Jackson, J.M.; Liu, H.; Laszlo, I.; Kondragunta, S.; Remer, L.A.; Huang, J.; Huang, H. Suomi-NPP VIIRS aerosol algorithms and data products. J. Geophys. Res. Atmos. 2013, 118, 12673–12689. [Google Scholar] [CrossRef]
- Oudrari, H.; McIntire, J.; Xiong, X.; Butler, J.; Lee, S.; Lei, N.; Schwarting, T.; Sun, J. Prelaunch Radiometric Characterization and Calibration of the S-NPP VIIRS Sensor. IEEE Trans. Geosci. Remote Sens. 2015, 53, 2195–2210. [Google Scholar] [CrossRef]
- Oudrari, H.; McIntire, J.; Xiong, X.; Butler, J.; Ji, Q.; Schwarting, T.; Lee, S.; Efremova, B. JPSS-1 VIIRS radiometric characterization and calibration based on pre-launch testing. Remote Sens. 2016, 8, 41. [Google Scholar] [CrossRef]
- Joint Polar Satellite System (JPSS). VIIRS SDR Algorithm Theoretical Basis Document (ATBD); Goddard Space Flight Center: Greenbelt, MD, USA, 2011. [Google Scholar]
- De Luccia, F.; Moyer, D.; Johnson, E.; Rausch, K.; Lei, N.; Chiang, K.; Xiong, X.; Fulbright, J.; Haas, E.; Iona, G. Discovery and characterization of on-orbit degradation of the visible infrared imaging radiometer suite (VIIRS) rotating telescope assembly (RTA). Proc. SPIE 2012, 8510, 85101A. [Google Scholar]
- Joint Polar Satellite System (JPSS). J2 VIIRS Reflective Solar Bands—Performance Verification Report (PVR); Goddard Space Flight Center: Greenbelt, MD, USA, 2018. [Google Scholar]
- Xiong, X.; Fulbright, J.; Wang, Z.; Butler, J. An overview of S-NPP VIIRS lunar calibration. In Proceedings of the 2015 IEEE International Geoscience and Remote Sensing Symposium (IGARSS), Milan, Italy, 26–31 July 2015; pp. 3910–3913. [Google Scholar]
- Schwarting, T.; McIntire, J.; Oudrari, H.; Sun, C.; Xiong, X. Pre-Launch Radiometric Calibration of the SNPP and JPSS-1 VIIRS Day/Night Bands; CALCON: Logan, UT, USA, 2016. [Google Scholar]
- McIntire, J.; Moyer, D.; Oudrari, H.; Xiong, X. Pre-launch radiometric characterization of JPSS-1 VIIRS thermal emissive bands. Remote Sens. 2016, 8, 47. [Google Scholar] [CrossRef]
- Moyer, D.; McIntire, J.; Young, J.; McCarthy, J.K.; Waluschka, E.; Xiong, X.; De Luccia, F.J. JPSS-1 VIIRS Prelaunch Polarization Testing and Performance. IEEE Trans. Geosci. Remote Sens. 2017, 55, 2463–2476. [Google Scholar] [CrossRef]
- McIntire, J.; Young, J.B.; Moyer, D.; Waluschka, E.; Oudrari, H.; Xiong, X. Analysis of JPSS J1 VIIRS Polarization Sensitivity Using the NIST T-SIRCUS. Proc. SPIE 2015, 9607, 960713. [Google Scholar]
- Waluschka, E.; McCorkel, J.; McIntire, J.; Moyer, D.; McAndrew, B.; Brown, S.W.; Lykke, K.; Young, J.B.; Fest, E.; Butler, J.; et al. J1 VIIRS polarization narrative: Testing and performance. Proc. SPIE 2015, 9607, 960712. [Google Scholar]
- Moyer, D.; McIntire, J.; Oudrari, H.; De Luccia, F. JPSS-2 VIIRS polarization sensitivity comparison with Heritage VIIRS sensors. In Proceedings of the SPIE Asia-Pacific, Honolulu, HI, USA, 24–26 September 2018. [Google Scholar]
- McIntire, J.; Moyer, D.; Chang, T.; Oudrari, H.; Xiong, X. Pre-Launch JPSS-2 VIIRS Response versus Scan Angle Characterization. Remote Sens. 2017, 9, 1300. [Google Scholar] [CrossRef]
- Moyer, D.; McIntire, J.; Oudrari, H.; McCarthy, J.; Xiong, X.; De Luccia, F. JPSS-1 VIIRS Pre-Launch Response Versus Scan Angle Testing and Performance. Remote Sens. 2016, 8, 141. [Google Scholar] [CrossRef]
- Schwarting, T.; McIntire, J.; Oudrari, H.; Xiong, X. VIIRS pre-launch near field response characterization. Proc. SPIE 2017, 10402, 104021L. [Google Scholar]
- Joint Polar Satellite System (JPSS). J2 VIIRS Product Requirement Document (PRD); Goddard Space Flight Center: Greenbelt, MD, USA, 2016. [Google Scholar]
- Joint Polar Satellite System (JPSS). J2 VIIRS Near Field Response (NFR), Performance Verification Report (PVR); Goddard Space Flight Center: Greenbelt, MD, USA, 2018. [Google Scholar]
Figure 1.
VIIRS instrument design based on opto-mechanical and electronics modules (two different views). Key on-board calibrators are shown: Solar Diffuser (SD), Solar Diffuser Stability Monitor (SDSM) and blackbody (BB).
Figure 1.
VIIRS instrument design based on opto-mechanical and electronics modules (two different views). Key on-board calibrators are shown: Solar Diffuser (SD), Solar Diffuser Stability Monitor (SDSM) and blackbody (BB).

Figure 2.
VIIRS scanning diagram showing the Earth View and scan angles when looking at the on-board calibrators, as well as when the HAM changes side.
Figure 2.
VIIRS scanning diagram showing the Earth View and scan angles when looking at the on-board calibrators, as well as when the HAM changes side.

Figure 3.
J2 VIIRS RSB calibration coefficients derived for each band and detector (32 detectors for I-bands and 16 detectors for M-bands) at Nominal temperature plateau. Red and blue color represent high gain and low gain calibration coefficients.
Figure 3.
J2 VIIRS RSB calibration coefficients derived for each band and detector (32 detectors for I-bands and 16 detectors for M-bands) at Nominal temperature plateau. Red and blue color represent high gain and low gain calibration coefficients.


Figure 4.
Comparison of J2, J1 and SNPP SWIR (M8–M11) non-linearity as shown by the ratio of sensor response value (dn) for attenuator in and out measurements.
Figure 4.
Comparison of J2, J1 and SNPP SWIR (M8–M11) non-linearity as shown by the ratio of sensor response value (dn) for attenuator in and out measurements.

Figure 5.
DNB HGB response (dn) as a function of radiance in aggregation zone 32 from J2 and J1 TV testing. The 16 DNB detectors are represented by different symbols.
Figure 5.
DNB HGB response (dn) as a function of radiance in aggregation zone 32 from J2 and J1 TV testing. The 16 DNB detectors are represented by different symbols.

Figure 6.
J2 maximum RRU (right panel) as a function of source (BCS) temperature and comparison to J1 (left panel), shown for all TEB, HAM 0 and nominal plateau (RRU is compliant if less than unity).
Figure 6.
J2 maximum RRU (right panel) as a function of source (BCS) temperature and comparison to J1 (left panel), shown for all TEB, HAM 0 and nominal plateau (RRU is compliant if less than unity).

Figure 7.
VIIRS polarization factor (HAM A) per band and detector, across scan angles (symbols), for J2 (bottom), J1 (middle) and SNPP (top). The horizontal red lines represent the polarization requirements.
Figure 7.
VIIRS polarization factor (HAM A) per band and detector, across scan angles (symbols), for J2 (bottom), J1 (middle) and SNPP (top). The horizontal red lines represent the polarization requirements.

Figure 8.
J2 VIIRS in-band RSRs for VisNIR and DNB (top), SMWIR (middle) and LWIR (bottom).


Figure 9.
Full M1 RSR (in-band and OOB) comparison between J2, J1 and SNPP.

Figure 10.
VIIRS band-averaged RVS as a function of HAM AOI for HAM 0, J2 (top) and J1 (bottom).

Figure 11.
Measured NFR for band M5 (672 nm) detector 8 as a function of scan angle, using J2 data (blue line), J1 data (red line) and SNPP data (black line).
Figure 11.
Measured NFR for band M5 (672 nm) detector 8 as a function of scan angle, using J2 data (blue line), J1 data (red line) and SNPP data (black line).

Table 1.
VIIRS RSB bands characteristics and key requirements.

| Band Name | Gain | Wavecenter (nm) | Bandwidth (nm) | Polarization Sensitivity (%) | Ltyp | Lmax | SNR |
|---|---|---|---|---|---|---|---|
| DNB | VG | 700 | 400 | NS | 3 × 10⁻⁵ (*) | 200 (*) | 5 |
| M1 | HG | 412 | 20 | 3 | 44.9 | 135 | 352 |
| LG | 155 | 615 | 316 | ||||
| M2 | HG | 445 | 18 | 2.5 | 40 | 127 | 380 |
| LG | 146 | 687 | 409 | ||||
| M3 | HG | 488 | 20 | 2.5 | 32 | 107 | 416 |
| LG | 123 | 702 | 414 | ||||
| M4 | HG | 555 | 20 | 2.5 | 21 | 78 | 362 |
| LG | 90 | 667 | 315 | ||||
| M5 | HG | 672 | 20 | 2.5 | 10 | 59 | 242 |
| LG | 68 | 651 | 360 | ||||
| I1 | SG | 640 | 80 | 2.5 | 22 | 718 | 119 |
| M6 | SG | 746 | 15 | 2.5 | 9.6 | 41 | 199 |
| M7 | HG | 865 | 39 | 3 | 6.4 | 29 | 215 |
| LG | 33.4 | 349 | 340 | ||||
| I2 | SG | 865 | 39 | 3 | 25 | 349 | 150 |
| M8 | SG | 1240 | 20 | NS | 5.4 | 164.9 | 74 |
| M9 | SG | 1378 | 15 | NS | 6 | 77.1 | 83 |
| M10 | SG | 1610 | 60 | NS | 7.3 | 71.2 | 342 |
| I3 | SG | 1610 | 60 | NS | 7.3 | 72.5 | 6 |
| M11 | SG | 2250 | 50 | NS | 0.12 | 31.8 | 10 |
Notes: DNB Ltyp is defined as Lmin and radiance units are in Wm−2sr−1. The units of spectral radiance for Ltyp, Lmax are Wm−2sr−1μm−1. Dual-gain M-bands have two entries, one for high-gain (HG) and one for low-gain (LG). The SNR at typical radiance (Ltyp) is the minimum (worse-case) required SNR that applies at the end-of-scan. VG: Variable Gain (DNB has three gains, low-gain, mid-gain and high-gain). SG: Single Gain, NS: Not Specified.
| Band Name | Gain | Wavecenter (nm) | Bandwidth (nm) | Ttyp (K) | Tmax (K) | NEdT(K) |
|---|---|---|---|---|---|---|
| I4 | SG | 3740 | 380 | 270 | 353 | 2.5 |
| M12 | SG | 3700 | 180 | 270 | 353 | 0.396 |
| M13 | HG | 4050 | 155 | 300 | 343 | 0.107 |
| LG | 380 | 634 | 0.423 | |||
| M14 | SG | 8550 | 300 | 270 | 336 | 0.091 |
| M15 | SG | 10,763 | 1000 | 300 | 343 | 0.07 |
| I5 | SG | 11,450 | 1900 | 210 | 340 | 1.5 |
| M16 | SG | 12,013 | 950 | 300 | 340 | 0.072 |
Notes: Dual-gain M-bands have two entries, one for high-gain (HG) and one for low-gain (LG). The NEdT (at Ttyp) is the maximum (worse-case) required NEdT that applies at the end-of-scan. SG: Single Gain.
Table 2.
Key VIIRS sensor improvements based on lessons learned from previous flight units.
| Key VIIRS Sensor Improvements | |
|---|---|
| SNPP -> J1 | J1 -> J2 |
| RTA Mirrors Changed from Ni coated to VQ: – Improved spatial stability with temperature | Improved the VisNIR FPA detector – Eliminated/reduced further dynamic crosstalk |
| Dichroic 2 coatings redesigned: – Improved spatial performance between SMWIR & LWIR | Improved the VisNIR FPA ROIC circuit – Corrected band signal roll-over after Lsat (e.g., M6) |
| Eliminated throughput degradation due to Tungsten contamination – Improved radiometric sensitivity and gain stability | Redesigned IFAs for all focal planes (except DNB) – Improved dynamic range and M1-M4 polarization |
| Enhanced VisNIR integrated filter coating – Improved crosstalk, OOB, and RSR performances | Improved SDSM spectral filters – Reduced (but did not eliminate) out-of-band signals (red leak). |
| Replaced the single board computer (SBC) – Eliminated on-orbit single-event anomaly | Improved DNB stray light performance – Added additional baffling and stray light closeouts to reduce stray light for the DNB. |
| Replaced IEEE 1394 interface with Space-Wire communications – Eliminated on-orbit single-event anomaly | Improved electronics and voltage values – Eliminated non-linearity in DNB and SWIR low radiances |
Table 3.
J2 VIIRS SNR (at Ltyp) for RSB and comparison to sensor specification, SNPP and J1. The ratio between measured performance and specification (Spec) is also shown.
Table 3.
J2 VIIRS SNR (at Ltyp) for RSB and comparison to sensor specification, SNPP and J1. The ratio between measured performance and specification (Spec) is also shown.
| Band | Gain Stage | SNR (Spec) | SNPP SNR | J1 SNR | J2 SNR | SNPP SNR/Spec | J1 SNR/Spec | J2 SNR/Spec |
|---|---|---|---|---|---|---|---|---|
| M1 | High | 352 | 613 | 636 | 650 | 1.74 | 1.81 | 1.85 |
| M1 | Low | 316 | 1042 | 1066 | 1040 | 3.30 | 3.37 | 3.29 |
| M2 | High | 380 | 554 | 573 | 600 | 1.46 | 1.51 | 1.58 |
| M2 | Low | 409 | 963 | 986 | 1040 | 2.35 | 2.41 | 2.54 |
| M3 | High | 416 | 683 | 706 | 753 | 1.64 | 1.70 | 1.81 |
| M3 | Low | 414 | 1008 | 1063 | 1240 | 2.44 | 2.57 | 3.00 |
| M4 | High | 362 | 526 | 559 | 611 | 1.45 | 1.54 | 1.69 |
| M4 | Low | 315 | 864 | 844 | 993 | 2.74 | 2.68 | 3.15 |
| M5 | High | 242 | 373 | 380 | 366 | 1.54 | 1.57 | 1.51 |
| M5 | Low | 360 | 776 | 751 | 730 | 2.16 | 2.09 | 2.03 |
| M6 | SG | 199 | 409 | 428 | 429 | 2.06 | 2.15 | 2.16 |
| M7 | High | 215 | 524 | 549 | 564 | 2.44 | 2.55 | 2.62 |
| M7 | Low | 340 | 721 | 760 | 950 | 2.12 | 2.23 | 2.79 |
| M8 | SG | 74 | 358 | 335 | 240 | 4.84 | 4.53 | 3.24 |
| M9 | SG | 83 | 290 | 325 | 232 | 3.49 | 3.91 | 2.80 |
| M10 | SG | 342 | 691 | 765 | 685 | 2.02 | 2.24 | 2.00 |
| M11 | SG | 90 | 105 | 216 | 198 | 1.17 | 2.40 | 2.20 |
| I1 | SG | 119 | 261 | 227 | 212 | 2.19 | 1.91 | 1.78 |
| I2 | SG | 150 | 273 | 287 | 285 | 1.82 | 1.91 | 1.90 |
| I3 | SG | 6 | 176 | 190 | 172 | 29.36 | 31.72 | 28.67 |
Table 4.
J2 VIIRS Lsat values for RSB and comparison to sensor specification, SNPP and J1. The ratio between measured performance and specification (Spec) is also shown. For dual gain bands, the Lsat of high gain stage represents the transition radiance (Ltrans), from high to low gain.
Table 4.
J2 VIIRS Lsat values for RSB and comparison to sensor specification, SNPP and J1. The ratio between measured performance and specification (Spec) is also shown. For dual gain bands, the Lsat of high gain stage represents the transition radiance (Ltrans), from high to low gain.
| Band | Gain Stage | Lmax (Spec) | SNPP Lsat | J1 Lsat | J2 Lsat | SNPP Lsat/Spec | J1 Lsat/Spec | J2 Lsat/Spec |
|---|---|---|---|---|---|---|---|---|
| M1 | High | 135 | 172 | 154 | 184 | 1.27 | 1.14 | 1.36 |
| M1 | Low | 615 | 696 | 705 | 674 | 1.13 | 1.15 | 1.10 |
| M2 | High | 127 | 138 | 137 | 156 | 1.09 | 1.08 | 1.23 |
| M2 | Low | 687 | 827 | 880 | 860 | 1.20 | 1.28 | 1.25 |
| M3 | High | 107 | 125 | 113 | 114 | 1.17 | 1.06 | 1.07 |
| M3 | Low | 702 | 843 | 838 | 908 | 1.20 | 1.19 | 1.29 |
| M4 | High | 78 | 88 | 87 | 87 | 1.13 | 1.12 | 1.12 |
| M4 | Low | 667 | 872 | 851 | 771 | 1.31 | 1.28 | 1.16 |
| M5 | High | 59 | 66 | 61 | 68 | 1.12 | 1.04 | 1.15 |
| M5 | Low | 651 | 726 | 725 | 910 | 1.12 | 1.11 | 1.40 |
| M6 | SG | 41 | 48 | 48 | 50 | 1.16 | 1.16 | 1.22 |
| M7 | High | 29 | 31 | 31 | 33 | 1.07 | 1.06 | 1.14 |
| M7 | Low | 349 | 414 | 409 | 400 | 1.19 | 1.17 | 1.15 |
| M8 | SG | 164.9 | 126 | 118 | 167 | 0.77 | 0.72 | 1.01 |
| M9 | SG | 77.1 | 84 | 80 | 92 | 1.09 | 1.04 | 1.19 |
| M10 | SG | 71.2 | 81 | 77 | 96 | 1.14 | 1.09 | 1.35 |
| M11 | SG | 31.8 | 35 | 35 | 35 | 1.09 | 1.10 | 1.10 |
| I1 | SG | 718 | 771 | 777 | 930 | 1.07 | 1.08 | 1.30 |
| I2 | SG | 349 | 413 | 410 | 444 | 1.18 | 1.17 | 1.27 |
| I3 | SG | 72.5 | 70 | 66 | 101 | 0.97 | 0.91 | 1.39 |
Table 5.
J2 VIIRS Lmax and NEdT performance for TEB derived in TV at nominal plateau and comparison to J1 and SNPP as well as the specification. The temperature saturation for M13 LG was derived from ambient testing.
Table 5.
J2 VIIRS Lmax and NEdT performance for TEB derived in TV at nominal plateau and comparison to J1 and SNPP as well as the specification. The temperature saturation for M13 LG was derived from ambient testing.
| Band | Lmax | NEdT at Ttyp | ||||||
|---|---|---|---|---|---|---|---|---|
| Spec | SNPP | J1 | J2 | Spec | SNPP | J1 | J2 | |
| I4 | 353 | 357 | 357 | 355 | 2.5 | 0.41 | 0.42 | 0.37 |
| I5 | 340 | 373 | 370 | 380 | 1.5 | 0.42 | 0.41 | 0.4 |
| M12 | 353 | 357 | 358 | 359 | 0.396 | 0.13 | 0.12 | 0.14 |
| M13 HG | 343 | 364 | 363 | 346 | 0.107 | 0.044 | 0.043 | 0.047 |
| M13 LG | 634 | 654 | 670 | 652 | 0.423 | 0.34 | 0.304 | 0.23 |
| M14 | 336 | 347 | 348 | 352 | 0.091 | 0.061 | 0.05 | 0.054 |
| M15 | 343 | 365 | 359 | 350 | 0.07 | 0.03 | 0.026 | 0.027 |
| M16 | 340 | 368 | 369 | 355 | 0.072 | 0.038 | 0.043 | 0.038 |
Table 6.
J2 Band averaged ARD (%) at specified temperature as well as temperature error for all TEB at nominal plateau and for HAM side A. Comparison to J1 is also shown.
Table 6.
J2 Band averaged ARD (%) at specified temperature as well as temperature error for all TEB at nominal plateau and for HAM side A. Comparison to J1 is also shown.
| ARD Performance (%) | |||||||||
| Temp (K) | I4 | I5 | M12 | M13 | M14 | M15 | M16A | M16B | |
| 190 | J2 | ~ | ~ | ~ | ~ | 1.48 | 0.18 | 0.15 | 0.15 |
| J1 | ~ | ~ | ~ | ~ | 0.68 | 0.29 | 0.17 | 0.25 | |
| 230 | J2 | ~ | ~ | 0.34 | 1.50 | 0.15 | 0.05 | 0.00 | 0.01 |
| J1 | ~ | ~ | 7.60 | 2.95 | 0.11 | 0.07 | 0.08 | 0.04 | |
| 267 | J2 | 0.45 | 0.02 | ~ | ~ | ~ | ~ | ~ | ~ |
| J1 | 0.48 | 0.10 | ~ | ~ | ~ | ~ | ~ | ~ | |
| 270 | J2 | ~ | ~ | 0.21 | 0.31 | 0.10 | 0.08 | 0.02 | 0.03 |
| J1 | ~ | ~ | 0.24 | 0.15 | 0.08 | 0.05 | 0.04 | 0.04 | |
| 310 | J2 | ~ | ~ | 0.31 | 0.35 | 0.16 | 0.09 | 0.05 | 0.05 |
| J1 | ~ | ~ | 0.25 | 0.17 | 0.11 | 0.06 | 0.03 | 0.04 | |
| 340 | J2 | ~ | ~ | 0.30 | 0.39 | 0.17 | 0.08 | 0.02 | 0.04 |
| J1 | ~ | ~ | 0.27 | 0.18 | 0.09 | 0.05 | 0.03 | 0.03 | |
| Temperature Error (K) | |||||||||
| Temp (K) | VIIRS | I4 | I5 | M12 | M13 | M14 | M15 | M16A | M16B |
| 190 | J2 | ~ | ~ | ~ | ~ | 0.508 | 0.293 | 0.241 | 0.235 |
| J1 | ~ | ~ | ~ | ~ | 0.200 | 0.080 | 0.070 | 0.100 | |
| 230 | J2 | ~ | ~ | 1.101 | 0.926 | 0.198 | 0.137 | 0.144 | 0.126 |
| J1 | ~ | ~ | 1.010 | 0.710 | 0.040 | 0.020 | 0.030 | 0.020 | |
| 267 | J2 | 0.348 | 0.311 | ~ | ~ | ~ | ~ | ~ | ~ |
| J1 | 0.130 | 0.050 | ~ | ~ | ~ | ~ | ~ | ~ | |
| 270 | J2 | ~ | ~ | 0.129 | 0.514 | 0.12 | 0.102 | 0.145 | 0.113 |
| J1 | ~ | ~ | 0.050 | 0.040 | 0.040 | 0.030 | 0.040 | 0.030 | |
| 310 | J2 | ~ | ~ | 0.085 | 0.642 | 0.112 | 0.103 | 0.17 | 0.125 |
| J1 | ~ | ~ | 0.060 | 0.050 | 0.070 | 0.040 | 0.030 | 0.040 | |
| 340 | J2 | ~ | ~ | 0.097 | 0.77 | 0.122 | 0.113 | 0.197 | 0.142 |
| J1 | ~ | ~ | 0.080 | 0.080 | 0.080 | 0.040 | 0.040 | 0.040 | |
Table 7.
J2 Spectral performance summary based on RSR Version 1 data set. Bold, shaded and underlined cells represent J2, J1 and SNPP performance non-compliances respectively.
Table 7.
J2 Spectral performance summary based on RSR Version 1 data set. Bold, shaded and underlined cells represent J2, J1 and SNPP performance non-compliances respectively.
| Band | Center Wavelength (nm) | Bandwidth (nm) | 1 % Limits (nm) | IOOB (%) | ||||||||
|---|---|---|---|---|---|---|---|---|---|---|---|---|
| Measurement | Specification | Measurement | Specification | Measurement | Specification | Measurement | Specification | |||||
| Center | Tolerance | Bandwidth | Tolerance | Lower Limit | Upper Limit | Lower Limit | Upper Limit | |||||
| I1 | 641.4 | 640 | 6 | 79.4 | 80 | 6 | 592.8 | 689.8 | 565 | 715 | 0.05 | 0.5 |
| I2 | 868.2 | 865 | 8 | 38.8 | 39 | 5 | 835.4 | 898.6 | 802 | 928 | 0.19 | 0.7 |
| I3 | 1613.7 | 1610 | 14 | 61.7 | 60 | 9 | 1550.4 | 1687.5 | 1509 | 1709 | 0.39 | 0.7 |
| I4 | 3760.3 | 3740 | 40 | 383.6 | 380 | 30 | 3490.7 | 4040.6 | 3340 | 4140 | 0.17 | 0.5 |
| I5 | 11496.3 | 11450 | 125 | 1731.5 | 1900 | 100 | 10476.4 | 12700.6 | 9900 | 12900 | 0.13 | 0.4 |
| M1 | 411.9 | 412 | 2 | 19.1 | 20 | 2 | 397.1 | 424.8 | 376 | 444 | 0.17 | 1.0 |
| M2 | 445.0 | 445 | 3 | 17.0 | 18 | 2 | 434.2 | 457.0 | 417 | 473 | 0.18 | 1.0 |
| M3 | 488.4 | 488 | 4 | 19.8 | 20 | 3 | 475.8 | 501.6 | 455 | 521 | 0.18 | 0.7 |
| M4 | 555.6 | 555 | 4 | 21.3 | 20 | 3 | 542.1 | 569.1 | 523 | 589 | 0.16 | 0.7 |
| M5 | 671.3 | 672 | 5 | 21.0 | 20 | 3 | 651.2 | 693.9 | 638 | 706 | 0.33 | 0.7 |
| M6 | 747.4 | 746 | 2 | 14.9 | 15 | 2 | 736.5 | 758.4 | 721 | 771 | 0.26 | 0.8 |
| M7 | 868.6 | 865 | 8 | 38.6 | 39 | 5 | 836.4 | 898.6 | 801 | 929 | 0.19 | 0.7 |
| M8 | 1242.4 | 1240 | 5 | 20.4 | 20 | 4 | 1226.7 | 1257.5 | 1205 | 1275 | 0.19 | 0.8 |
| M9 | 1382.9 | 1378 | 4 | 15.3 | 15 | 3 | 1370.2 | 1398.6 | 1351 | 1405 | 0.34 | 1.0 |
| M10 | 1614.1 | 1610 | 14 | 61.9 | 60 | 9 | 1549.9 | 1688.5 | 1509 | 1709 | 0.37 | 0.7 |
| M11 | 2252.0 | 2250 | 13 | 48.1 | 50 | 6 | 2206.7 | 2294.6 | 2167 | 2333 | 0.28 | 1.0 |
| M12 | 3689.1 | 3700 | 32 | 193.1 | 180 | 20 | 3529.1 | 3874.5 | 3410 | 3990 | 0.32 | 1.1 |
| M13 | 4015.9 | 4050 | 34 | 155.1 | 155 | 20 | 3863.7 | 4168.1 | 3790 | 4310 | 0.35 | 1.3 |
| M14 | 8577.1 | 8550 | 70 | 349.5 | 300 | 40 | 8235.2 | 8927.2 | 8050 | 9050 | 0.35 | 0.9 |
| M15 | 10675.2 | 10763 | 113 | 935.8 | 1000 | 100 | 10034.9 | 11349.1 | 9700 | 11740 | 0.19 | 0.4 |
| M16A | 11931.9 | 12013 | 88 | 924.0 | 950 | 50 | 11296.6 | 12647.4 | 11060 | 13050 | 0.24 | 0.4 |
| M16B | 11943.3 | 12013 | 88 | 926.0 | 950 | 50 | 11298.5 | 12653.4 | 11060 | 13050 | 0.24 | 0.4 |
| M16 | 11942.3 | 12013 | 88 | 924.8 | 950 | 50 | 11298.6 | 12656.5 | 11060 | 13050 | 0.24 | 0.4 |
| DNBMGS | 693.6 | 700 | 14 | 384.3 | 400 | 20 | 481.9 | 908.4 | 470 | 960 | 0.14 | 0.1 |
| DNBLGS | 696.1 | 700 | 14 | 383.0 | 400 | 20 | 484.5 | 904.7 | 470 | 960 | 0.03 | 0.1 |
Table 8.
The summary of J2 band average NFR performance and comparison to J1 and SNPP. A ratio Lscat/Lspec of less than unity indicates compliance with scatter requirements.
Table 8.
The summary of J2 band average NFR performance and comparison to J1 and SNPP. A ratio Lscat/Lspec of less than unity indicates compliance with scatter requirements.
| Band | Center Wavelength (nm) | Angular Separation (mrad) | Lbright | SNPP | J1 | J2 | |||
|---|---|---|---|---|---|---|---|---|---|
| Lspec | Lscat/Lspec | Lspec | Lscat/Lspec | Lspec | Lscat/Lspec | ||||
| M1 | 412 | 6 | 162 | 2.77E-03 | 0.39 | 4.68E-03 | 0.37 | 0.45 | 0.34 |
| M2 | 445 | 6 | 180 | 2.22E-03 | 0.45 | 3.95E-03 | 0.42 | 0.40 | 0.46 |
| M3 | 488 | 6 | 160 | 2.00E-03 | 0.5 | 3.33E-03 | 0.36 | 0.32 | 0.43 |
| M4 | 555 | 6 | 160 | 1.31E-03 | 0.47 | 2.25E-03 | 0.48 | 0.22 | 0.55 |
| M5 | 672 | 6 | 115 | 8.70E-04 | 0.63 | 9.55E-04 | 0.67 | 0.10 | 0.67 |
| M6 | 746 | 12 | 147 | 1.31E-03 | 0.12 | 1.08E-03 | 0.13 | 0.10 | 0.20 |
| M7 | 865 | 6 | 124 | 5.16E-04 | 0.9 | 6.63E-04 | 0.83 | 0.06 | 0.62 |
| M8 | 1240 | 6 | 57 | 9.47E-04 | 0.62 | 4.92E-04 | 0.65 | 0.05 | 0.57 |
| M9 | 1378 | NA | NA | NA | NA | NA | NA | NA | NA |
| M10 | 1610 | 6 | 86.1 | 8.48E-04 | 0.76 | 1.03E-03 | 0.38 | 0.07 | 0.94 |
| M11 | 2250 | 6 | 1.2 | 1.00E-03 | 0.42 | 6.03E-06 | 0.63 | 0.001 | 0.47 |
| M12 | 3700 | 3 | 0.3 | 1.67E-03 | 0.64 | 4.78E-04 | 0.87 | 4.78E-04 | 0.62 |
| M13 | 4050 | 3 | 1.7 | 1.86E-03 | 0.63 | 3.15E-03 | 0.47 | 3.15E-03 | 0.49 |
| M14 | 8550 | NA | NA | NA | NA | NA | NA | NA | NA |
| M15 | 10763 | 3 | 12.5 | 7.75E-04 | 1.25 | 6.69E-03 | 0.66 | 9.69E-03 | 0.31 |
| M16 | 12013 | 3 | 11.3 | 7.92E-04 | 1.26 | 8.95E-03 | 0.56 | 8.95E-03 | 0.48 |
Table 9.
Summary of J2 VIIRS stray light performance and the ratio of measured stray light to requirement (1% Ltyp). The comparison to J1 and SNPP stray light performance is also shown.
Table 9.
Summary of J2 VIIRS stray light performance and the ratio of measured stray light to requirement (1% Ltyp). The comparison to J1 and SNPP stray light performance is also shown.
| Band | Eearth | Ltyp | SNPP | J1 | J2 | ||||||
|---|---|---|---|---|---|---|---|---|---|---|---|
| dnspec | dnstray | dnstray/dnspec | dnspec | dnstray | dnstray/dnspec | dnspec | dnstray | dnstray/dnspec | |||
| M1 | 1444.1 | 44.9 | 17.02 | 2.58 | 0.15 | 7.84 | 2.42 | 0.31 | 8.04 | 2.23 | 0.28 |
| M2 | 1526.1 | 40 | 9.39 | 2.53 | 0.27 | 9.03 | 2.68 | 0.3 | 8.97 | 1.83 | 0.20 |
| M3 | 1563.5 | 32 | 8.81 | 2.56 | 0.29 | 8.12 | 2.89 | 0.36 | 9.53 | 1.84 | 0.19 |
| M4 | 1510.7 | 21 | 7.53 | 2.39 | 0.32 | 7.5 | 2.96 | 0.39 | 7.96 | 1.58 | 0.20 |
| M5 | 1265.7 | 10 | 5.06 | 2.38 | 0.47 | 4.69 | 2.57 | 0.55 | 4.59 | 1.43 | 0.31 |
| M6 | 1088.9 | 9.6 | 8 | 3.62 | 0.45 | 7.22 | 2.95 | 0.41 | 6.91 | 2.25 | 0.32 |
| M7 | 833.2 | 6.4 | 6.87 | 4.06 | 0.59 | 6.27 | 3.29 | 0.52 | 6.45 | 3.19 | 0.50 |
| M8 | 353 | 5.4 | 1.45 | 0.77 | 0.53 | 1.82 | 0.44 | 0.24 | 1.33 | 0.49 | 0.37 |
| M9 | 262.9 | 6 | 2.44 | 0.92 | 0.38 | 2.41 | 0.36 | 0.15 | 1.80 | 0.59 | 0.33 |
| M10 | 165.7 | 7.3 | 3.55 | 1.3 | 0.36 | 3.44 | 0.22 | 0.06 | 2.90 | 0.28 | 0.10 |
| M11 | 56.4 | 1 | 0.11 | 0.42 | 3.77 | 1.15 | 0.09 | 0.08 | 1.18 | 0.15 | 0.13 |
| I1 | 1341.3 | 22 | 1.02 | 0.26 | 0.26 | 0.94 | 0.31 | 0.33 | 0.89 | 0.32 | 0.33 |
| I2 | 833.2 | 25 | 2.51 | 0.39 | 0.15 | 2.12 | 0.31 | 0.15 | 2.15 | 0.36 | 0.16 |
| I3 | 165.7 | 7.3 | 3.19 | 0.79 | 0.25 | 3.92 | 0.24 | 0.06 | 2.84 | 0.27 | 0.09 |
© 2018 by the authors. Licensee MDPI, Basel, Switzerland. This article is an open access article distributed under the terms and conditions of the Creative Commons Attribution (CC BY) license (http://creativecommons.org/licenses/by/4.0/).
Share and Cite
MDPI and ACS Style
Oudrari, H.; McIntire, J.; Xiong, X.; Butler, J.; Ji, Q.; Schwarting, T.; Angal, A. An Overall Assessment of JPSS-2 VIIRS Radiometric Performance Based on Pre-Launch Testing. Remote Sens. 2018, 10, 1921. https://doi.org/10.3390/rs10121921
AMA Style
Oudrari H, McIntire J, Xiong X, Butler J, Ji Q, Schwarting T, Angal A. An Overall Assessment of JPSS-2 VIIRS Radiometric Performance Based on Pre-Launch Testing. Remote Sensing. 2018; 10(12):1921. https://doi.org/10.3390/rs10121921
Chicago/Turabian StyleOudrari, Hassan, Jeff McIntire, Xiaoxiong Xiong, James Butler, Qiang Ji, Thomas Schwarting, and Amit Angal. 2018. "An Overall Assessment of JPSS-2 VIIRS Radiometric Performance Based on Pre-Launch Testing" Remote Sensing 10, no. 12: 1921. https://doi.org/10.3390/rs10121921
Note that from the first issue of 2016, this journal uses article numbers instead of page numbers. See further details here.