Use of a Wearable Mobile Laser System in Seamless Indoor 3D Mapping of a Complex Historical Site


 , , ,
, , , 
Abstract
:
1. Introduction
2. Materials and Methods
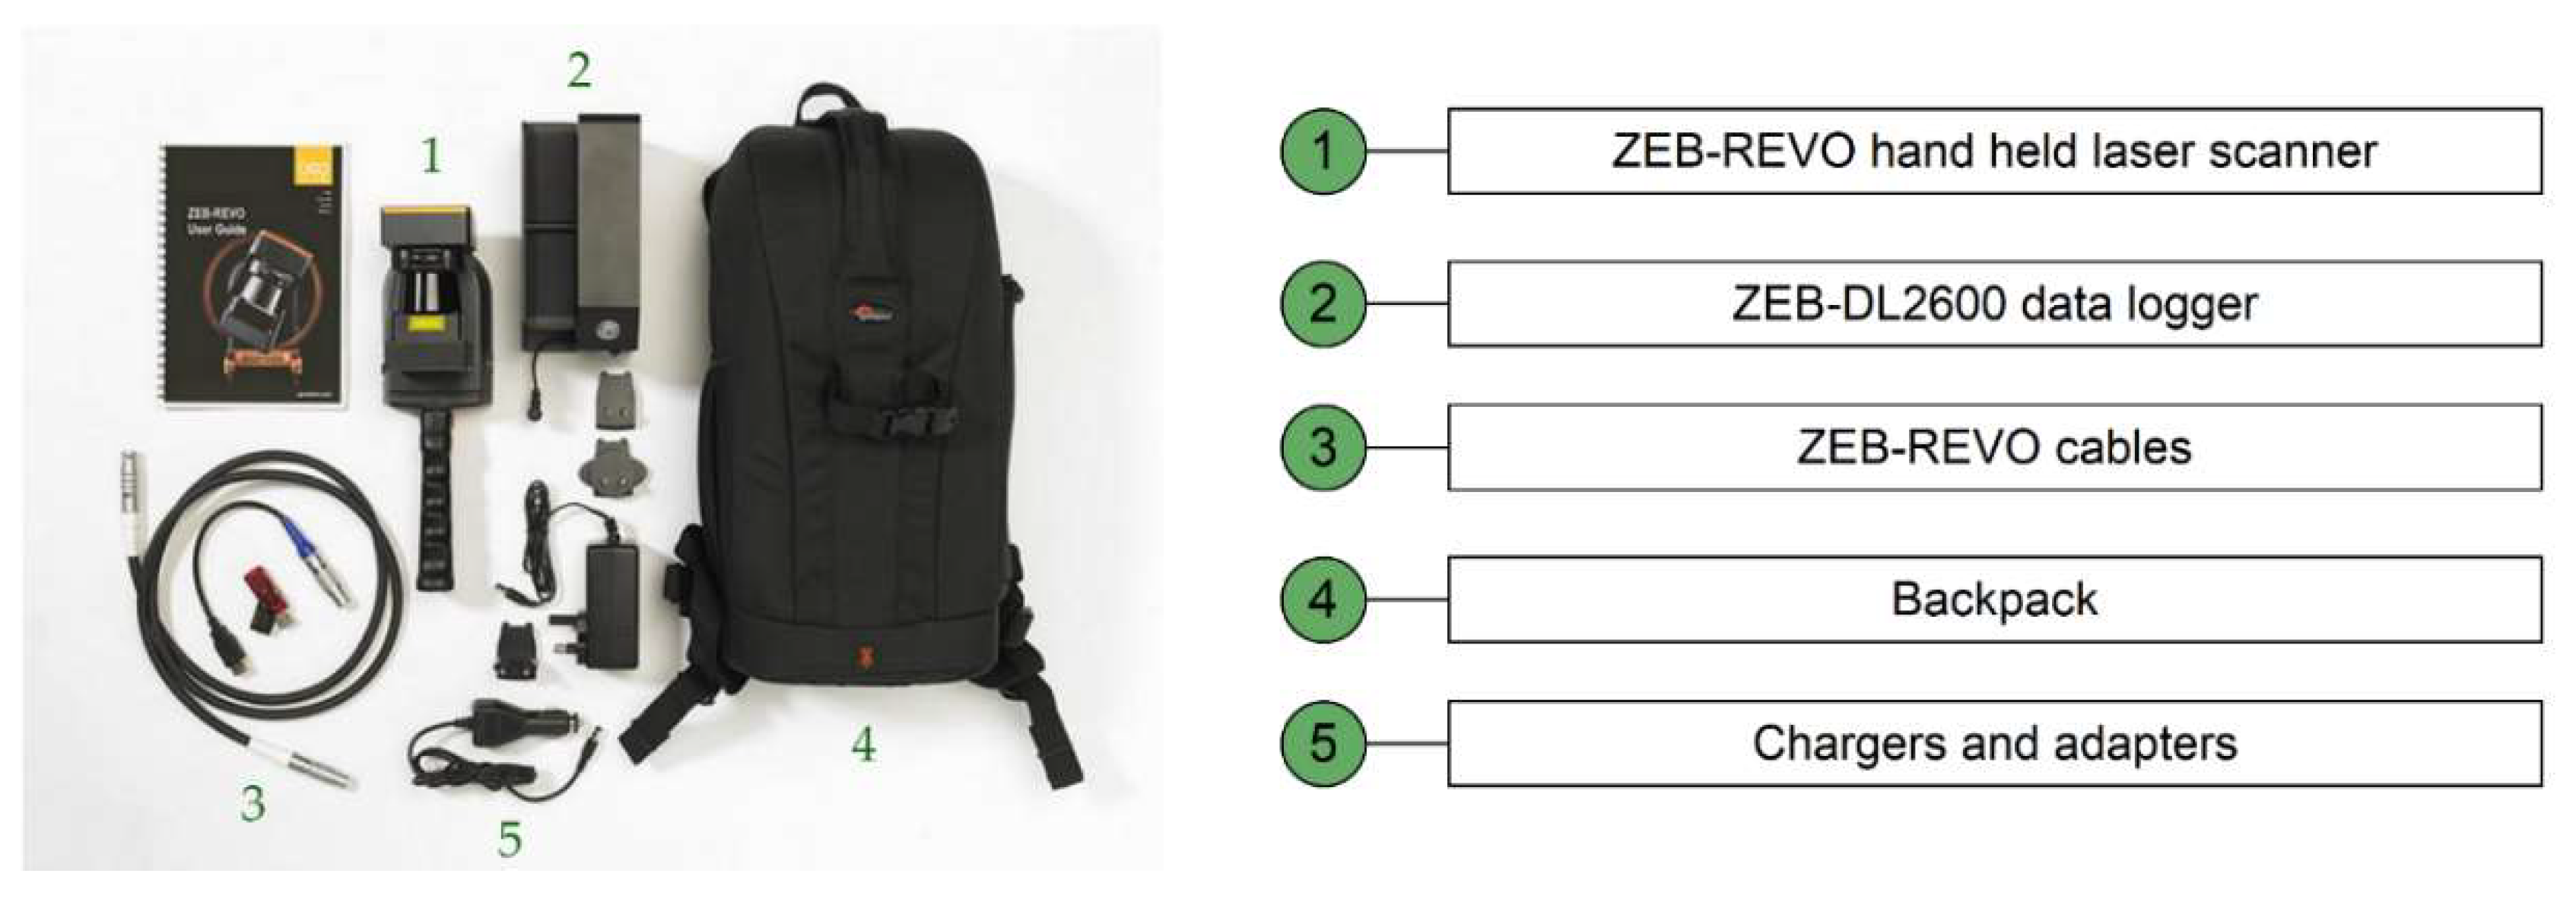
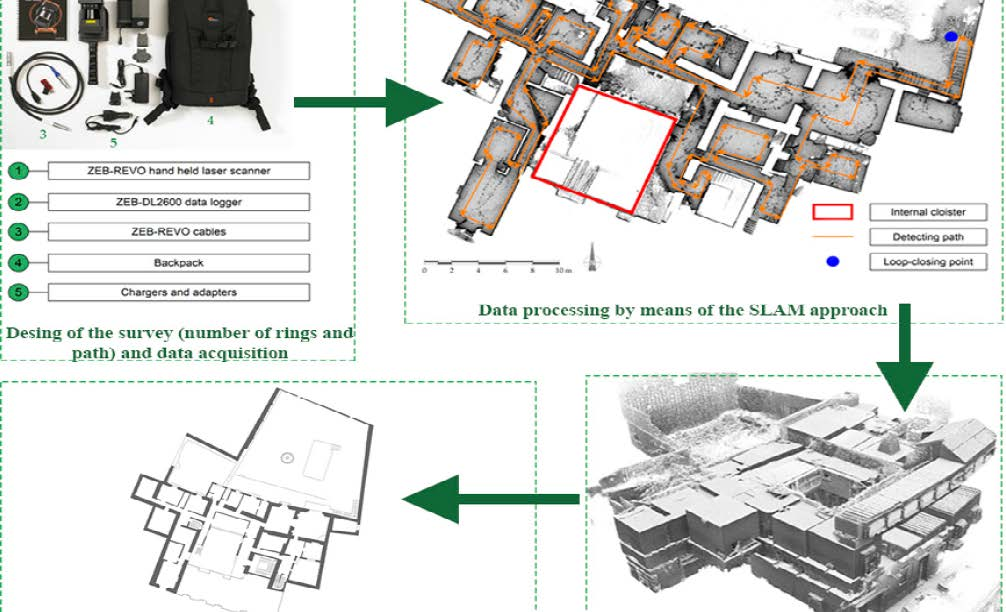
2.1. Equipment
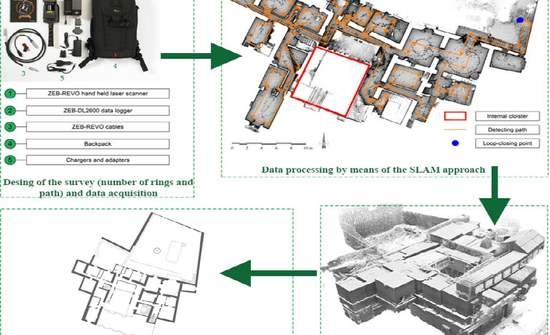
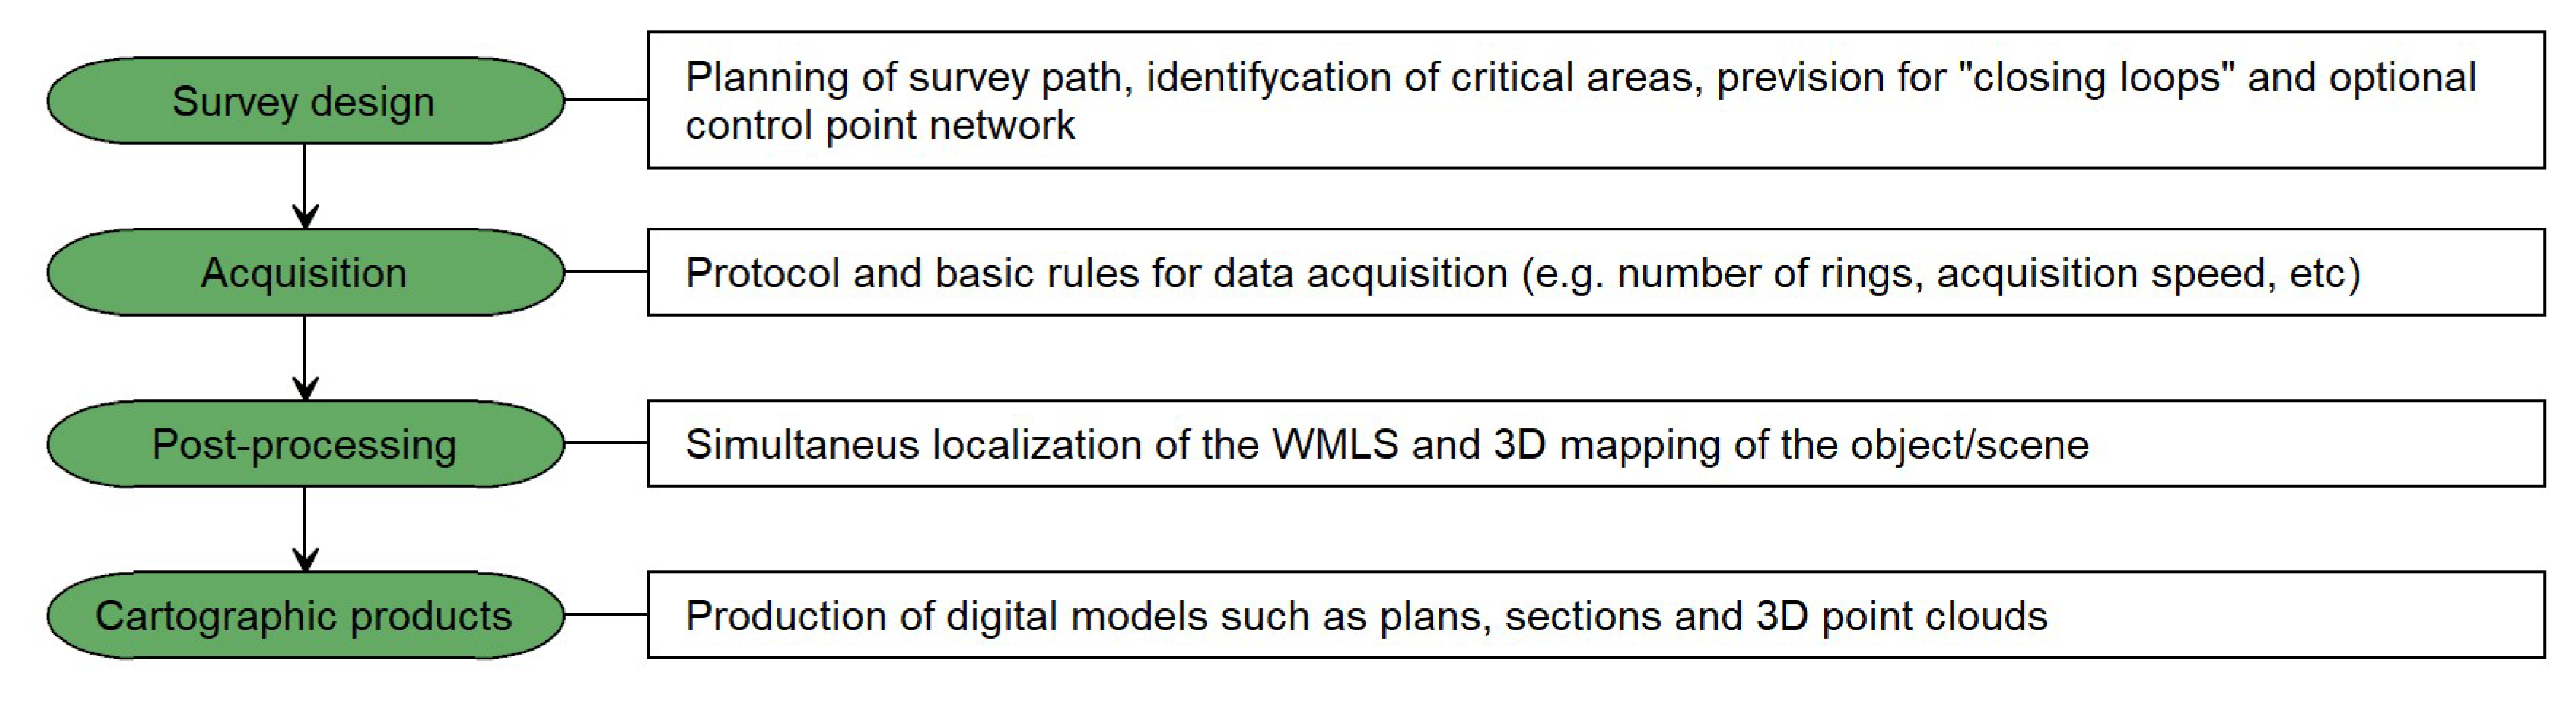
2.2. Methodology
2.2.1. Survey Design
- Improve the background with additional references (e.g., boxes in a corridor or a parked vehicle in an open field);
- ensure that those limited features are scanned repeatedly as you move through the scene by pointing the WMLS in their direction. As a result, more measurement points will define the element, assuring its use as reference during the post-processing;
- avoid acquiring moving objects (e.g., passing pedestrians or vehicles) since the SLAM algorithm may support on them as static features.
2.2.2. Acquisition
- Inspect the site of interest in advance in order to identify critical areas not detected during planning and remove any obstacles along the way;
- make easily accessible all the connections between different rooms and floors, such as doorways or stairs, so as to ensure safe passage of the operator and avoid moving objects during the scanning;
- walk slowly in order to have a good coverage and a high-resolution data. If the forward movement is too fast there may not be enough repeated features for the SLAM algorithm to transform the raw laser data into a point cloud;
- pay attention to the transition areas and tight curves that must be travelled slowly, guaranteeing a period when the scanner can display features on both sides. The same care is necessary when we change from a closed space (feature rich) to an open environment (feature poor);
- split large surveys into more than one scan mission. This is to avoid big file sizes as well as to reduce any drift effect and thus error propagation that might be created in the SLAM data. It is recommended that each scan mission is limited to 30 min [34].
2.2.3. Post-Processing: The Generation of the 3D Point Cloud
- The first step identified corresponding surface patches from the laser point cloud. The patches were determined by spatially decomposing the scene into a multiresolution voxel grid, controlled by the “voxel density” parameter; increasing it caused the algorithm to use smaller voxels. Clusters of laser points that were both spatially and temporally proximal were identified and used to compute surface properties based on the centralized second-order matrix of the point coordinates [33]. The surface normal was obtained from the eigenvector corresponding to the minimum eigenvalue of the second-order matrix. The surface planarity, computed from the ratio of the eigenvalues, was used to discard elements that were not approximately planar. These properties were used to establish a first registration of the segments. During this stage, the following constrains were applied: (i) a filter for retaining only reciprocal correspondences and (ii) several boundary conditions that ensured continuity with the previous segment [33].
- In the second step, the estimated trajectory between two proximal surfaces was refined, minimizing the errors between matching surfaces and deviations from the measured IMU accelerations and rotational velocities. During this process, the following elements were considered into a cost-function (function to be minimized): (i) surface element match errors, (ii) IMU measurement deviations, and (iii) initial condition constraints. It is worth mentioning that the consideration of the IMU measurements ensured the estimated trajectory was smooth. The above terms of the cost-function were non-linear with respect to the rotational correction. Taking this into consideration, the algorithm used a linearization of the system by means of the Taylor expansion.
2.2.4. Cartographic Products Generation
3. Results
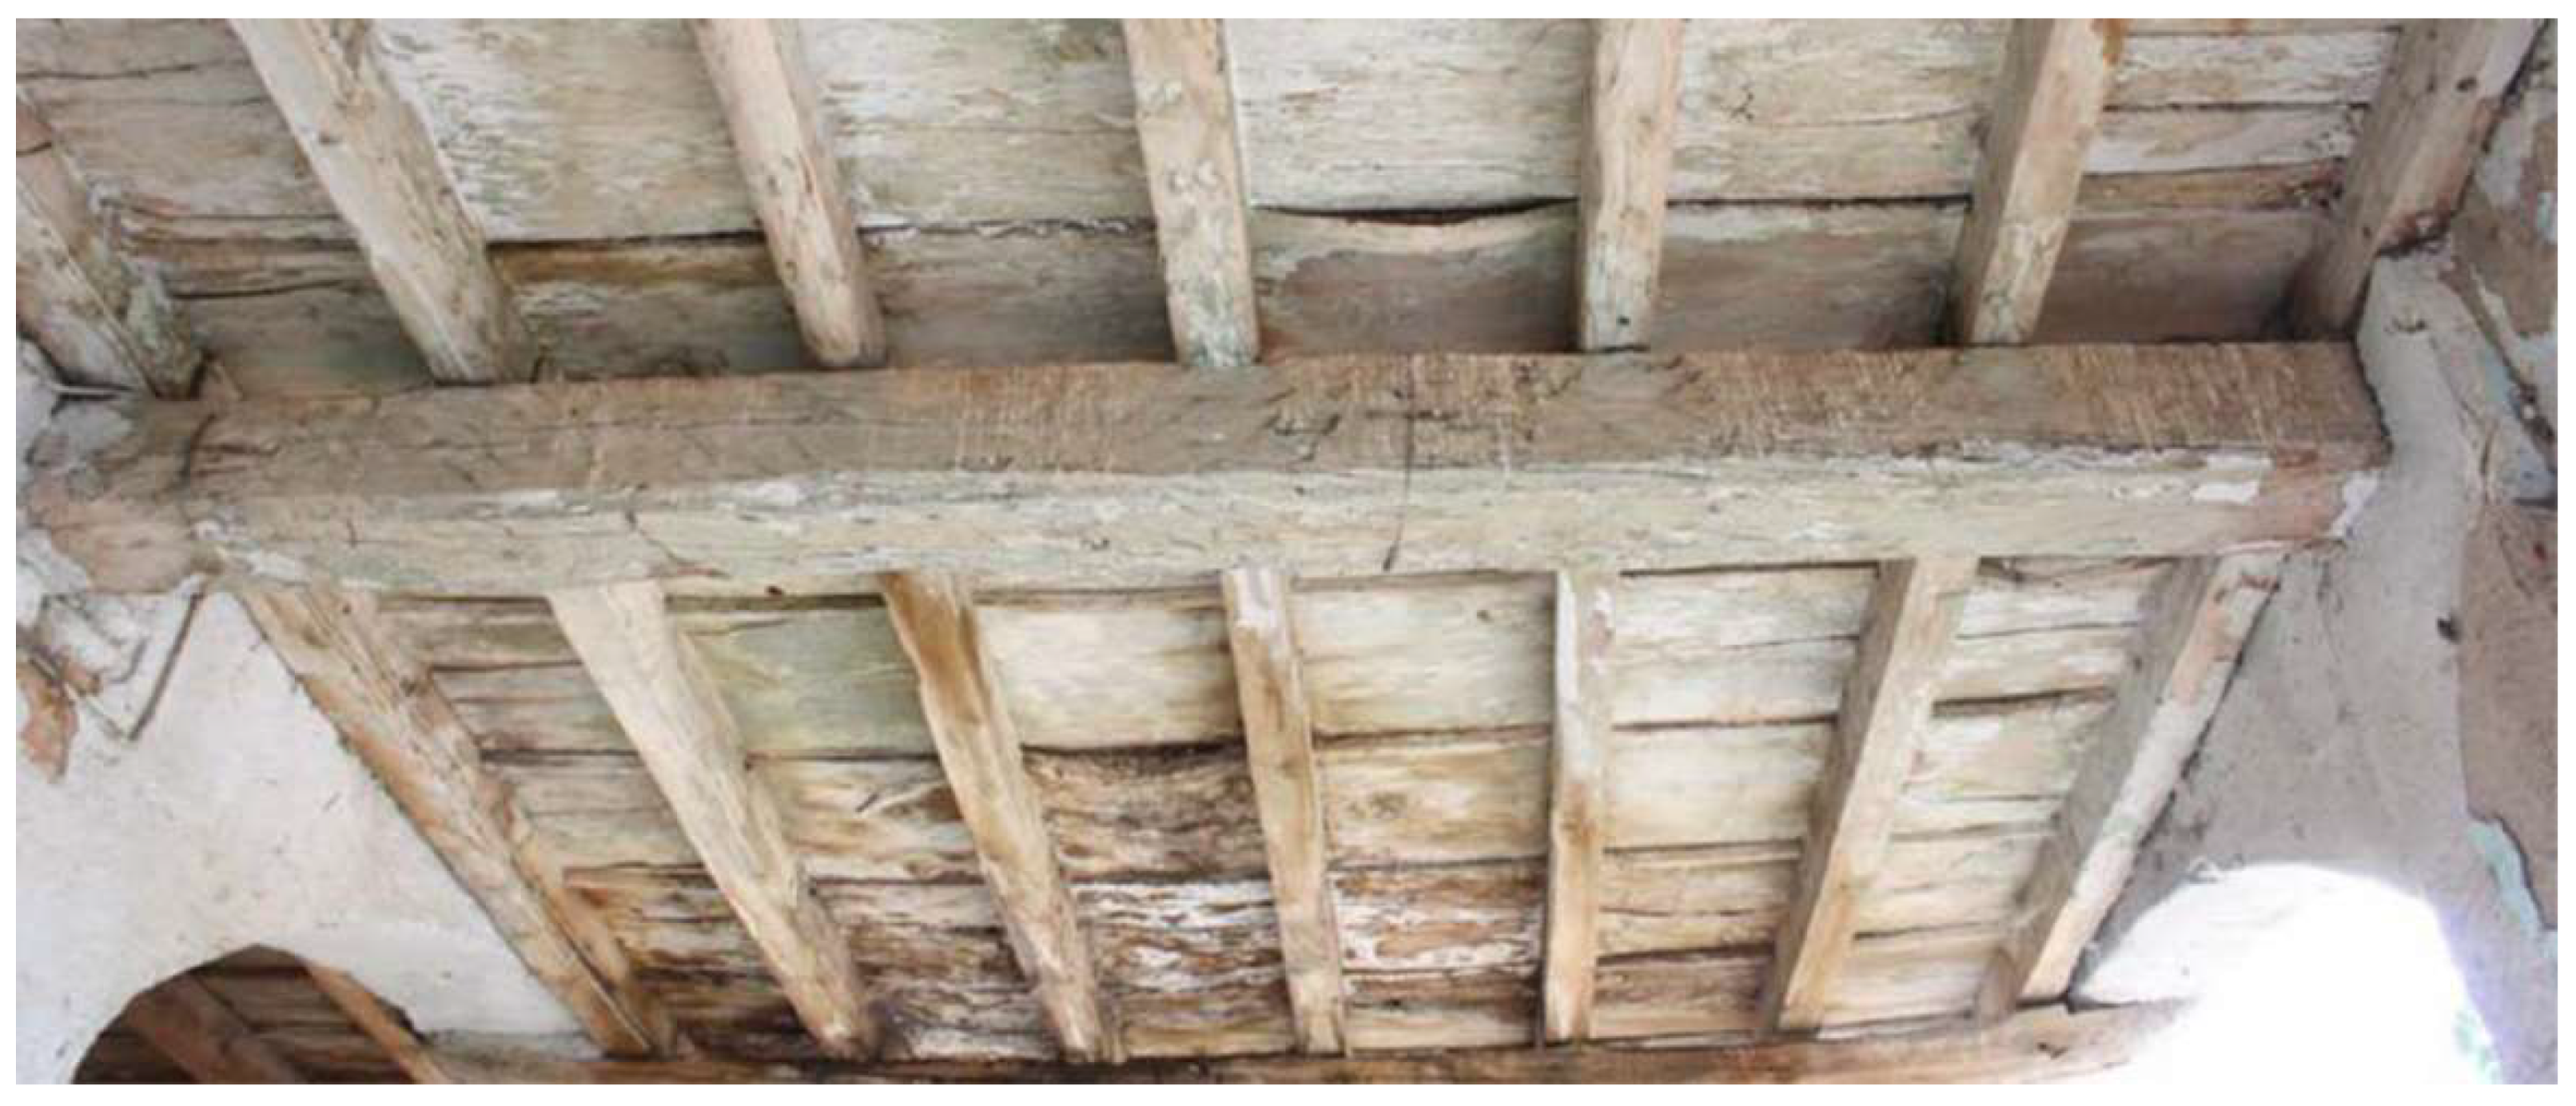
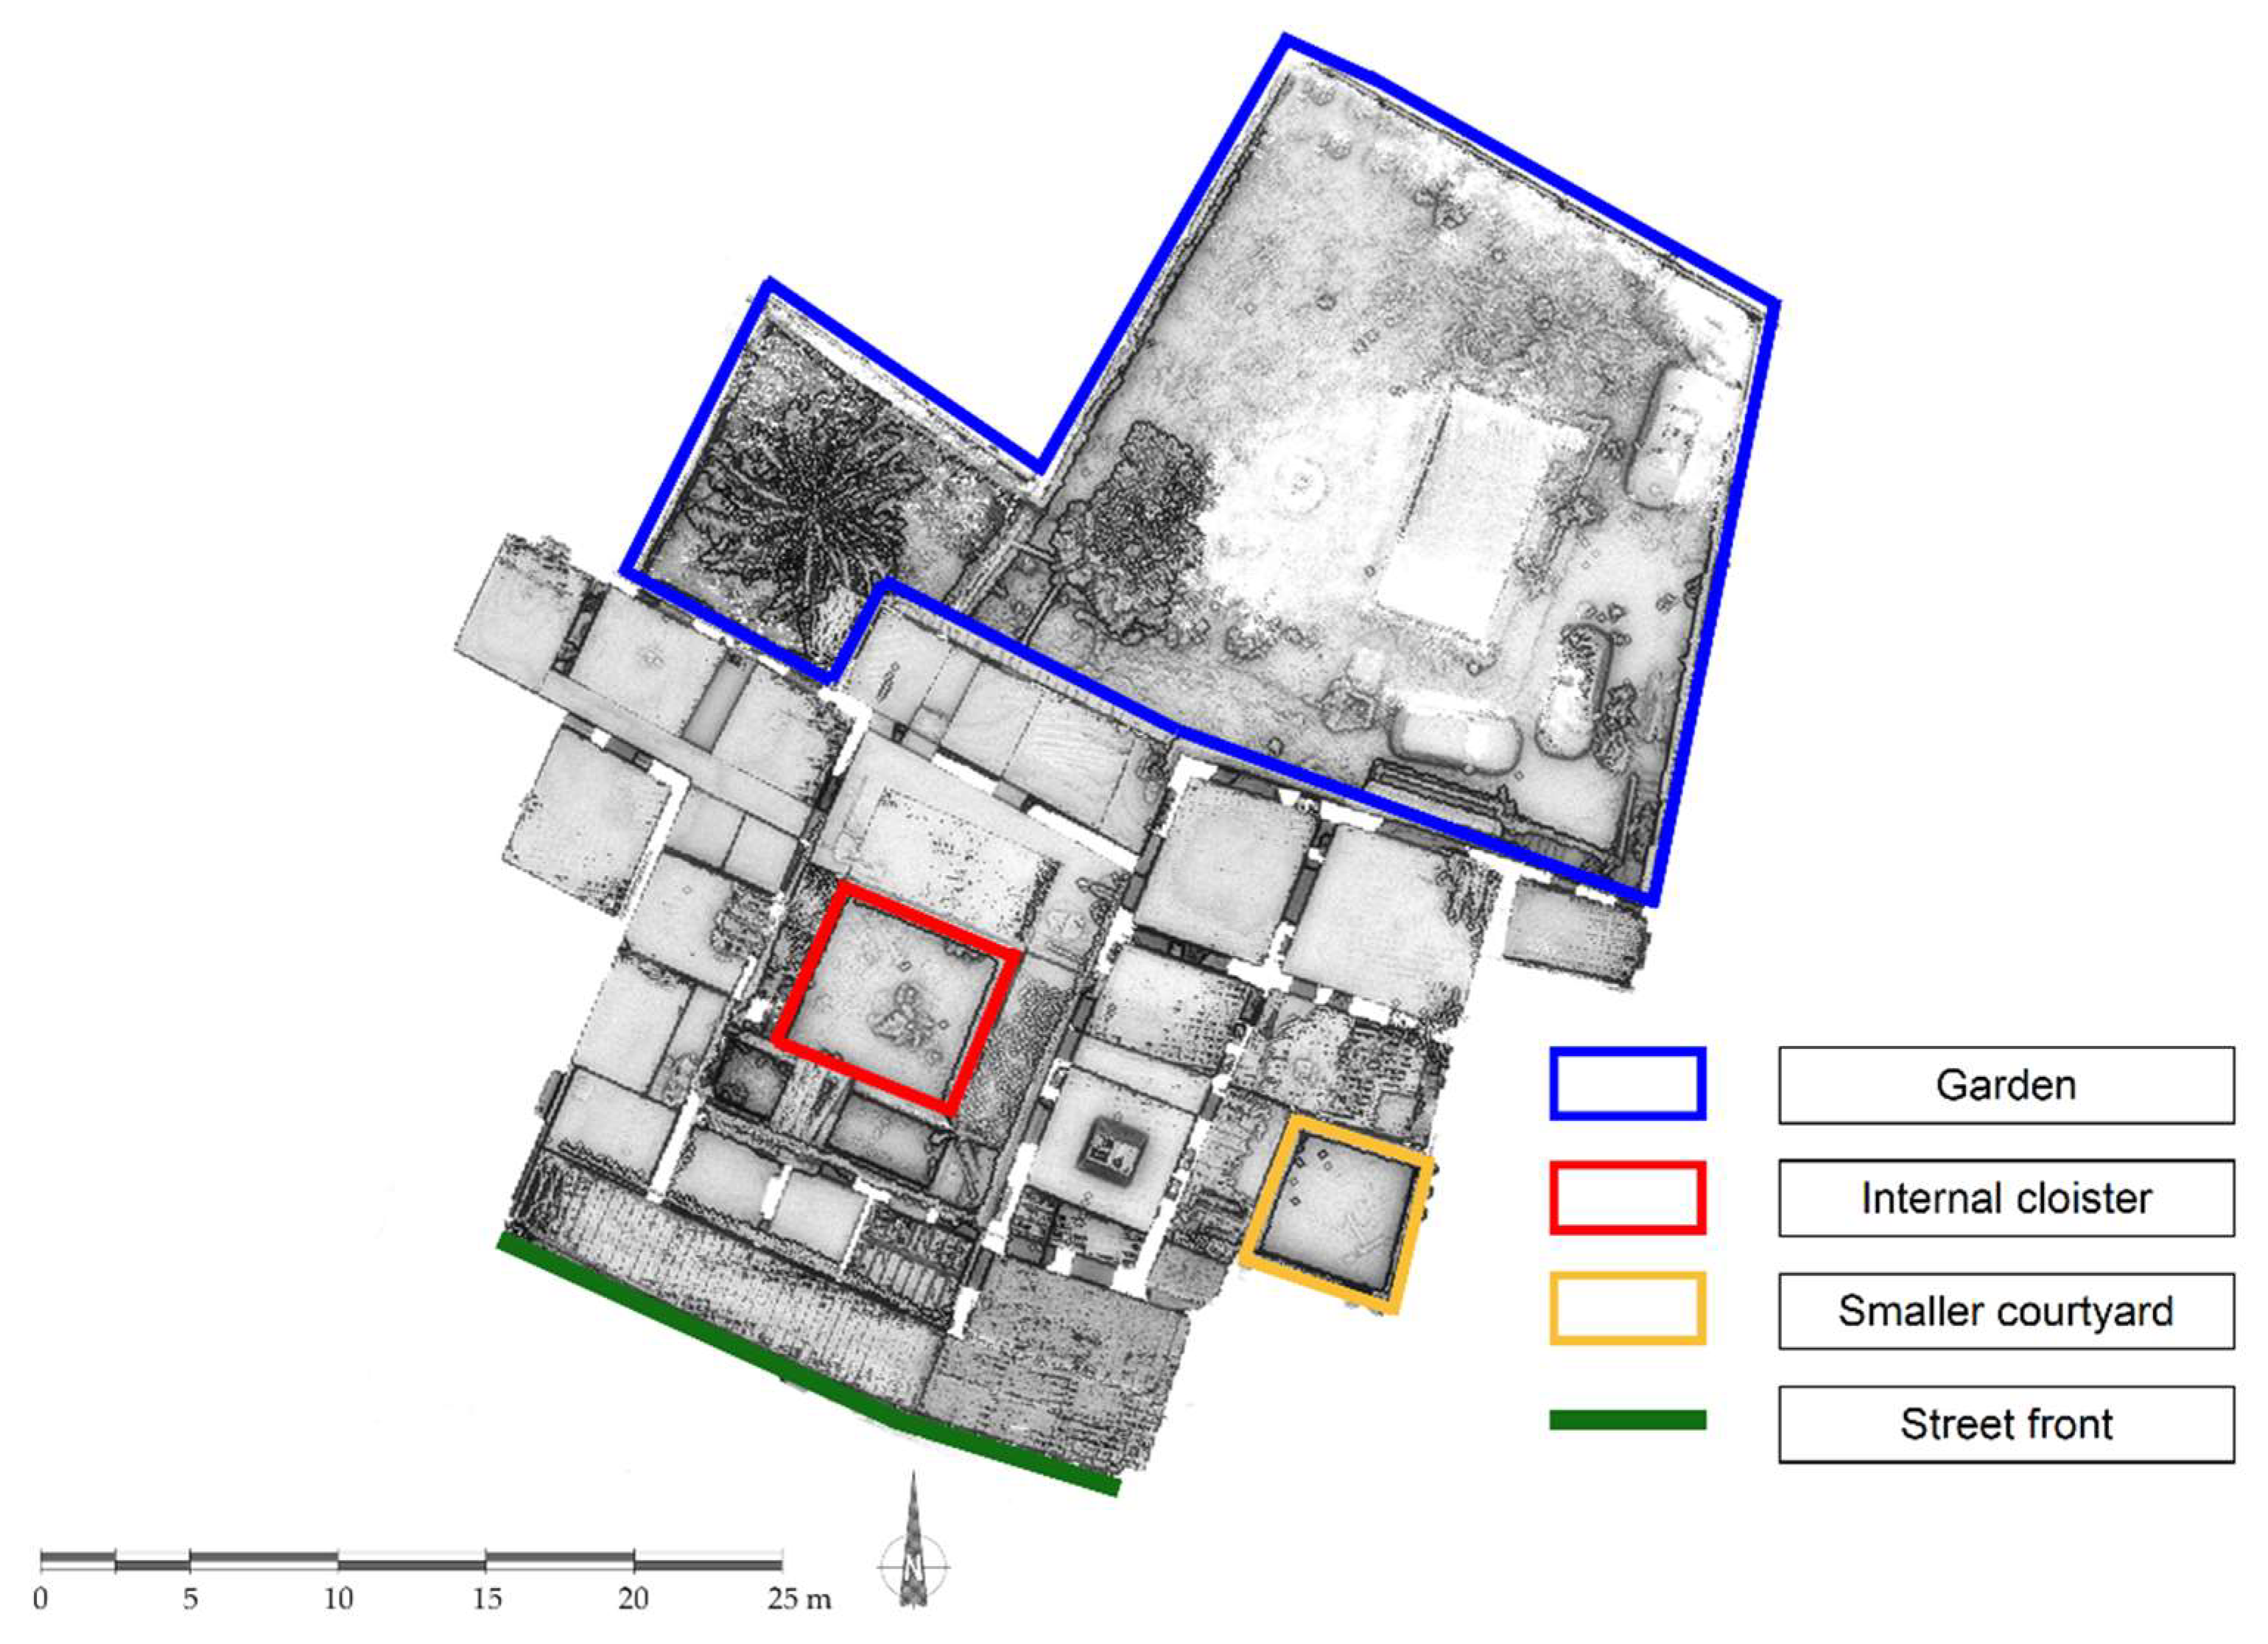
3.1. Case Study: An XV Century Palace
3.2. Mission Planning
- path 1 includes interior rooms, the main cloister, and a minimal part of the garden;
- path 2 includes interior rooms, the main cloister, and a part of the garden and a linear gallery;
- path 3 includes interior rooms, the main cloister, and the garden and the street front;
- path 4 includes interior rooms, the main cloister, and a smaller courtyard and the entire garden.
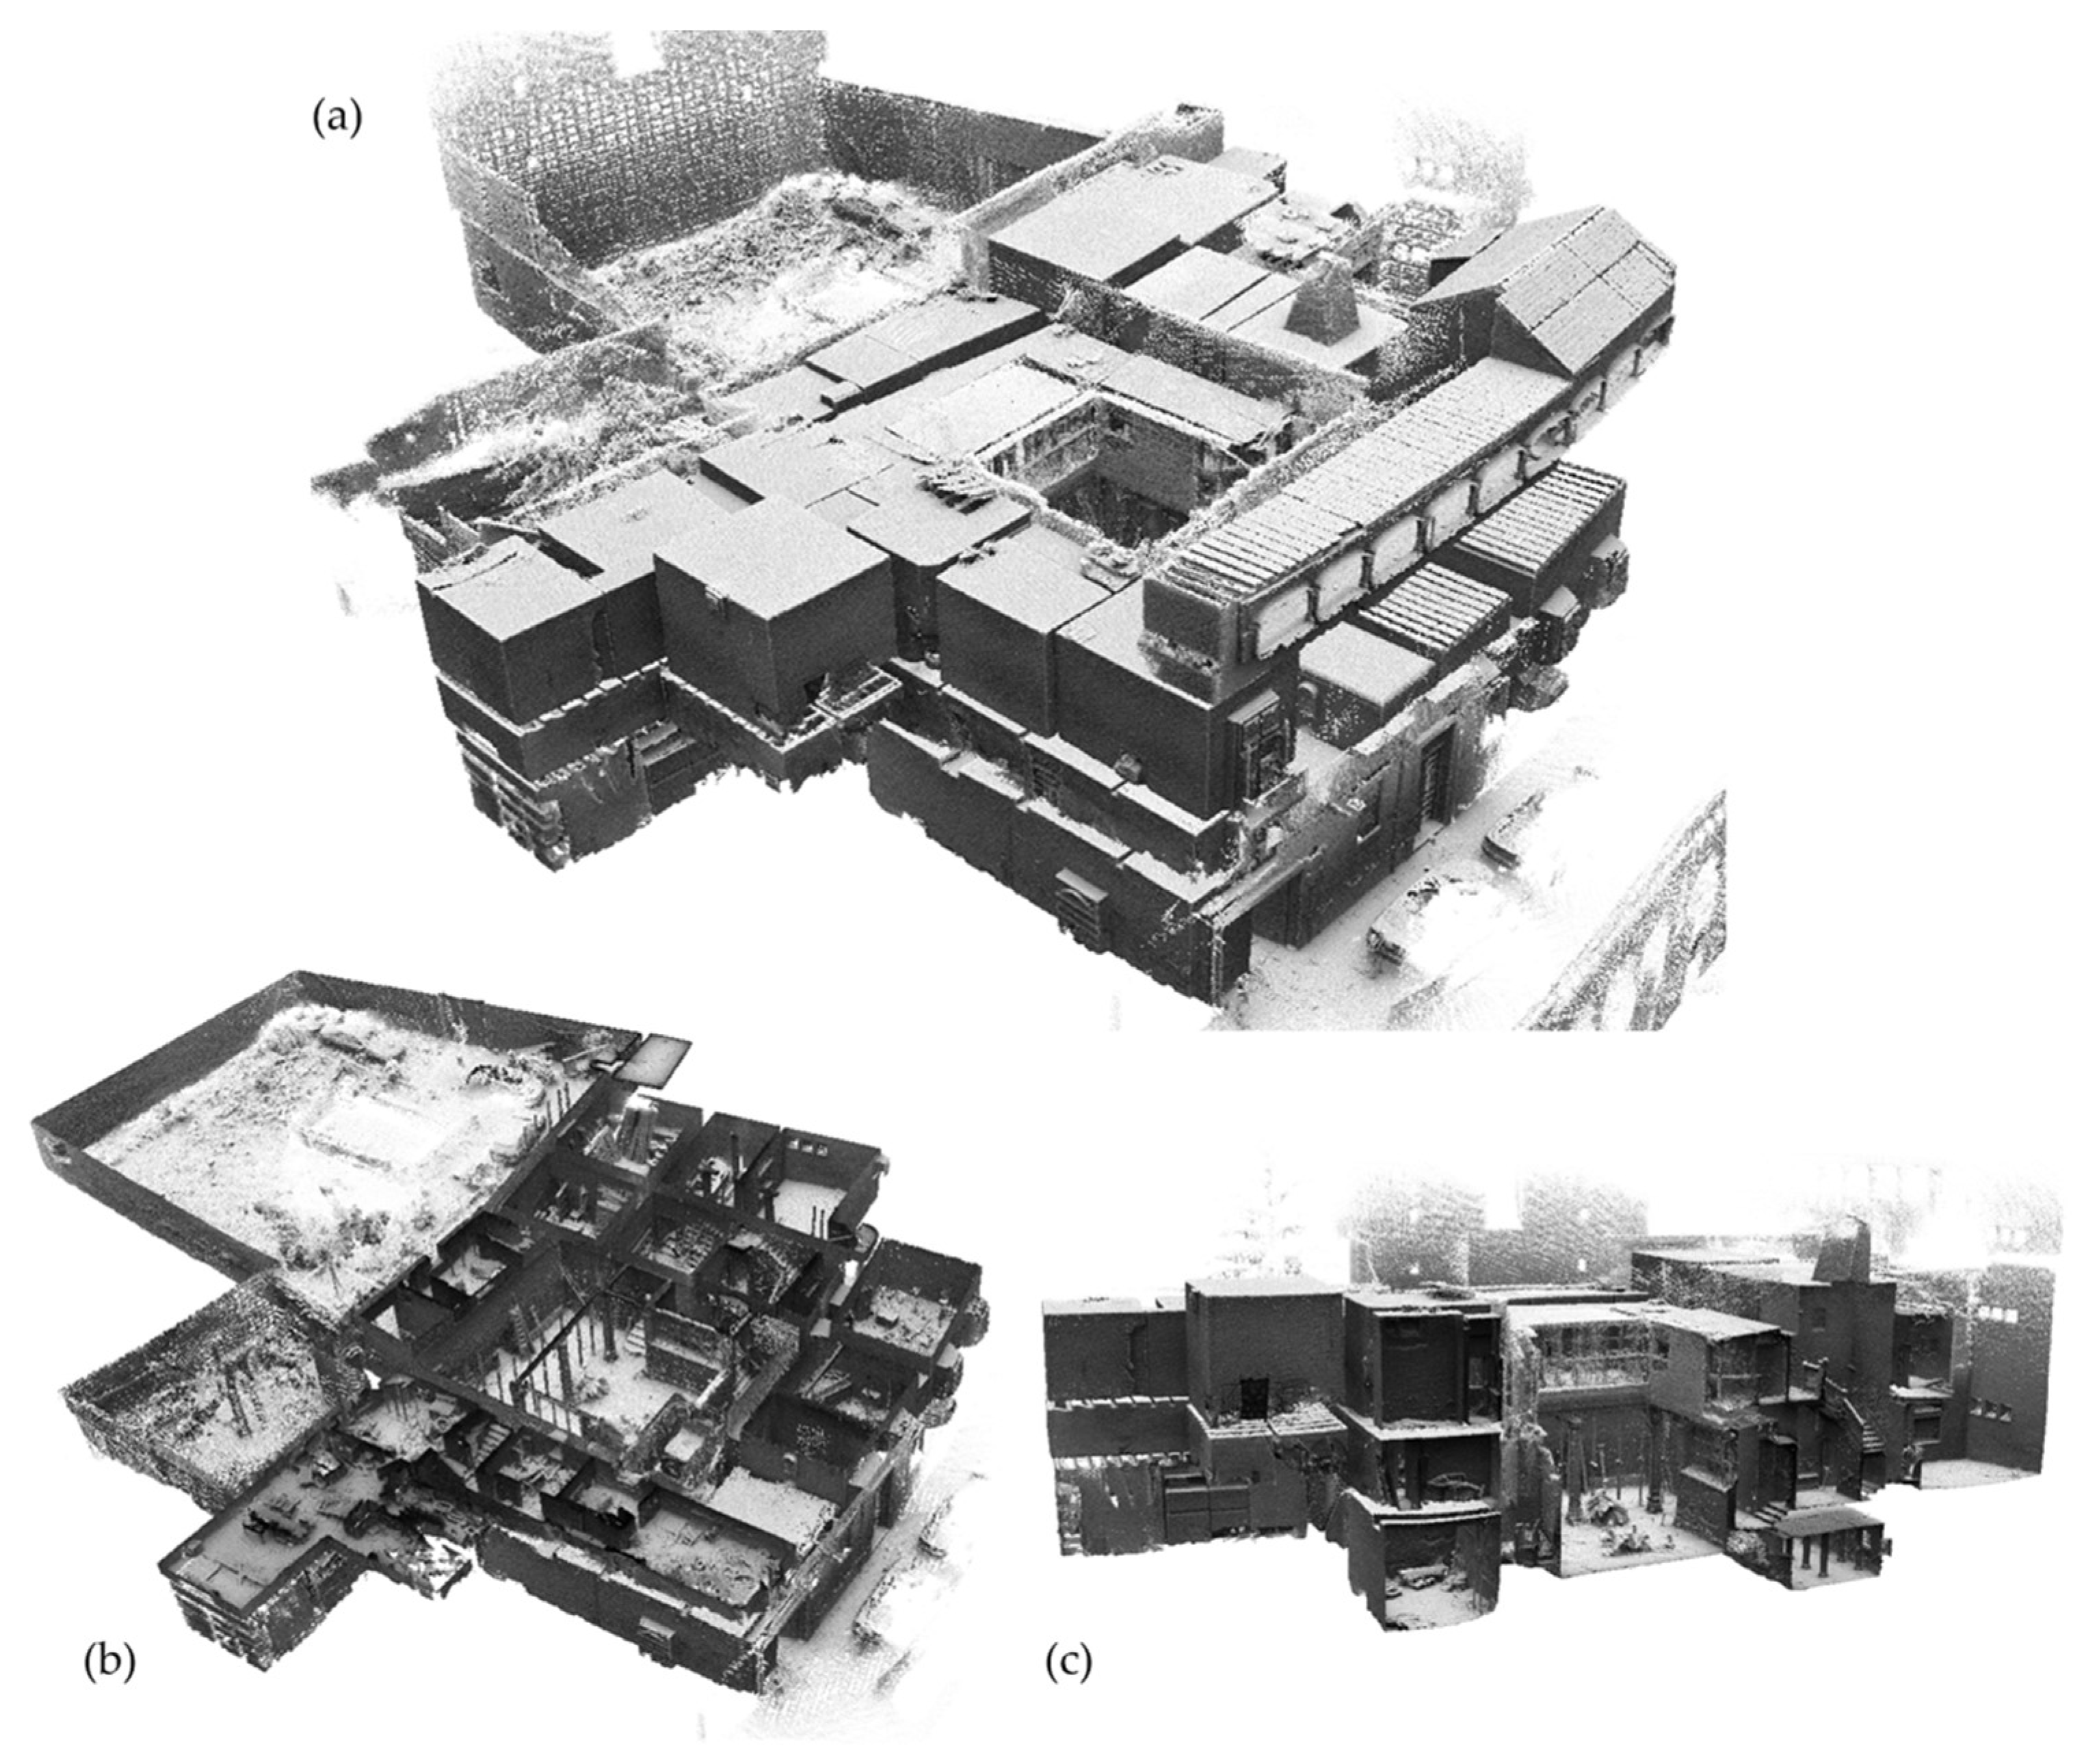
3.3. Data Processing and Registration
- The “convergence threshold,” which increased or decreased the number of iterations for each processing step during the local and global registration phases. For the case study, a low value of the parameter was chosen, guarantying a quality of data that did not require a large number of iterations;
- the “window size,” which defined the size of data samples processed by the algorithm. This helped to encompass the errors that occurred during the local registration phase. An intermediate value for this parameter was a perfect compromise between model quality and required hardware resources;
- the option “prioritize planar surfaces” was used for the case study and considered with very planar surfaces during the global registration phase. This helped to improve the global registration of very large data sets, common in the case of indoor mapping.
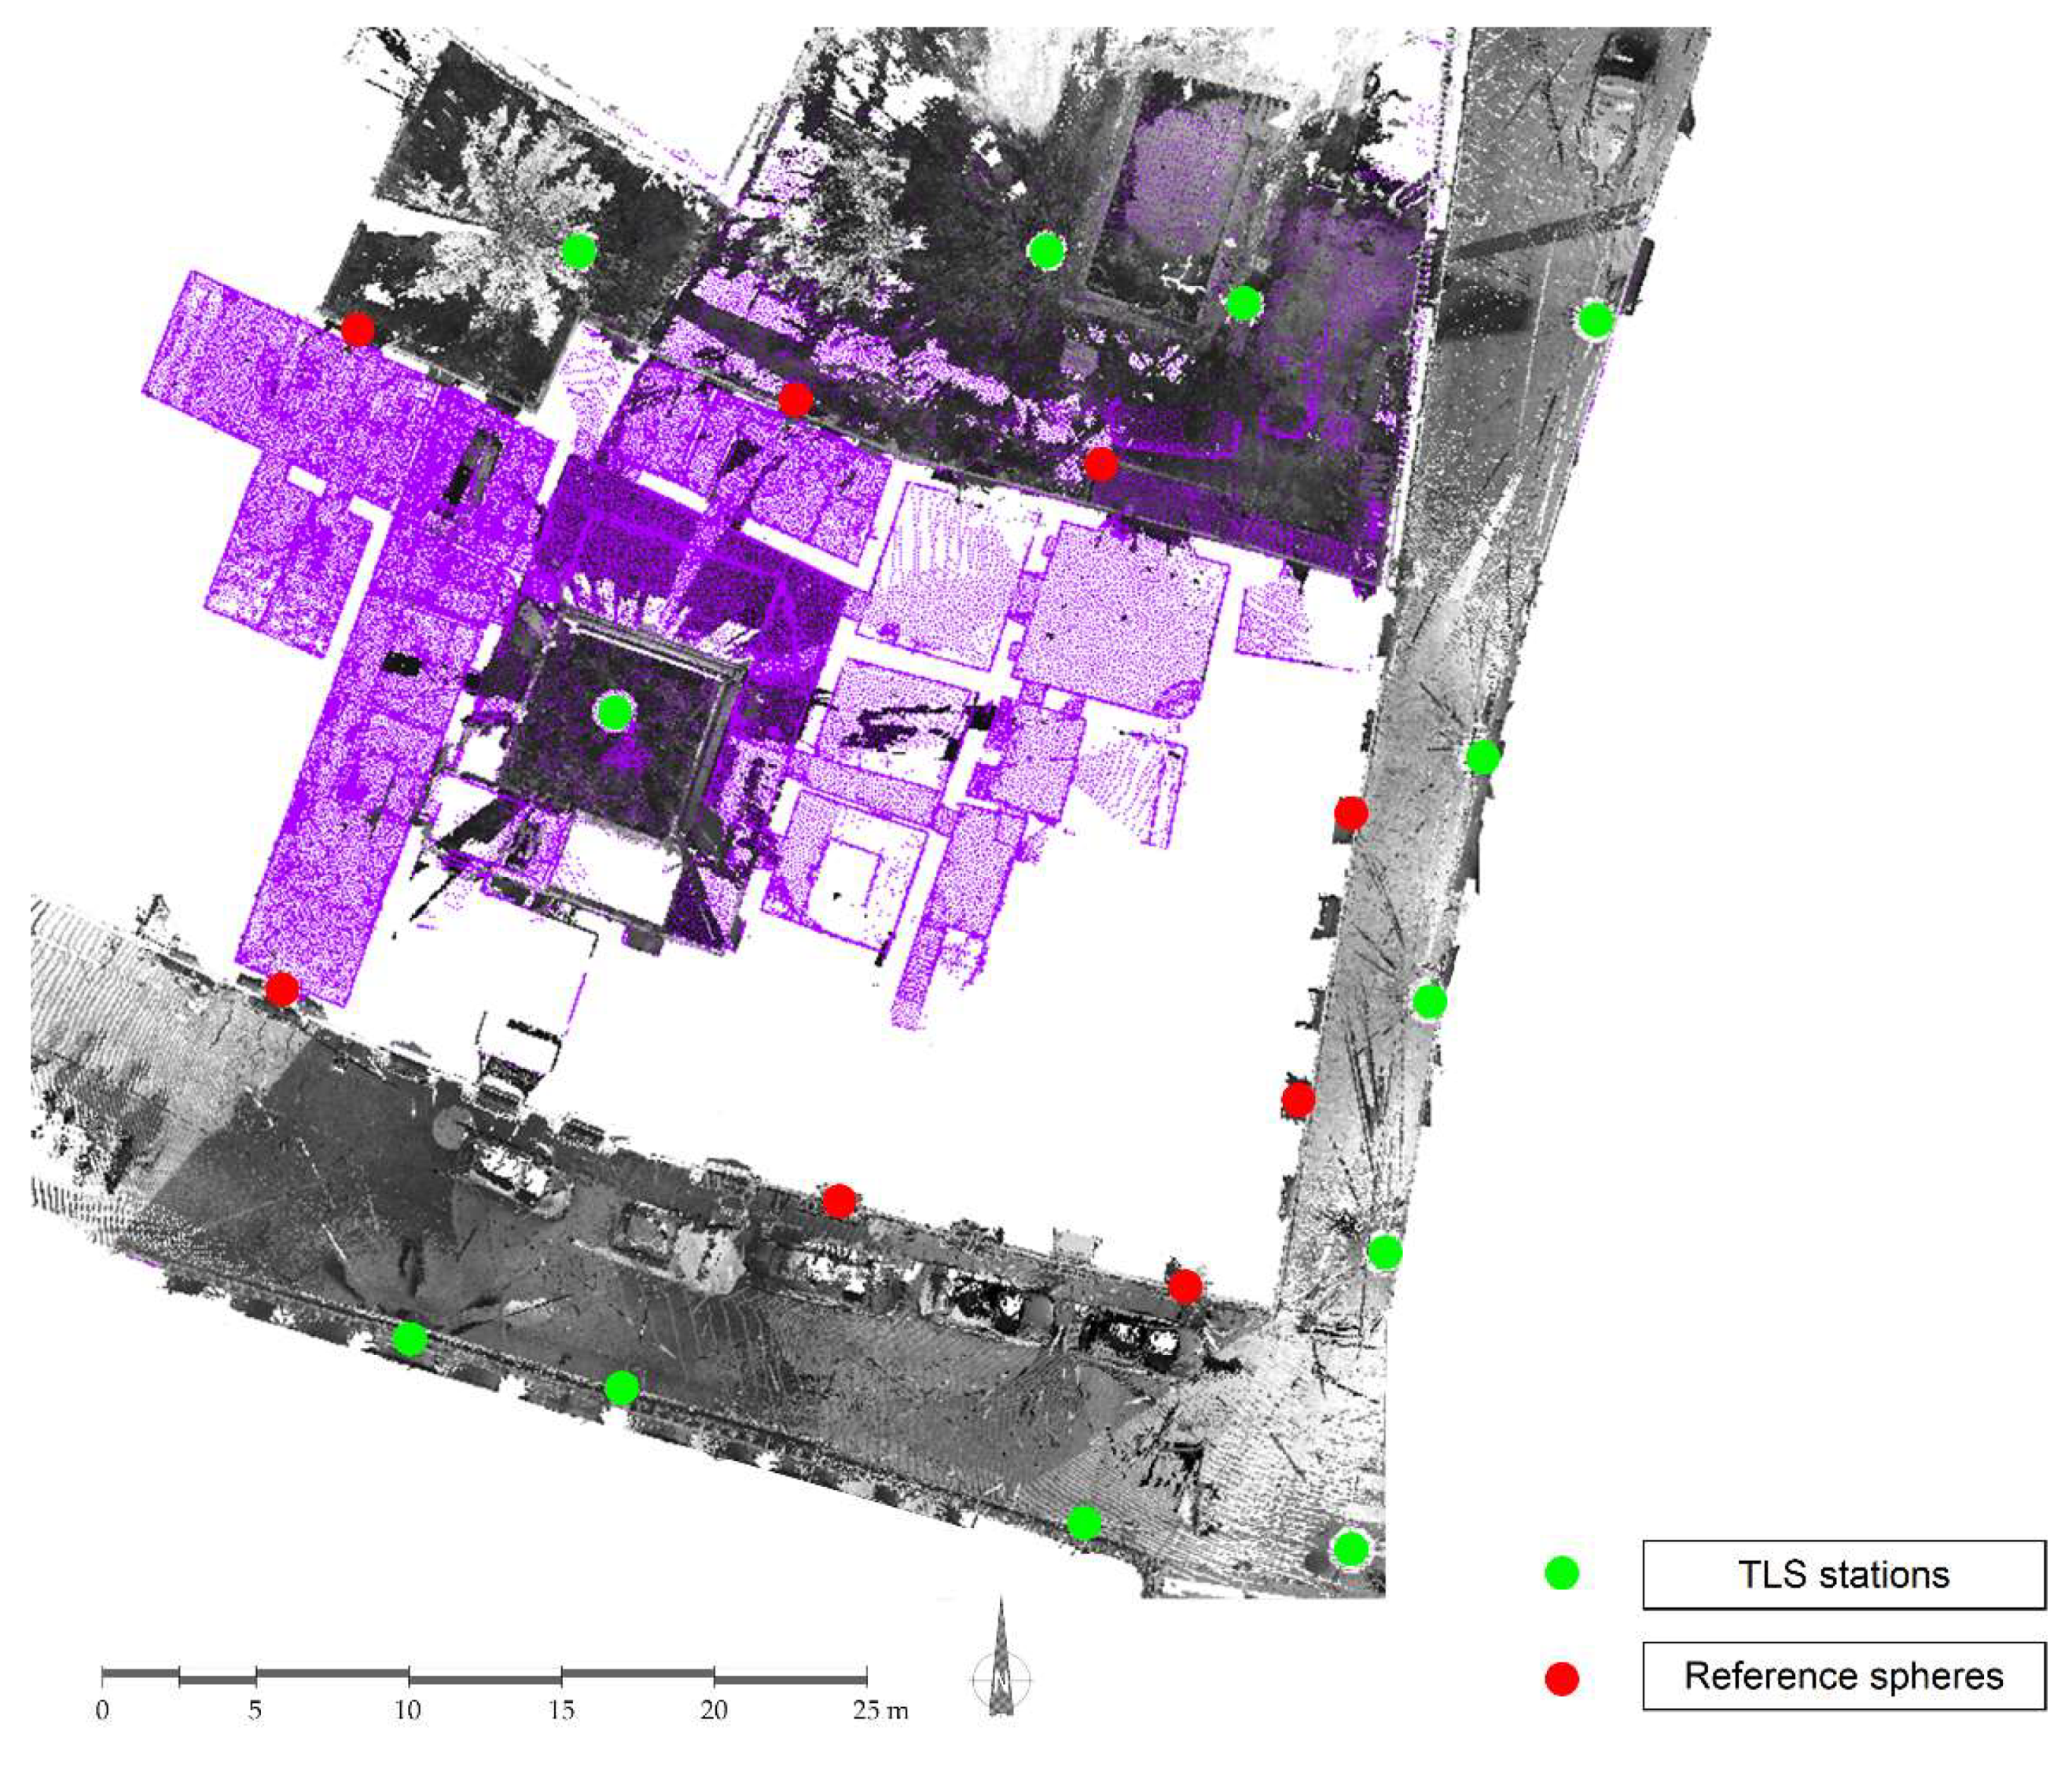
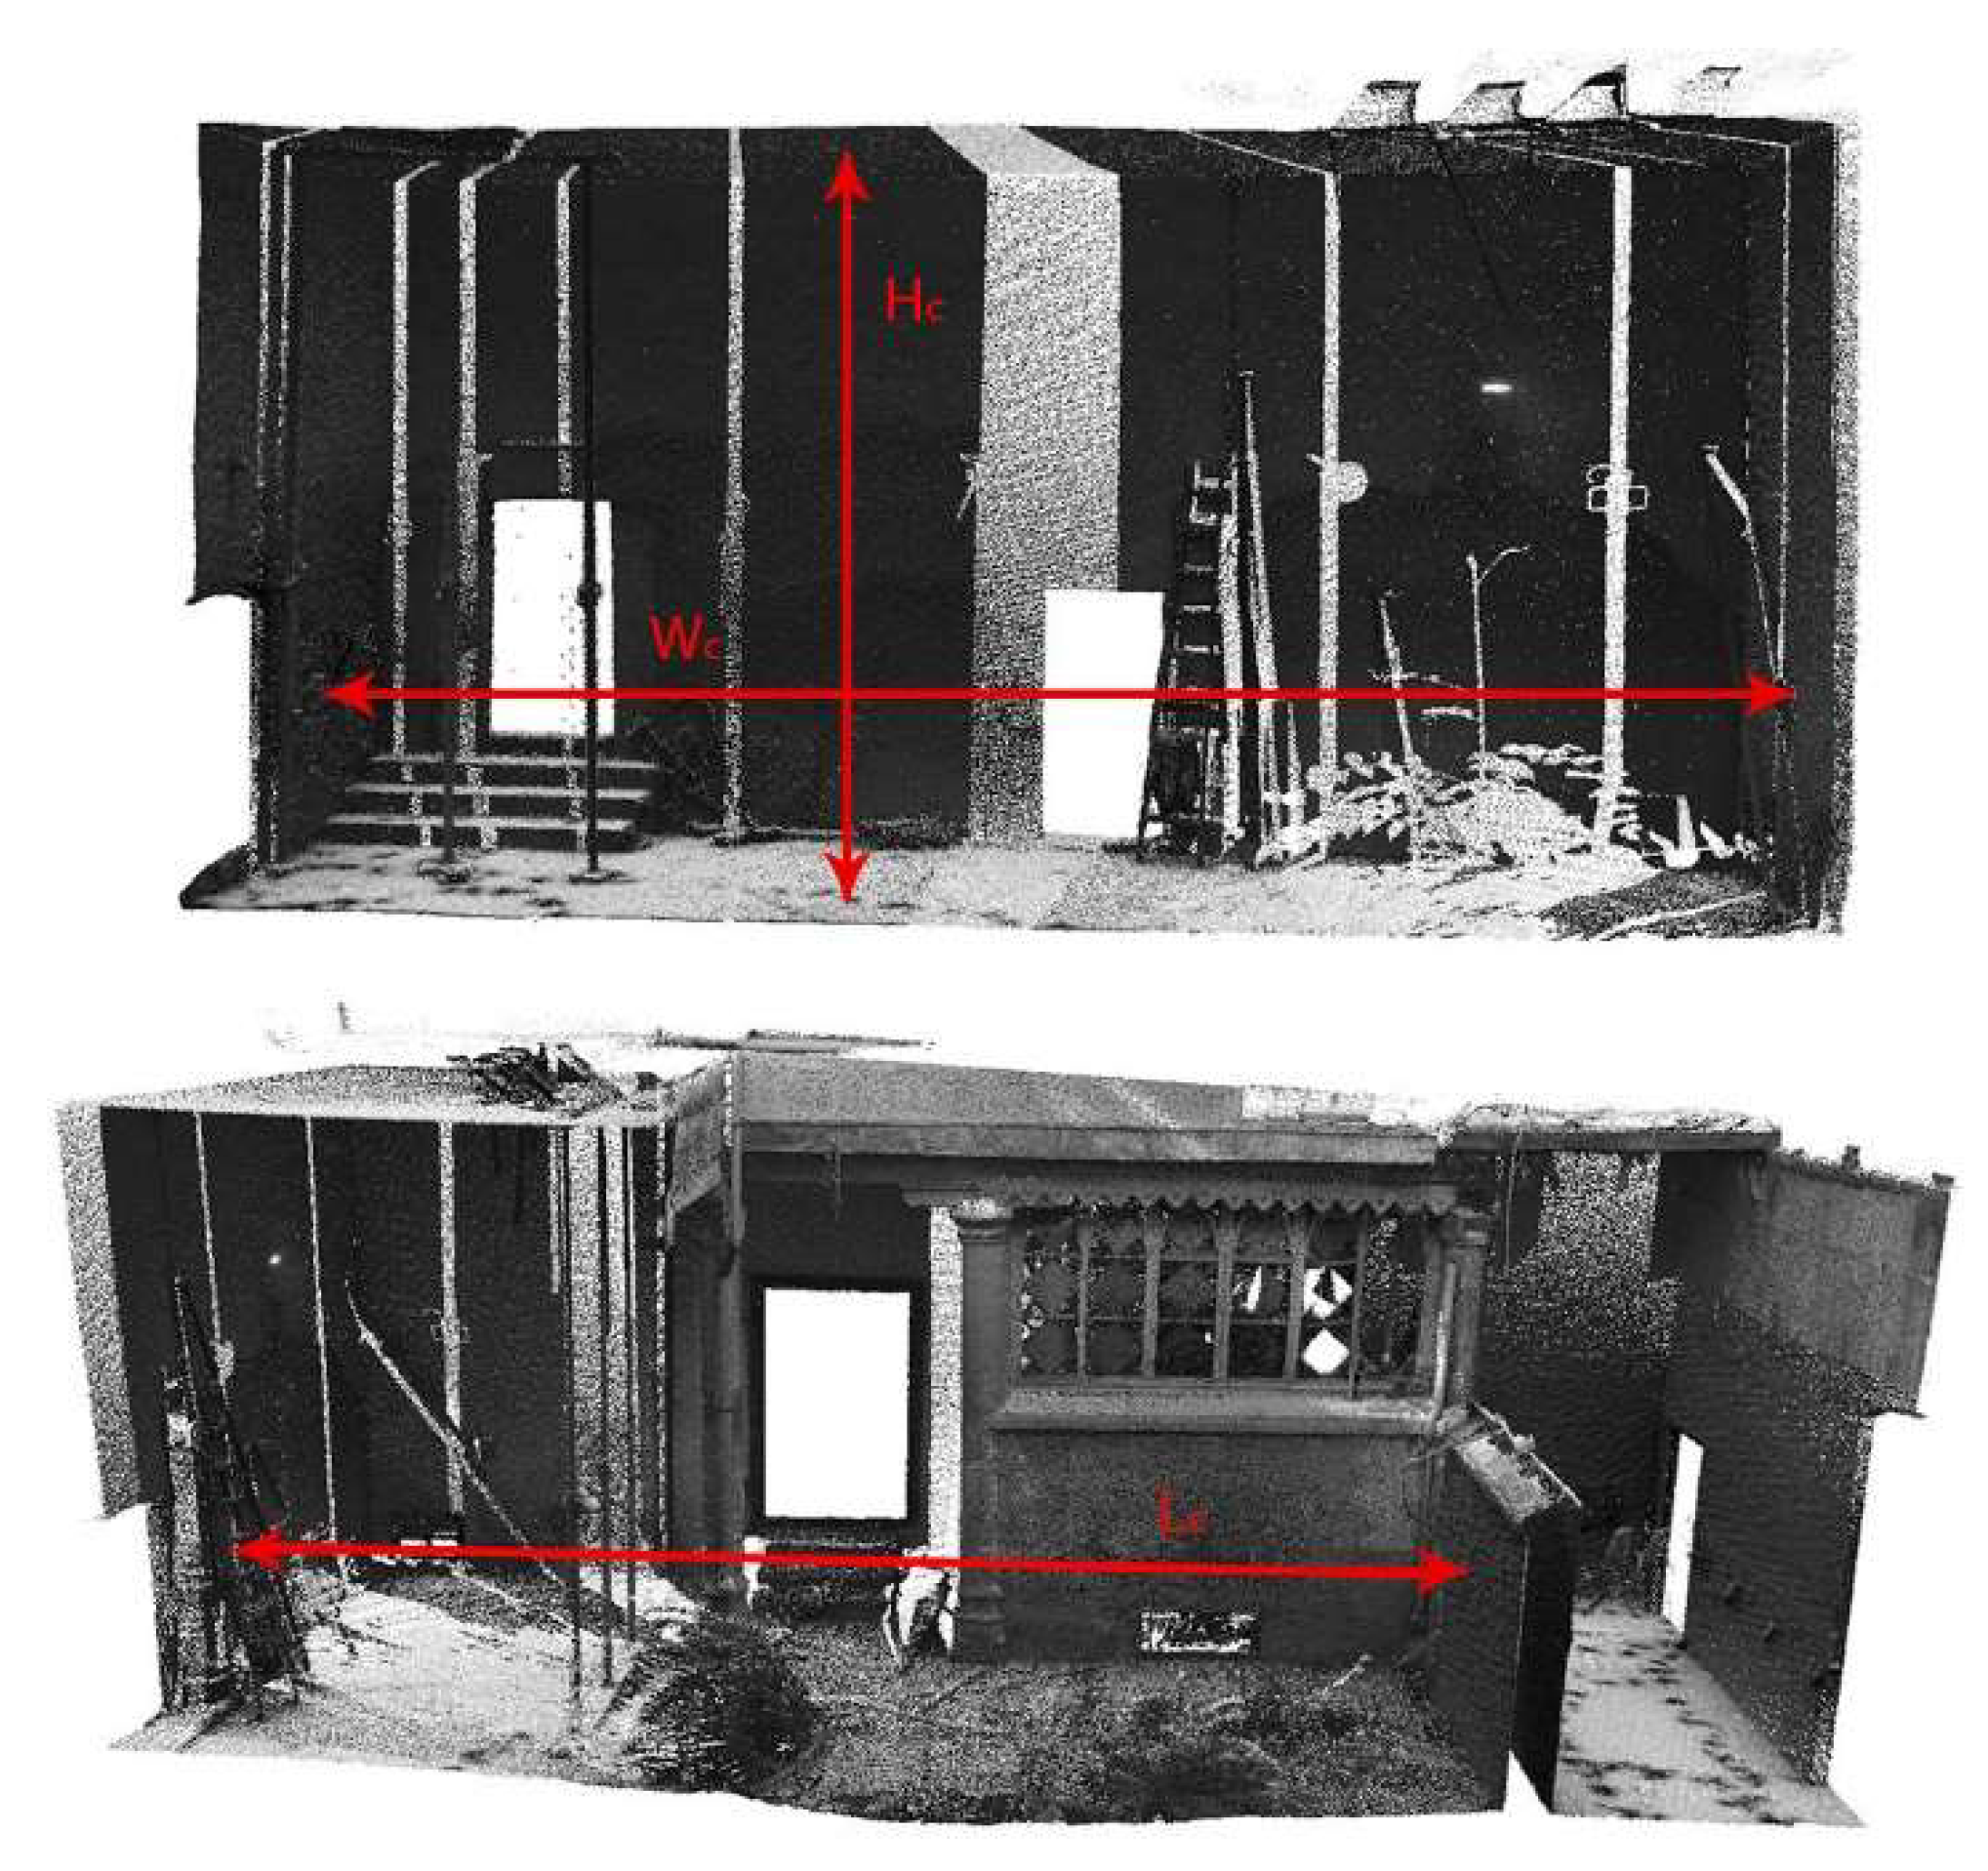
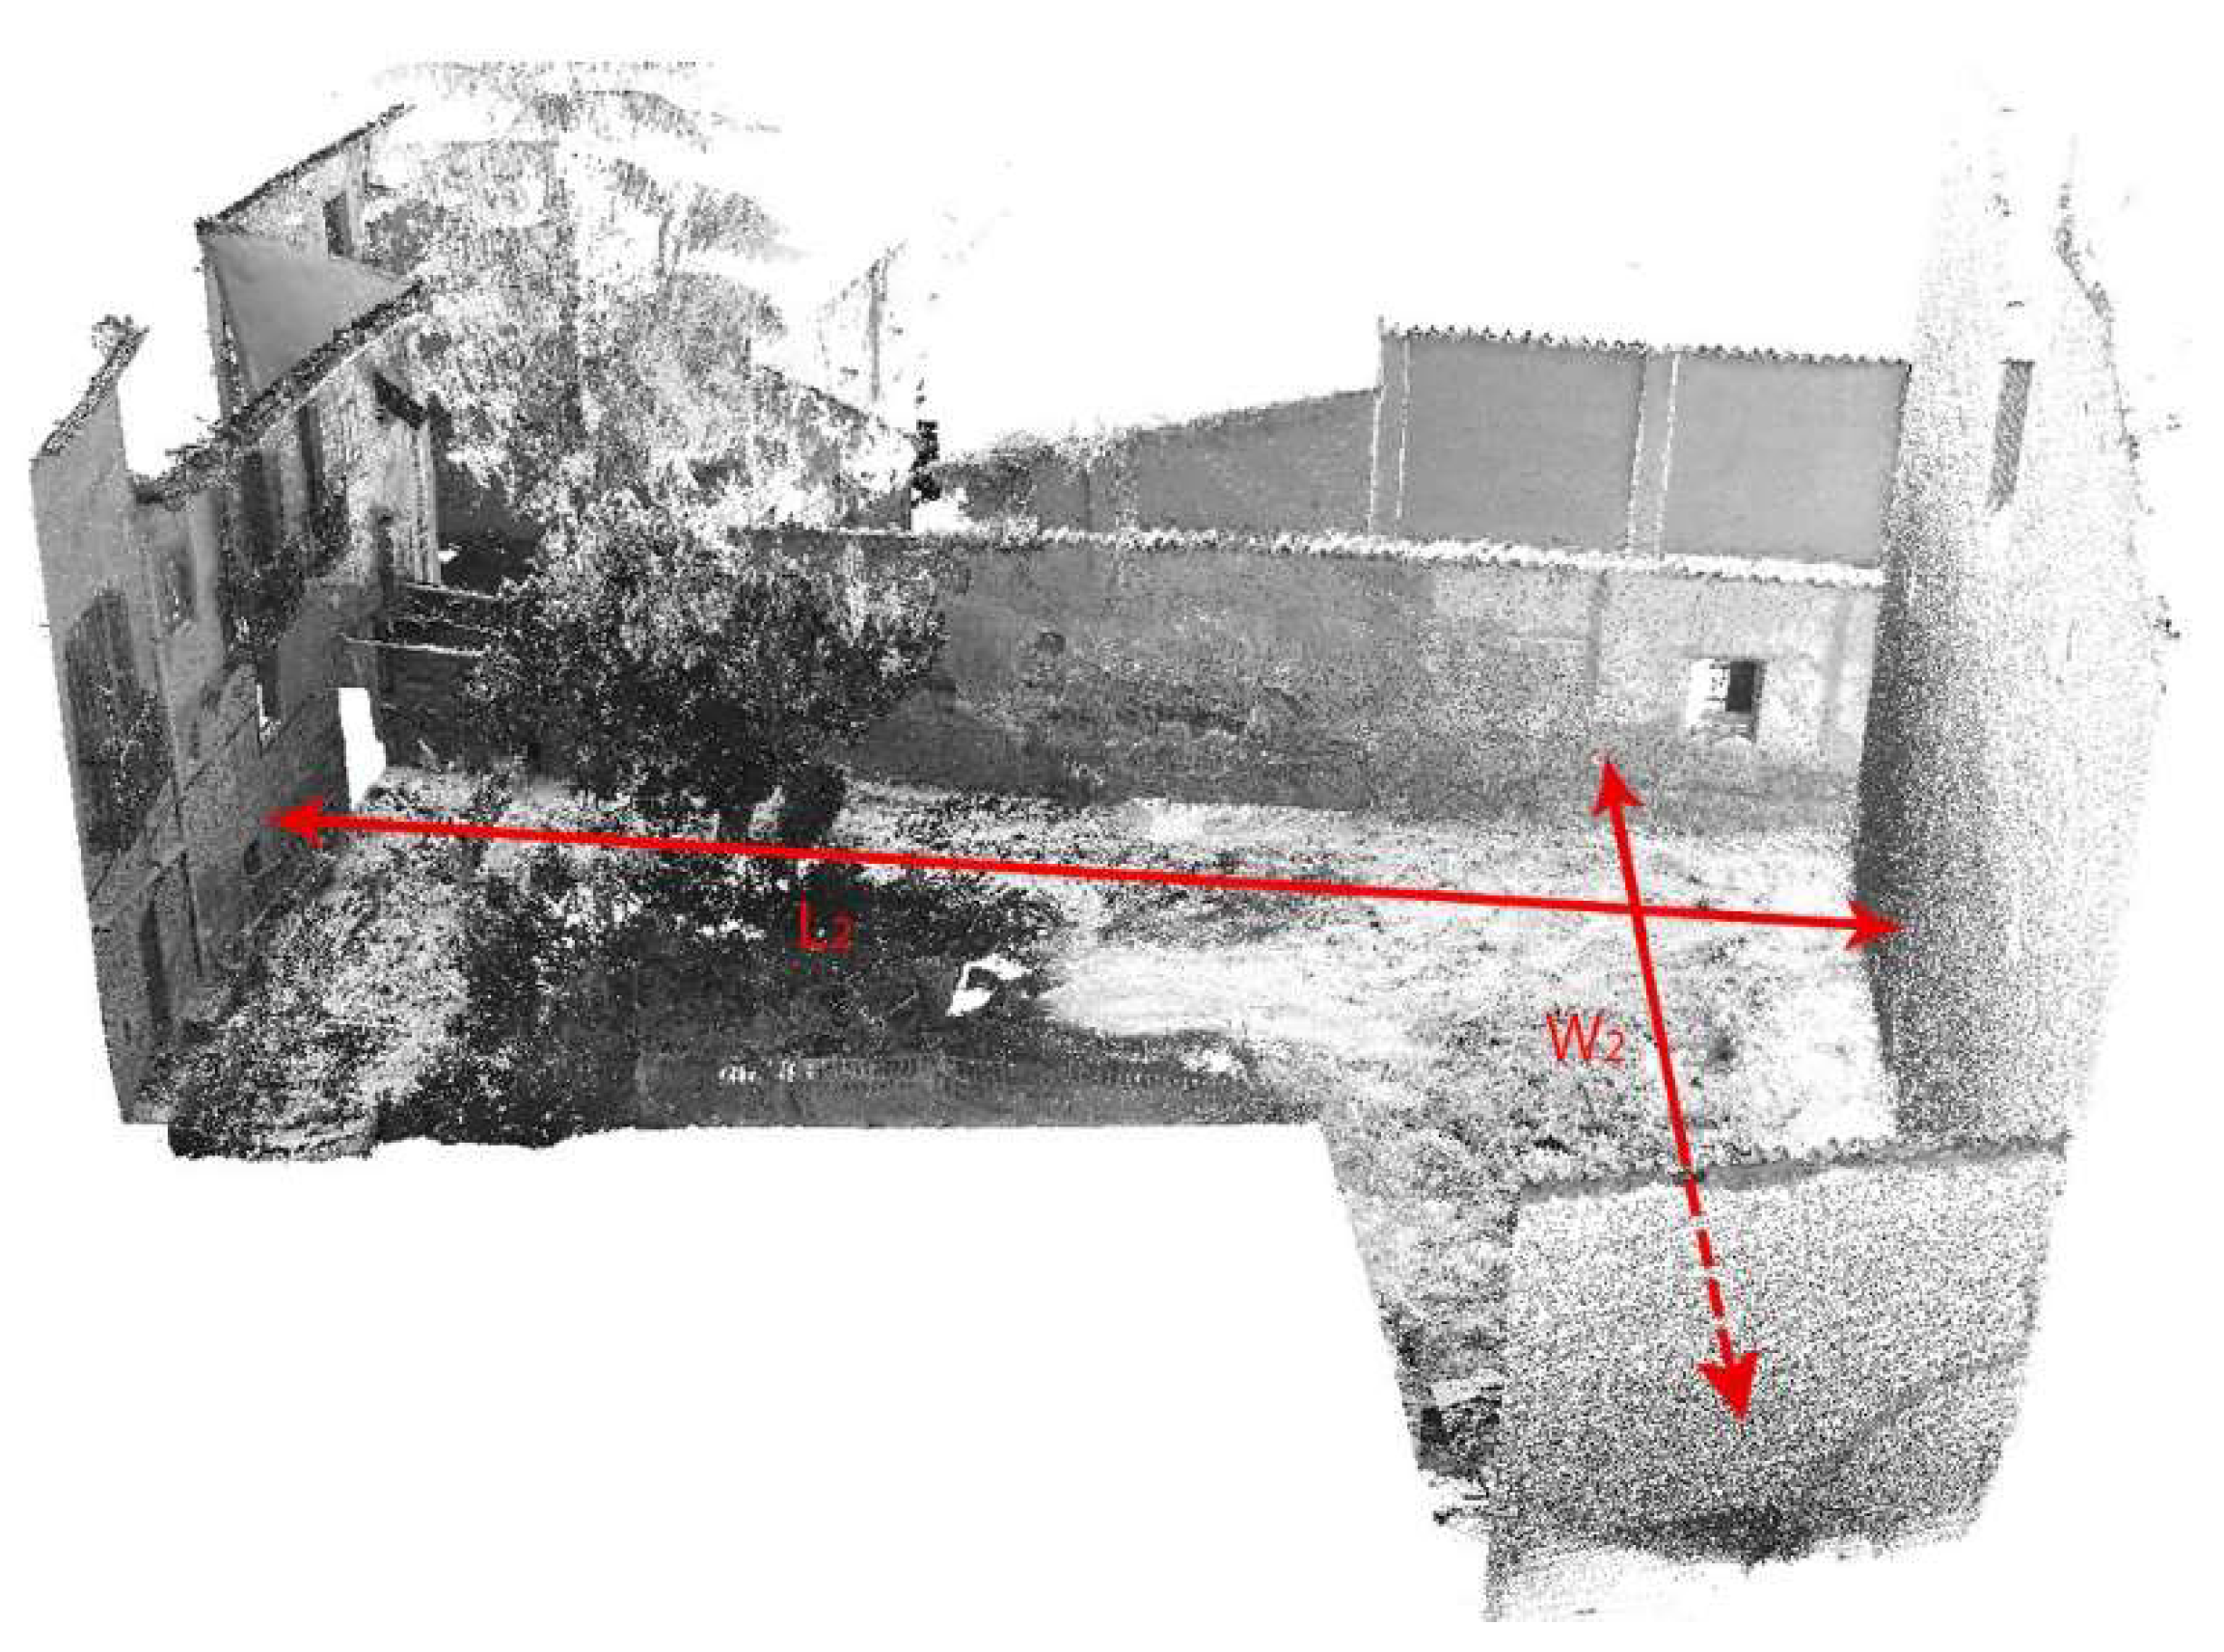
3.4. System Validation
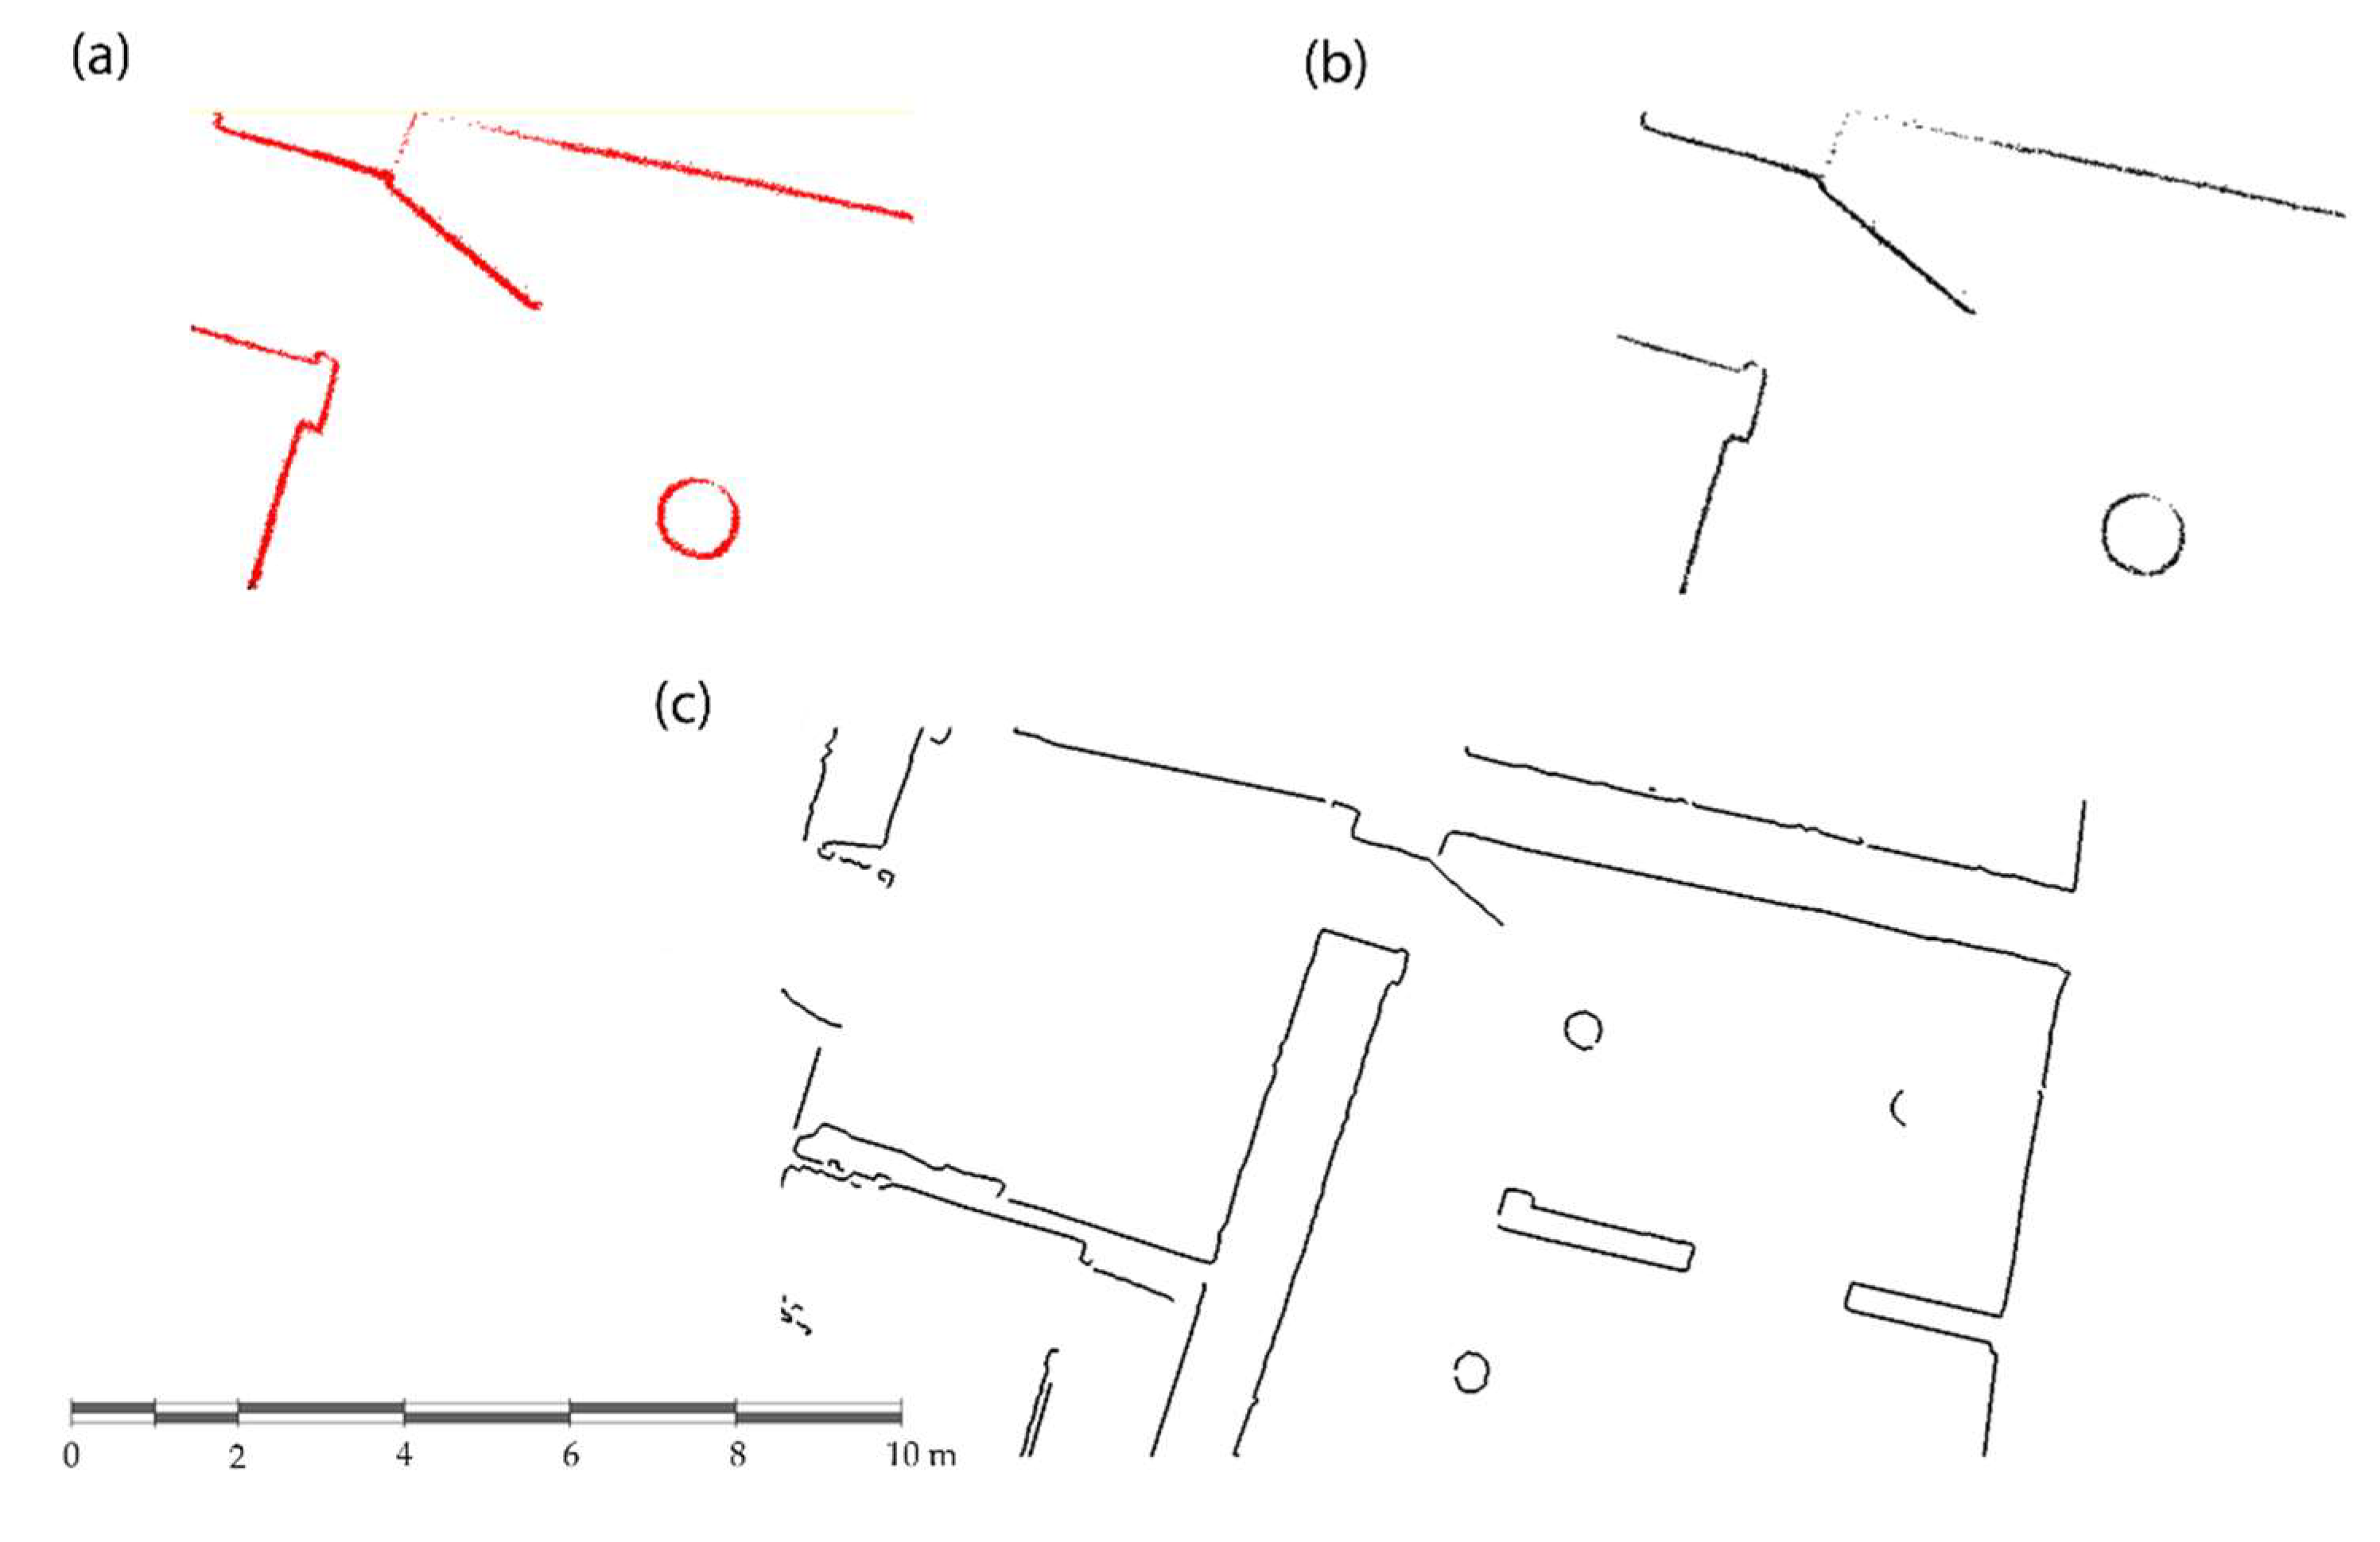
3.5. Plan and Section Restitution
4. Discussion
5. Conclusions
Author Contributions
Funding
Acknowledgments
Conflicts of Interest
References
- Krakow Charter 2000: Principles for Conservation and Restoration of Built Heritage. Available online: http://hdl.handle.net/1854/LU-128776 (accessed on 20 September 2018).
- Torres-Martínez, J.A.; Seddaiu, M.; Rodríguez-Gonzálvez, P.; Hernández-López, D.; González-Aguilera, D. A multi-data source and multi-sensor approach for the 3D reconstruction and web visualization of a complex archaelogical site: The case study of “Tolmo De Minateda”. Remote Sens. 2016, 8, 550. [Google Scholar] [CrossRef]
- Garcia-Gago, J.; Gomez-Lahoz, J.; Rodríguez-Méndez, J.; González-Aguilera, D. Historical single image-based modeling: The case of Gobierna Tower, Zamora (Spain). Remote Sens. 2014, 6, 1085–1101. [Google Scholar] [CrossRef]
- Waldhäusl, P.; Ogleby, C. 3 × 3 rules for simple photogrammetric documentation of architecture. In International Archives of Photogrammetry and Remote Sensing, Proceedings of the Close Range Techniques and Machine Vision, Melbourne, VIC, Australia, 1–4 March 1994; Australian Photogrammetric and Remote Sensing Society: Melbourne, Australia, 1994. [Google Scholar]
- Barber, D.; Mills, J. 3D Laser Scanning for Heritage: Advice and Guidance to Users on Laser Scanning in Archaeology and Architecture; Historic England: Swindon, UK, 2007; ISBN 978-1848025219. [Google Scholar]
- Kraus, K.; Waldhäusl, P. Photogrammetry: Fundamentals and Standard Processes; Dümmler Köln: Munich, Germany, 1993; ISBN 978-3427786849. [Google Scholar]
- Fabio, R.; Sabry, E.H. Image-based 3D Modelling: A Review. Photogramm. Rec. 2006, 21, 269–291. [Google Scholar] [CrossRef]
- Blais, F. Review of 20 years of range sensor development. J. Electron. Imaging 2004, 1, 13. [Google Scholar] [CrossRef]
- Guidi, G.; Russo, M.; Beraldin, J.-A. Acquisizione 3D e Modellazione Poligonale; McGraw-Hill: New York, NY, USA, 2010; ISBN 978-8838665318. [Google Scholar]
- Kalay, Y.; Kvan, T.; Affleck, J. New Heritage: New Media and Cultural Heritage, 1st ed.; Routledge: London, UK, 2007; ISBN 978-0415773560. [Google Scholar]
- Torres-Martínez, J.A.; Sánchez-Aparicio, L.J.; Hernández-López, D.; González-Aguilera, D. Combining geometrical and radiometrical features in the evaluation of rock art paintings. Digital Appl. Archaeol. Cult. Herit. 2017, 5, 10–20. [Google Scholar] [CrossRef]
- Gonzalez-Aguilera, D.; Muñoz-Nieto, A.; Rodriguez-Gonzalvez, P.; Menéndez, M. New tools for rock art modelling: Automated sensor integration in Pindal Cave. J. Archaeol. Sci. 2011, 38, 120–128. [Google Scholar] [CrossRef]
- Sánchez-Aparicio, L.J.; Riveiro, B.; Gonzalez-Aguilera, D.; Ramos, L.F. The combination of geomatic approaches and operational modal analysis to improve calibration of finite element models: A case of study in Saint Torcato Church (Guimarães, Portugal). Constr. Build. Mater. 2014, 70, 118–129. [Google Scholar] [CrossRef] [Green Version]
- Sánchez-Aparicio, L.J.; Del Pozo, S.; Ramos, L.F.; Arce, A.; Fernandes, F.M. Heritage site preservation with combined radiometric and geometric analysis of TLS data. Autom. Constr. 2018, 85, 24–39. [Google Scholar] [CrossRef]
- Del Pozo, S.; Herrero-Pascual, J.; Felipe-García, B.; Hernández-López, D.; Rodríguez-Gonzálvez, P.; González-Aguilera, D. Multispectral radiometric analysis of façades to detect pathologies from active and passive remote sensing. Remote Sens. 2016, 8, 80. [Google Scholar] [CrossRef]
- Guidi, G.; Beraldin, J.-A.; Ciofi, S.; Atzeni, C. Fusion of range camera and photogrammetry: A systematic procedure for improving 3-D models metric accuracy. IEEE Trans. Syst. Man Cybern. B 2003, 33, 667–676. [Google Scholar] [CrossRef] [PubMed]
- Stumpfel, J.; Tchou, C.; Yun, N.; Martinez, P.; Hawkins, T.; Jones, A.; Emerson, B.; Debevec, P.E. Digital Reunification of the Parthenon and its Sculptures. In Proceedings of the VAST, Brighton, UK, 5–7 November 2003; pp. 41–50. [Google Scholar]
- Paparoditis, N.; Papelard, J.-P.; Cannelle, B.; Devaux, A.; Soheilian, B.; David, N.; Houzay, E. Stereopolis II: A multi-purpose and multi-sensor 3D mobile mapping system for street visualisation and 3D metrology. Rev. Fr. Photogramm. Teledetec. 2012, 200, 69–79. [Google Scholar]
- Remondino, F.; Toschi, I.; Orlandini, S. Mobyle Mapping Systems: Recenti sviluppi e caso applicativo. GEOmedia 2015, 19, 6–10. [Google Scholar]
- Al-Hamad, A.; El-Sheimy, N. Smartphones based mobile mapping systems. Int. Arch. Photogramm. Remote Sens. Spat. Inf. Sci. 2014, 40, 29. [Google Scholar] [CrossRef]
- Piras, M.; Di Pietra, V.; Visintini, D. 3D modeling of industrial heritage building using COTSs system: Test, limits and performances. Int. Arch. Photogramm. Remote Sens. Spat. Inf. Sci. 2017, 42, 281. [Google Scholar] [CrossRef]
- Nocerino, E.; Menna, F.; Remondino, F.; Toschi, I.; Rodríguez-Gonzálvez, P. Investigation of indoor and outdoor performance of two portable mobile mapping systems. In Videometrics, Range Imaging, and Applications XIV; International Society for Optics and Photonics: Munich, Germany, 2017. [Google Scholar]
- Kumar, G.A.; Patil, A.K.; Patil, R.; Park, S.S.; Chai, Y.H. A lidar and imu integrated indoor navigation system for uavs and its application in real-time pipeline classification. Sensors 2017, 17, 1268. [Google Scholar] [CrossRef] [PubMed]
- Lehtola, V.V.; Kaartinen, H.; Nüchter, A.; Kaijaluoto, R.; Kukko, A.; Litkey, P.; Honkavaara, E.; Rosnell, T.; Vaaja, M.T.; Virtanen, J.-P. Comparison of the selected state-of-the-art 3d indoor scanning and point cloud generation methods. Remote Sens. 2017, 9, 796. [Google Scholar] [CrossRef]
- Flener, C.; Vaaja, M.; Jaakkola, A.; Krooks, A.; Kaartinen, H.; Kukko, A.; Kasvi, E.; Hyyppä, H.; Hyyppä, J.; Alho, P. Seamless mapping of river channels at high resolution using mobile lidar and uav-photography. Remote Sens. 2013, 5, 6382–6407. [Google Scholar] [CrossRef]
- Opromolla, R.; Fasano, G.; Rufino, G.; Grassi, M.; Savvaris, A. LiDAR-inertial integration of UAV localization and mapping in complex enviroments. In Proceedings of the 2016 International Conference on Unmanned Aircraft Systems (ICUAS), Arlington, VA, USA, 7–10 June 2016. [Google Scholar]
- Niu, X.; Yu, T.; Tang, J.; Chang, L. An online solution of lidar scan matching aided inertial navigation system for indoor mobile mapping. Mob. Inf. Syst. 2017, 2017, 4802159. [Google Scholar] [CrossRef]
- Shamseldin, T.; Manerikar, A.; Elbahnasawy, M.; Habib, A. SLAM-based Pseudo-GNSS/INS Localization System for Indoor LiDAR Mobile Mapping Systems. In Proceedings of the IEEE/OIN PLANS 2018, Monterey, CA, USA, 23–26 April 2018. [Google Scholar]
- Pierzchała, M.; Giguère, P.; Astrup, R. Mapping forests using an unmanned ground vehicle with 3D LIDAR and graph-SLAM. Comput. Electron. Agric. 2018, 145, 217–225. [Google Scholar] [CrossRef]
- Lagüela, S.; Dorado, I.; Gesto, M.; Arias, P.; González-Aguilera, D.; Lorenzo, H. Behavior analysis of novel wearable indoor mapping system based on 3d-slam. Sensors 2018, 18, 766. [Google Scholar] [CrossRef] [PubMed]
- Farella, E. 3d mapping of underground environments with a hand-held laser scanner. In Proceedings of the SIFET Annual Conference, Lecce, Italy, 8–10 June 2016. [Google Scholar]
- Thrun, S. Simultaneous localization and mapping. In Robotics and Cognitive Approaches to Spatial Mapping; Jefferies, M.E., Yeap, W., Eds.; Springer: Luxembourg, 2008; pp. 13–41. ISBN 978-3-540-75388-9. [Google Scholar]
- Bosse, M.; Zlot, R.; Flick, P. Zebedee: Design of a spring-mounted 3-d range sensor with application to mobile mapping. IEEE Trans. Robot. 2012, 28, 1104–1119. [Google Scholar] [CrossRef]
- GeoSLAM Technology, ZEB-REVO Solution Brochure. Available online: https://gpserv.com/wp-content/uploads/2017/01/ZEB-REVO-Brochure-v1.0.3.pdf (accessed on 15 August 2018).
- Quigley, M.; Conley, K.; Gerkey, B.; Faust, J.; Foote, T.; Leibs, J.; Wheeler, R.; Ng, A.Y. ROS: An open-source Robot Operating System. In Proceedings of the ICRA Workshop on Open Source Software, Kobe, Japan, 12–17 May 2009; p. 5. [Google Scholar]
- Kavanagh, B.F. Surveying Principles and Applications, 7th ed.; Pearson Education: Upper Saddle River, NJ, USA, 2006; ISBN 978-0137009404. [Google Scholar]
- Grisetti, G.; Kummerle, R.; Stachniss, C.; Burgard, W. A tutorial on graph-based SLAM. IEEE Intell. Transp. Syst. Mag. 2010, 2, 31–43. [Google Scholar] [CrossRef]
- Thiele, S.T.; Grose, L.; Samsu, A.; Micklethwaite, S.; Vollgger, S.A.; Cruden, A.R. Rapid, semi-automatic fracture and contact mapping for point clouds, images and geophysical data. Solid Earth 2017, 8, 1241. [Google Scholar] [CrossRef]
- Navarro, P.C. The Royal Country Estates around the Monastery of El Escorial: Medieval Tradition and Flemish Influence. Rev. EGA 2014, 46–53. [Google Scholar] [CrossRef]
- Misra, P.; Enge, P. Global Positioning System: Signals, Measurements and Performance, 2nd ed.; Ganga-Jamuna Press: Lincoln, MA, USA, 2010; ISBN 9780970954428. [Google Scholar]
- Schnabel, R.; Wahl, R.; Klein, R. Efficient RANSAC for point-cloud shape detection. In Computer Graphics Forum; Blackwell Publishing Ltd.: Oxford, UK, 2007; pp. 214–226. [Google Scholar]
- Han, X.-F.; Jin, J.S.; Wang, M.-J.; Jiang, W.; Gao, L.; Xiao, L. A review of algorithms for filtering the 3D point cloud. Signal Process. Image Commun. 2017, 57, 103–112. [Google Scholar] [CrossRef]
- Cabo, C.; Del Pozo, S.; Rodríguez-Gonzálvez, P.; Ordóñez, C.; González-Aguilera, D. Comparing Terrestrial Laser Scanning (TLS) and Wearable Laser Scanning (WLS) for individual Tree Modeling at Plot Level. Remote Sens. 2018, 10, 540. [Google Scholar] [CrossRef]
- Heron Wearable Mobile Mapping. Available online: https://gexcel.it/en/solutions/heron-mobile-mapping (accessed on 18 November 2018).


| Parameter | Value | Parameter | Value |
|---|---|---|---|
| Total device dimension (mm) | 220 × 180 × 470 | Laser measuring principle | Time of flight |
| Scanner dimension (mm) | 86 × 112 × 287 | Scanner resolution | 0.625° H × 1.8° V |
| Total device weight (kg) | 4.10 | Wavelength (nm) | 905 |
| Scanner weight (kg) | 1.00 | Orientation system | MEMS IMU |
| Head rotation speed (Hz) | 0.5 | Camera | GoPro |
| Operating time (h) | 4 | Scan rate | 100 lines/s 43,200 points/s |
| Field of view | 270° (H) × 360° (V) | Points per scan line | 432 (0.325° int) |
| Path | Covered Floors | Walked Distance (m) | Acquisition Time (min) | Average Speed (m/s) |
|---|---|---|---|---|
| 1 | 1 | 339.80 | 18.39 | 0.31 |
| 2 | 4 | 328.35 | 17.11 | 0.32 |
| 3 | 3 | 426.89 | 18.47 | 0.39 |
| 4 | 1 | 226.70 | 9.94 | 0.38 |
| Default Algorithm Configuration | ||
|---|---|---|
| Path | Processing Time (min) | Difference between Processing and Acquisition time (%) |
| 1 | 23.18 | ≅20 |
| 2 | 23.76 | ≅21 |
| 3 | 25.31 | ≅25 |
| 4 | 12.42 | ≅22 |
| Faro Focus 3D | GeoSLAM ZEB-REVO | ||||||
|---|---|---|---|---|---|---|---|
| DFm (m) | σ (m) | DZm (m) | σ (m) | RLME | RLMA | ||
| Main cloister | L1 | 10.279 | 0.008 | 10.268 | 0.010 | −0.107 | ≈1:1000 |
| W1 | 10.096 | 0.013 | 10.085 | 0.022 | −0.109 | ≈1:600 | |
| H1 | 4.869 | 0.014 | 4.869 | 0.012 | 0.001 | ≈1:7000 | |
| Garden | L2 | 22.730 | 0.012 | 22.756 | 0.011 | 0.114 | ≈1:800 |
| W2 | 18.766 | 0.023 | 18.787 | 0.025 | 0.112 | ≈1:900 | |
| Path | Number of Points | Mean Surface Density (points/m2) | Number of Points after 1 cm Subsampling | Mean Surface Density after 1 cm Subsampling (points/m2) |
|---|---|---|---|---|
| 1 | 32,955,139 | 29,648 | 14,056,546 | 6140 |
| 2 | 30,059,713 | 28,399 | 14,032,348 | 5594 |
| 3 | 33,839,213 | 20,428 | 16,766,690 | 5348 |
| 4 | 16,720,282 | 18,488 | 9,210,536 | 4634 |
© 2018 by the authors. Licensee MDPI, Basel, Switzerland. This article is an open access article distributed under the terms and conditions of the Creative Commons Attribution (CC BY) license (http://creativecommons.org/licenses/by/4.0/).
Share and Cite
Di Filippo, A.; Sánchez-Aparicio, L.J.; Barba, S.; Martín-Jiménez, J.A.; Mora, R.; González Aguilera, D. Use of a Wearable Mobile Laser System in Seamless Indoor 3D Mapping of a Complex Historical Site. Remote Sens. 2018, 10, 1897. https://doi.org/10.3390/rs10121897
Di Filippo A, Sánchez-Aparicio LJ, Barba S, Martín-Jiménez JA, Mora R, González Aguilera D. Use of a Wearable Mobile Laser System in Seamless Indoor 3D Mapping of a Complex Historical Site. Remote Sensing. 2018; 10(12):1897. https://doi.org/10.3390/rs10121897
Chicago/Turabian StyleDi Filippo, Andrea, Luis Javier Sánchez-Aparicio, Salvatore Barba, José Antonio Martín-Jiménez, Rocío Mora, and Diego González Aguilera. 2018. "Use of a Wearable Mobile Laser System in Seamless Indoor 3D Mapping of a Complex Historical Site" Remote Sensing 10, no. 12: 1897. https://doi.org/10.3390/rs10121897