Assessing Pasture Degradation in the Brazilian Cerrado Based on the Analysis of MODIS NDVI Time-Series


1
The Nature Conservancy Brazil, SCN Quadra 05 Bloco A Sala 1407—Torre Sul, Brasília 70715-900, DF, Brazil
2
Instituto de Estudos Sócio-Ambientais, Universidade Federal de Goiás, Goiânia 74690-900, GO, Brazil
*
Author to whom correspondence should be addressed.
Remote Sens. 2018, 10(11), 1761; https://doi.org/10.3390/rs10111761
Submission received: 4 September 2018
/
Revised: 1 November 2018
/
Accepted: 3 November 2018
/
Published: 8 November 2018
(This article belongs to the Section Remote Sensing in Agriculture and Vegetation)
Abstract
:Around 55% of all Brazilian cattle production is located in the Cerrado biome, which also contains the largest pasture area in Brazil. Previous studies indicated that about 60% of these pastures were degraded by 2010. However, up-to-date and more precise estimates are necessary to access the extent and degree of degradation of the Cerrado pastures, since these areas constitute strategic land reserves for both livestock intensification and soybean expansion. Therefore, in this study, we estimated the area of degraded pastures in the Cerrado by analyzing the trends of cumulative NDVI anomalies over time used as a proxy for pasture degradation. The generated slope surface was segmented into two classes, comprising non-degraded and degraded pastures, which were correlated with socio-economic and biophysical variables. According to our study, around 39% of the Cerrado pastures are currently degraded, encompassing 18.2 million hectares, mostly in areas with a cattle carrying capacity below 1.0 AU ha−1. These areas, distributed in the northwest Cerrado, mostly within the Brazilian states of Maranhão, Piauí, and Bahia (i.e., Matopiba region), tend to be associated with decreasing rainfall patterns and low investments in soil conservation practices. The degraded areas also tend to be concentrated in municipalities with low human development indices (HDI).
1. Introduction
The Food and Agriculture Organization (FAO) defines the process of pasture degradation as a wide range of conditions associated with soil erosion and soil degradation, which reduce the capacity of an ecosystem to provide biological, hydrological, social, and economic related services. A more detailed definition describes pasture degradation as the long-term loss of ecosystem function and services caused by disturbances from which the system cannot completely recover [1]. The most common consequences of this degradation include long-term decreases in soil organic carbon (SOC) stock, soil water storage, nutrients, resilience, and belowground biodiversity, which are easy to identify in severely degraded areas [2]. Indirect effects of pasture degradation can also include gradual loss of land’s productive capacity, as well as of fauna and flora diversity [3]. The dedicated literature highlights three major forms of pasture degradation, which are physical (e.g., soil erosion by water), chemical (e.g., acidification, decline in water storage capacity, salinization), and biological (e.g., decline in soil organic matter) [3,4].
The process of pasture degradation is usually slow and sometimes imperceptible in the short-term, which explains why this process is commonly neglected in many countries during its initial stage [5]. However, when the degradation process reaches its final stages, restoration becomes difficult or unpractical, requiring a considerable investment for mitigation, which goes beyond the economic reality of most of the countries located in the tropics [6]. The drivers of pasture degradation are widely variable within different countries and are associated mostly with specific social, economic, political, and environmental conditions. Previous studies have demonstrated the relationship between pasture degradation and intensity/frequency of natural disasters, poor income distribution, marginalization of rural populations, land ownership conflicts, concentration of small farms, regional political instability, health problems, and inappropriate land use, when livestock and forest conversion to pasture are used as a mechanism for land speculation [7].
A wide range of methods has been used to assess areas of degraded pasture. However, according to Gibbs and Salmon [8], the most common approaches can be summarized into four major categories, namely, (i) expert opinion and evaluation [9,10,11]; (ii) satellite-derived Net Primary Productivity (NPP) and vegetation indices [12]; (iii) biophysical models [13]; and (iv) estimation of areas of abandoned croplands [14,15]. Among the previous methods, high temporal resolution remote sensing data, such as those provided by the MODIS (MODerate Resolution Imaging Spectroradiometer), AVHRR (Advanced Very High Resolution Radiometer), or PROBA (PRoject for On-Board Autonomy) sensors, for example, are some of the most common and powerful tools for estimating the location and degree of pasture degradation [16,17,18].
The use of remote sensing technology is one of the options for mapping pasture degradation when working at national or continental map scales. The FAO’s Global Assessment of Lands Degradation and Improvement project (GLADA), one of the most important assessment to estimate degraded lands at continental and global scales, is based on degradation events during the 1981–2003 period using the Normalized Difference Vegetation Index (NDVI), which is widely employed to assess vegetation conditions and productivity [12]. GLADA uses satellite-derived NDVI measurements collected by AVHRR as a proxy for NPP. A negative trend of NPP indicates the occurrence of degradation. GLADA results revealed a declining trend in NPP/NDVI across 21% of the global land area, representing 2.7 billion ha, mainly in tropical Africa, Southeast Asia, China, north-central Australia, Pampas, and swaths of the boreal forest in Siberia and North America [12].
Extensive pastures are the main food source of the Brazilian livestock and contribute to the competitiveness of the national production, which has one of the lowest costs in the world, estimated at 60% and 50% of what is spent in Australia and the United States, respectively [19]. The low production investment of cattle ranching in Brazil is partially explained by the poor or absent effort in soil management techniques in areas of extensive farming [3]. Therefore, degradation has been a major obstacle to the agriculture expansion or intensification, and recovery initiatives face implementation difficulties due to the lack of up-to-date and detailed information on the location of these areas, among other reasons [20].
For the Cerrado biome, a prominent cattle ranching region in Brazil, there are only two major sources of data on the extension of degraded pastures; one is the census data at the municipality scale level from the year of 2006 [21] and the other refers to the estimation of degraded pastures based on the analysis of SPOT vegetation time series in the year, 2010 [22]. According to the IBGE (Brazilian Institute of Geography and Statistics) census data, only 15.8% of the Cerrado pastures were degraded in 2006, which is lower than the EMBRAPA estimates in 2010 that assessed the Cerrado pastures at 1.15 km spatial resolution and estimated between 24% and 60% of pasture degradation [22]. The significant difference between IBGE and EMPRAPA estimates is partially related to the fact that census data relies on self-declared information, which depends on the perception of the farmer concerning the degree of pasture degradation [20]. Therefore, the EMBRAPA estimates are more realistic, but are still generic due to the low spatial resolution considered. Therefore, data on the extension and level of pasture degradation in the Cerrado must be refined, updated, and validated.
The identification, mapping, and monitoring of pasture degradation in the Cerrado can support public policies, such as the federal government’s Low Carbon Agriculture Program (Plano ABC), which has a component dedicated exclusively to the recovery of degraded pastures [23,24], through the sectorial plan for mitigation and adaptation to climate change. Refined pasture condition maps could also help on future sustainable land use management policies by pointing areas of degraded lands suitable for future expansion of croplands or recovery (aiming at the intensification of cattle ranching). However, there is no up-to-date research concerning the extension and degree of land degradation for the entire Cerrado region. As the use of original NDVI time-series to assess degradation trends is prone to high statistical uncertainty [25], the enhancement of subtle changes in NDVI temporal profiles is essential for the proper detection of degraded pasture area.
The major goal of this study was to produce an operational mapping of the extension of the degraded pastures in the Cerrado biome, by using a novel approach based on high temporal resolution remote sensing imagery. The key hypothesis in our study is that satellite time-series, as those provided by the MODIS sensor, offer a suitable source of data capable of capturing the continuous inter-annual trend of pasture conditions. We also aimed at understanding the patterns and causes behind land degradation, by considering a set of variables likely to be spatially related to the distribution of degraded pastures. Specifically, these variables were used to assess the consistency of the pasture degradation map and to check how the degradation of pastures in the Cerrado in recent years relates to changes in rainfall and socioeconomic aspects.
2. Study Area
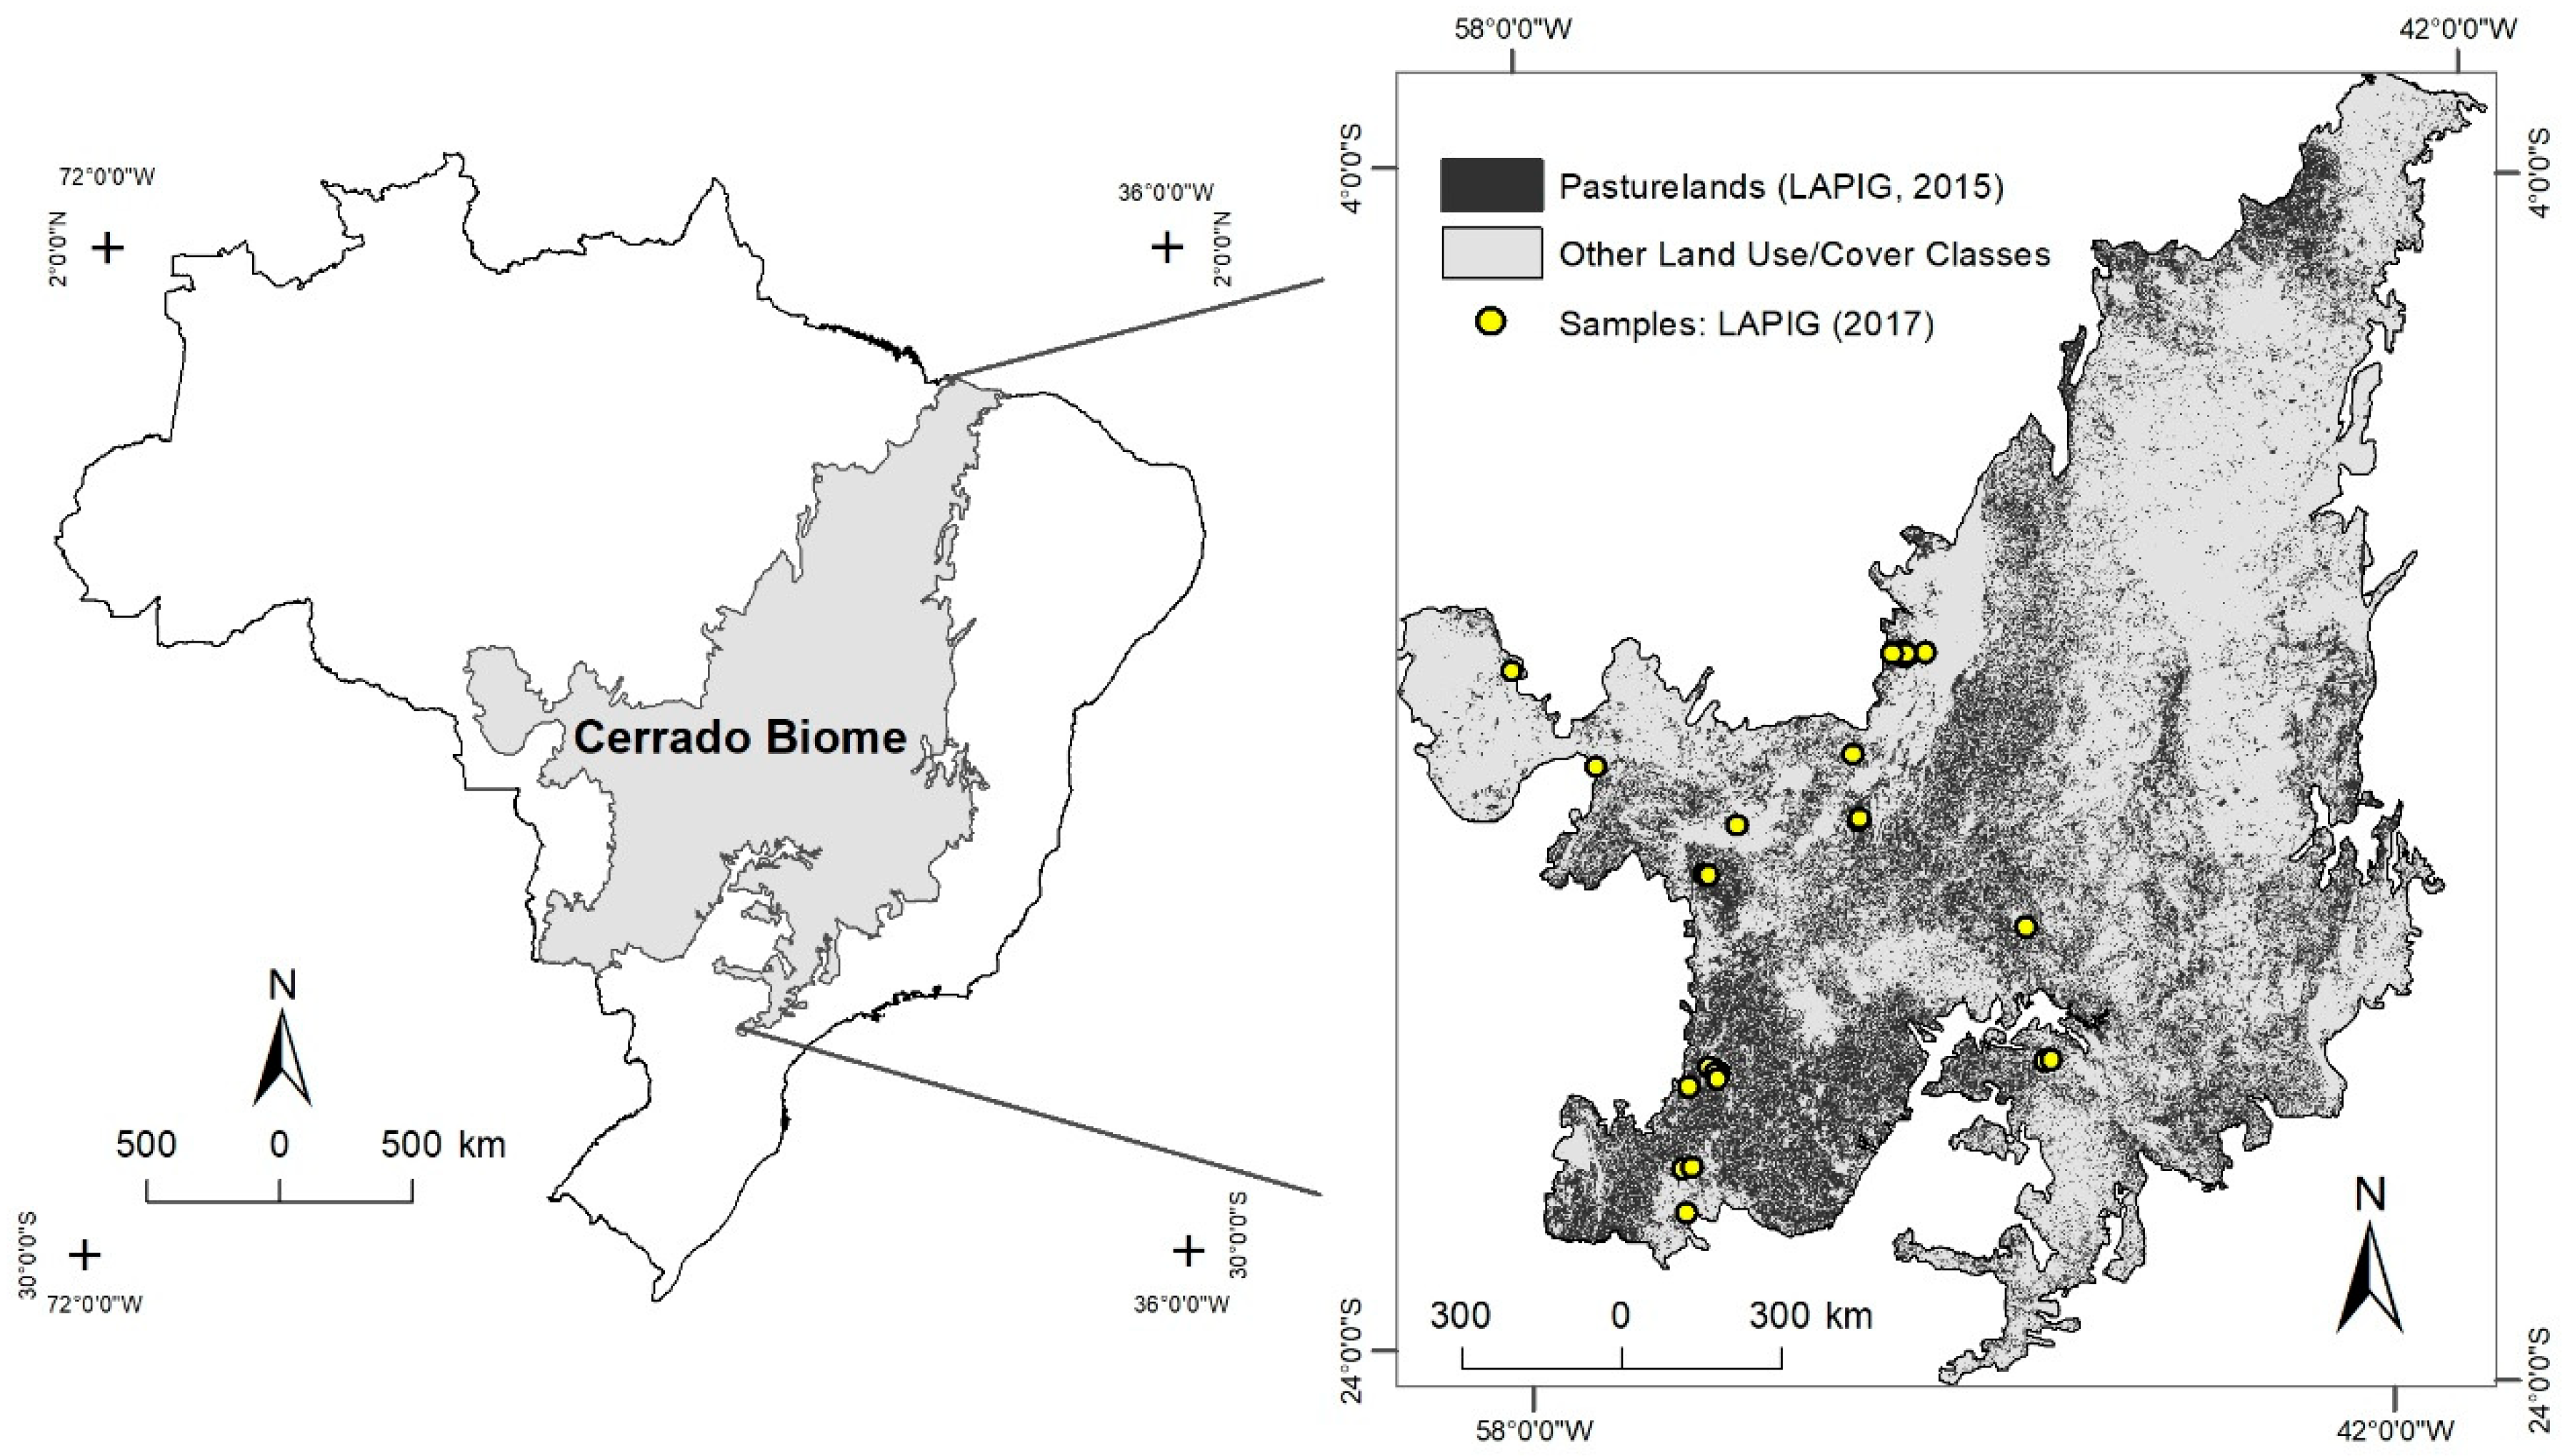
The Brazilian Cerrado biome (Figure 1), with an area of approximately 205 million hectares, is the second largest biome in Brazil and covers about 24% of the country [26]. The climate is tropical wet and dry, and the annual precipitation ranges from 650 mm year−1 in the northeast to 1800 mm year−1 in the northwest; the wet season extends from October to April, and the dry season extends from May to September [27]. The remarkable seasonality of the region causes a distinct variation of pasture vigor along the year [28]. The dryer winters are marked by a decrease of pasture biomass, while the wetter summers cause a subsequent increase [29]. Ferreira et al. [29] observed an average increase of about 130% between August and February in vegetation index values from MODIS. The pastures in the region cover roughly 28% of the Cerrado, according to recent estimates [30]. The infrastructure and soil suitability of this region place the Cerrado in a globally strategic position regarding the cultivation of croplands and livestock, being the region with the largest agricultural production in Brazil, responsible for 55% of the Brazilian meat production [31].
3. Material and Methods
3.1. Datasets
In this study, we used NDVI to assess the vegetation photosynthetic capacity within areas of the Cerrado pastures, as mapped by Parente et al. [30] (Figure 1). We utilized the MODIS MOD13Q1 (Collection 6) product, with a 250 m spatial resolution and 16-day temporal resolution [32], from January 2001 to December 2017. The image stack was selected from the Google Earth Engine (GEE) platform considering only the best observations (i.e., without cloud and/or cloud shadowing contamination), according to the MODIS pixel reliability [32,33].
We also used a field database compiled by LAPIG (Image Processing and GIS Lab, at the Federal University of Goiás) [34] to validate the degradation map derived from the NDVI time-series. The database contains 122 samples located in the Cerrado biome, collected in areas of cultivated pasture in the period from 2011 to 2014 [34], mostly without a detailed description of pasture condition. From the 122 samples, 51 presented management descriptions and 28 indicated the pasture condition at the moment of data acquisition.
The obtained pasture degradation map was compared with ancillary variables likely to be related to the spatial distribution of degraded regions. We considered the long-term trend of rainfall in the Cerrado by analyzing CHIRPS (Climate Hazards group InfraRed Precipitation with Station data—version 2.0) dataset [35]. We also compared pasture degradation with data generalized at the municipality level representing cattle stock in 2015 [36], the HDI provided by IBGE (Brazilian Institute of Geography and Statistics) [37] relative to the census of 2010 and the total number of farms that have not adopted any soil management practice until 2006, according to the IBGE agricultural census interviews [21]. The list of conservation practices investigated by IBGE includes all procedures that could be used to preserve soil fertility and to avoid soil loss by erosion, such as level plantation, use of terraces, crop rotation, use of leguminous crops for reforming or restoring pastures, adoption of cyclical periods of soil resting, and protection or conservation of hillsides (see [21] for a detailed description of IBGE census variables).
3.2. Methods
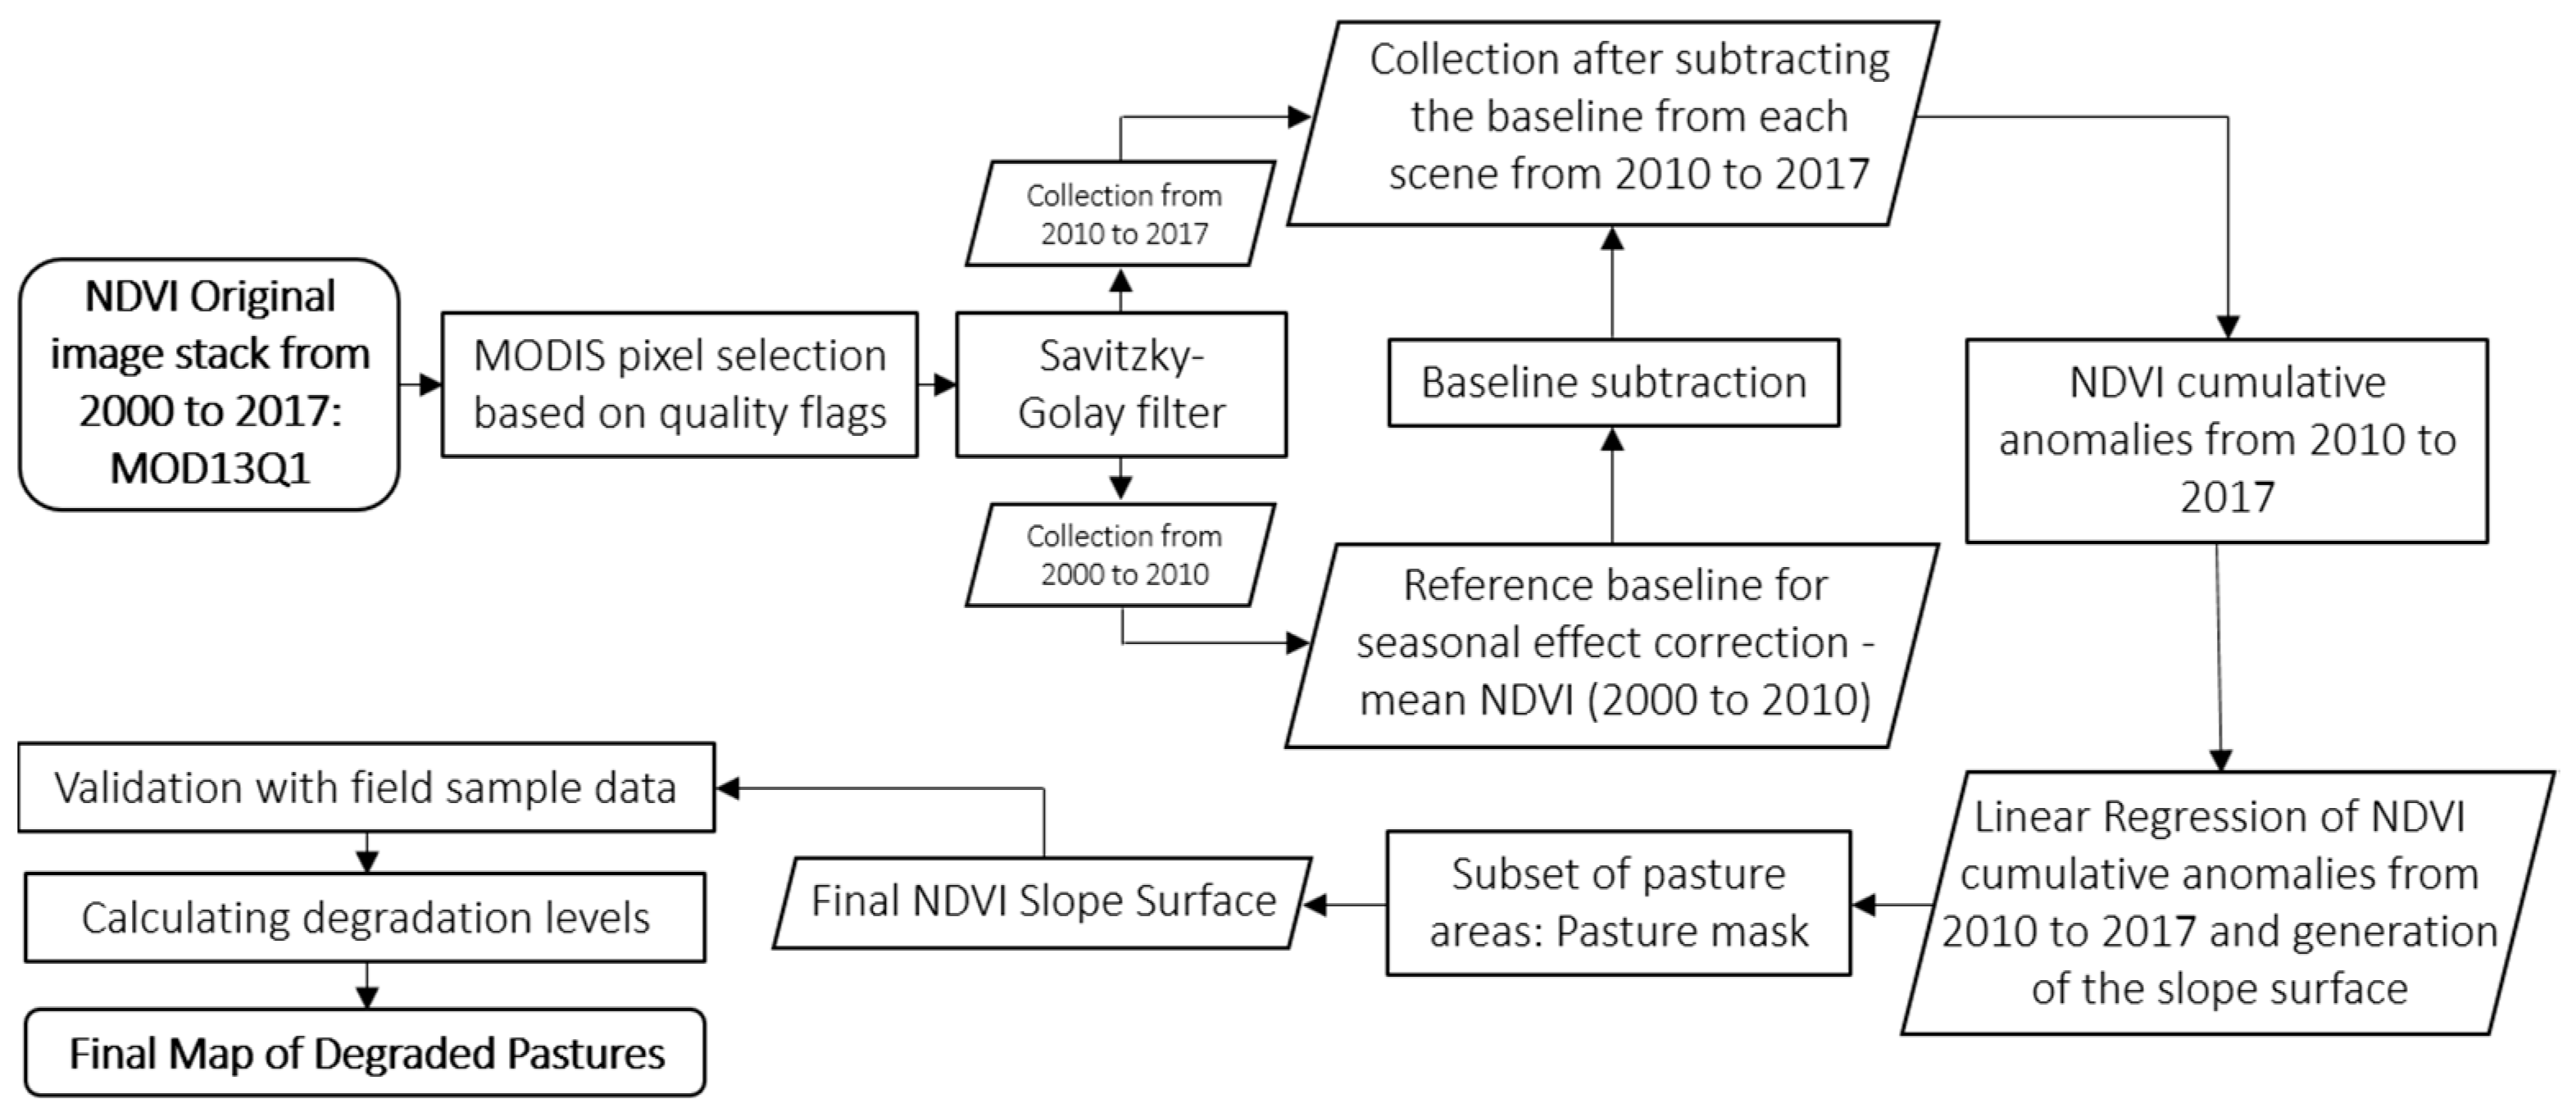
The Methods section presents an overview of the steps adopted in this study to map degraded pastures in the Cerrado biome (Figure 2). The first step comprised the analysis of the slope of NDVI time-series using negative values as a proxy for pasture degradation. In this step, we considered a method based on the estimation of regression slopes of cumulative NDVI anomalies (i.e., adjusted to remove the seasonal noise). The method based on cumulative anomalies was considered due to the high uncertainty and statistical instability of models based on the regression of original NDVI time-series [25]. As a second step, the resulting slope surface was then segmented into non-degraded and degraded pastures for subsequent correlation with ancillary variables.
3.2.1. NDVI Cumulative Regression
Residual atmospheric noise and data outliers in the time series vectors were smoothed with the Savitzky-Golay filter [35], considering a 5-point window over 2 fitting steps, adaptation strength of 2, and no spike or amplitude cutoffs. The measurement of degradation was based on the analysis of the NDVI trend along time, considering positive trends as improvement and negative trends as degradation, within the analyzed period [8,38,39]. We computed a series of cumulative NDVI anomaly images seasonally corrected according to a 2000–2010 baseline (Figure 2). Thus, we eliminated the seasonal noise in the NDVI time series by subtracting the respective average NDVI image (2000 to 2010) from the NDVI of each image of the image stacks in the period of interest (2010 to 2017), as described in (1):
where is the variable of interest with a time interval of 16 days according to the NDVI data, is the specific period to be adjusted by the baseline, is the baseline period, and is the number of total years considered. Next, the NDVI relative values were summed by the respective previous scene in the image stack to create an image collection of cumulative anomalies. Each cumulative time series vector was regressed by OLS (Ordinary Least Square) regression, resulting in surfaces that represent the slope values of the cumulative regression of NDVI from 2010 to 2017. This method was also applied to obtain slope values of rainfall from CHIRPS dataset considering the same period (period of interest of 2010 to 2017, having the period from 2000 to 2010 as a baseline reference) to verify the correlation between NDVI and rainfall long-term trends.
The Cerrado pasture area was extracted from the NDVI trend (slope surface) according to a mask that represents pastures in 2010 that remained as pastures until 2017 [30,40]. We used the pasture maps at 30 m spatial resolution produced within the scope of the MapBiomas initiative (mapbiomas.org) [30,40] by considering the equivalence of the 2010 and 2017 maps, so that the mask comprised only areas mapped as pastures in both years. This mask was used to avoid NDVI noise related to land use conversions (i.e., native vegetation to pasture or pasture to croplands), which could impact the temporal behavior of the slope values of cumulative NDVI within the period considered in this study.
3.2.2. Mapping Pasture Degradation
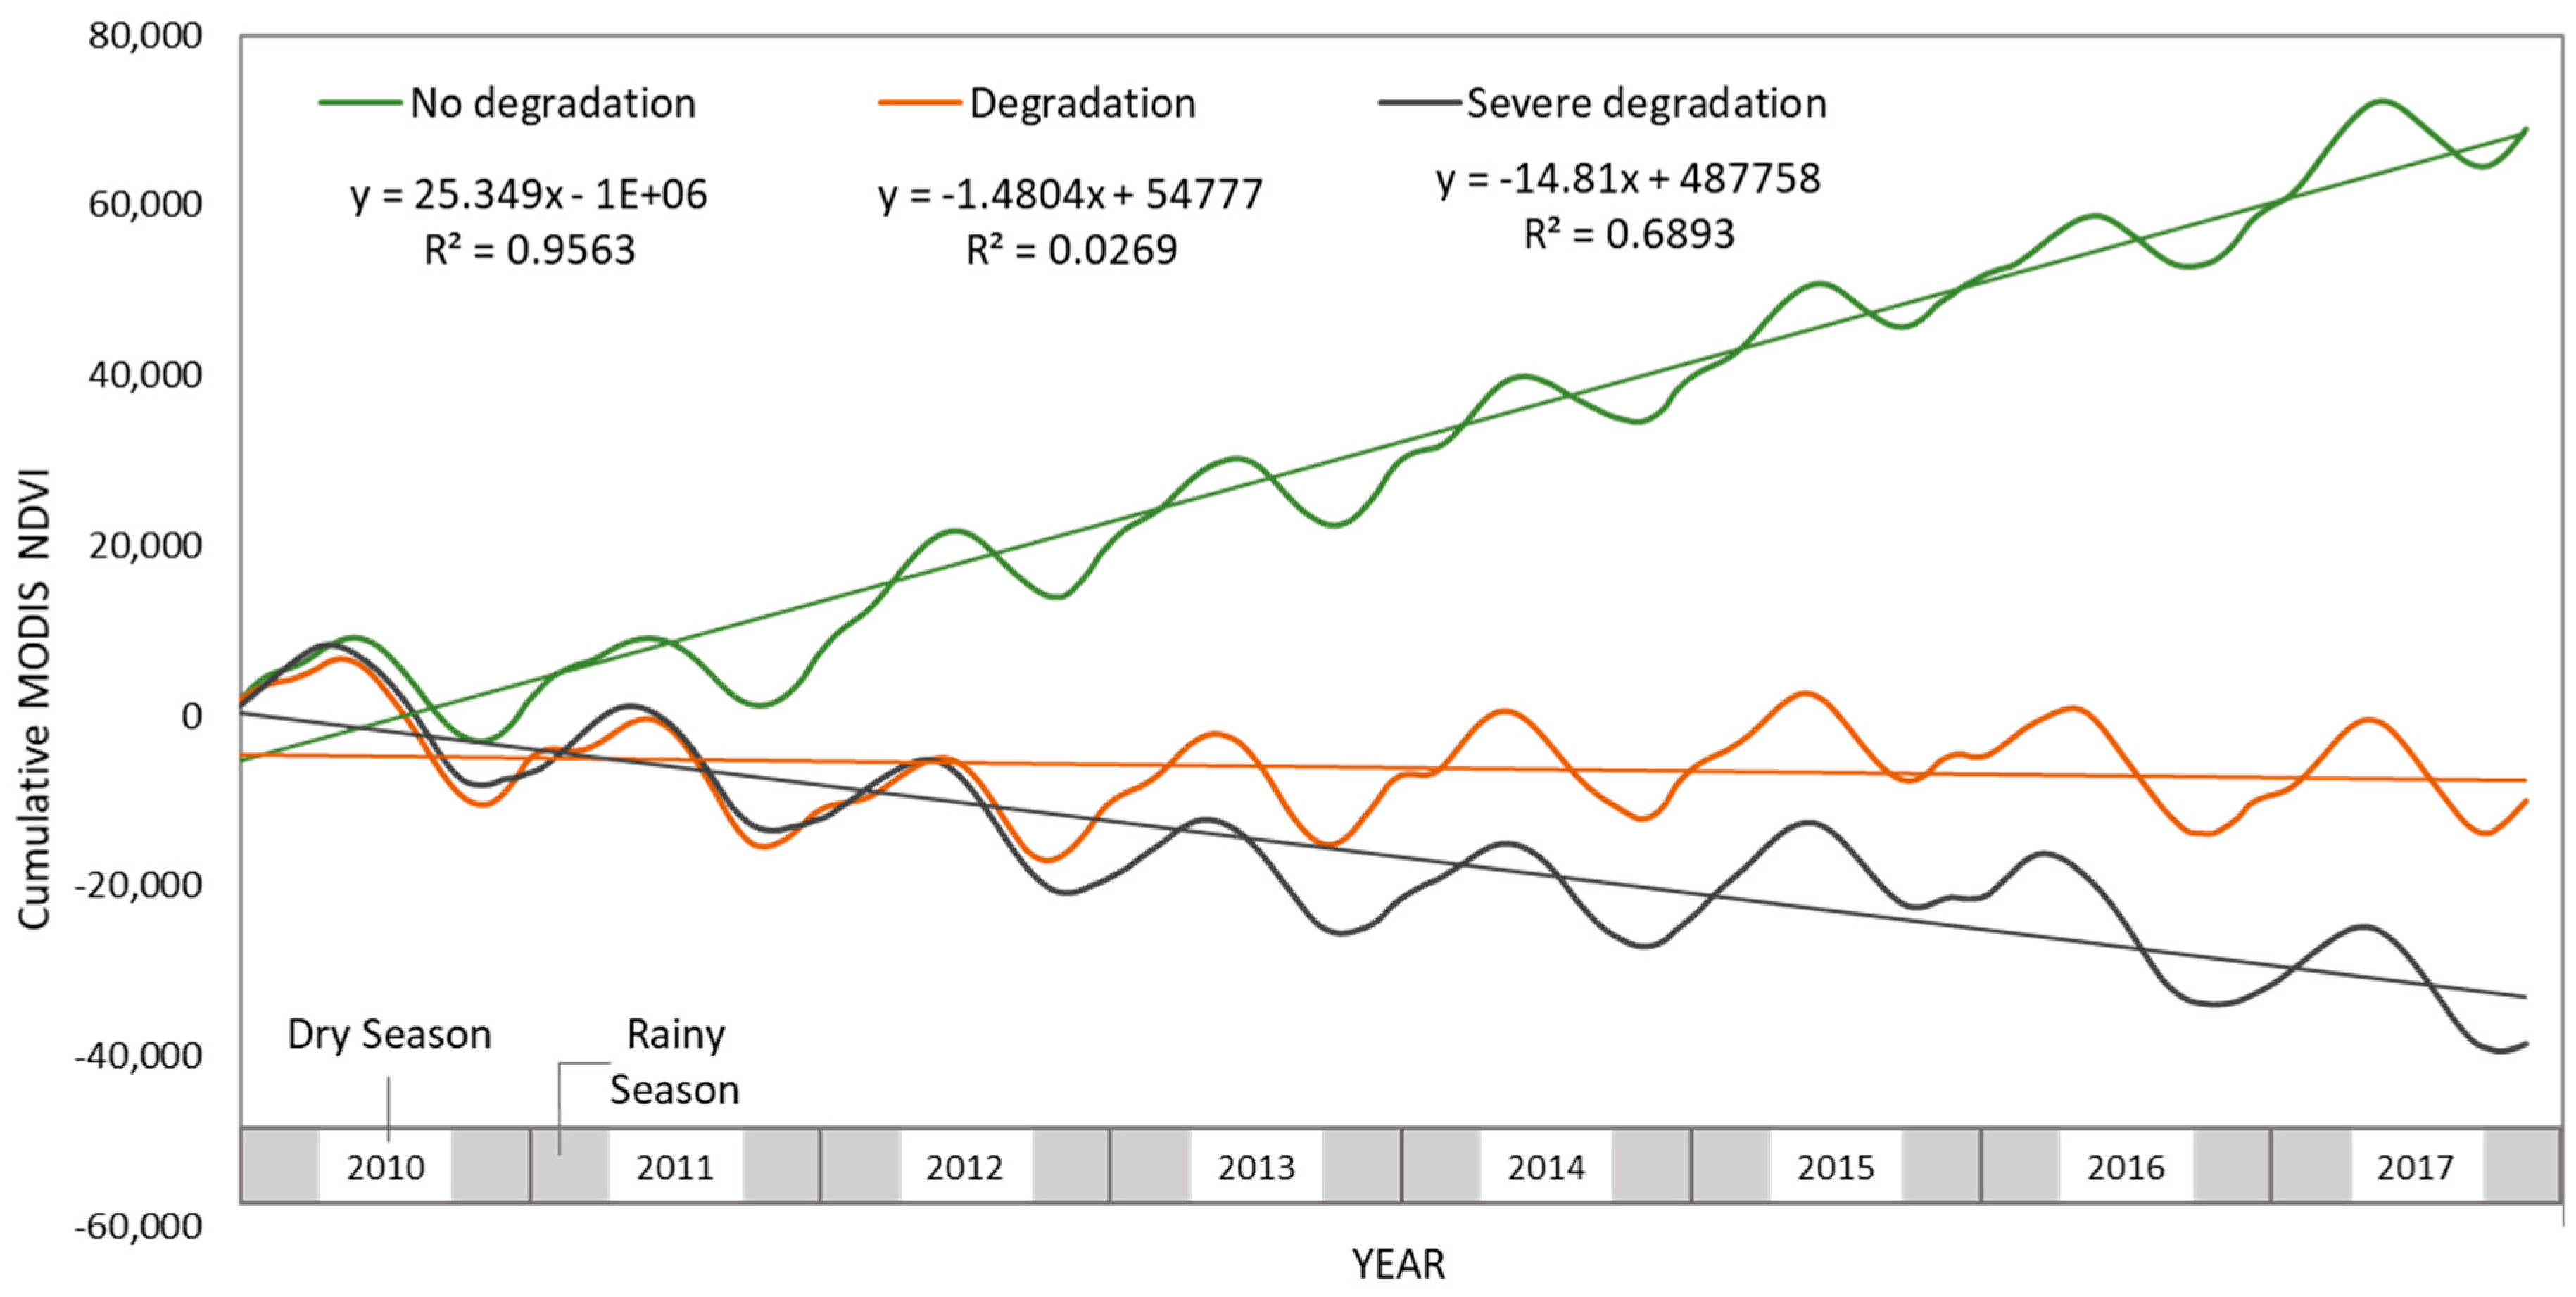
We grouped the 28 points compiled by LAPIG in the Cerrado region into three general degradation categories, considering the qualitative description of the samples [34] (i.e., date of last pasture management intervention, management type, photos taken in the field, and pasture field description [6,20]). Areas with soil fertilization, recent pasture restoration, being used for cattle production, and with high productivity, as observed in the field (photos), were considered non-degraded. Areas with no fertilization and/or not reformed in a long period were considered as degraded. Ultimately, areas that have never been reformed or managed with fertilization, mowing, etc. and presented bare soils, were considered as severely degraded [6,20]. Differences in mean values of NDVI slope among field sample classes were tested with the Kruskal-Wallis test (p < 0.05) and a t-test to evaluate if lines were significantly different from each other (p < 0.05).
The field dataset was used to access the general coherence of the NDVI cumulative slope values with the pasture condition and to verify the behavior of cumulative NDVI along time within sampled pixels. The significance of the trend in each segment was estimated from a t-test on the interaction parameter of the regression between the time series segment and α2. We considered as degraded all pastures that presented values equal or below zero [41]. The obtained pasture degradation map was compared with ancillary data to verify if the degradation was more related to recent shifting in the patterns of rainfall in the Cerrado or mainly induced by human socio-economic drivers (soil management, cattle carrying capacity, and HDI).
4. Results
4.1. Mapping Pasture Degradation in the Cerrado Based on Field Sample Data
We observed a separation between slope classes, considering the average of the stages of pasture condition, as shown in Table 1 (K-W test = 17.576, p = 0.0002). The average slopes of each pasture stage presented values of 23.3 (3.94 to 53.67), −1.48 (−20.81 to 17.76), and −14.8 (8.74 to −56.15) for non-degraded, degraded, and severely degraded samples, respectively (Table 1 and Figure 3). However, only non-degraded slopes differed from degraded (T(1–18) = 3.75, p = 0.002) and severely degraded (T(1–22) = 5.78, p = 0.00001) slopes. While the method was efficient on classifying areas of non-degraded pastures according to field samples, separating classes of degradation severity was not possible considering the limited amount of field samples available to validate the map (Table 1) and the lack of quantitative information regarding the degradation severity of the visited pasture sites. Nevertheless, the slope values in the cumulative model, in general, were consistent with the description of pasture condition available at the moment of pasture sampling (Table 1) and the average values of the three degradation stages agreed with the pasture condition observed in the field (Figure 3). However, some samples presented slopes that differed from the field description (Table 1), probably due to the time difference between the final date of the MODIS time-series (2017) and the dates of the field campaigns (2011 to 2014). The recent adoption or not of pasture management could impact the behavior of the NDVI slope in the last years.
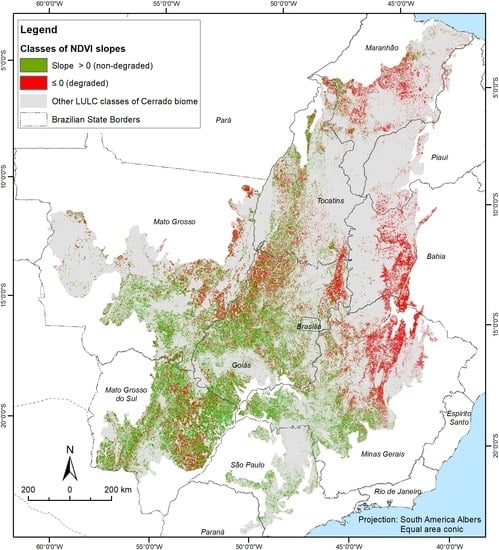
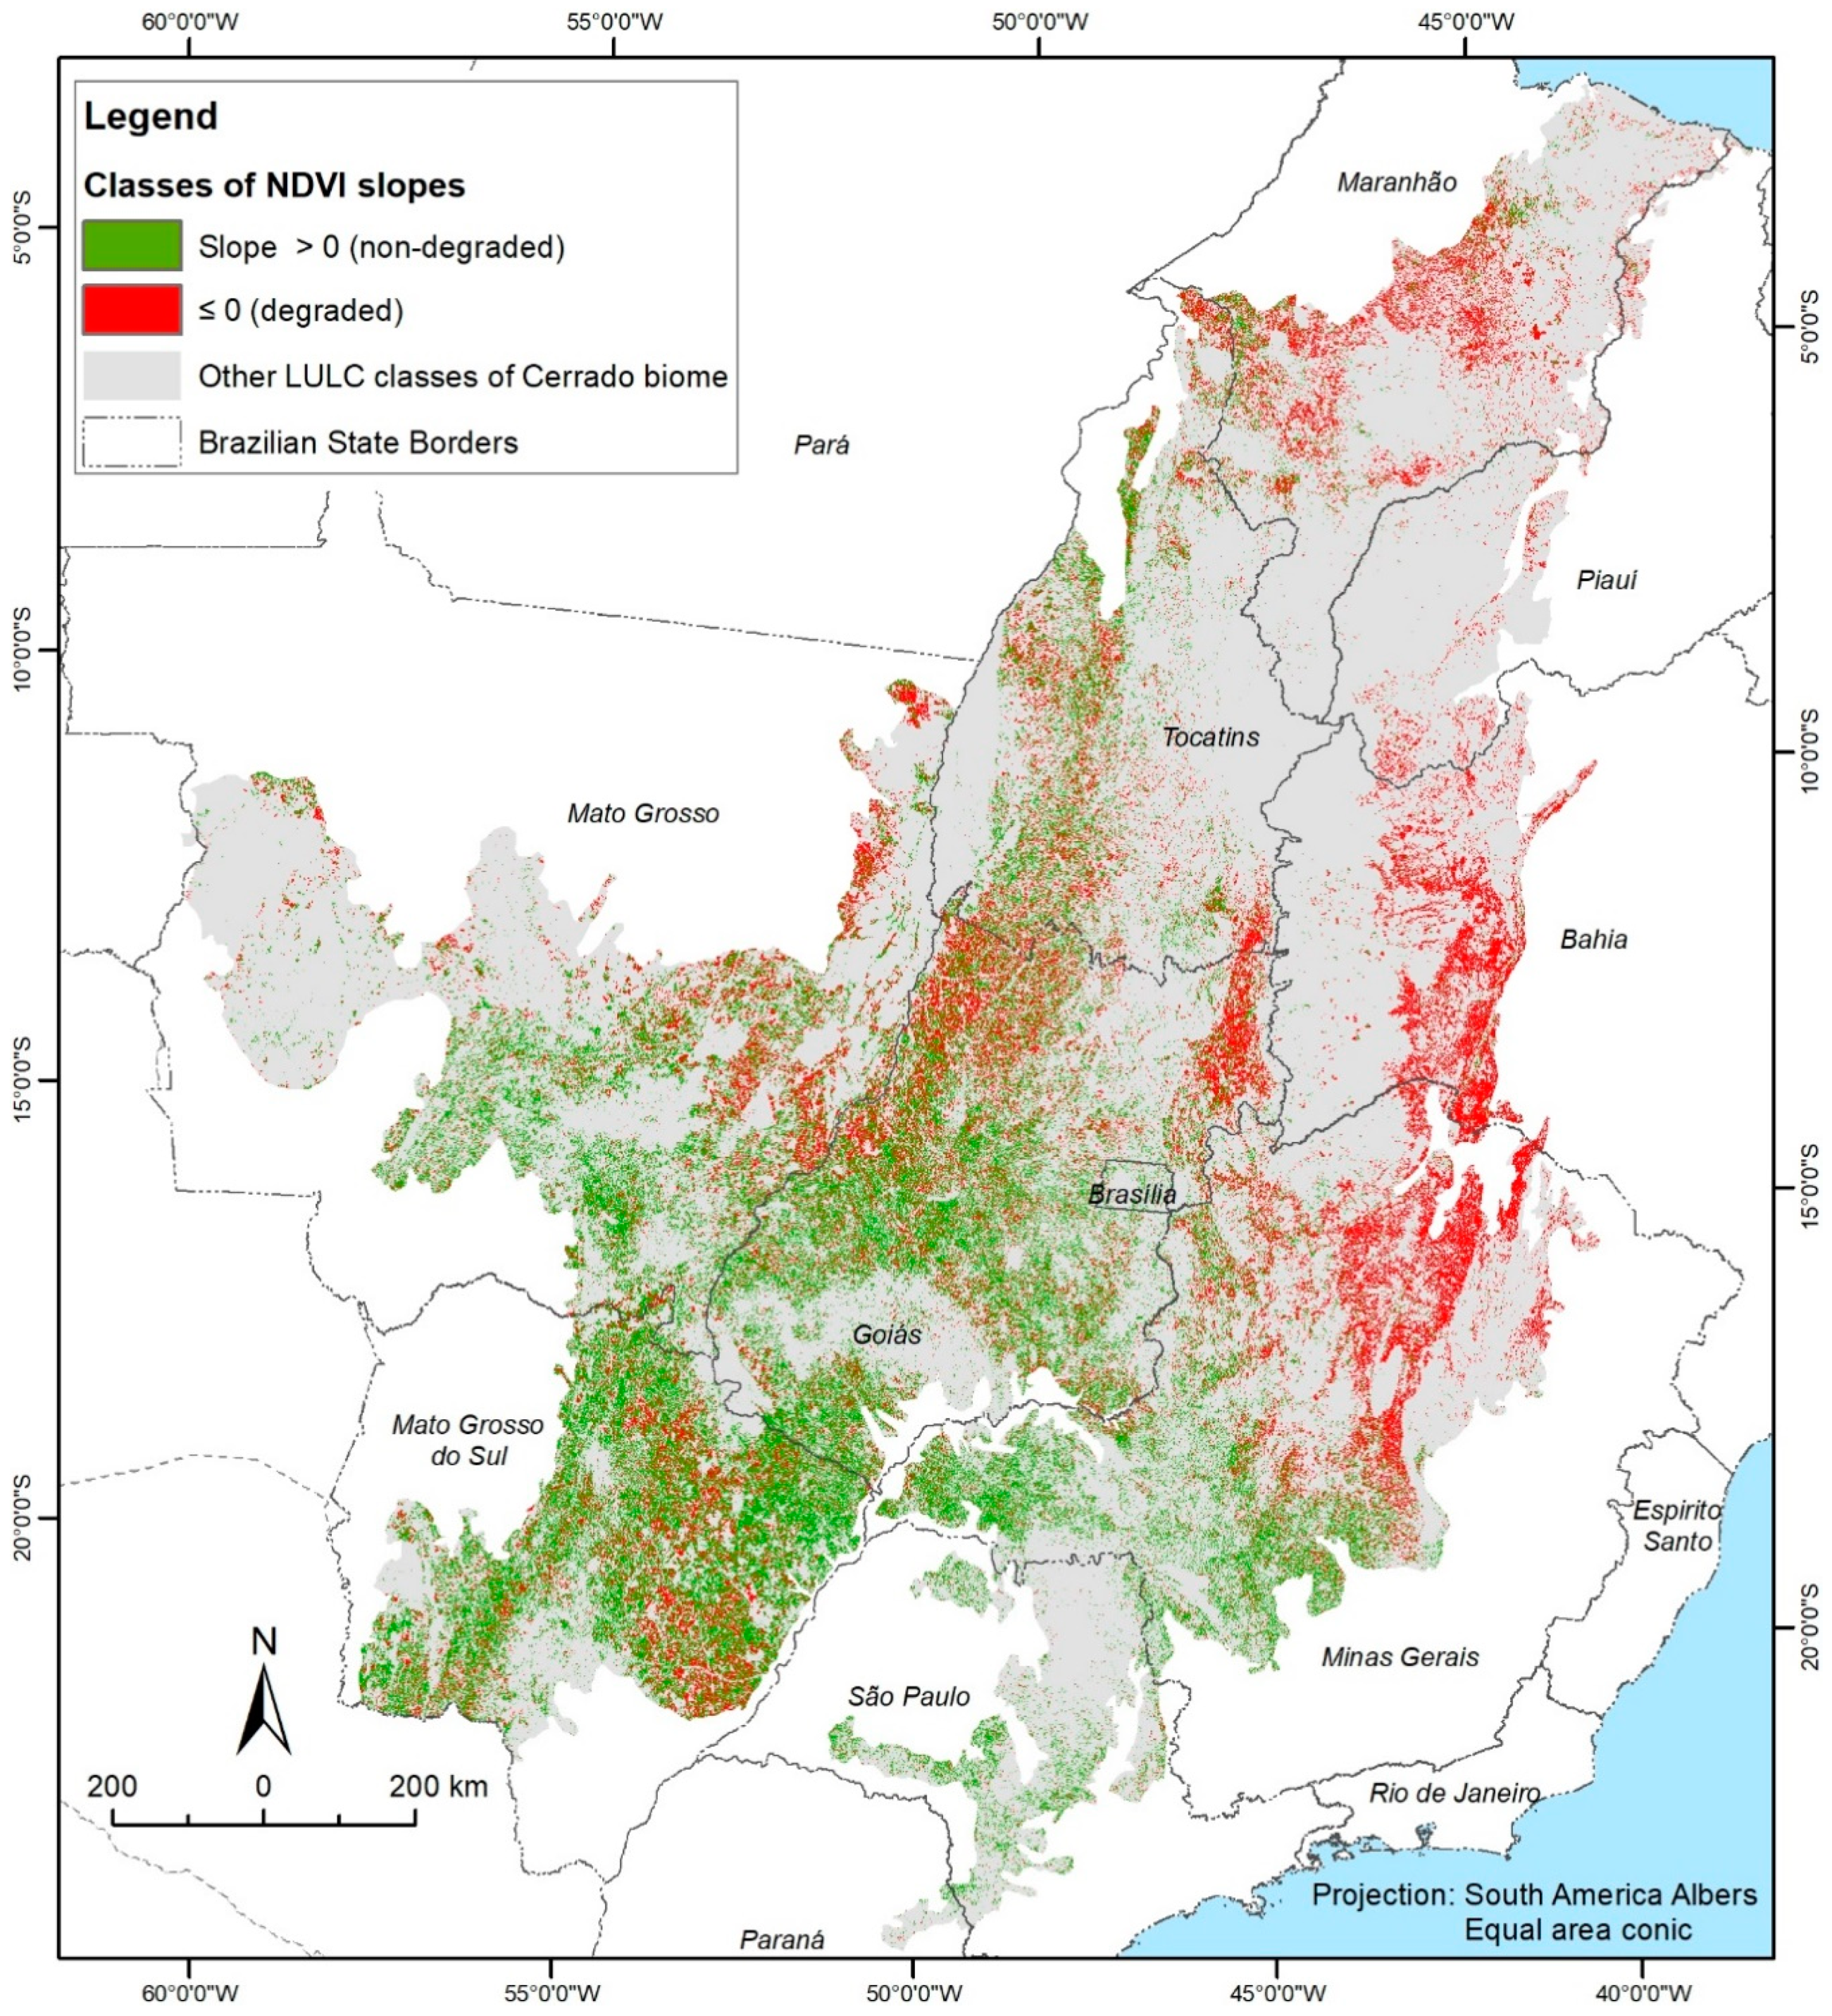
According to the two segmented levels of pasture condition obtained by considering slope values above 0 (non-degraded) and below 0 (degraded), around 61% (28.6 million hectares) of the pastures of the Cerrado biome (Figure 4) are not degraded due to the absence of negative trends, while 39% are currently degraded, representing 18.2 million hectares. It is important to emphasize that the largest relative area of degraded pastures within the Cerrado biome is located in the Matopiba region, an agricultural frontier encompassing portions of the states of Maranhão (MA), Tocantins (TO), Piauí (PI), and Bahia (BA) [42]. In this region, we observed that only 34% (3 million hectares) of the pasture area showed no sign of degradation, while roughly 65% (5.8 million hectares) presented negative NDVI trends likely related to degradation, mostly in the states of BA, MA, and PI.
The map in Figure 4 illustrates the degradation classes only within areas mapped as pastures in 2010 and 2017 [40]. Regions showing a positive trend are most widespread in the southwest and south of the Cerrado biome, with some areas of positive trend in the northwest. On the other hand, regions of negative trends, besides being interspersed between regions with positive trends, are clearly concentrated in the east, central east, and north (Figure 4), around the Brazilian states of MA, PI, and BA (Matopiba region), along with the north of the Minas Gerais (MG) state (Figure 4). The Cerrado south region had the largest relative area of non-degraded pastures with positive trends majorly in the states of Mato Grosso do Sul (MS), São Paulo (SP), and the south of the states of Mato Grosso (MT), Goiás (GO), and MG. It is important to notice that in the case of southeast MS, expressive spots of ongoing degradation were found interspersed between areas of pasture improvement [19]. Nevertheless, the most critical region is located in the Matopiba and north MG (Figure 4). Given this, the Matopiba region needs special attention to identify the drivers of pasture degradation and to increase the number of available field samples, considering that this region is not covered by the available field dataset (Figure 1), which makes it difficult for the correlation between negative NDVI slope and pasture degradation within this region.
4.2. Status of Pasture Degradation in the Cerrado and Correlation with Other Variables
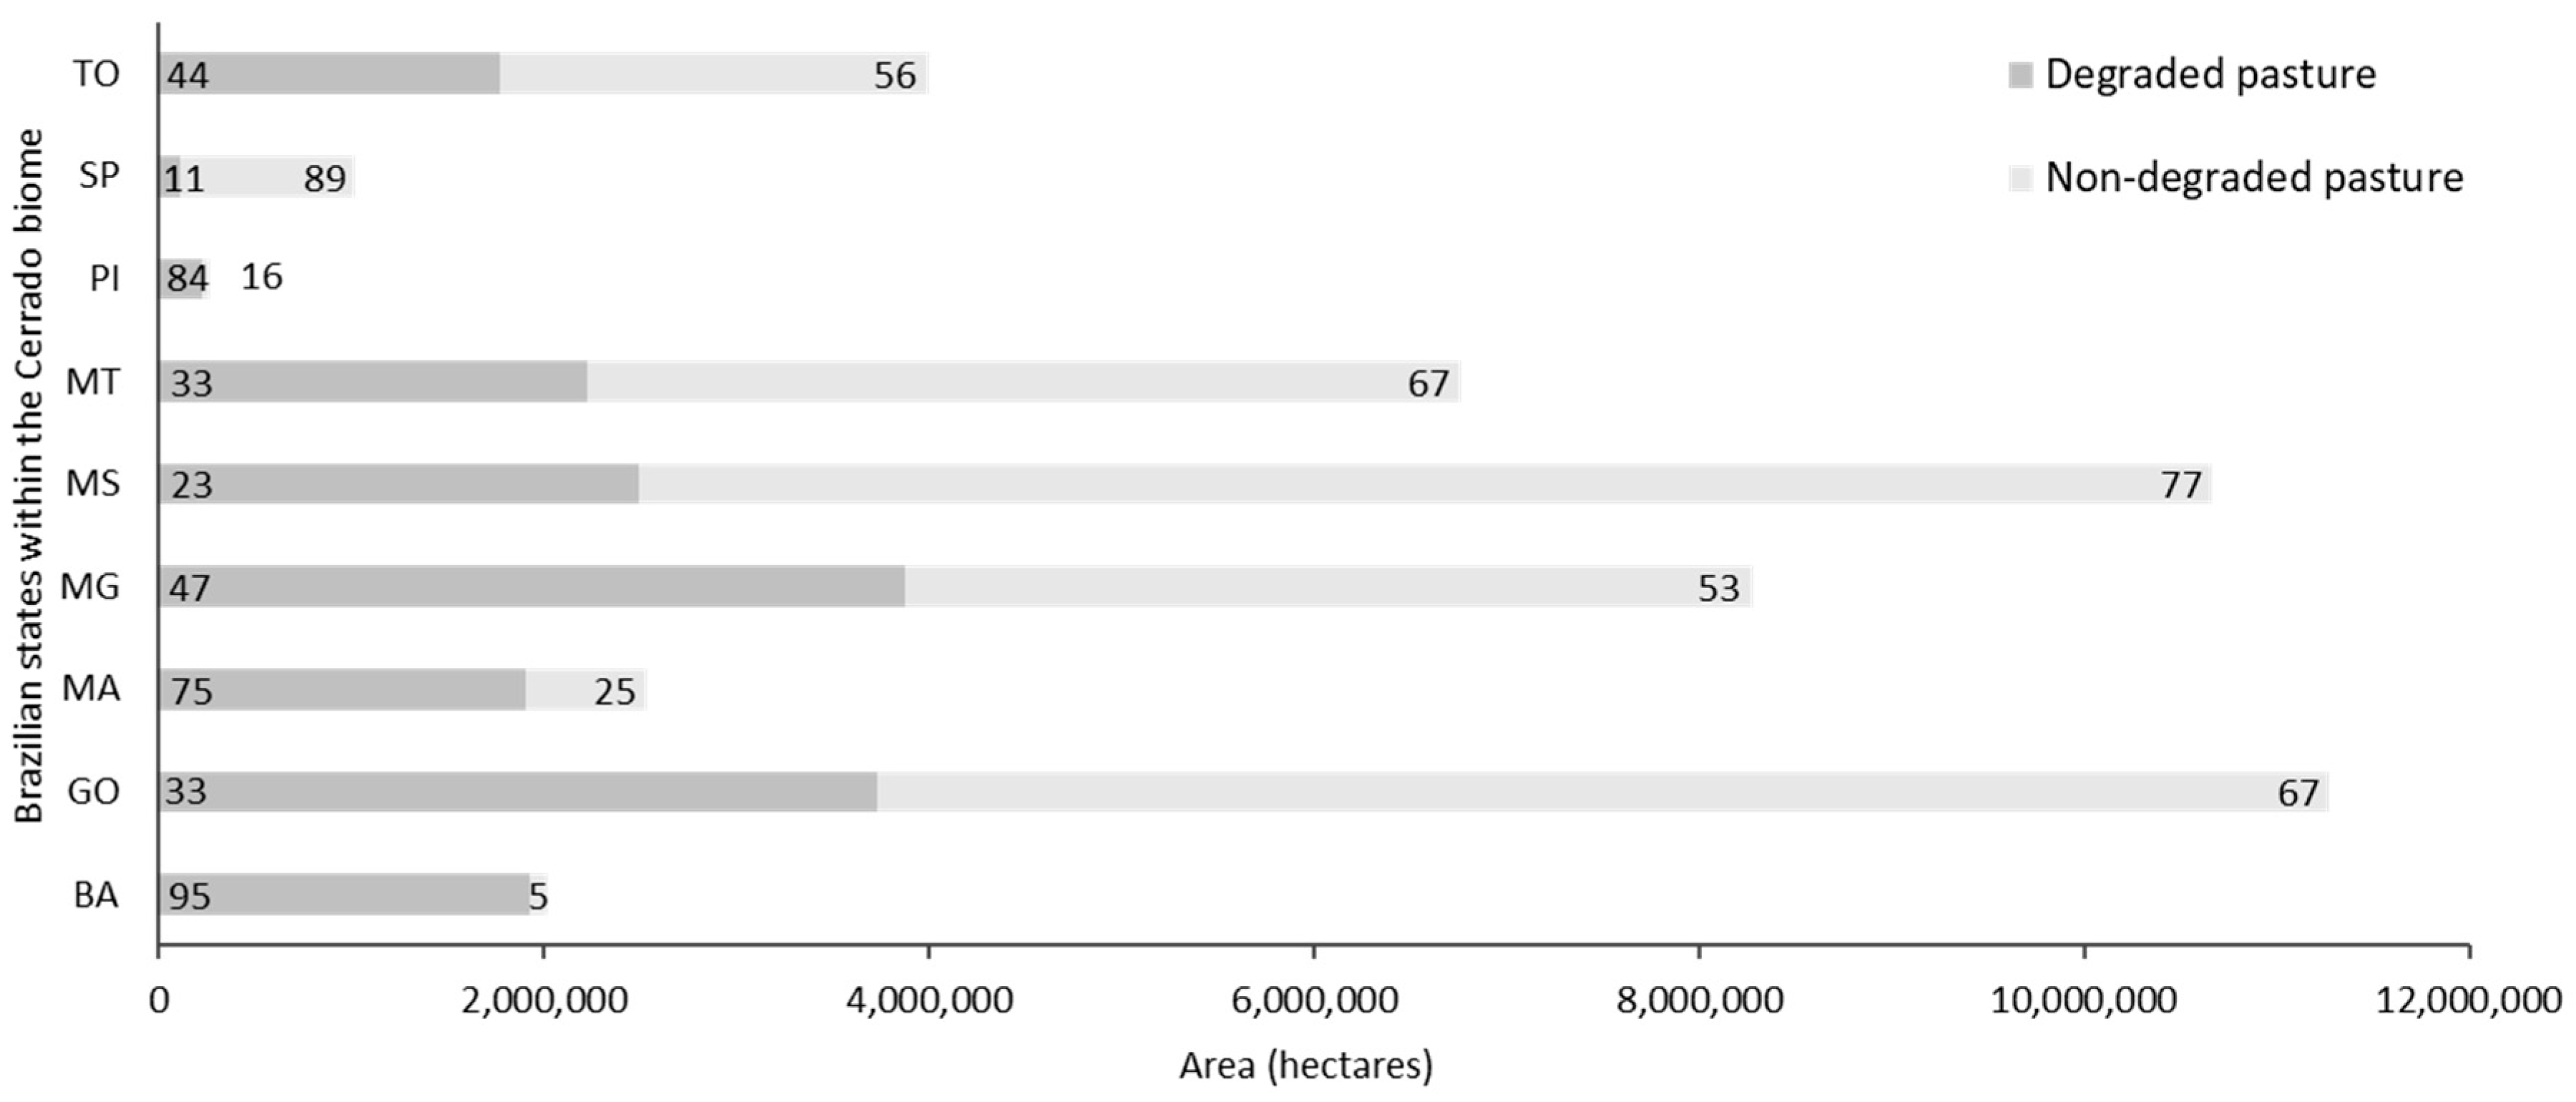
Figure 5 shows the relative and absolute areas of degraded pastures within the Brazilian states located in the Cerrado biome. According to our investigation, the largest relative area of degraded pastures is located in the Matopiba region, mostly in the states of BA, PI, and MA, followed by MG and TO, while the states with larger proportions of non-degraded pastures are SP, MS, MT, and GO. The state of BA is the most critical region, where more than 95% of the pasture area is degraded, which represents an area of about 2 million hectares against 0.09 million hectares of non-degraded pastures. Even though the states of BA, PI, and MA present larger proportions of degraded pastures, the absolute area of pastures is not as expressive as the pasture area of the states of GO, MG, MS, and MT. These states concentrate the largest areas of pasture in the Cerrado and also the largest extensions of degraded pastures, mostly in the states of GO, MG, and MS (Figure 5), that together, sums up 10 million hectares or 55% of the degraded pastures of the Cerrado biome.
With regards to the correlation between degradation and ancillary data, we observed a negative correlation between degraded pasture area and the current cattle stock (AU ha−1) (Pearson: −0.54) (Table 2). Therefore, municipalities with larger degraded areas tend to have lower cattle stocks, requiring expressive investments to increase their current cattle occupation rates. Likewise, we also observed a significant correlation (Pearson: 0.73) between the total area of degraded pastures and the total amount of rural properties that have not adopted any soil conservation practice according to the 2006 IBGE census data (Table 2) [21]. This fact suggests that degradation in the studied area may be influenced by the potential of farmers to adopt soil conservation and management practices, which, in turn, could support the future recovery of degraded pastures.
Another interesting point about pasture degradation is the positive correlation between NDVI slope values and HDI scores (Table 2); i.e., at the municipality level, the more degraded a pasture is, the lower will be the social and economic indicators, according to the 2010 IBGE census data [37] In fact, our results suggest that around 59% of the variation in the distribution of pasture degradation in the Cerrado can be explained by poverty and low income, which might reflect on the capacity of the rural population to invest in basic soil management techniques for the recovery of degraded pastures. The most critical areas, with respect to degradation and human development, are located within the Matopiba region, with the lowest HDI and lowest NDVI slope values centered at the north of BA state, south PI, and central MA. Thus, both indicators, degradation and HDI, follow a clear regional pattern with the major axis of poverty and degradation towards the north and east Cerrado. On the other hand, areas of high HDI and improved pasture are centered at the south and central Cerrado, mostly in SP, south GO, and at the border between MS and MT states.
We also compared degradation trends (NDVI slope values) with rainfall trends (CHIRPS precipitation slope values) to evaluate if the observed pasture slope trends can be explained by the inter-annual precipitation trends in the Cerrado. We found a Pearson correlation of 0.39 (Table 2) between the rainfall and NDVI trend in the Cerrado from 2010 to 2017, which indicates a moderate influence of the rainfall trend within this period. Therefore, long-term changes in rainfall patterns are seem to be an important driver of land degradation in the Cerrado in recent years. The most important area of rainfall decrease for this period is located in the central MG state, between the border of MG and GO states and at the extreme north region of MA state. Some of these regions also present negative NDVI slope trends within pastures. In fact, it is important to highlight a major axis of decreasing NDVI and rainfall trends within the entire Cerrado east region, indicating that pasture degradation might be related to the rainfall decrease in BA, PI, and north MG. Reduction of the annual rainfall rates may intensify the problem of pasture degradation, mostly in areas affected by socio-economic problems and with low investments in soil management practices, as observed in the Matopiba region and north MG state.
5. Discussion
The Cerrado biome is the main cattle production area of Brazil, with an estimated herd of 75 million animals or 44% of the Brazil’s herd, according to the IBGE census data for 2017 [43]. This herd is distributed in approximately 60 million hectares of cultivated pastures, or 28% of the biome [30]. The Cerrado is also the Brazilian biome that presented one of the highest rates of deforestation in recent years. According to government estimates [44], around 10.5 million hectares were deforested between 2008 and 2010, comprising mainly the conversion of remnants of native vegetation to pasture and to annual croplands. This scenario places the Cerrado biome in a strategic position, being a major producer of meat and agricultural export commodities and presenting one of the most endangered biodiversity areas in South America that lacks protection initiatives to curb deforestation and encouraging the production in previously deforested areas. The majority of the recently converted area is occupied by pastures, with a cattle herd below the productive potential that could be achieved through the adoption of appropriate management techniques. According to our study, 39% of the Cerrado pastures presented negative NDVI trends, indicating some level of degradation. The stock of degraded pastures is strategically important for land management, considering the sustainable expansion of agriculture in suitable degraded areas, the restoration of vegetation in areas of high ecological value, and the intensification of cattle ranching in areas of high opportunity for livestock production. However, the decision process regarding the future destination of the degraded pastures depends on the precise estimation of the location of these lands within the territory.
The estimation of the degraded pasture area is a challenging task, and, despite its strategic importance, there is no systematic mapping of these areas in the Brazilian biomes. The main reason for the lack of data focused on the estimation of the degraded pasture area is due to the complexity of the drivers related to pasture degradation, which vary according to the economic and natural conditions of the investigated regions [8]. Therefore, there is a lack of adequate approaches to estimate the extension and the degradation stage of the pasture areas. To this end, our proposed approach for the estimation of the degraded pasture area, which minimized annual variations and emphasized long-term trends, proved to be efficient in the identification of pastures undergoing productivity loss.
In general, the MODIS NDVI time-series were well correlated with the available field samples, whose descriptions were based on qualitative parameters. Nevertheless, new field campaigns are needed, especially in the most affected regions (e.g., Matopiba); likewise, it is necessary to establish an acquisition protocol that considers the measurement of quantitative proxies of degradation, including the history of soil fertility and variations in soil organic carbon (SOC) stocks, as well as the biomass production capacity. Quantitative indicators would support a more precise calibration and validation of the degradation map by allowing the direct comparison between NDVI trends and pasture conditions. Quantitative field measurements would also help in the separation of the NDVI slopes into different pasture condition categories; as the negative slopes vary continuously, the lower values are probably related to stronger degradation levels. The segmentation of the degraded pastures into different degradation stages would support a more precise plan for the future use of these lands for agriculture, cattle ranching intensification, or vegetation recovery.
We observed a significant correlation between pasture degradation and socioeconomic indicators in the Cerrado municipalities. The highest correlations were observed between the HDI and the mean NDVI slope (Pearson: 0.76), and between the total degraded pasture area and the number of farms that did not adopt soil conservation and management practices (Pearson: 0.73). Despite the high correlations, we were not able to confirm that the correlated aspects are indeed degradation drivers, since several can be the factors that lead to pasture degradation. In the case of the HDI, poverty can be considered as a driver of degradation given the low capacity for the investment in soil improvement, but the low quality of pastures, especially in rural areas, can also be one of the drivers that increase poverty in the municipalities. For the case of the investment in soil recovery, it is not possible to say that the degradation itself decreases the capacity of farmers to invest in soil management techniques and, consequently, in the cattle carrying capacity, since there are numerous factors that lead to the loss of profitability of the livestock production in these regions, intensifying the process of degradation and land abandonment. Although these aspects are not pointed as drivers of degradation, the high correlation is an important indicator of the current condition of the degraded regions and could support future plans for the use of the degraded lands
The Matopiba region and the north of MG state are the regions with the largest relative area of degraded pastures. The Matopiba is also one of the largest soybean producers in Brazil, especially in the states of BA and MA, which is related to the high rates of deforestation in the Matopiba in recent years [44]. The Matopiba has also one of the lowest indices of social development in Brazil and is often neglected in strategic agribusiness development plans [45]. This region suffers not only from the high rates of pasture degradation, but also from the marginalization of the rural population, rural exodus, land conflicts, slave labor, land speculation, land abandonment, and desertification [46]. A complex range of factors puts the Matopiba in a strategic position, given its high agricultural suitability and the low economic and social development of the region. Investing in the adequate allocation of the stock of degraded pastures in the Cerrado, especially in the Matopiba, could support valuable ecosystem services by allowing the proper destination of areas for vegetation regeneration and pasture restoration, reducing GHG emissions through reforestation, and adequate pasture management in areas currently undergoing degradation. The investment in the recovery and proper destination of the degraded pastures can further boost the local economy by enabling the sustainable expansion of agriculture in degraded suitable lands and the sustainable intensification of livestock by increasing the cattle carrying capacity of the degraded pastures. The first step in the adoption of any strategy aimed at the definition of the proper destination of the degraded pastures consists in the mapping of these areas, as presented in this study. In addition to the mapping of degraded pastures, it is also essential to map the different degrees of degradation that will support distinct strategies regarding plans of pasture recovery, agriculture expansion, and vegetation regeneration.
6. Conclusions
In this study, we estimated the distribution of pasture degradation in the Cerrado in recent years, by considering NDVI images derived from MODIS time-series, relating pasture degradation with the accumulation of NDVI negative anomalies. The adopted approach was efficient in mapping degraded pastures in the Cerrado, showing a good agreement between what was observed in the field and what can be depicted by satellite images. However, some deviation was found between sampling points and pixel stack values of observed regions, which is mostly related to the time difference between the final date of the MODIS time-series and the acquisition of field information. Despite this limitation, the resulting degradation map agrees with the spatial distribution of other variables, such as cattle stock, soil conservation practices, and population poverty, here expressed by HDI. Therefore, the generated map is an interesting source of information about pasture degradation in the Cerrado and may support future policies to recover these areas.
The association of pasture degradation with socio-economic variables indicates that the zones with the poorest management soil practices, lower income, and lower current cattle stock, are also the regions with the largest degraded pastures area, mainly found in the Matopiba region and at the north of MG state. In addition, the observed correlations between NDVI and rainfall trends suggest that pasture degradation in the Cerrado, besides being related to socio-economic aspects, is affected by decreasing rainfall patterns.
Our findings and the resultant map are instrumental for future action plans in the region concerning the recovery of degraded pastures, the sustainable expansion of agriculture, and the restoration of the native vegetation. In addition, the proper definition of public policies in the rural regions must consider the productivity capacity of the land.
Author Contributions
O.J.R.P. conceived, designed, and performed the study; analyzed the data; and wrote the manuscript. F.P. and L.B. assisted with the suggestion of the study area, insights on the revision of the manuscript and suggestions for improvement. L.G.F. provided valuable insights about pastures in Brazil, revised the manuscript and supported on the acquisition of freely available data produced by LAPIG (Image Processing and GIS Lab).
Funding
This research received no external funding.
Acknowledgments
We would like to thank The Nature Conservancy (TNC) team, especially those involved in the CFA (Collaboration Forest and Agriculture) initiative, who made this work possible by providing funds, insights, and valuable scientific support. We also thank the Agroideal working group for beef production chain in Brazil.
Conflicts of Interest
The authors declare no conflict of interest.
References
- Agard, J.; Alcamo, J.; Ash, N.; Arthurton, R.; Barker, S.; Barr, J.; Baste, I.; Chambers, W.B.; Dent, D.; Fazel, A.; et al. Global Environment Outlook: Environment for Development; EarthPrint, UNEP: Nairobi, Kenya, 2007; pp. 1–407. ISBN 9789280728361. [Google Scholar]
- Aguiar, D.A.; Mello, M.P.; Nogueira, S.F.; Gonçalves, F.G.; Adami, M.; Theodor Rudorff, B.F. MODIS time series to detect anthropogenic interventions and degradation processes in tropical pasture. Remote Sens. 2017, 9, 73. [Google Scholar] [CrossRef]
- Eswaran, H.; Lal, R.; Reich, P.F. Land degradation: An overview. Response to Land Degradation. In Proceedings of the 2nd International Conference on Land Degradation and Desertification; Oxford Press: New Delhi, India, 2001; pp. 20–35. [Google Scholar]
- Lal, R. Soil Erosion and Land Degradation: The Global Risks. In Advances in Soil Science; Lal, R., Stewart, B.A., Eds.; Springer: New York, NY, USA, 1990; Volume 11, p. 345. [Google Scholar]
- Wiegmann, K.; Hennenberg, K.J.; Fritsche, U.R. Degraded land and sustainable bioenergy feedstock production. In Proceedings of the Workshop on High Natural Value Criteria and Potential for Sustainable Use of Degraded Lands, Paris, France, 30 June–1 July 2008. [Google Scholar]
- Dias-Filho, M.B. Degradação de Pastagens: Processos, causas e estratégias. In Degrad. Pastagens Process. Causas e Estratégias; Embrapa Amazônia Oriental: Belém, Brazil, 2005; pp. 1–173. ISBN 978-85-911831-0-4. [Google Scholar]
- Barrow, C. Land Degradation: Development and Breakdown of Terrestrial Environments; Cambridge University: New York, USA, 1991; pp. 1–313. ISBN 9780521466158. [Google Scholar]
- Gibbs, H.K.; Salmon, J.M. Mapping the world’s degraded lands. Appl. Geogr. 2015, 57, 12–21. [Google Scholar] [CrossRef]
- Bot, A.J.; Nachtergaele, F.O.; Young, A. Land Resource Potential and Constraints at Regional and Country Levels; World Soil Resources Reports; Food and Agriculture Organization (FAO): Rome, Italy, 2000; pp. 1–114. [Google Scholar] [CrossRef]
- Dregne, H.E.; Chou, N.T. Global desertification dimensions and costs. In Degradation and Restoration of Arid Lands; Texas Tech University: Lubbock, TX, USA, 1992; pp. 73–92. [Google Scholar]
- Oldeman, L. The global extent of soil degradation. In Soil Resilience and Sustainable Land Use; CAB International: Wallingford, UK, 1994; pp. 19–36. [Google Scholar]
- Bai, Z.G.; Dent, D.L.; Olsson, L.; Schaepman, M.E. Proxy global assessment of land degradation. Soil Use Manag. 2008, 24, 223–234. [Google Scholar] [CrossRef] [Green Version]
- Cai, X.; Zhang, X.; Wang, D. Land availability for biofuel production. Environ. Sci. Technol. 2011, 45, 334–339. [Google Scholar] [CrossRef] [PubMed]
- Campbell, J.E.; Lobell, D.B.; Field, C.B. Greater transportation energy and GHG offsets from bioelectricity than ethanol. Science 2009, 324, 1055–1057. [Google Scholar] [CrossRef] [PubMed]
- Field, C.B.; Campbell, J.E.; Lobell, D.B. Biomass energy: The scale of the potential resource. Trends Ecol. Evol. 2008, 23, 65–72. [Google Scholar] [CrossRef] [PubMed]
- Eiumnoh, A. Tools for identification, assessment, and monitoring of land degradation. In Response to Land Degradation; Bridges, E.M., Hannam, I.D., Eds.; Oxford & IBH Publishing: New Delhi, India, 2001; Volume 22, pp. 1–507. ISBN 1-57808-153-X. [Google Scholar]
- Symeonakis, E.; Drake, N. Monitoring desertification and land degradation over sub-saharan Africa. Int. J. Remote Sens. 2004, 25, 573–592. [Google Scholar] [CrossRef]
- Wessels, K.J.; Prince, S.D.; Frost, P.E.; Van Zyl, D. Assessing the effects of human-induced land degradation in the former homelands of northern South Africa with a 1 km AVHRR NDVI time-series. Remote Sens. Environ. 2004, 91, 47–67. [Google Scholar] [CrossRef]
- Cohn, A.S.; Mosnier, A.; Havlik, P.; Valin, H.; Herrero, M.; Schmid, E.; O’Hare, M.; Obersteiner, M. Cattle ranching intensification in Brazil can reduce global greenhouse gas emissions by sparing land from deforestation. Proc. Natl. Acad. Sci. USA 2014, 111, 7236–7241. [Google Scholar] [CrossRef] [PubMed] [Green Version]
- Dias Filho, M.B. Diagnóstico das Pastagens No Brasil; Embrapa Amazônia Oriental: Belém, Brazil, 2014; p. 22. [Google Scholar]
- Instituto Brasileiro de Geografia e Estatística (IBGE). Censo Agropecuário 2006; IBGE: Rio de Janeiro, Brazil, 2009; p. 777. [Google Scholar]
- EMBRAPA. Geodegrad: Desenvolvimento de Geotecnologias para Identificação e Monitoramento de Níveis de Degradação em Pastagens. Available online: http://www.geodegrade.cnpm.embrapa.br/apresentacao (accessed on 3 May 2017).
- BNDES. Programa ABC (Agricultura de Baixo Carbono). Available online: https://www.bndes.gov.br/wps/portal/site/home/financiamento/produto/programa-abc (accessed on 1 February 2018).
- Gurgel, A.C.; Fagan, C.F.; Serigati, F.C. Agricultura de Baixa Emissão de Carbono: A Evolução de um novo Paradigma; Observatório ABC; Fundação Getúlio Vargas/Centro de Agronegócio da Escola de Economia de São Paulo: São Paulo, Brazil, 2013; p. 192. [Google Scholar]
- Tasumi, M.; Hirakawa, K.; Hasegawa, N.; Nishiwaki, A.; Kimura, R. Application of MODIS Land Products to Assessment of Land Degradation of Alpine Rangeland in Northern India with Limited Ground-Based Information. Remote Sens. 2014, 6, 9260–9276. [Google Scholar] [CrossRef] [Green Version]
- Instituto Brasileiro de Geografia e Estatística (IBGE). Mapa de Biomas e de Vegetação. Geociências. Mapa Biomas e Veg. 2015, 4. Available online: https://ww2.ibge.gov.br/home/presidencia/noticias/21052004biomashtml.shtm (accessed on 1 March 2018).
- Marcuzzo, F.; Melo, D.; Rocha, H. Distribuição Espaço-Temporal e Sazonalidade das Chuvas no Estado do Mato Grosso. Rev. Bras. Recur. Hídr. 2011, 16, 157–167. [Google Scholar] [CrossRef]
- Ferreira, L.G.; Huete, A.R. Assessing the seasonal dynamics of the Brazilian Cerrado vegetation through the use of spectral vegetation indices. Int. J. Remote Sens. 2004, 25, 1837–1860. [Google Scholar] [CrossRef]
- Ferreira, L.G.; Fernandez, L.E.; Sano, E.E.; Field, C.; Sousa, S.B.; Arantes, A.E.; Araújo, F.M. Biophysical properties of cultivated pastures in the brazilian savanna biome: An analysis in the spatial-temporal domains based on ground and satellite data. Remote Sens. 2013, 5, 307–326. [Google Scholar] [CrossRef]
- Parente, L.; Ferreira, L.; Faria, A.; Nogueira, S.; Araújo, F.; Teixeira, L.; Hagen, S. Monitoring the brazilian pasturelands: A new mapping approach based on the landsat 8 spectral and temporal domains. Int. J. Appl. Earth Obs. Geoinf. 2017, 62, 135–143. [Google Scholar] [CrossRef]
- Instituto Brasileiro de Geografia e Estatística (IBGE). Produção da Pecuária Municipal—PPM. Available online: https://www.ibge.gov.br/estatisticas-novoportal/economicas/agricultura-e-pecuaria/9107-producao-da-pecuaria-municipal.html?&t=o-que-e (accessed on 3 May 2018).
- Huete, A.; Didan, K.; Miura, T.; Rodriguez, E.P.; Gao, X.; Ferreira, L.G. Overview of the radiometric and biophysical performance of the MODIS vegetation indices. Remote Sens. Environ. 2002, 83, 195–213. [Google Scholar] [CrossRef]
- Solano, R.; Didan, K.; Jacobson, A.; Huete, A. MODIS Vegetation Index User’s Guide (MOD13 Series). In Vegetation Index and Phenology Lab; 2010; Available online: https://vip.arizona.edu/documents/MODIS/MODIS_VI_UsersGuide_June_2015_C6.pdf (accessed on 5 May 2018).
- LAPIG. PAVAN (Pasture Evaluation Network)—Points. Available online: http://maps.lapig.iesa.ufg.br/lapig.html (accessed on 3 September 2017).
- Funk, C.; Peterson, P.; Landsfeld, M.; Pedreros, D.; Verdin, J.; Shukla, S.; Husak, G.; Rowland, J.; Harrison, L.; Hoell, A.; et al. The climate hazards infrared precipitation with stations—A new environmental record for monitoring extremes. Sci. Data 2015, 2. [Google Scholar] [CrossRef] [PubMed]
- LAPIG. Lotação Bovina No Brasil. Available online: http://maps.lapig.iesa.ufg.br/lapig.html (accessed on 15 January 2018).
- Instituto Brasileiro de Geografia e Estatística (IBGE). Censo 2010. Available online: https://sidra.ibge.gov.br/pesquisa/censo-demografico/demografico-2010/inicial (accessed on 15 October 2017).
- Eckert, S.; Hüsler, F.; Liniger, H.; Hodel, E. Trend analysis of MODIS NDVI time series for detecting land degradation and regeneration in Mongolia. J. Arid Environ. 2015, 113, 16–28. [Google Scholar] [CrossRef]
- Ibrahim, Y.Z.; Balzter, H.; Kaduk, J.; Tucker, C.J. Land degradation assessment using residual trend analysis of GIMMS NDVI3g, soil moisture and rainfall in Sub-Saharan West Africa from 1982 to 2012. Remote Sens. 2015, 7, 5471–5494. [Google Scholar] [CrossRef]
- LAPIG. Mapa Síntese da Área de Pastagem (MSP) para o Território Brasileiro. Available online: http://maps.lapig.iesa.ufg.br/lapig.html (accessed on 3 August 2017).
- Al-Bakri, J.T.; Taylor, J.C. Application of NOAA AVHRR for monitoring vegetation conditions and biomass in Jordan. J. Arid Environ. 2003, 54, 579–593. [Google Scholar] [CrossRef]
- Bolfe, É.L.; Victória, D.; de, C.; Contini, E.; Bayma-Silva, G.; Spinelli-Araujo, L.; Gomes, D. Matopiba em crescimento agrícola Aspectos territoriais e socioeconômicos. Rev. Polít. Agríc. 2016, 24, 38–62. [Google Scholar]
- Instituto Brasileiro de Geografia e Estatística (IBGE). Censo Agropecuário 2017, 1st ed.; IBGE: Rio de Janeiro, Brazil, 2018; ISBN 0103-6157. [Google Scholar]
- INPE. Incremento Anual de área desmatada no Cerrado Brasileiro—PRODES. Available online: http://www.obt.inpe.br/cerrado (accessed on 10 March 2018).
- Bragança, A. Insights as Agricultural Production Surges in Matopiba, What Are the Consequences for the Local Economy? 2016. Available online: https://climatepolicyinitiative.org/publication/agricultural-production-surges-matopiba-consequences-local-economy/ (accessed on 29 August 2018).
- Campos, C.; Morais, L.; Sá, H.A. Que desenvolvimento é esse? Análise da expansão do agronegócio da soja na área do MATOPIBA a partir de uma perspectiva furtadiana. In Proceedings of the XXI Congresso Brasileiro de Economia, Curitiba, Brazil, 9–11 September 2015. [Google Scholar]
Figure 1.
Location of the Cerrado study area, highlighting the regions of cultivated pastures based on 2016 estimates [30]. The points represent the field samples used in this study.
Figure 1.
Location of the Cerrado study area, highlighting the regions of cultivated pastures based on 2016 estimates [30]. The points represent the field samples used in this study.

Figure 2.
General diagram of the methodological workflow. The same flow was adopted to process CHIRPS data (regarding precipitation) as an ancillary variable for correlation with NDVI.
Figure 2.
General diagram of the methodological workflow. The same flow was adopted to process CHIRPS data (regarding precipitation) as an ancillary variable for correlation with NDVI.

Figure 3.
Average cumulative values of NDVI (considering field samples, as listed in Table 1), according to three major pasture condition stages.
Figure 3.
Average cumulative values of NDVI (considering field samples, as listed in Table 1), according to three major pasture condition stages.

Figure 4.
Map showing the spatial distribution of NDVI cumulative slope values (2010 to 2017) within the Cerrado pasture areas (2010–2017).
Figure 4.
Map showing the spatial distribution of NDVI cumulative slope values (2010 to 2017) within the Cerrado pasture areas (2010–2017).

Figure 5.
Absolute and relative (%) areas of degraded and non-degraded pastures in the Cerrado biome within the Brazilian states. Light gray and dark gray columns represent non-degraded and degraded pastures, respectively, and the values in the columns show the relative area (%) of each pasture category.


Table 1.
Description of field samples used for evaluating the accuracy of pasture degradation map.
| ID * | Last Management | Management Type | Description | Stage ** | NDVI Slope |
|---|---|---|---|---|---|
| 175 | - | fertilization and limestone | Subsistence meat production | 0 | 53.67 |
| 171 | 2014 | fertilization and limestone | Yearly crop rotation—integrated system | 0 | 46.44 |
| 186 | 2013 | fertilization and limestone | Pasture in good condition | 0 | 33.08 |
| 35 | 2014 | crop rotation | Crop rotation every 5 years | 0 | 30.39 |
| 34 | - | fertilization and limestone | Pasture restored every 10 years | 0 | 28.72 |
| 177 | 2014 | fertilization and limestone | Used for sheep meat production | 0 | 20.48 |
| 214 | 2012 | fertilization and limestone | Yearly crop rotation—integrated system | 0 | 18.39 |
| 174 | - | fertilization and limestone | Subsistence milk production | 0 | 17.02 |
| 215 | 2013 | fertilization and mowing | Intensified beef production | 0 | 16.61 |
| 181 | 2014 | fertilization and limestone | Subsistence meat production | 0 | 15.72 |
| 184 | 2014 | fertilization and mowing | Used for sheep meat production | 0 | 9.76 |
| 176 | 2014 | organic fertilization | Subsistence milk production | 0 | 3.94 |
| 187 | 2011 | limestone | Pasture with termite proliferation | 1 | 17.76 |
| 217 | 1994 | No current management | Pasture with termite proliferation | 1 | 12.19 |
| 197 | 2014 | limestone | Subsistence meat production | 1 | −4.22 |
| 199 | Never | mowing | Subsistence meat production | 1 | −6.66 |
| 189 | 2000 | No Management | Used for beef and milk production | 1 | −7.18 |
| 196 | 2014 | No Management | Subsistence meat production | 1 | −20.81 |
| 62 | Never | No Management | Pasture with bare soil | 2 | 8.74 |
| 74 | Never | No Management | Pasture with bare soil | 2 | 2.88 |
| 193 | Never | No Management | Pasture with invasive species | 2 | −0.41 |
| 83 | Never | No Management | Pasture with bare soil | 2 | −2.59 |
| 5 | Never | No Management | Pasture with bare soil | 2 | −8.64 |
| 82 | Never | No Management | Pasture with bare soil | 2 | −10.13 |
| 64 | Never | No Management | Pasture with bare soil | 2 | −16.53 |
| 192 | Never | No Management | Used for beef and milk production | 2 | −22.72 |
| 190 | Never | No Management | Used for beef and milk production | 2 | −42.6 |
| 81 | Never | No Management | Pasture with bare soil | 2 | −56.15 |
* original identification of the sample dataset [34]. ** Pasture degradation stages. 0 represents non-degraded pastures; 1 represents degraded pastures; and 2 represents severely degraded pastures.
Table 2.
Pearson correlation between pasture degradation (as indicated by mean NDVI negative slopes) and other variables related to degradation (at the municipality scale level and only for municipalities with more than 50 ha of pasture).
Table 2.
Pearson correlation between pasture degradation (as indicated by mean NDVI negative slopes) and other variables related to degradation (at the municipality scale level and only for municipalities with more than 50 ha of pasture).
| Animal Units (UA ha−1) | No Management Farms | Degraded Pastures (ha) | Degraded Pastures (%) | NDVI Slope | HDI | Rainfall Slope | |
|---|---|---|---|---|---|---|---|
| Animal Units (UA ha−1) | 1.00 | ||||||
| No management farms | −0.26 | 1.00 | |||||
| Degraded pastures (ha) | −0.31 | 0.73 | 1.00 | ||||
| Degraded pastures (%) | −0.54 | 0.39 | 0.44 | 1.00 | |||
| NDVI Slope | 0.17 | −0.11 | −0.24 | −0.47 | 1.00 | ||
| HDI | 0.18 | −0.09 | −0.11 | −0.43 | 0.76 | 1.00 | |
| Rainfall Slope | 0.18 | 0.05 | 0.16 | −0.20 | 0.39 | 0.41 | 1.00 |
© 2018 by the authors. Licensee MDPI, Basel, Switzerland. This article is an open access article distributed under the terms and conditions of the Creative Commons Attribution (CC BY) license (http://creativecommons.org/licenses/by/4.0/).
Share and Cite
MDPI and ACS Style
Pereira, O.J.R.; Ferreira, L.G.; Pinto, F.; Baumgarten, L. Assessing Pasture Degradation in the Brazilian Cerrado Based on the Analysis of MODIS NDVI Time-Series. Remote Sens. 2018, 10, 1761. https://doi.org/10.3390/rs10111761
AMA Style
Pereira OJR, Ferreira LG, Pinto F, Baumgarten L. Assessing Pasture Degradation in the Brazilian Cerrado Based on the Analysis of MODIS NDVI Time-Series. Remote Sensing. 2018; 10(11):1761. https://doi.org/10.3390/rs10111761
Chicago/Turabian StylePereira, Osvaldo José Ribeiro, Laerte G. Ferreira, Flávia Pinto, and Leandro Baumgarten. 2018. "Assessing Pasture Degradation in the Brazilian Cerrado Based on the Analysis of MODIS NDVI Time-Series" Remote Sensing 10, no. 11: 1761. https://doi.org/10.3390/rs10111761
Note that from the first issue of 2016, this journal uses article numbers instead of page numbers. See further details here.