Remote Sensing-Based Proxies for Urban Disaster Risk Management and Resilience: A Review


1
Faculty of Geo-Information Science and Earth Observation (ITC), University of Twente, Enschede 7500 AE, The Netherlands
2
Centre for Studies in Technology and Sustainable Development, University of Twente, Enschede 7500 AE, The Netherlands
*
Author to whom correspondence should be addressed.
Remote Sens. 2018, 10(11), 1760; https://doi.org/10.3390/rs10111760
Submission received: 14 August 2018
/
Revised: 14 October 2018
/
Accepted: 1 November 2018
/
Published: 7 November 2018
(This article belongs to the Special Issue Earth Observation to Support Disaster Preparedness and Disaster Risk Management)
Abstract
:Rapid increase in population and growing concentration of capital in urban areas has escalated both the severity and longer-term impact of natural disasters. As a result, Disaster Risk Management (DRM) and reduction have been gaining increasing importance for urban areas. Remote sensing plays a key role in providing information for urban DRM analysis due to its agile data acquisition, synoptic perspective, growing range of data types, and instrument sophistication, as well as low cost. As a consequence numerous methods have been developed to extract information for various phases of DRM analysis. However, given the diverse information needs, only few of the parameters of interest are extracted directly, while the majority have to be elicited indirectly using proxies. This paper provides a comprehensive review of the proxies developed for two risk elements typically associated with pre-disaster situations (vulnerability and resilience), and two post-disaster elements (damage and recovery), while focusing on urban DRM. The proxies were reviewed in the context of four main environments and their corresponding sub-categories: built-up (buildings, transport, and others), economic (macro, regional and urban economics, and logistics), social (services and infrastructures, and socio-economic status), and natural. All environments and the corresponding proxies are discussed and analyzed in terms of their reliability and sufficiency in comprehensively addressing the selected DRM assessments. We highlight strength and identify gaps and limitations in current proxies, including inconsistencies in terminology for indirect measurements. We present a systematic overview for each group of the reviewed proxies that could simplify cross-fertilization across different DRM domains and may assist the further development of methods. While systemizing examples from the wider remote sensing domain and insights from social and economic sciences, we suggest a direction for developing new proxies, also potentially suitable for capturing functional recovery.
Keywords:
urban DRM; remote sensing; damage; recovery; vulnerability; resilience; economic; social; proxy; indirect measurement1. Introduction
By 2050, 80% of the world population will live in urban areas [1]. This unprecedented clustering of infrastructure and people has been shifting the focus of Disaster Risk Management (DRM) studies towards cities. Furthermore, the ability of a system to resist, absorb, accommodate to, and recover from the effects of a hazard in a timely and efficient manner—known as resilience—has become crucial to decrease the disaster risk [2]. Resilience also encompasses post-event processes that allow for communities to reorganize, change, and learn in response to an event [3]. Hence, enhancing community’s resilience to natural hazards implies improving its capacity to anticipate threats, to reduce own overall vulnerability, and to allow the community to recover from adverse impacts when they occur. Decades of disaster research offer extensive findings in this respect [4,5,6,7]. Remote sensing (RS)—as an effective and rapid tool for monitoring large areas—is essential for the acquisition of geospatial data, which in turn constitutes the basis for risk assessment and management. RS is widely used for various aspects of the DRM, ranging from vulnerability [8] to rapid damage assessments [9], for diverse areas ranging from coastal ecosystems [10] to complex urban settings [11], and for disasters as diverse as landslides [12,13] or cyclones [14].
Numerous methods have been developed to extract information from RS data to identify, characterize, or quantify different phases of the disaster risk cycle: response, recovery, prevention/mitigation, and preparedness [15]. However, early studies predominantly considered the physical side of the assessments for both pre- and post-disaster phases and hazard assessment, using direct observations. For example, scholars have assessed the number of buildings collapsed/damaged [16,17] and reconstructed [18], or estimated their vulnerability [19]. However, the attention to the non-physical side of DRM in both pre- and post-disaster situations was scare. Non-physical assessments usually comprise social, economic, and natural aspects in addition to the built-up ones, which refer to physical assessments, e.g., physical vulnerability assessment [20]. Recent studies started to include socio-economic aspects when examining DRM phases such as vulnerability [21,22], resilience [23], damage [24,25], and recovery [26] assessments. While several spatial and non-spatial parameters required for detecting and quantifying of DRM-related elements can be extracted directly from RS imagery, many have to be elicited indirectly. Similarly, Indirect measurements are fundamental tools in related research fields, such as environmental science [27]. They have been also used in social and economic studies in the DRM context, e.g., for social vulnerability [28] and business recovery [29] assessments. Proxies have become central in RS-based DRM studies due to the inherent characteristics of several urban elements, such as social and economic activities, which makes it very difficult, if not impossible, to directly observe them using RS data. Proxies use observable features in RS data used to capture and extract information of interest that is not directly visible or measurable, but is correlated with the former. In recent years, using proxies has become the predominant approach to capture implicit information in urban DRM, for both pre- and post-disaster situations [30]. For example, texture is used as a proxy to extract damage to buildings and roads, with irregular texture indicating damaged area. For the purpose of this review, the most relevant components of the disaster risk cycle for use of RS in urban areas are the post-disaster phase proxies focusing on damage and recovery, and the pre-disaster phase proxies measuring vulnerability and resilience.
This work was specifically motivated by a number of limitations in the published literature. Firstly, there is inconsistency in terminology: indirect measurements labelled by various terms, such as index [31], indicator [32], and proxy [33]. In this paper, the term proxy is overarching for all such indirect measurements. Secondly, duplications in efforts: in certain cases methodologically the same proxies have been developed independently in more than one domain. For instance, the presence of vegetation in urban areas has been used as a proxy for both social vulnerability [33] and post-disaster recovery [34] assessments. Thirdly, the current DRM literature suggests several proxies that are, at times, unreliable. For example, the presence of vehicles has been used to evaluate the accessibility of the roads [34]. However, the metric is highly dependent on the image acquisition date and time, and other legal or environmental parameters that affect the presence of vehicles. Finally, need to go beyond the physical side towards functional assessments is prominent. Yet, few proxies have been developed for social, economic, and functional assessments in urban DRM. This paper conducts critical analyses on current RS-based proxies and borrows insights from other research fields (e.g., the economy and social sciences). To address these limitations, we conduct a systematical review following a number of steps. We start by splitting reviewed proxies into four groups that characterize built-up, economic, social, and natural environments. Then, a proxy catalog for each group is generated based on the reviewed studies that were used by researchers and governments in the different DRM phases. Finally, a comprehensive analysis is done on the reviewed proxies, and the most suitable proxies for each DRM situation are discussed. These analyses demonstrate current limitations, including lack of proxies to evaluate urban functions for DRM and suggests future directions in developing new proxies. Furthermore, proxies originating from the wider RS domain and other disciplines—urban form studies, structural engineering, and natural sciences—were identified and systemized in this paper. This structured analysis may provide guidance for developing reliable RS-based proxies.
The review is structured as follows. Section 2 defines the terminology used for indirect measurements, i.e., proxy, in this article. In Section 3, we explain the methodology employed for this review. Section 4 presents a comprehensive literature review of RS-based proxies for each of the four selected environments, as well as a corresponding table of proxies. In addition, new insights towards improving current or developing new proxies are provided based on the state of the art analysis from different research fields, including urban form studies, structural engineering, economics, and natural sciences. The final section provides conclusions and outlines directions for future development of the field.
2. Defining A Proxy in Remote Sensing
Indirect estimation using proxies allows researchers to deduce the condition of an element or process based on their relations and links with directly identifiable and observable features in the surrounding/neighboring areas. According to the Oxford Dictionary, a proxy is a figure that can be used to represent the value of a non-directly measurable object in a calculation. In statistics, it is a measurable variable that is used in place of a variable that cannot be measured [35]. Moreover, there are good examples of using proxies in economics, such as per capita Gross Domestic Product (GDP) being a proxy for growth in wealth and potentially quality of life [36].
There is currently no clear definition for proxy in RS-based studies, though proxies play a critical role in this field. When considering the growing role of proxies in RS, similarities and differences can be found when compared with the traditional use of proxies, particularly in the wider geosciences (including climatology). In all disciplines, proxies have been used as indirect variables to determine or to constrain unobservable or immeasurable variables or as physical variables to go back in time and measure the immeasurable or unobservable parameters because of lack of data from that time. However, passive RS is by definition an indirect form of measurement and an information source that acquires data at a certain time. By that logic, any image derivative or index measure is a proxy. Therefore, the traditional definition of the proxy cannot be used in this field. In this paper, the term proxy is defined as use of observable physical features or directly measurable variables to understand and extract what actually exists on the ground, but what is not directly observable or measurable from RS data. For example, the proportion of built-up and vegetated area has been measured and used as a proxy to determine a settlement type to determine the vulnerability of such settlements to disasters [33]. Proxies can also be separated into two groups based on their use in the RS field:
- (i)
- (ii)
- and measures to assess processes and functions, e.g., the building morphology and use to determine functionality of buildings and urban areas to assess the post-disaster recovery processes and vulnerability [39].
3. Methods
We systemize the published literature based on classification by (i) DRM stage (focus on pre- and post-disaster) zooming into vulnerability, resilience, damage, and recovery assessments practices, and by (ii) the type of environment changes in which a proxy tries to capture. Each is common in DRM literature and fits well the main purpose of this article. Following [20], we differentiate between 4 types of environment: (1) the built-up environment divided into ‘buildings’, ‘transport’ and ‘others’; (2) the economic environment with ‘macro, regional and urban economics’ and ‘logistics’ subcategories; (3) the social environment covering ‘services and infrastructure’ and ‘socio-economic status’; and (4) the natural environment.
This review is based on a systematic literature search, performed in summer 2018, using several databases (Web of Science, ScienceDirect, SpringerLinkjournals, Taylor&Francis, and Scopus). We select the articles for this review, using the following keywords: indirect, proxy, proxies, index, indices, indicator, and remote sensing, GIS, vector, raster, map, satellite image, aerial image, lidar, UAV, UAS, drone, crowdsourced, ground image, ground photo, and resilience, resilient, adaptive capacity, coping capacity, preparation, prevention, vulnerability, damage, response, impact, rescue, recovery, reconstruction, rehabilitation, and relief. These keywords are selected to address the goal of the review: to provide a systematic categorization of proxies for DRM and resilience, supporting them with some key citations and relevant state-of-the-art examples. Finding relevant papers for this review was difficult, because not necessarily all of the papers use keywords to describe their indirect measurements (proxies). Indeed, with nearly every type of passive RS being per se indirect, every form of processing of such data inherently uses proxies. Furthermore, there are many commonly used proxies (e.g., NDVI for vegetation cover extraction, the number or configuration of buildings to extract information about urban sprawl and presence of slums, nightlights to detect electrification) that researchers accept as natural RS-based measurements, without labeling them as proxies. Hence, there may be additional studies using RS-based proxies that are not included in this review due to different terminology. Moreover, there might be uncertainties in the used terms for the selected pre-and post-disaster situations, which also made it hard to find relevant studies. For example, for post-disaster damage assessment, similar key phrases have been used such as response to a disaster [40], and impacts of a disaster [41]. Naturally, to the best of our knowledge, we have carried the search as comprehensively as possible. Since the purpose of this article is to provide a structured overview of existing approaches with exemplary citations on key studies rather than perform a full coverage of the literature, the core conclusions are not affected. The review covered journal publications, book sections and conference publications that can be retrieved either via the research engines employed or the websites of the main RS conferences. Only English language papers were considered.
4. Remote Sensing-Based Proxies for DRM in Urban Areas
In total, we identify 114 key publications. Out of these, 52 papers address damage assessment and 21, 40, and seven articles focus on recovery, vulnerability, and resilience assessments, respectively. Papers with a focus on two DRM areas, e.g., both damage and recovery assessments, are counted on both of them separately. A chronological overview of the publications shows an increasing trend in studies for RS-based proxy literature for urban DRM (Figure 1). Continuous progress in RS technology and sensors, which supplies ever more diverse and detailed image data to a growing number of communities, is one of the reasons behind this increase. Furthermore, an understanding that DRM assessments have to go beyond capturing the physical impact, calls for a need for indirect measurements, which also contributed to this increase.
Figure 2 shows the number of RS-based proxies that have been developed for each component of DRM. The built-up environment is the most frequently studied one with 35 RS-based proxies developed. Natural environment accounts for the lowest number of developed RS-based proxies, offering a choice of 13. Furthermore, the Economic and Social environments both have 21 developed RS-based proxies. Some proxies that are used interchangeably in more than one area, e.g., damage and recovery assessments, are counted on all of the used categories separately.
4.1. Built-Up RS-Based Proxies
The build-up environment in urban areas tends to be significantly impacted during a disaster and these adverse impacts are relatively easy to detect. It makes this category the most studied in the RS literature (Figure 1), with the majority of RS-based proxies being developed here as compared to other environments within urban DRM (Table 1, Table 2 and Table 3). To discuss and explain the proxies in detail the built-up component is separated into three main categories: Buildings, Transport, Others.
4.1.1. Buildings Category
The predominant land cover in urban areas is the buildings class. This is why one of the mostly used proxies for damage [37] and recovery [42] assessments in urban DRM is extracting the status of the buildings. For example collapsed/damaged or reconstructed buildings are detected either using multi-temporal RS data by comparing the pre-event and post-event situations [43], or only using mono-temporal RS data acquired after the disaster [44]. For example, Bevington, et al. [25] identify the damage level in urban areas after the Haiti earthquake by extracting buildings damage while using qualitative analysis from satellite imagery along with the integration of visual field data. Similarly, Chen, et al. [45] use aerial photography to identify collapsed and damaged buildings (residential houses), and develop a damage pattern mining framework to detect them. Besides, the physical changes in the recovery processes are assessed mostly using a pathway from rubble of collapsed buildings to standing (reconstructed) buildings. Hence, Platt, et al. [32] use the reconstruction of buildings as a proxy for recovery assessment after an earthquake. Several studies also employ this proxy for physical recovery assessments [32,34,46,47,48,49]. A reconstruction of some specific buildings (e.g., commercial buildings) is also used as a proxy for socio-economic recovery assessments [49]. However, all of them disregard the functional recovery assessment of buildings, which indicates whether a building is operating and/or the building is being used for its intended type of activity (e.g., commercial).
In addition, the value of point height change has been used as a proxy to extract information for grading the damage for each building using pre- and post-earthquake DEMs [50]. Although this proxy provides a good source of information to assess per building damages, it cannot detect damages that do not necessarily change the value of the height of the buildings, such as cracks and holes in facades.
Some proxies are considered as higher level ones due to their indirect observability in addition to indirect interpretations to indicate something meaningful for computation. One of them is shadow, which has been used in the DRM context to extract information about collapsed/damaged/reconstructed structures from RS images [44,51,52,53]. Kerle and Hoffman [37] provide a comprehensive discussion of pros and cons of using shadow as a proxy to detect building-based changes. They demonstrate that, although missing or smaller shadows compared to pre-event situation may indicate a damaged or collapsed buildings (e.g., pancake collapse), the sun direction differences between the acquired images resulting in shadow changes, can lead to confusion. Image texture has frequently been used as a proxy to identify damaged/collapsed buildings [54,55,56,57], damaged roads [58,59], and damaged areas [9,60] from RS imagery. Damaged buildings/areas have more irregular texture than intact ones [55]; therefore, the damaged/collapsed ones can be extracted by comparing their textures. However, this proxy may not be reliable in detecting damages to informal settlement (slums) since they normally have irregular textures. Moreover, texture has been shown as useful additional information for urban structure discriminations, and has been used for building seismic vulnerability analysis [61,62].
In addition, building roof offsets between adjacent buildings have been used as a proxy to detect pancake collapse, in which the building is characterized by an intact roof but collapsed floors [37]. Building material has been used for vulnerability [62,63] and resilience assessments [64,65,66]. Building material detection from RS data is typically based on the interpretation of rooftop colors from aerial or satellite images without considering other materials of building (e.g., building wall materials). Data by drones/UAV on facades status have a potential to offer more reliable proxies for building material analysis/assessment due to providing information about the walls and other elements of the buildings in the facades in addition to their rooftops [67]. Energy loss by buildings has been used as a proxy for recovery [49], where a decrease in energy loss of a structure is considered as a sign of positive recovery, as it indicates an improved building standard. This proxy is extracted based on the heat level of structures using hyperspectral imagery. A lower heat level of a house shows a lower energy loss level. The rate of energy loss reduction of houses demonstrates their insulation level and is related to building materials and overall construction quality. However, a non-functioning building does not produce energy (heat), and thus, when compared to others, shows a low energy loss, which can lead to inaccurate results in the extraction of the insulation level of buildings. Meanwhile, this point also demonstrates that the energy loss of buildings can be used as a proxy for functional assessment of buildings.
Several proxies rely on geometric and morphological characteristics of built-up components to extract detailed information about structural deformations of buildings. They are used to compute the damage ratio of buildings. Gerke and Kerle [73] use the discontinuity of surface of building rooftops and vertical walls as a proxy for damage detection. They show that continuous roofs indicate intact buildings. In addition, Galarreta, et al. [70] identify cracks and holes in the building roof or facades, intersections of cracks with load-carrying elements, and dislocated tiles (Figure 3A–C) as proxies to be utilized to assess per-building damages after a disaster. Since these details can only be extracted using VHR images and height data, UAV images were used to produce three-dimensional (3D) point clouds to extract them. The results illustrate the efficiency of using those proxies for building-based damage assessment and classification when UAV data are available. Tamkuan and Nagai [68] used similar proxies: cracks, displaced and collapsed roofing tiles, wall mortar that is somewhat peeled off, or inclined buildings (Figure 3D) to evaluate and classify the building-based damages, e.g., roof tile displacements and inclined buildings are used as proxies for detecting slightly and heavily damaged buildings, respectively. Rubble piles and debris (Figure 3E) are the first features to draw attention and they have been frequently used as proxies for damage detection [76,77,78,79,80,81], while spalling of buildings (Figure 3E) also is one of the features for heavy damages which has been used for damage detection with UAV [71,82] and satellite images [75]. Furthermore, geometric deformation of entire buildings, such as changes in building shape and size, is employed as a proxy to extract the partly damaged buildings using satellite images [72]. Change in the symmetry of windows on the facade of a building serves as a proxy for damage assessment from oblique aerial imagery [86]. To do so, local symmetry points are detected in a sliding window. Then, histogram bins of those points in the vertical and horizontal directions are generated to distinguish damaged and undamaged building facades using the Gini Index. Using changes to different components of the buildings, e.g., facade and wall, as a proxy to evaluate damages to the buildings in detail remains a challenge and continues to be actively studied (e.g., Duarte, et al. [83]).
Further improvements are required for robust and accurate damage assessment per building. This can be done by extracting structural damage patterns from RS data, for example by making use of the characteristics of facade wall geometry, similar to using facades windows symmetry (Figure 3f) [86], wall slenderness, area of wall, or use of misalignment of wall openings [107] as RS-based proxies.
Building morphology acts as a proxy to extract building-based land use [32,48,87,89] and to measure living conditions [34,42,49]. It has been used for post-disaster recovery and vulnerability [89] evaluations, but hardly in other DRM situations. In a different approach, Müller, et al. [91] apply the position of buildings in relation to the street level as a proxy to determine the likelihood of constructions to suffer damage in the case of a flood event and assess the building vulnerability. Accordingly, buildings with lower elevations than the street are more vulnerable.
Building-based functional assessment has not been sufficiently addressed through the developed proxies that only consider the land use information. For example, functionality of the buildings may change during the post-disaster recovery phase, which cannot be identified only by extracting the reconstructed buildings. Nevertheless, facades are good sources of information for building-based functional assessment, and new proxies could make better use for example of the presence of cars in a driveway, flower pots in front of windows of residential buildings, or the presence of panel and banners on top of shops for extracting the functional use of buildings.
4.1.2. Transport Category
Transportation is also a vital component for DRM, as it provides accessibility to different locations within urban areas. One of the first emergency activities in post-disaster situations is to reopen blocked roads to reach damaged areas for rescue operations. Road network connectivity and condition, i.e., accessibility [92] has been used as a proxy for damage assessment. In addition, monitoring this proxy over a long period of time after a disaster also contributes to measuring recovery of the area [34,49]. In terms of more detailed proxies, debris on the road (blocked road) [47], and condition of bridges and transport facility [32] have been proposed to evaluate the transportation condition for urban DRM. Presence of vehicles has also been used as a proxy to evaluate the accessibility of the roads after a disaster [34]. However, the presence of vehicles on a road does not necessarily signal the good condition and usability of the roads. On the other hand, reconstruction of bridges and roads is a reliable proxy for road accessibility analysis after a disaster.
In another study, Liu, et al. [39] utilize length of roads as a proxy to evaluate the storm surge vulnerability of urban area, and Brown, et al. [48] use it for recovery assessment. However, a non-functioning road does not demonstrate the successful recovery processes. In a different study, Kumagai [94] estimate width of roads as a proxy to assess the vulnerability of the roads to blockades. The results show that, in a dense urban area, in which high-rise buildings exist and their blow-out debris or in case of collapsing during a disaster event can block the road, the width of roads can be used as a reliable proxy to assess the vulnerability of the transport network. In a similar study, Hu, et al. [95] rely on road network density as a proxy for disaster vulnerability assessment. Although denser road networks and wider roads can increase the chance of having access to damaged areas after a disaster, occupying urban areas to reach denser road ratios and wider roads is a controversial. Similar problems exist in using proportion of low-grade highways, such as county roads [96], as a proxy for vulnerability assessment of a city. High proportion of low-grade highways indicates a less developed transportation infrastructure, which leads to higher level of vulnerability of urban areas.
4.1.3. Others
One of the unique features of tsunami inundation zones important during and after an event is the level of sea water penetration on land. Thus, RS studies have focused on extracting water bodies from the post-event images as the first step to use it as a proxy for damage assessment [98]. Similarly, surface water areas (level of flood water coverage) serves for damage [99,100] and recovery assessments [46]. Furthermore, debris line acts as a proxy to identify the impact of water related disasters, such as tsunami [102] and hurricane [101]. The debris line demonstrates how far water reached inland after a disaster, and it has also been used to identify debris zone [81].
In a different study, impervious surface ratio is estimated as a proxy to compute the vulnerability of urban areas because the increase of impervious surface can lead to an increase of volume, intensity, and duration of urban water run-off, i.e., the duration that water remains on the surface after a flood [95]. In addition, Costa Viera and Kerle [49] used impervious surface as a measure for recovery assessment.
As a unique recovery situation, after a disaster people that are located in a temporary shelter during the reconstruction processes move back to their permanent houses when the reconstructions is completed. Consequently, change in the ratio of permanent buildings to temporary accommodations serves as a proxy for movement of the population from temporary accommodation to permanent houses and as a successful recovery process [32,46,48].
After a flood event, drainage plays an important role to evacuate flood waters, with an increase in drainage density reducing the vulnerability from the affected area; therefore, it has been used as a proxy for urban flood vulnerability assessment [103,104,105,106]. In contrast, a higher river network density ratio indicates a high vulnerability due to the relatively larger amount of flood-prone regions during a flood event [95].
4.2. Economic RS-based Proxies
The nature of economic and business flows associated with functions and processes in urban areas is not directly observable and measurable through RS data. Hence, the disruptions to the functioning of the economic environment are one of the least studied topic in urban DRM. To discuss and explain the proxies for the economic component in details, we differentiate between two main categories—(macro, regional, and urban) economics and logistics—that characterize the state of an economy and assure physical flows of economic activities correspondingly.
4.2.1. Macro, Regional, and Urban Economics
The macro, regional, and urban economics category includes proxies that are associated with the performance of the economy as a whole and its associated changes (Table 4). Land use data provides information about locations and types of economic activities. In the urban context it is one of the most popular proxies used to identify disaster-related economic damage for different economic sectors [47], as well as recovery [49] and vulnerability [108]. For example, Brown, et al. [47] applied the building-based land use proxy to identify damages to commercial and industrial buildings when assessing economic damages from the Wenchuan earthquake in China. Similarly, it has been also used for recovery assessment by extracting reconstructed buildings that are associated with economic activities [34,49]. The land use proxy and corresponding economic activities, their location, public infrastructure, economic assets and economic capacity, has also been used for economic vulnerability evaluations of urban areas [109]. Although land use is a crucial source of information with respect to direct impact on economic activities, it is salient on the detailed economic information, such as type of businesses and operationally of the impacted buildings. Moreover, while land use proxies can capture direct economic damages to physical assets, it provides little information about direct damage to building content (e.g., equipment and furniture) and about indirect damage due to business interruption.
Nightlight satellite imagery has been utilized to assess the economic impacts of hurricanes [110], typhoons [111], and tropical cyclone [41]. Nightlight images give an opportunity to compare changes in night light intensity, which relates to electricity availability, for before and after a disaster. It has been shown that a strong correlation exists between night light intensity and GDP [112,113]. Furthermore, it has also been suggested as a potential proxy for economic resilience assessment [114].
Disruption of livelihood options for local population is a key component of disaster risk and resilience assessments. A number of case-based proxies assess a short-term economic recovery processes after a disaster, in particular, for the fishery and agricultural livelihood activities. These proxies include pier length, presence of boats [34], shrimp hatcheries and ponds [46], and area of arable land [49]. Although livelihood sources across study regions, generic proxies can address it in a more reliable manner than case-based ones, for example, as with the case of crop recovery [32].
Industry is one of the main pillars of an economy. Therefore, urban proxies to assess industrial recovery include presence of heavy vehicles, chimneys, warehouses, transportation to move raw materials around site (e.g., conveyors, pipelines, railroads), and roof color and materials [34,49]. These proxies for detecting industrial buildings and industry-related activities are especially useful for assessing recovery that is associated with rebuilding and reconstruction. However, they are not always reliable when used in isolation. For example, the effectiveness of using the presence of heavy vehicles to detect an industry highly depends on the acquisition time of RS data, not to mention that not all industries use heavy vehicles. Hence, using multiple complementary proxies promises to deliver more robust assessments. Furthermore, building facade materials, in addition to rooftop materials, can also contribute to extract building use/land use information [67].
Building morphology is used as a proxy for extracting building use/land use information in urban areas [32,34]. Characteristics of buildings such as size and shape have been used to extract morphological information per building and then to classify building use [87]. For example, an industrial building usually has a complex shape and a large size [123]. Similarly, and from a wider point of view, change in urban morphology has been used for economic recovery assessment by detecting businesses movements and types in large scales [121].
Land surface temperature was used to extract evolution of settlement locations and land use information after the earthquake in L’Aquila city, Italy [122]. This proxy is robust when used on coarse resolution data to extract large size settlement changes. However, it cannot identify any detailed land use information for those settlements.
There are several RS-based proxies developed for economic vulnerability assessment, in contrast to other DRM components. For instance, building geometry and heights have been employed as proxies to assess the number of floors of buildings with economic activities. These two proxies may indicate the density of such activities, which is essential for computing the economic value of an urban area [39]. Building heights, when integrated with local construction regulations, provide reliable data to compute the number of floors. Moreover, a calculation of building density based on the number of floors is reliable [124]. However, it requires additional RS data, such as oblique imagery or nDSM data [125].
Farmland ratio to other types of land uses is strongly linked to economic activities and can be regarded as comprehensive characteristics of socio-economic systems [103]. Accordingly, it has been used as a proxy to detect economic activity, with higher scores signaling lower economic vulnerability in e.g., a flood scenario [103]. However, in large regions, which offer multiple livelihood options, the farmland ratio alone is not a reliable proxy for the identification of economic vulnerability. Moreover, a level of diversification of economic activities is an important factor in assessing the resilience [29,126]. Hence, eliciting spatial proxies for a variety of economic in an ensemble is a promising approach as compared to computing the farmland ratio alone.
4.2.2. Logistics
Logistics based on transport networks and facilities are vital aspects of a strong economy in urban areas. Consequently, their state and performance are important for urban DRM economic assessment (Table 5). Gil and Steinbach [40] compute the impact of a simulated disaster on the performance of the street networks that are not directly affected by a flooding scenario in London. The potential of street network analysis is to provide objective indicators of indirect impacts of flooding on urban street networks in unaffected areas. The indirect effects of business interruption, particularly in a city center, play a key role in assessing an economic performance after an adverse event. In a similar study, Contreras, et al. [127] propose spatial connectivity as a proxy for a post-earthquake recovery assessment. Variables, such as distance, travel time, and quality of public transportation are used to compute this metric. These authors conclude that an efficient spatial connectivity of areas to the central business district of L’Aquila after an earthquake can decrease the recovery time due to an agile return of economic functioning. Cox, et al. [128] indicate that an accessibility and commuting intensity within an urban area—computed based on resources availability, vulnerability, and flexibility of the transportation system—significantly boost economic activities. Accordingly, Hsieh and Feng [129] propose a model for accessibility analysis as a proxy to compute an economic vulnerability of an urban are. This proxy is mostly based on streets connectivity in an urban road network. However, the proposed connectivity-based approaches need traffic data in addition to RS data to compute street network performance. In a different study, Liu and Shi [109] show that a higher ratio of transportation lands (e.g., roads) and facilities reduces the economic vulnerability of urban areas. However, this proxy also disregards the functional analysis of the roads and transportation facilities focusing on the physical infrastructure side only.
4.3. Social RS-Based Proxies
The social dimension dealing with the status of people in a community is one of the most important components in DRM. Yet, few reliable RS-based proxies exist to address it. This is mostly because the social dimension of disasters embraces an individual status of community members, diversity of livelihoods (economic activities they may engage in), level of inequality, community cohesion, and level of services. Hardly any of these are directly captured through physical infrastructure or other spatial data that can be extracted using RS data. Table 6 and Table 7 show existing RS-based proxies in the social environment for urban DRM. To discuss and explain the proxies in detail we separate them into two categories: services and infrastructures, and socio-economic status.
4.3.1. Services and Infrastructures
Social services and infrastructures are one of the most important tools to assess the social features and characteristics of a community in an urban area. Accordingly, several proxies relying on RS data can be used in the urban DRM context. Urban primary social facilities and services, such as administrative services, schools, healthcare facilities, and religious buildings, which are crucial sources for networking and building social ties and cohesion, provide a proxy information on social damage and recovery assessments [32,34,48]. In addition, local facilities in use, such as car parking, highways, city gardens, children playgrounds, and sport playgrounds have been used to assess the social condition of the people living in the shelters and temporary accommodation in recovery processes [34,49,131]. Meanwhile, the number of urban facilities, such as hospitals and schools, serve as a proxy to assess the social resilience of a community to disaster. An increase in the number of facilities indicates an increase in social resilience [131].
To prevent a disease outbreak during the disaster recovery stage it is crucial to monitor and avoid overcrowding in campus/temporary settlement sites [132]. Here, the minimum covered living space can contribute to measuring overcrowding in the site using RS [34,49].
During a recovery process, moving population that has been located in temporary accommodation back to their permanent houses is one of the positive processes, because it increases people’s ability to return to normal lives and offers stability. Therefore, temporary accommodation size—as a proxy to estimate the total population living in temporary accommodation—can shed light on the quality of life [34,49]. However, in cases where the temporary accommodation is not removed, the movement of population cannot be monitored using this proxy. Moreover, the destination of the population movement cannot be extracted using this proxy. For example, people may migrate to other cities rather than moving back to their former houses, which happened on a large scale in New Orleans after hurricane Katrina [133].
Pedestrian access/mobility serves as a proxy for evaluation of the recovery processes that is linked to urban transportation facilities [134]. It indicates inequalities in mobility and access of people to social facilities, which depends on the size of block parcels in the urban area, number of street network intersections and distance to those facilities [49]. Building height, similar to its use in the economy environment, indicates social recovery. For example, commercial and industrial developments indicate employment facilities and new job opportunities [49]. However, often buildings are in a mixed use, i.e., half commercial and half residential, limiting the application of this proxy. In this case, using UAV/oblique images, which contain information about the facades of the buildings, can be useful. For example, one can extract signs/banners of shops located on buildings’ facades to identify a functional use of these buildings. Number of inhabitants per settlement indicates the recovery processes, serving as a proxy for a contentment level of new settlements. Low occupancy numbers in new developments demonstrate the dissatisfaction in new settlements, which is usually due to lack of facilities, infrastructure, and job opportunities [135]. RS data is used to detect new settlements and demographic data to extract number of inhabitants [131]. Transportation facilities are a vital infrastructure. Hence, their availability define the better life condition for the people living in the region and they form the basis for assessing social vulnerability of an urban area [39]. In addition, a distance between buildings and lifelines (e.g., hospitals) is important in emergency cases: the longer this distance the higher is the social vulnerability of urban areas [33,93,136,137].
Potential to evacuate based on the density of available roads (road/km2) has been used as a proxy to assess social resilience of an urban area during floods [31]. Although the availability of evacuation points is important, distance to them and early warning systems are also crucial. As another disaster resilience proxy, the presence of open spaces, including free and green areas and the street networks, has been used for providing services, gathering and social interactions after/during a disaster (e.g., an earthquake [138]). In addition, open spaces, such as hills and street networks, are significant for evacuation purposes [138,139].
4.3.2. Socio-Economic Status
The socio-economic status of households is estimated based on the location information of the houses in the city and topographic area characteristics for social recovery and vulnerability assessments [33,49]. Urban areas with poor road quality, little available infrastructure and economic development, little vegetation, and situated in hazard-prone areas are the most socially vulnerable areas. However, these proxies are not necessarily correct for all cases in urban areas. For example, not all people located in hazard-prone areas (e.g., steep slopes or lower elevations) have a low socio-economic status; in contrast, in some cases, there are luxury buildings located in areas with steeper slopes [33,140] or close to a waterfront [141,142]. Therefore, an effective way of using those proxies is to use them as an ensemble to describe the socio-economic status of an urban area. In addition, image-based texture serves as a proxy to extract homogeneity of an area [33,143,144]. It is a good complementary source of information for a settlement type extraction from images, e.g., slum areas, even using medium resolution images [145]. Similar to texture analysis, de Almeida, et al. [146] used irregular clusters of roofs in an urban area as a proxy to extract socially vulnerable areas, based on the fact that buildings poorer area are often not regularly constructed. A share of slum areas in a city compared to regular or high-income housing may serve as an indicator of social vulnerability. Müller [90] also used the amount of green spaces around each building block to estimate the socio-economic status of householders based on the findings of Stow, et al. [147]. Accordingly, the occupants of buildings that are surrounded by more green spaces—estimated using land cover and land use information to extract socio-economic status—are less socially vulnerable to hazards.
4.4. Natural RS-Based Proxies
Table 8 lists existing RS-based proxies capturing the natural environment for urban DRM. As one of the most important sources of information for assessing urban DRM, the natural environment relies on the vegetation cover information. Vegetation spatial heterogeneity serves as a proxy to extract changes in vegetation pattern, and to monitor ecosystem changes before and after a disaster at the landscape scale for natural damage assessment [149]. Spatial heterogeneity may affect functions and processes in ecological systems, which is a key to assess ecosystem changes [150]. Vegetation cover has been used as a proxy to extract the damages to the natural and ecological environment of an urban area by comparing the vegetation cover before and immediately after a disaster [99,151]. Decrease in vegetation cover ratio of an area demonstrates the ecological damage ratio. In a different study, Li, et al. [152] use vegetation cover change to assess the long-term effects of a hurricane in the urban natural environment recovery in New Orleans after Hurricane Katrina. Specifically, while using MODIS and Landsat images, Li and colleagues assess the period from immediately after the event to ten years later to discover that a decade later the vegetation cover is still at a lower level than before Katrina, indicating that the area has not yet fully recovered. Similarly, Brown, et al. [47] and Brown, et al. [46] use vegetation cover maps to assess the changes in vegetation/natural environment patterns in the recovery processes using NDVI between year1-year2. In addition, the cover ratio for various vegetation classes can provide detailed and reliable information for damage and recovery assessments. Fractional vegetation cover [153,154], which represents the vegetation ecological function, and vegetation cover type [154], have also been used to assess the vegetation recovery after a disaster. Fractional vegetation index can be computed using NDVI values of vegetation and soil, and is a powerful tool for vegetation cover classification and extraction [155]. A change analysis allows for computing the vegetation recovery rate. In addition, vegetation offers an important ecosystem service in flood-prone areas by providing a low drainage density and high permeable surfaces, thus contributing to preventing floods [156]. Accordingly, vegetation cover ratio has also been used as a proxy for vulnerability assessment of urban areas, particularly for water-related hazards [39,103,106].
Furthermore, vegetation cover ratio has been used as a proxy to evaluate the biophysical [106] and ecological [157] vulnerability, as well as resilience. A higher ratio of vegetation cover signified and increase in resilience (the vegetation coverage is one of the most important indicators for measuring ecological capacity for self-restoration). In a similar study, Mainali and Pricope [158] use the Standard Deviation of NDVI as a proxy to extract diversity of the plants in vegetated areas for vulnerability assessment. Debris and floodwater removal are also important for environmental recovery after a disaster, as it provides space for the vegetated area to regrow [32,46,49,88,97].
The environmental role of public spaces and urban green areas, in addition to providing clean air, is to provide habitats for biodiversity and helps to regulate temperature. Therefore, it has been used as a proxy to assess natural recovery processes [34,48].
Presence of debris, mud, and salt in water as an indicator of water contamination [34,49] and the availability of land as a provision of access to recreation has been employed as proxies for natural recovery assessment. Costa Viera and Kerle [49] used the permeability of surfaces to measure environmental quality as a proxy for recovery assessment. For example, the permeability of impervious surfaces is very low in urban areas, which leads to an increase in flood frequency and storm flows, and consequently influences urban climate and pollution levels [159]. Similarly, low levels of permeability of surfaces increase the vulnerability of the area to water-related hazards [160].
Disasters destroy the natural environment directly through landslide and flooding, or indirectly by human activities, such as intense construction work after a disaster in the recovery stage [34]. Consequently, monitoring land cover provides a proxy information on the natural environment recovery, e.g., land cover change from tree/forest to building as a result of constructions during the recovery processes [49,161]. Land cover change assessments also contribute to monitoring land degradation, erosion, and deforestation in the recovery processes [162,163].
Land cover and land use types are also used to indicate the vulnerability of the natural environment [8,106,108,117,164]. For example, expansion of urbanized areas, cultivation development, and decreasing of natural forest lands increase the eco-environmental vulnerability to hazards [116]. In another example, Mainali and Pricope [158] associate built-up and bare land with high vulnerability ranks and forest land—with low natural vulnerability rank [158]. In addition, a high proportion of managed natural land cover indicates greater vulnerability because vegetation and crop yield are negatively influenced by environmental degradation [165].
Evapotranspiration is a combined process of evaporation and transpiration and is an important factor in the hydrological cycle. Consequently, it plays a role of a proxy to evaluate flood vulnerability through extracting vegetation cover and type [166].
Frazier, et al. [167] use gross primary production (GPP) as a proxy for ecosystem-wellness derived from RS data, and assess the effect of resilience of ecological capital in DRM, particularly in recovery processes. GPP represents the photosynthetic capacity of vegetation, which can be used to estimate the vegetation productive capability. Liu, et al. [168] employ it also for damage and recovery assessments.
Ecological RS studies offer robust proxies that are applicable for urban DRM. For example, high plants productivity is directly related to good soil moisture and nutrient retention. The amount of soil organic carbon is a proxy to assess them and can be extracted using RS data [169,170]. Therefore, areas with higher soil organic carbon are more suitable for agriculture and consequently more resilient to disasters, particularly those that are linked to climate change [171].
5. Conclusions and Discussion
This article surveyed recent advances in the development of RS-based proxies for urban DRM, focusing on the literature for both pre- and post-disaster situation assessments. Specifically, damage, recovery, vulnerability, and resilience RS-based proxies were identified along the four dimensions of built-up, economic, social, and natural environments. The structured review of 114 published articles shows that a comprehensive toolkit of RS-proxies has been developed and it is widely used in practice. We observed an increasing use in the number of proxy-based studies in urban DRM. This is due to the availability of diverse and detailed image data and rapidly increasing computational power to a growing number of communities. This also shows an increasing need for and interest in proxy-based measurements.
Despite significant progress, there are gaps evident in the field that demand further research to focus on a number of directions:
(1) A rich set of RS-based proxies currently focuses on the physical side of urban DRM. Yet, urban DRM assessments rarely go beyond aggregated proxies for the socio-economic environment and the offered proxies are very limited to assess functional aspects. For example, although a good number of proxies has been developed for building-based damage detection, none of them addresses the functionality of the buildings that is also a critical information source for all aspects of urban DRM. Assessing the extent of damage to socio-economic activities and their functional recovery is essential and will likely be possible via a complimentary set of proxies rather than a single index.
(2) RS-based proxies have been developed in several different fields that can be interchangeably used for other DRM phases with little modification in estimation methodology. There are relatively few detailed proxies for recovery assessment when compared to damage assessment in built-up environments (Figure 2), whereas most of the damage assessment proxies can also be used for recovery assessment. The opposite is also true, and some of the RS-based proxies that have been developed for other environments, e.g., in the economics environment, can also be used for damage assessment. Furthermore, this statement is also correct with respect to the use of proxies for other risk elements in urban DRM: e.g., GPP that has been used for economic recovery and resilience assessments, could also be used for damage and vulnerability assessments. As a result, developing proxies that are focused on a particular risk element may overlook similar proxies, which have been developed to address the same point but under different names. Our review integrates these different streams of literature and offers a structured overview of the state-of-the-art RS methods across various DRM phases. More work on aligning methodological advancements and use of similar RS tools, data, and analysis to address DRM at various stages is vital to advance the field without reinventing the wheel.
(3) Using insights from other disciplines in developing RS-based proxies offers possibilities to intelligently connect various proxies that allow to comprehensively assess vulnerability, resilience, damage, and recovery for urban DRM beyond the physical impact alone. As suggested in this review, a structured analysis of specific proxy-based examples and finding important proxies from structural engineering, economic, social and natural sciences for urban DRM will be instrumental in creating a public interdisciplinary library of methods for urban DRM. If maintained and updated by an interdisciplinary scholarly and practitioners community, such an open library, will always rely on the state-of-the-art RS data and processing methods to extract them. It will help the RS community to fill the gap in comprehensive assessments of the different DRM phases in urban settings and beyond.
(4) Disaster resilience is one of the significant components of DRM, which has been gaining increasing importance in this field. However, only seven of the reviewed articles focus on resilience (Figure 1), and only seven RS-based proxies have been developed for its assessment (Figure 2). These numbers indicate a significant need for further studies in resilience assessments. Modifying and using RS-based proxies form other disciplines, such as vulnerability, which is comprehensively discussed in this paper, can help the RS community to develop proxies for resilience assessments.
Author Contributions
S.G. analyzed the reviewed publications and wrote the majority of the paper. N.K. helped in analyzing the reviewed publications. N.K., T.F. supported the developing the structure of the paper and revised the paper.
Funding
This research received no external funding.
Acknowledgments
We thank the anonymous reviewers for their insights and constructive comments, which helped to improve the paper.
Conflicts of Interest
The authors declare no conflict of interest.
References
- United Nations Department of Economic and Social Affairs. World Urbanization Prospects: The 2014 Revision; UNDESA: New York, NY, USA, 2015. [Google Scholar]
- UNISDR. Terminology on Disaster Risk Reduction; United Nations International Strategy for Disaster Reduction (UNISDR): Geneva, Switzerland, 2009. [Google Scholar]
- Cutter, S.L.; Barnes, L.; Berry, M.; Burton, C.; Evans, E.; Tate, E.; Webb, J. A place-based model for understanding community resilience to natural disasters. Glob. Environ. Chang. 2008, 18, 598–606. [Google Scholar] [CrossRef]
- Burton, C.G. A validation of metrics for community resilience to natural hazards and disasters using the recovery from hurricane Katrina as a case study. Ann. Assoc. Am. Geogr. 2014, 105, 67–86. [Google Scholar] [CrossRef]
- Cutter, S.L.; Burton, C.G.; Emrich, C.T. Disaster resilience indicators for benchmarking baseline conditions. J. Homel. Secur. Emerg. Manag. 2010, 7. [Google Scholar] [CrossRef]
- Cutter, S.L.; Ash, K.D.; Emrich, C.T. Urban–rural differences in disaster resilience. Ann. Am. Assoc. Geogr. 2016, 106, 1236–1252. [Google Scholar] [CrossRef]
- Norris, F.H.; Stevens, S.P.; Pfefferbaum, B.; Wyche, K.F.; Pfefferbaum, R.L. Community resilience as a metaphor, theory, set of capacities, and strategy for disaster readiness. Am. J. Commun. Psychol. 2008, 41, 127–150. [Google Scholar] [CrossRef] [PubMed]
- Taubenböck, H.; Post, J.; Roth, A.; Zosseder, K.; Strunz, G.; Dech, S. A conceptual vulnerability and risk framework as outline to identify capabilities of remote sensing. Nat. Hazards Earth Syst. Sci. 2008, 8, 409–420. [Google Scholar] [CrossRef] [Green Version]
- Cooner, A.; Shao, Y.; Campbell, J. Detection of urban damage using remote sensing and machine learning algorithms: Revisiting the 2010 Haiti earthquake. Remote Sens. 2016, 8, 868. [Google Scholar] [CrossRef]
- McCarthy, M.J.; Colna, K.E.; El-Mezayen, M.M.; Laureano-Rosario, A.E.; Mendez-Lazaro, P.; Otis, D.B.; Toro-Farmer, G.; Vega-Rodriguez, M.; Muller-Karger, F.E. Satellite remote sensing for coastal management: A review of successful applications. Environ. Manag. 2017, 60, 323–339. [Google Scholar] [CrossRef] [PubMed]
- Du, P.; Liu, P.; Xia, J.; Feng, L.; Liu, S.; Tan, K.; Cheng, L. Remote sensing image interpretation for urban environment analysis: Methods, system and examples. Remote Sens. 2014, 6, 9458–9474. [Google Scholar] [CrossRef]
- Stumpf, A.; Kerle, N. Object-oriented mapping of landslides using random forests. Remote Sens. Environ. 2011, 115, 2564–2577. [Google Scholar] [CrossRef]
- Zhao, C.; Lu, Z. Remote sensing of landslides—A review. Remote Sens. 2018, 10, 279. [Google Scholar] [CrossRef]
- Hoque, M.A.-A.; Phinn, S.; Roelfsema, C.; Childs, I. Tropical cyclone disaster management using remote sensing and spatial analysis: A review. Int. J. Disaster Risk Reduct. 2017, 22, 345–354. [Google Scholar] [CrossRef] [Green Version]
- Coppola, D.P. Chapter 1—The management of disasters. In Introduction to International Disaster Management, 3rd ed.; Butterworth-Heinemann: Boston, MA, USA, 2015; pp. 1–39. [Google Scholar]
- Saito, K.; Spence, R.J.S.; Going, C.; Markus, M. Using high-resolution satellite images for post-earthquake building damage assessment: A study following the 26 January 2001 Gujarat earthquake. Earthq. Spectra 2004, 20, 145–169. [Google Scholar] [CrossRef]
- Arciniegas, G.A.; Bijker, W.; Kerle, N.; Tolpekin, V.A. Coherence- and amplitude-based analysis of seismogenic damage in bam, Iran, using Envisat ASAR data. IEEE Trans. Geosci. Remote Sens. 2007, 45, 1571–1581. [Google Scholar] [CrossRef]
- Berke, P.R.; Kartez, J.; Wenger, D. Recovery after disaster: Achieving sustainable development, mitigation and equity. Disasters 1993, 17, 93–109. [Google Scholar] [CrossRef] [PubMed]
- Mueller, M.; Segl, K.; Heiden, U.; Kaufmann, H. Potential of high-resolution satellite data in the context of vulnerability of buildings. Nat. Hazards 2006, 38, 247–258. [Google Scholar] [CrossRef]
- MCDEM. Focus on Recovery: A Holistic Framework for Recovery in New Zealand; MCDEM: Wellington, New Zealand, 2005. [Google Scholar]
- Flax, L.; Jakson, R.; Stein, D. Community vulnerability assessment tool methodology. Nat. Hazards Rev. 2002, 3, 163–176. [Google Scholar] [CrossRef]
- Morrow, B.H. Identifying and mapping community vulnerability. Disasters 1999, 23, 1–18. [Google Scholar] [CrossRef] [PubMed]
- Burton, C.G. The Development of Metrics for Community Resilience to Natural Disasters; University of South Carolina: Columbia, SC, USA, 2012. [Google Scholar]
- Bradshow, S. Socio-Economic Impacts of Natural Disaster: A Gender Analysis; Serie Manuales 32; Nation Economic Commission for Latin America (ECLA): Santiago, Chile, 2004. [Google Scholar]
- Bevington, J.; Pyatt, S.; Hill, A.; Honey, M.; Adams, B.; Davidson, R.; Brink, S.; Chang, S.; Panjwani, D.; Mills, R.; et al. Uncovering Community Disruption Using Remote Sensing: An Assessment of Early Recovery in Post-Earthquake Haiti; Miscellaneous Report #69; University of Delaware, Disaster Research Center: Newark, DE, USA, 2010. [Google Scholar]
- Rubin, C.; Spence, R.; Going, C.; Markus, M. Community Recovery from a Major Natural Disaster; Institute of Behavioral Science University of Colorado Boulder: Boulder, CO, USA, 1985. [Google Scholar]
- Pidwirny, M. Glossary of Terms for Physical Geography; Our Planet Earth Publishing: Kelowna, BC, Canada, 2017. [Google Scholar]
- Fatemi, F.; Ardalan, A.; Aguirre, B.; Mansouri, N.; Mohammadfam, I. Social vulnerability indicators in disasters: Findings from a systematic review. Int. J. Disaster Risk Reduct. 2017, 22, 219–227. [Google Scholar] [CrossRef]
- Rose, A.; Krausmann, E. An economic framework for the development of a resilience index for business recovery. Int. J. Disaster Risk Reduct. 2013, 5, 73–83. [Google Scholar] [CrossRef]
- Taubenböck, H.; Wurm, M.; Post, J.; Roth, A.; Strunz, G.; Dech, S. Vulnerability assessment towards tsunami threats using multisensoral remote sensing data. Proc. SPIE 2009. [Google Scholar] [CrossRef]
- Kotzee, I.; Reyers, B. Piloting a social-ecological index for measuring flood resilience: A composite index approach. Ecol. Indic. 2016, 60, 45–53. [Google Scholar] [CrossRef]
- Platt, S.; Brown, D.; Hughes, M. Measuring resilience and recovery. Int. J. Disaster Risk Reduct. 2016, 19, 447–460. [Google Scholar] [CrossRef]
- Ebert, A.; Kerle, N.; Stein, A. Urban social vulnerability assessment with physical proxies and spatial metrics derived from air- and spaceborne imagery and GIS data. Nat. Hazards 2009, 48, 275–294. [Google Scholar] [CrossRef]
- Brown, D.; Platt, S.; Bevington, J. Disaster Recovery Indicators: Guidelines for Monitoring and Evaluation; CURBE, Cambridge University for Risk in the Built Environment, University of Cambridge: Cambridge, UK, 2010. [Google Scholar]
- Upton, G.; Cook, I. Oxford Dictionary of Statistics; Oxford University Press: Oxford, UK, 2014; p. 496. [Google Scholar]
- Montgomery, M.; Gragnolati, M.; Burke, K.; Paredes, E. Measuring living standards with proxy variables. Demography 2000, 37, 155–174. [Google Scholar] [CrossRef] [PubMed]
- Kerle, N.; Hoffman, R.R. Collaborative damage mapping for emergency response: The role of cognitive systems engineering. Nat. Hazards Earth Syst. Sci. 2013, 13, 97–113. [Google Scholar] [CrossRef]
- Contreras, D.; Blaschke, T.; Tiede, D.; Jilge, M. Monitoring recovery after earthquakes through the integration of remote sensing, GIS, and ground observations: The case of L’Aquila (Italy). Cartogr. Geogr. Inf. Sci. 2016, 43, 115–133. [Google Scholar] [CrossRef]
- Liu, J.; Gong, J.H.; Liang, J.M.; Li, Y.; Kang, L.C.; Song, L.L.; Shi, S.X. A quantitative method for storm surge vulnerability assessment—A case study of Weihai city. Int. J. Digit. Earth 2017, 10, 539–559. [Google Scholar] [CrossRef]
- Gil, J.; Steinbach, P. From flood risk to indirect flood impact: Evaluation of street network performance for effective management, response and repair. In Flood Recovery, Innovation and Response; Proverbs, D., Brebbia, C.A., Penning Rowsell, E., Eds.; Wit Press: Southampton, UK, 2008; Volume 118, pp. 335–344. [Google Scholar]
- Mohan, P.; Strobl, E. The short-term economic impact of tropical cyclone pam: An analysis using VIIRS nightlight satellite imagery. Int. J. Remote Sens. 2017, 38, 5992–6006. [Google Scholar] [CrossRef]
- Brown, D.; Platt, S.; Bevington, J.; Saito, K.; Adams, B.; Chenvidyakarn, T.; Spence, R.; Chuenpagdee, R.; Khan, A. Monitoring and Evaluating Post-Disaster Recovery Using High-Resolution Satellite Imagery; Cambridge University for Risk in the Built Environment, University of Cambridge: Cambridge, UK, 2010. [Google Scholar]
- Janalipour, M.; Taleai, M. Building change detection after earthquake using multi-criteria decision analysis based on extracted information from high spatial resolution satellite images. Int. J. Remote Sens. 2016, 38, 82–99. [Google Scholar] [CrossRef]
- Turker, M.; Sumer, E. Building-based damage detection due to earthquake using the watershed segmentation of the post-event aerial images. Int. J. Remote Sens. 2008, 29, 3073–3089. [Google Scholar] [CrossRef]
- Chen, S.C.; Shyu, M.L.; Zhang, C.C.; Tang, W.Z.; Zhang, K.Q. Damage Pattern Mining in Hurricane Image Databases; IEEE: New York, NY, USA, 2003; pp. 227–234. [Google Scholar]
- Brown, D.; Saito, K.; Spence, R.; Chenvidyakarn, T.; Adams, B.; Mcmillan, A.; Platt, S. Indicators for measuring, monitoring and evaluating post-disaster recovery. In Proceedings of the 6th International Workshop on Remote Sensing for Disaster Application, Pavia, Italy, 11–12 September 2008. [Google Scholar]
- Brown, D.; Saito, K.; Liu, M.; Spence, R.; So, E.; Ramage, M. The use of remotely sensed data and ground survey tools to assess damage and monitor early recovery following the 12.5.2008 Wenchuan earthquake in China. Bull. Earthq. Eng. 2011, 10, 741–764. [Google Scholar] [CrossRef]
- Brown, D.; Platt, S.; Bevington, J.; Saito, K.; Adams, B.; Chenvidyakarn, T.; Spence, R.; Chuenpagdee, R.; Khan, A. Monitoring and Evaluating Post-Disaster Recovery Using High-Resolution Satellite Imagery—Towards Standardised Indicators for Post-Disaster Recovery; Martin Centre: Cambridge, UK, 2015. [Google Scholar]
- Costa Viera, A.; Kerle, N. Utility of Geo-Informatics for Disaster Risk Management: Linking Structural Damage Assessment, Recovery and Resilience; University of Twente: Enschede, The Netherlands, 2014. [Google Scholar]
- Feng, T.N.; Hong, Z.H.; Wu, H.J.; Fu, Q.S.; Wang, C.X.; Jiang, C.H.; Tong, X.H. Estimation of earthquake casualties using high-resolution remote sensing: A case study of Dujiangyan city in the May 2008 Wenchuan earthquake. Nat. Hazards 2013, 69, 1577–1595. [Google Scholar] [CrossRef]
- Huang, X.; Zhang, L. Morphological building/shadow index for building extraction from high-resolution imagery over urban areas. IEEE J. Sel. Top. Appl. Earth Observ. Remote Sens. 2012, 5, 161–172. [Google Scholar] [CrossRef]
- Prince, D.; Sidike, P.; Essa, A.; Asari, V. Multifeature Fusion for Automatic Building Change Detection in Wide-Area Imagery; SPIE: Washington, DC, USA, 2017; p. 21. [Google Scholar]
- Tian, J.; Metzlaff, L.; d’Angelo, P.; Reinartz, P. Region-based building rooftop extraction and change detection. Int. Arch. Photogramm. Remote Sens. Spat. Inf. Sci. 2017, XLII-2/W7, 903–908. [Google Scholar] [CrossRef]
- Dong, L.; Shan, J. A comprehensive review of earthquake-induced building damage detection with remote sensing techniques. ISPRS J. Photogramm. Remote Sens. 2013, 84, 85–99. [Google Scholar] [CrossRef]
- Samadzadegan, F.; Rastiveisi, H. Automatic detection and classification of damaged buildings, using high resolution satellite imagery and vector data. Int. Arch. Photogramm. Remote Sens. Spat. Inf. Sci. 2008, 37, 415–420. [Google Scholar]
- Tu, J.; Sui, H.; Feng, W.; Song, Z. Automatic building damage detection method using high-resolution remote sensing images and 3D GIS model. ISPRS Ann. Photogramm. Remote Sens. Spat. Inf. Sci. 2016, III-8, 43–50. [Google Scholar] [CrossRef]
- Miura, H.; Midorikawa, S.; Kerle, N. Detection of building damage areas of the 2006 central Java, Indonesia, earthquake through digital analysis of optical satellite images. Earthq. Spectra 2013, 29, 453–473. [Google Scholar] [CrossRef]
- Sghaier, M.O.; Lepage, R. Road damage detection from VHR remote sensing images based on multiscale texture analysis and dempster shafer theory. In Proceedings of the 2015 IEEE International Geoscience and Remote Sensing Symposium (IGARSS), Milan, Italy, 26–31 July 2015; pp. 4224–4227. [Google Scholar]
- Ye, X.; Qin, Q.; Liu, M.; Wang, J.; Wang, J. Building damage detection from post-quake remote sensing image based on fuzzy reasoning. In Proceedings of the 2014 IEEE Geoscience and Remote Sensing Symposium, Quebec City, QC, Canada, 13–18 July 2014; pp. 529–532. [Google Scholar]
- Gao, F.; Zhang, L.; Wang, J.; Mei, J. Change detection in remote sensing images of damage areas with complex terrain using texture information and SVM. In Proceedings of the International Conference on Circuits and Systems (CAS 2015), Paris, France, 9–10 August 2015. [Google Scholar]
- Geiß, C.; Jilge, M.; Lakes, T.; Taubenbock, H. Estimation of seismic vulnerability levels of urban structures with multisensor remote sensing. IEEE J. Sel. Top. Appl. Earth Observ. Remote Sens. 2016, 9, 1913–1936. [Google Scholar] [CrossRef]
- Geiß, C.; Aravena Pelizari, P.; Marconcini, M.; Sengara, W.; Edwards, M.; Lakes, T.; Taubenböck, H. Estimation of seismic building structural types using multi-sensor remote sensing and machine learning techniques. ISPRS J. Photogramm. Remote Sens. 2015, 104, 175–188. [Google Scholar] [CrossRef]
- Costanzo, A.; Montuori, A.; Silva, J.; Silvestri, M.; Musacchio, M.; Doumaz, F.; Stramondo, S.; Buongiorno, M. The combined use of airborne remote sensing techniques within a GIS environment for the seismic vulnerability assessment of urban areas: An operational application. Remote Sens. 2016, 8, 146. [Google Scholar] [CrossRef]
- Qasim, S.; Qasim, M.; Shrestha, R.P.; Khan, A.N.; Tun, K.; Ashraf, M. Community resilience to flood hazards in Khyber Pukhthunkhwa province of Pakistan. Int. J. Disaster Risk Reduct. 2016, 18, 100–106. [Google Scholar] [CrossRef]
- Rezaie, F.; Panahi, M. GIS modeling of seismic vulnerability of residential fabrics considering geotechnical, structural, social and physical distance indicators in Tehran using multi-criteria decision-making techniques. Nat. Hazards Earth Syst. Sci. 2015, 15, 461–474. [Google Scholar] [CrossRef] [Green Version]
- Yuan, Z.X.; Lm, W. Application of high-resolution satellite image for seismic risk assessment. In Proceedings of the 13th World Conference on Earthquake Engineering, Vancouver, BC, Canada, 1–6 August 2004; Volume 3454. [Google Scholar]
- Ilehag, R.; Schenk, A.; Hinz, S. Concept for classifying facade elements based on material, geometry and thermal radiation using multimodal UAV remote sensing. Int. Arch. Photogramm. Remote Sens. Spatial Inf. Sci. 2017, XLII-2/W6, 145–151. [Google Scholar] [CrossRef]
- Tamkuan, N.; Nagai, M. Fusion of multi-temporal interferometric coherence and optical image data for the 2016 Kumamoto earthquake damage assessment. ISPRS Int. J. Geo-Inf. 2017, 6, 188. [Google Scholar] [CrossRef]
- Galarreta, J.F. Urban Structural Damage Assessment Using Object-Oriented Analysis and Semantic Reasoning; University of Twente: Enschede, The Netherlands, 2014. [Google Scholar]
- Galarreta, J.F.; Kerle, N.; Gerke, M. Uav-based urban structural damage assessment using object-based image analysis and semantic reasoning. Nat. Hazards Earth Syst. Sci. 2015, 15, 1087–1101. [Google Scholar] [CrossRef]
- Vetrivel, A.; Gerke, M.; Kerle, N.; Nex, F.; Vosselman, G. Disaster damage detection through synergistic use of deep learning and 3d point cloud features derived from very high resolution oblique aerial images, and multiple-kernel-learning. ISPRS J. Photogramm. Remote Sens. 2017, 140, 45–59. [Google Scholar] [CrossRef]
- Wang, L.; Dou, A.X.; Wang, X.Q.; Dong, Y.F.; Ding, X.; Li, Z.; Yuan, X.X.; Qiu, Y.R. Damage assessment of haiti earthquake emergency using high resolution remote sensing imagery. In Proceedings of the Remote Sensing of the Environment: The 17th China Conference on Remote Sensing, Shanghai, China, 9–13 May 2011; Volume 8203. [Google Scholar]
- Gerke, M.; Kerle, N. Automatic structural seismic damage assessment with airborne oblique pictometry© imagery. Photogramm. Eng. Remote Sens. 2011, 77, 885–898. [Google Scholar] [CrossRef]
- Cusicanqui, J.; Kerle, N.; Nex, F. Usability of aerial video footage for 3D-scene reconstruction and structural damage assessment. Nat. Hazards Earth Syst. Sci. Discuss. 2018, 18, 1583. [Google Scholar] [CrossRef]
- Vetrivel, A.; Kerle, N.; Gerke, M.; Nex, F.; Vosselman, G. Towards automated satellite image segmentation and classification for assessing disaster damage using data specific features with incremental learning. In Proceedings of the GEOBIA 2016, Enschede, The Netherlands, 14–16 September 2016. [Google Scholar]
- Tu, J.; Li, D.; Feng, W.; Han, Q.; Sui, H. Detecting damaged building regions based on semantic scene change from multi-temporal high-resolution remote sensing images. ISPRS Int. J. Geo-Inf. 2017, 6, 131. [Google Scholar] [CrossRef]
- Sang, N.; Chen, X.; Nie, J.; Yang, S.; Fan, Y.; Wen, Q.; Xu, F.; Li, L. Building losses assessment for Lushan earthquake utilization multisource remote sensing data and GIS. Proc. SPIE 2015, 9812, 98120J. [Google Scholar]
- Rastiveis, H.; Eslamizade, F.; Hosseini-Zirdoo, E. Building damage assessment after earthquake using post-event lidar data. Int. Arch. Photogramm. Remote Sens. Spat. Inf. Sci. 2015, XL-1-W5, 595–600. [Google Scholar] [CrossRef]
- Rastiveis, H.; Samadzadegan, F.; Reinartz, P. A fuzzy decision making system for building damage map creation using high resolution satellite imagery. Nat. Hazards Earth Syst. Sci. 2013, 13, 455–472. [Google Scholar] [CrossRef] [Green Version]
- Maruyama, Y.; Tashiro, A.; Yamazaki, F. Use of digital surface model constructed from digital aerial images to detect collapsed buildings during earthquake. Procedia Eng. 2011, 14, 552–558. [Google Scholar] [CrossRef]
- Jiang, S.; Friedland, C.J. Automatic urban debris zone extraction from post-hurricane very high-resolution satellite and aerial imagery. Geomat. Nat. Hazards Risk 2015, 7, 933–952. [Google Scholar] [CrossRef]
- Vetrivel, A.; Gerke, M.; Kerle, N.; Vosselman, G. Identification of structurally damaged areas in airborne oblique images using a visual-bag-of-words approach. Remote Sens. 2016, 8, 231. [Google Scholar] [CrossRef]
- Duarte, D.; Nex, F.; Kerle, N.; Vosselman, G. Satellite image classification of building damages using airborne and satellite image samples in a deep learning approach. Int. Ann. Photogramm. Remote Sens. Spat. Inf. Sci. 2018, IV-2, 89–96. [Google Scholar] [CrossRef]
- Li, S.D.; Tang, H.; He, S.; Shu, Y.; Mao, T.; Li, J.; Xu, Z.H. Unsupervised detection of earthquake-triggered roof-holes from UAV images using joint color and shape features. IEEE Geosci. Remote Sens. Lett. 2015, 12, 1823–1827. [Google Scholar]
- Vetrivel, A.; Gerke, M.; Kerle, N.; Vosselman, G. Identification of damage in buildings based on gaps in 3D point clouds from very high resolution oblique airborne images. ISPRS J. Photogramm. Remote Sens. 2015, 105, 61–78. [Google Scholar] [CrossRef]
- Tu, J.H.; Sui, H.G.; Feng, W.Q.; Sun, K.M.; Xu, C.; Han, Q.H. Detecting building facade damage from oblique aerial images using local symmetry feature and the GINI index. Remote Sens. Lett. 2017, 8, 676–685. [Google Scholar] [CrossRef]
- Contreras, D.; Blaschke, T.; Kienberger, S.; Zeil, P. Myths and realities about the recovery of L’Aquila after the earthquake. Int. J. Disaster Risk Reduct. 2014, 8, 125–142. [Google Scholar] [CrossRef] [PubMed]
- Burton, C.; Mitchell, J.T.; Cutter, S.L. Evaluating post-Katrina recovery in Mississippi using repeat photography. Disasters 2011, 35, 488–509. [Google Scholar] [CrossRef] [PubMed]
- Borfecchia, F.; Pollino, M.; De Cecco, L.; Lugari, A.; Martini, S.; La Porta, L.; Ristoratore, E.; Pascale, C. Active and passive remote sensing for supporting the evaluation of the urban seismic vulnerability. Ital. J. Remote Sens. 2010, 42, 129–141. [Google Scholar] [CrossRef]
- Müller, A. Flood risks in a dynamic urban agglomeration: A conceptual and methodological assessment framework. Nat. Hazards 2013, 65, 1931–1950. [Google Scholar] [CrossRef]
- Müller, A.; Reiter, J.; Weiland, U. Assessment of urban vulnerability towards floods using an indicator-based approach—A case study for Santiago de Chile. Nat. Hazards Earth Syst. Sci. 2011, 11, 2107–2123. [Google Scholar] [CrossRef]
- Pitts, D.A.D.; So, E. Enhanced change detection index for disaster response, recovery assessment and monitoring of accessibility and open spaces (camp sites). Int. J. Appl. Earth Observ. Geoinf. 2017, 57, 49–60. [Google Scholar] [CrossRef]
- Patino, C.L.; Saripada, N.A.; Olavides, R.D.; Sinogaya, J. Running to safety: Analysis of disaster susceptibility of neighborhoods and proximity of safety facilities in Silay city, Philippines. Int. Arch. Photogramm. Remote Sens. Spatial Inf. Sci. 2016, 41, 139–143. [Google Scholar] [CrossRef]
- Kumagai, K. Spatial comparison between densely built-up districts from the viewpoint of vulnerability to road blockades with respect to evacuation behavior. Int. Arch. Photogramm. Remote Sens. Spatial Inf. Sci. 2012, 39-B2, 151–156. [Google Scholar] [CrossRef]
- Hu, S.S.; Cheng, X.J.; Zhou, D.M.; Zhang, H. Gis-based flood risk assessment in suburban areas: A case study of the Fangshan district, Beijing. Nat. Hazards 2017, 87, 1525–1543. [Google Scholar] [CrossRef]
- Ye, J.Y.; Lin, G.F.; Zhang, M.F.; Lin, Z.L.; Chen, J.M. Gis-based study of natural disaster vulnerability for Xiamen city. In Proceedings of the 2010 18th International Conference on Geoinformatics, Beijing, China, 18–20 June 2010. [Google Scholar]
- Finch, C.; Emrich, C.T.; Cutter, S.L. Disaster disparities and differential recovery in New Orleans. Popul. Environ. 2010, 31, 179–202. [Google Scholar] [CrossRef]
- Koshimura, S.; Hayashi, S.; Gokon, H. The impact of the 2011 Tohoku earthquake tsunami disaster and implications to the reconstruction. Soils Found. 2014, 54, 560–572. [Google Scholar] [CrossRef]
- Adriano, B.; Gokon, H.; Mas, E.; Koshimura, S.; Liu, W.; Matsuoka, M. Extraction of damaged areas due to the 2013 Haiyan typhoon using ASTER data. In Proceedings of the 2014 IEEE International Geoscience and Remote Sensing Symposium, Quebec City, QC, Canada, 13–18 July 2014; IEEE: New York, NY, USA, 2014; pp. 2154–2157. [Google Scholar]
- Buehler, Y.A.; Kellenberger, T.W.; Small, D.; Itten, K.I. Rapid mapping with remote sensing data during flooding 2005 in Switzerland by object-based methods: A case study. In Geo-Environment and Landscape Evolution II: Evolution, Monitoring, Simulation, Management and Remediation of the Geological Environment and Landscape; Martin-Duque, J.F., Brebbia, C.A., Emmanouloudis, D.E., Mander, U., Eds.; Wit Press: Southampton, UK, 2006; Volume 89, p. 391. [Google Scholar]
- Friedland, C.; Massarra, C.; Henderson, E. Integrated aerial-based and ground-based damage assessment of single family dwellings at the neighborhood and per-building spatial scales. In Proceedings of the 9th International Workshop on Remote Sensing for Disaster Response, Stanford, CA, USA, 15–16 September 2011. [Google Scholar]
- Chang, S.E.; Adams, B.J.; Alder, J.; Berke, P.R.; Chuenpagdee, R.; Ghosh, S.; Wabnitz, C. Coastal ecosystems and tsunami protection after the december 2004 Indian ocean Tsunami. Earthq. Spectra 2006, 22, 863–887. [Google Scholar] [CrossRef]
- Chen, P.; Chen, X.L. Remote sensing and GIS-based flood vulnerability assessment in Jiangzi province in China. IEEE Comput. Soc. 2009, 2, 332–335. [Google Scholar]
- Ouma, Y.O.; Tateishi, R. Urban flood vulnerability and risk mapping using integrated multi-parametric AHP and GIS: Methodological overview and case study assessment. Water 2014, 6, 1515–1545. [Google Scholar] [CrossRef]
- Sowmya, K.; John, C.M.; Shrivasthava, N.K. Urban flood vulnerability zoning of cochin city, southwest coast of India, using remote sensing and GIS. Nat. Hazards 2015, 75, 1271–1286. [Google Scholar] [CrossRef]
- Rimba, A.; Setiawati, M.; Sambah, A.; Miura, F. Physical flood vulnerability mapping applying geospatial techniques in Okazaki city, Aichi prefecture, Japan. Urban Sci. 2017, 1, 7. [Google Scholar] [CrossRef]
- Ferreira, T.M.; Vicente, R.; Varum, H. Seismic vulnerability assessment of masonry facade walls: Development, application and validation of a new scoring method. Struct. Eng. Mech. 2014, 50, 541–561. [Google Scholar] [CrossRef]
- Guntur; Sambah, A.B.; Miura, F.; Fuad; Arisandi, D.M. Assessing tsunami vulnerability areas using satellite imagery and weighted cell-based analysis. Int. J. GEOMATE 2017, 12, 115–122. [Google Scholar]
- Liu, J.; Shi, Z.W. Quantifying land-use change impacts on the dynamic evolution of flood vulnerability. Land Use Policy 2017, 65, 198–210. [Google Scholar] [CrossRef]
- Bertinelli, L.; Strobl, E. Quantifying the local economic growth impact of hurricane strikes: An analysis from outer space for the Caribbean. J. Appl. Meteorol. Climatol. 2013, 52, 1688–1697. [Google Scholar] [CrossRef]
- Elliott, R.J.R.; Strobl, E.; Sun, P.Y. The local impact of typhoons on economic activity in China: A view from outer space. J. Urban Econ. 2015, 88, 50–66. [Google Scholar] [CrossRef]
- Proville, J.; Zavala-Araiza, D.; Wagner, G. Night-time lights: A global, long term look at links to socio-economic trends. PLoS ONE 2017, 12, e0174610. [Google Scholar] [CrossRef] [PubMed]
- Mellander, C.; Lobo, J.; Stolarick, K.; Matheson, Z. Night-time light data: A good proxy measure for economic activity? PLoS ONE 2015, 10, e0139779. [Google Scholar] [CrossRef] [PubMed] [Green Version]
- The World Bank. Resilience Indicators: Summary Note and Steps Forward; The World Bank: Washington, DC, USA, 2014. [Google Scholar]
- Li, M.Y.; Wu, W.; Wang, J.; Che, Z.M.; Xie, Y.L. Simulating and mapping the risk of surge floods in multiple typhoon scenarios: A case study of Yuhuan county, Zhejiang province, China. Stoch. Environ. Res. Risk Assess. 2017, 31, 645–659. [Google Scholar] [CrossRef]
- Liou, Y.I.A.; Nguyen, A.K.; Li, M.H. Assessing spatiotemporal eco-environmental vulnerability by Landsat data. Ecol. Indic. 2017, 80, 52–65. [Google Scholar] [CrossRef]
- Ntajal, J.; Lamptey, B.L.; Mahamadou, I.B.; Nyarko, B.K. Flood disaster risk mapping in the lower mono river basin in Togo, west Africa. Int. J. Disaster Risk Reduct. 2017, 23, 93–103. [Google Scholar] [CrossRef]
- Sambah, A.; Miura, F. Remote sensing and spatial multi-criteria analysis for tsunami vulnerability assessment. Disaster Prev. Manag. 2014, 23, 271–295. [Google Scholar] [CrossRef]
- Yan, B.Y.; Li, S.S.; Wang, J.; Ge, Z.M.; Zhang, L.Q. Socio-economic vulnerability of the megacity of Shanghai (China) to sea-level rise and associated storm surges. Reg. Environ. Chang. 2016, 16, 1443–1456. [Google Scholar] [CrossRef]
- Zachos, L.G.; Swann, C.T.; Altinakar, M.S.; McGrath, M.Z.; Thomas, D. Flood vulnerability indices and emergency management planning in the Yazoo Basin, Mississippi. Int. J. Disaster Risk Reduct. 2016, 18, 89–99. [Google Scholar] [CrossRef]
- Hagelman, R.R.; Connolly, M.H.; Zavar, E.M.; Dahal, K.R. Disaster reconstruction and business geography following the 2007 Greensburg, Kansas Tornado. Environ. Hazards 2012, 11, 283–302. [Google Scholar] [CrossRef]
- Baiocchi, V.; Zottele, F.; Dominici, D. Remote sensing of urban microclimate change in L’Aquila city (Italy) after post-earthquake depopulation in an open source GIS environment. Sensors 2017, 17, 404. [Google Scholar] [CrossRef] [PubMed]
- Li, M.; Stein, A.; Bijker, W.; Zhan, Q. Urban land use extraction from very high resolution remote sensing imagery using a Bayesian network. ISPRS J. Photogramm. Remote Sens. 2016, 122, 192–205. [Google Scholar] [CrossRef]
- Yu, B.; Liu, H.; Wu, J.; Hu, Y.; Zhang, L. Automated derivation of urban building density information using airborne lidar data and object-based method. Landsc. Urban Plan. 2010, 98, 210–219. [Google Scholar] [CrossRef]
- Aubrecht, C.; Steinnocher, K.; Hollaus, M.; Wagner, W. Integrating earth observation and giscience for high resolution spatial and functional modeling of urban land use. Comput. Environ. Urban Syst. 2009, 33, 15–25. [Google Scholar] [CrossRef]
- Cutter, S.L. The landscape of disaster resilience indicators in the USA. Nat. Hazards 2016, 80, 741–758. [Google Scholar] [CrossRef]
- Contreras, D.; Blaschke, T.; Kienberger, S.; Zeil, P. Spatial connectivity as a recovery process indicator: The l’aquila earthquake. Technol. Forecast. Soc. Chang. 2013, 80, 1782–1803. [Google Scholar] [CrossRef]
- Cox, A.; Prager, F.; Rose, A. Transportation security and the role of resilience: A foundation for operational metrics. Transp. Policy 2011, 18, 307–317. [Google Scholar] [CrossRef]
- Hsieh, C.H.; Feng, C.M. Road network vulnerability assessment based on fragile factor interdependencies in spatial-functional perspectives. Environ. Plan. A 2014, 46, 700–714. [Google Scholar] [CrossRef]
- Penchev, G. Using space syntax for estimation of potential disaster indirect economic losses. Comp. Econ. Res. 2016, 19, 125–142. [Google Scholar] [CrossRef]
- Contreras, D.; Blaschke, T.; Hodgson, M.E. Lack of spatial resilience in a recovery process: Case L’Aquila, Italy. Technol. Forecast. Soc. Chang. 2017, 121, 76–88. [Google Scholar] [CrossRef]
- Jafari, N.; Shahsanai, A.; Memarzadeh, M.; Loghmani, A. Prevention of communicable diseases after disaster: A review. J. Res. Med. Sci. Off. J. Isfahan Univ. Med. Sci. 2011, 16, 956–962. [Google Scholar]
- Sastry, N.; Gregory, J. The location of displaced new orleans residents in the year after hurricane Katrina. Demography 2014, 51, 753–775. [Google Scholar] [CrossRef] [PubMed]
- Song, Y.; Knaap, G.-J. Measuring urban form: Is Portland winning the war on sprawl? J. Am. Plan. Assoc. 2004, 70, 210–225. [Google Scholar] [CrossRef]
- Engineering, N.A.O. Harnessing Operational Systems Engineering to Support Peacebuilding: Report of a Workshop by The National Academy of Engineering and United States Institute of Peace Roundtable on Technology, Science, and Peacebuilding; The National Academies Press: Washington, DC, USA, 2013; p. 76. [Google Scholar]
- Roy, D.C.; Blaschke, T. Spatial vulnerability assessment of floods in the coastal regions of Bangladesh. Geomat. Nat. Hazards Risk 2015, 6, 21–44. [Google Scholar] [CrossRef]
- Armenakis, C.; Nirupama, N. Prioritization of disaster risk in a community using GIS. Nat. Hazards 2013, 66, 15–29. [Google Scholar] [CrossRef]
- Villagra, P.; Rojas, C.; Ohno, R.; Xue, M.; Gomez, K. A GIS-base exploration of the relationships between open space systems and urban form for the adaptive capacity of cities after an earthquake: The cases of two Chilean cities. Appl. Geogr. 2014, 48, 64–78. [Google Scholar] [CrossRef]
- Allan, P.; Bryant, M. Resilience as a framework for urbanism and recovery. J. Landsc. Archit. 2011, 6, 34–45. [Google Scholar] [CrossRef]
- Stefanidis, S.; Stathis, D. Assessment of flood hazard based on natural and anthropogenic factors using analytic hierarchy process (AHP). Nat. Hazards 2013, 68, 569–585. [Google Scholar] [CrossRef]
- Huang, W.; Li, S. Understanding human activity patterns based on space-time-semantics. ISPRS J. Photogramm. Remote Sens. 2016, 121, 1–10. [Google Scholar] [CrossRef]
- Xian, S.; Lin, N.; Hatzikyriakou, A. Storm surge damage to residential areas: A quantitative analysis for hurricane sandy in comparison with Fema flood map. Nat. Hazards 2015, 79, 1867–1888. [Google Scholar] [CrossRef]
- Mück, M.; Taubenböck, H.; Post, J.; Wegscheider, S.; Strunz, G.; Sumaryono, S.; Ismail, F.A. Assessing building vulnerability to earthquake and tsunami hazard using remotely sensed data. Nat. Hazards 2012, 68, 97–114. [Google Scholar] [CrossRef]
- Sumaryono, S. Assessing Building Vulnerability to Tsunami Hazard Using Integrative Remote Sensing and GIS Approaches. Ph.D. Thesis, LMU Munich, Munich, Germany, 2010. [Google Scholar]
- Kuffer, M.; Pfeffer, K.; Sliuzas, R. Slums from space—15 years of slum mapping using remote sensing. Remote Sens. 2016, 8, 455. [Google Scholar] [CrossRef]
- De Almeida, L.Q.; Welle, T.; Birkmann, J. Disaster risk indicators in brazil: A proposal based on the world risk index. Int. J. Disaster Risk Reduct. 2016, 17, 251–272. [Google Scholar] [CrossRef]
- Stow, D.; Lopez, A.; Lippitt, C.; Hinton, S.; Weeks, J. Object-based classification of residential land use within Accra, Ghana based on QuickBird satellite data. Int. J. Remote Sens. 2007, 28, 5167–5173. [Google Scholar] [CrossRef] [PubMed]
- Kubal, C.; Haase, D.; Meyer, V.; Scheuer, S. Integrated urban flood risk assessment—Adapting a multicriteria approach to a city. Nat. Hazards Earth Syst. Sci. 2009, 9, 1881–1895. [Google Scholar] [CrossRef]
- Wang, L.; Tian, B.W.; Koike, K.; Hong, B.T.; Ren, P. Integration of landscape metrics and variograms to characterize and quantify the spatial heterogeneity change of vegetation induced by the 2008 Wenchuan earthquake. ISPRS Int. J. Geo-Inf. 2017, 6, 164. [Google Scholar] [CrossRef]
- O’Neill, R.V.; Krummel, J.R.; Gardner, R.H.; Sugihara, G.; Jackson, B.; DeAngelis, D.L.; Milne, B.T.; Turner, M.G.; Zygmunt, B.; Christensen, S.W.; et al. Indices of landscape pattern. Landsc. Ecol. 1988, 1, 153–162. [Google Scholar] [CrossRef]
- Yang, C.; Ren, X.; Huang, H. The vegetation damage assessment of the Wenchuan earthquake of May 2008 using remote sensing and GIS. Nat. Hazards 2011, 62, 45–55. [Google Scholar] [CrossRef]
- Li, X.C.; Yu, L.; Xu, Y.D.; Yang, J.; Gong, P. Ten years after hurricane Katrina: Monitoring recovery in New Orleans and the surrounding areas using remote sensing. Sci. Bull. 2016, 61, 1460–1470. [Google Scholar] [CrossRef]
- Jiao, Q.J.; Zhang, B.; Liu, L.Y.; Li, Z.W.; Yue, Y.M.; Hu, Y. Assessment of spatio-temporal variations in vegetation recovery after the Wenchuan earthquake using Landsat data. Nat. Hazards 2014, 70, 1309–1326. [Google Scholar] [CrossRef]
- Yang, W.T.; Qi, W.W. Spatial-temporal dynamic monitoring of vegetation recovery after the Wenchuan earthquake. IEEE J. Sel. Top. Appl. Earth Observ. Remote Sens. 2017, 10, 868–876. [Google Scholar] [CrossRef]
- Liu, L.; Jing, X.; Wang, J.; Zhao, C. Analysis of the changes of vegetation coverage of western Beijing mountainous areas using remote sensing and GIS. Environ. Monit. Assess. 2009, 153, 339–349. [Google Scholar] [CrossRef] [PubMed]
- Pallard, B.; Castellarin, A.; Montanari, A. A look at the links between drainage density and flood statistics. Hydrol. Earth Syst. Sci. 2009, 13, 1019–1029. [Google Scholar] [CrossRef] [Green Version]
- Zhang, X.R.; Wang, Z.B.; Lin, J. GIS based measurement and regulatory zoning of urban ecological vulnerability. Sustainability 2015, 7, 9924–9942. [Google Scholar] [CrossRef]
- Mainali, J.; Pricope, N.G. High-resolution spatial assessment of population vulnerability to climate change in Nepal. Appl. Geogr. 2017, 82, 66–82. [Google Scholar] [CrossRef]
- Weng, Q. Remote sensing of impervious surfaces in the urban areas: Requirements, methods, and trends. Remote Sens. Environ. 2012, 117, 34–49. [Google Scholar] [CrossRef]
- Kablan, M.K.A.; Dongo, K.; Coulibaly, M. Assessment of social vulnerability to flood in urban cote D’ivoire using the move framework. Water 2017, 9, 292. [Google Scholar] [CrossRef]
- Wagner, M.A.; Myint, S.W.; Cerveny, R.S. Geospatial assessment of recovery rates following a tornado disaster. IEEE Trans. Geosci. Remote Sens. 2012, 50, 4313–4322. [Google Scholar] [CrossRef]
- Cebecauer, T.; Hofierka, J. The consequences of land-cover changes on soil erosion distribution in Slovakia. Geomorphology 2008, 98, 187–198. [Google Scholar] [CrossRef]
- Quan, B.; Römkens, M.J.M.; Li, R.; Wang, F.; Chen, J. Effect of land use and land cover change on soil erosion and the spatio-temporal variation in Liupan mountain region, southern Ningxia, China. Front. Environ. Sci. Eng. China 2011, 5, 564–572. [Google Scholar] [CrossRef]
- Poompavai, V.; Ramalingam, M. Geospatial analysis for coastal risk assessment to cyclones. J. Indian Soc. Remote Sens. 2013, 41, 157–176. [Google Scholar] [CrossRef]
- Yoo, G.; Kim, A.R.; Hadi, S. A methodology to assess environmental vulnerability in a coastal city: Application to Jakarta, Indonesia. Ocean Coast. Manag. 2014, 102, 169–177. [Google Scholar] [CrossRef]
- Liu, R.; Chen, Y.; Wu, J.P.; Gao, L.; Barrett, D.; Xu, T.B.; Li, X.J.; Li, L.Y.; Huang, C.; Yu, J. Integrating entropy-based naive Bayes and GIS for spatial evaluation of flood hazard. Risk Anal. 2017, 37, 756–773. [Google Scholar] [CrossRef] [PubMed]
- Frazier, A.E.; Renschler, C.S.; Miles, S.B. Evaluating post-disaster ecosystem resilience using Modis GPP data. Int. J. Appl. Earth Observ. Geoinf. 2013, 21, 43–52. [Google Scholar] [CrossRef]
- Liu, Y.; Liu, R.; Ge, Q. Evaluating the vegetation destruction and recovery of Wenchuan earthquake using Modis data. Nat. Hazards 2010, 54, 851–862. [Google Scholar] [CrossRef]
- Rasel, S.M.M.; Groen, T.A.; Hussin, Y.A.; Diti, I.J. Proxies for soil organic carbon derived from remote sensing. Int. J. Appl. Earth Observ. Geoinf. 2017, 59, 157–166. [Google Scholar] [CrossRef]
- Bhunia, G.S.; Kumar Shit, P.; Pourghasemi, H.R. Soil organic carbon mapping using remote sensing techniques and multivariate regression model. Geocarto Int. 2017, 1–12. [Google Scholar] [CrossRef]
- Lal, R. Enhancing crop yields in the developing countries through restoration of the soil organic carbon pool in agricultural lands. Land Degrad. Dev. 2006, 17, 197–209. [Google Scholar] [CrossRef]
Figure 1.
Number of annual publications on remote sensing-based proxies for Disaster Risk Management (DRM). Papers with a focus on two DRM areas, e.g., both damage and recovery assessments, are counted on both of them separately.
Figure 1.
Number of annual publications on remote sensing-based proxies for Disaster Risk Management (DRM). Papers with a focus on two DRM areas, e.g., both damage and recovery assessments, are counted on both of them separately.

Figure 2.
Number of developed remote sensing-based proxies for DRM in each environment (Built-up, Economic, Social, Natural). The proxies that are used interchangeably in more than one area, e.g., damage and recovery assessments, are counted on all of the used categories separately. However, the green colored bar shows the total number of unique RS-based proxies for each environment.

Figure 3.
Examples of remote sensing-based built-up proxies. (A) Roof with dislocated tiles, (B) cracks in concrete facade, (C) cracks and hole in brick facade [70], (D) inclined building [68,70], (E) debris, rubble piles, spalling [82], and (F) facade windows symmetry [86].
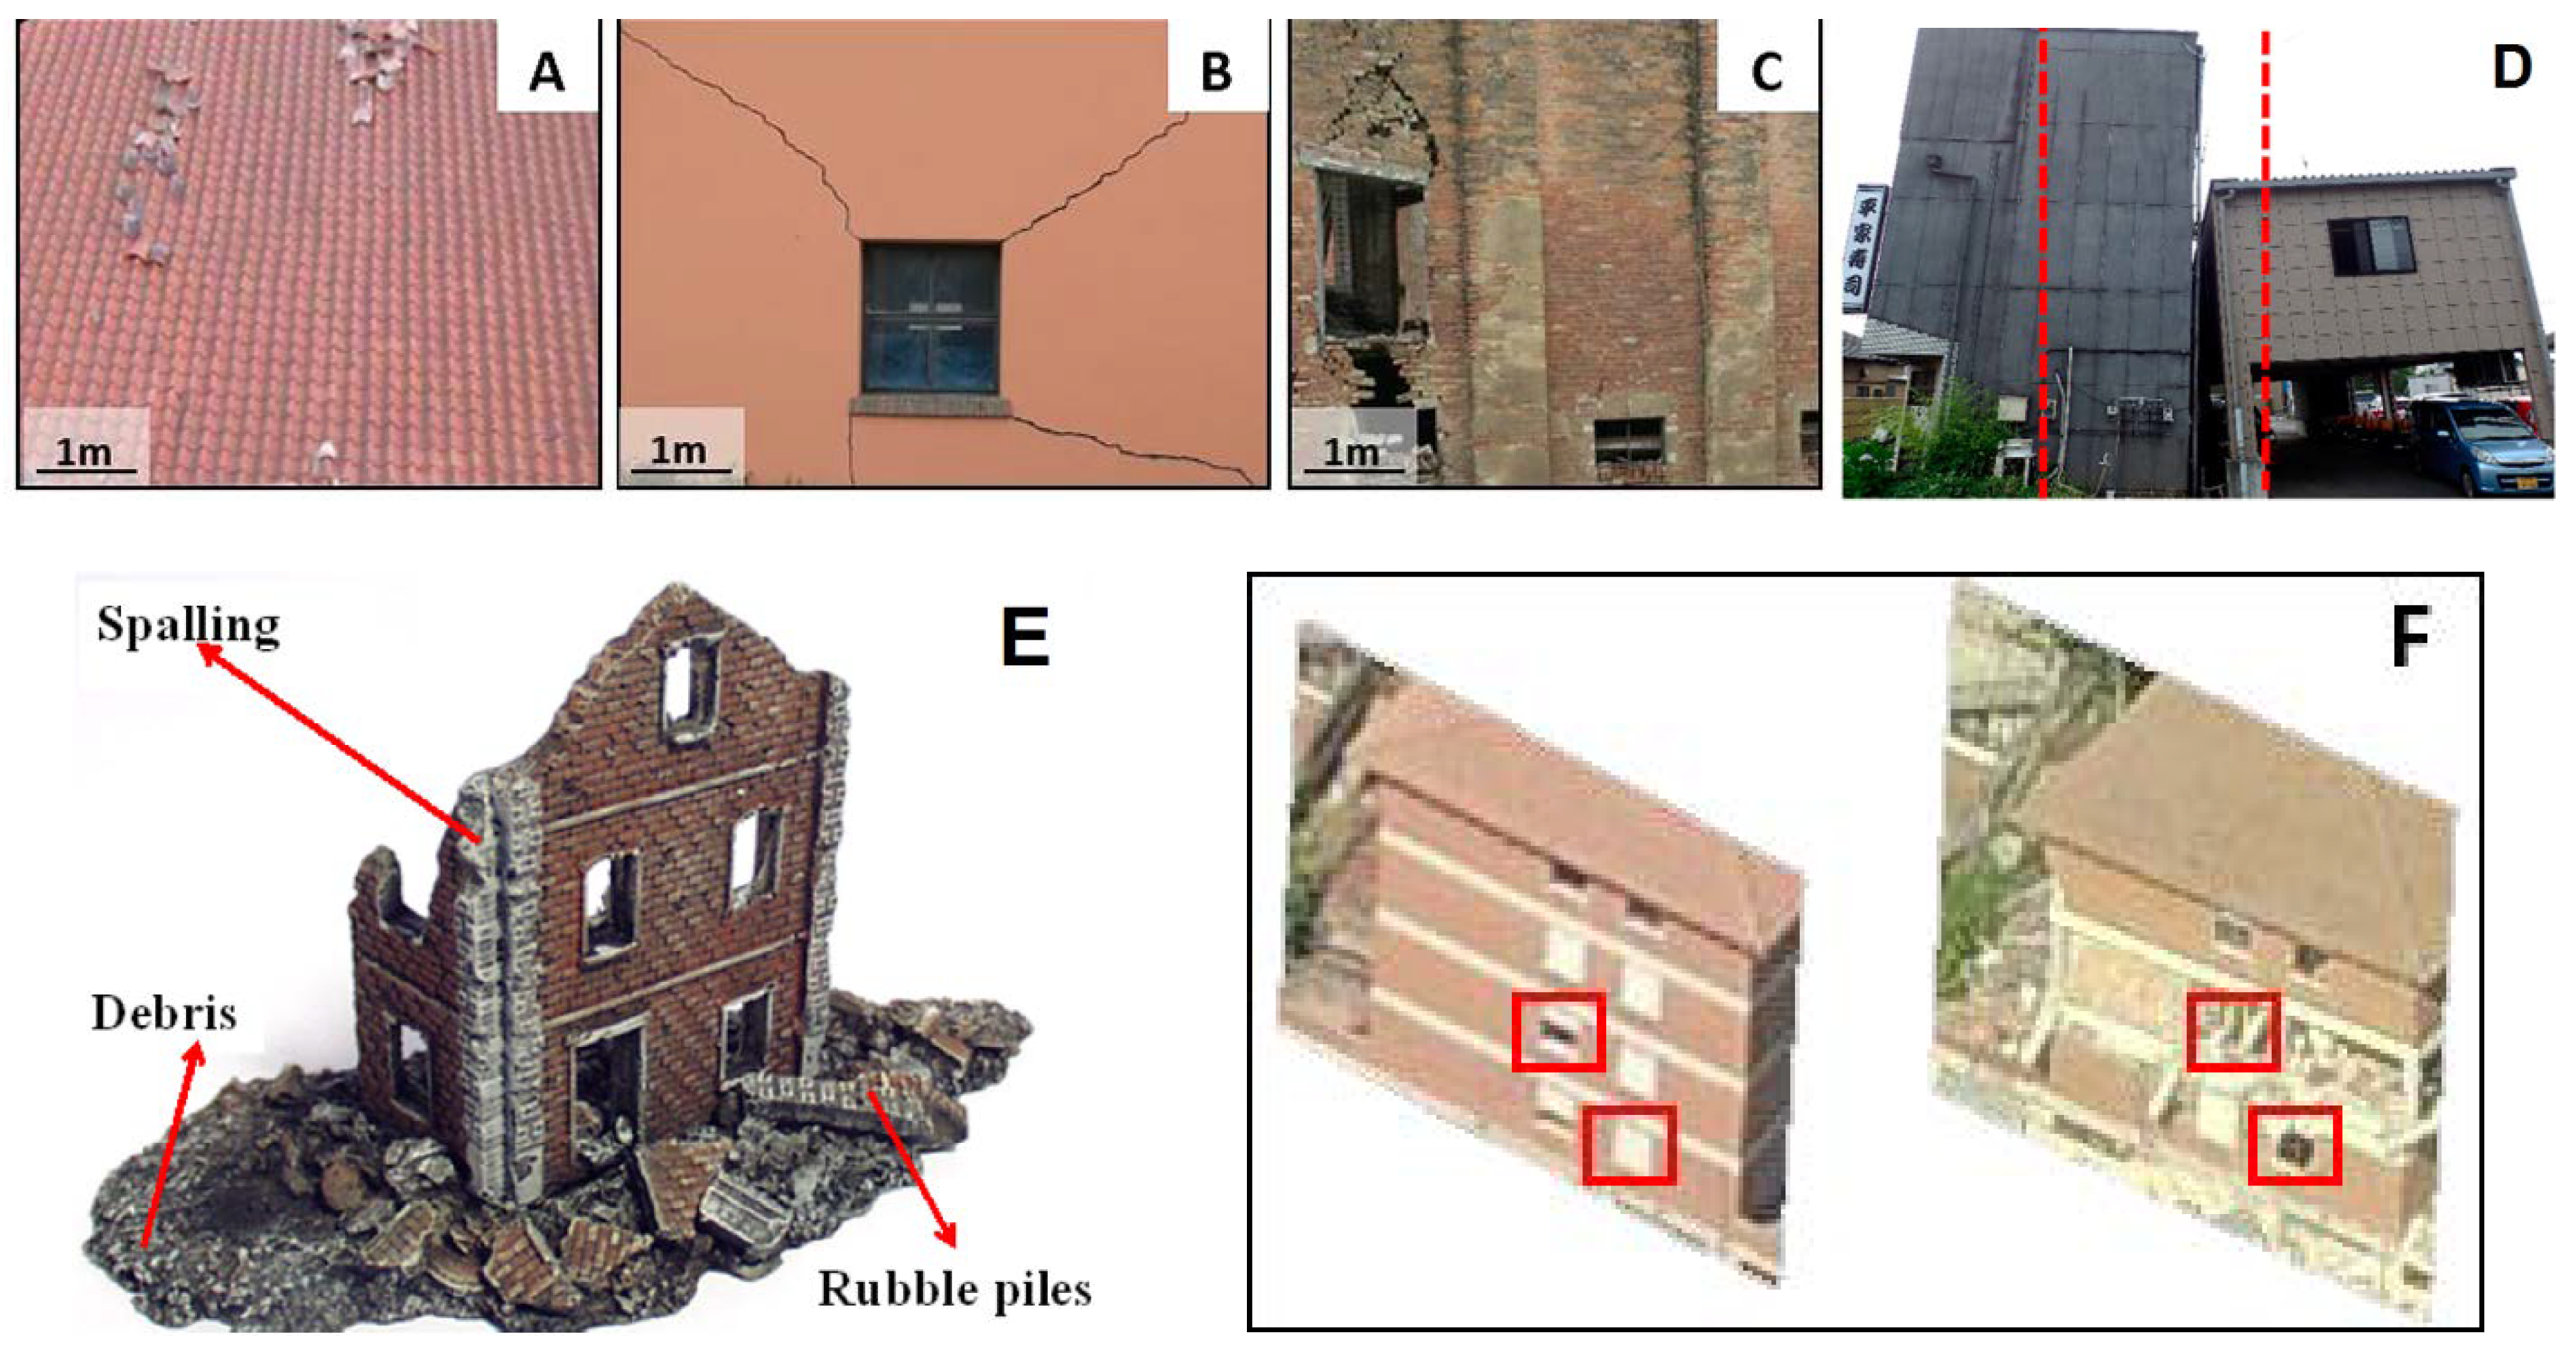

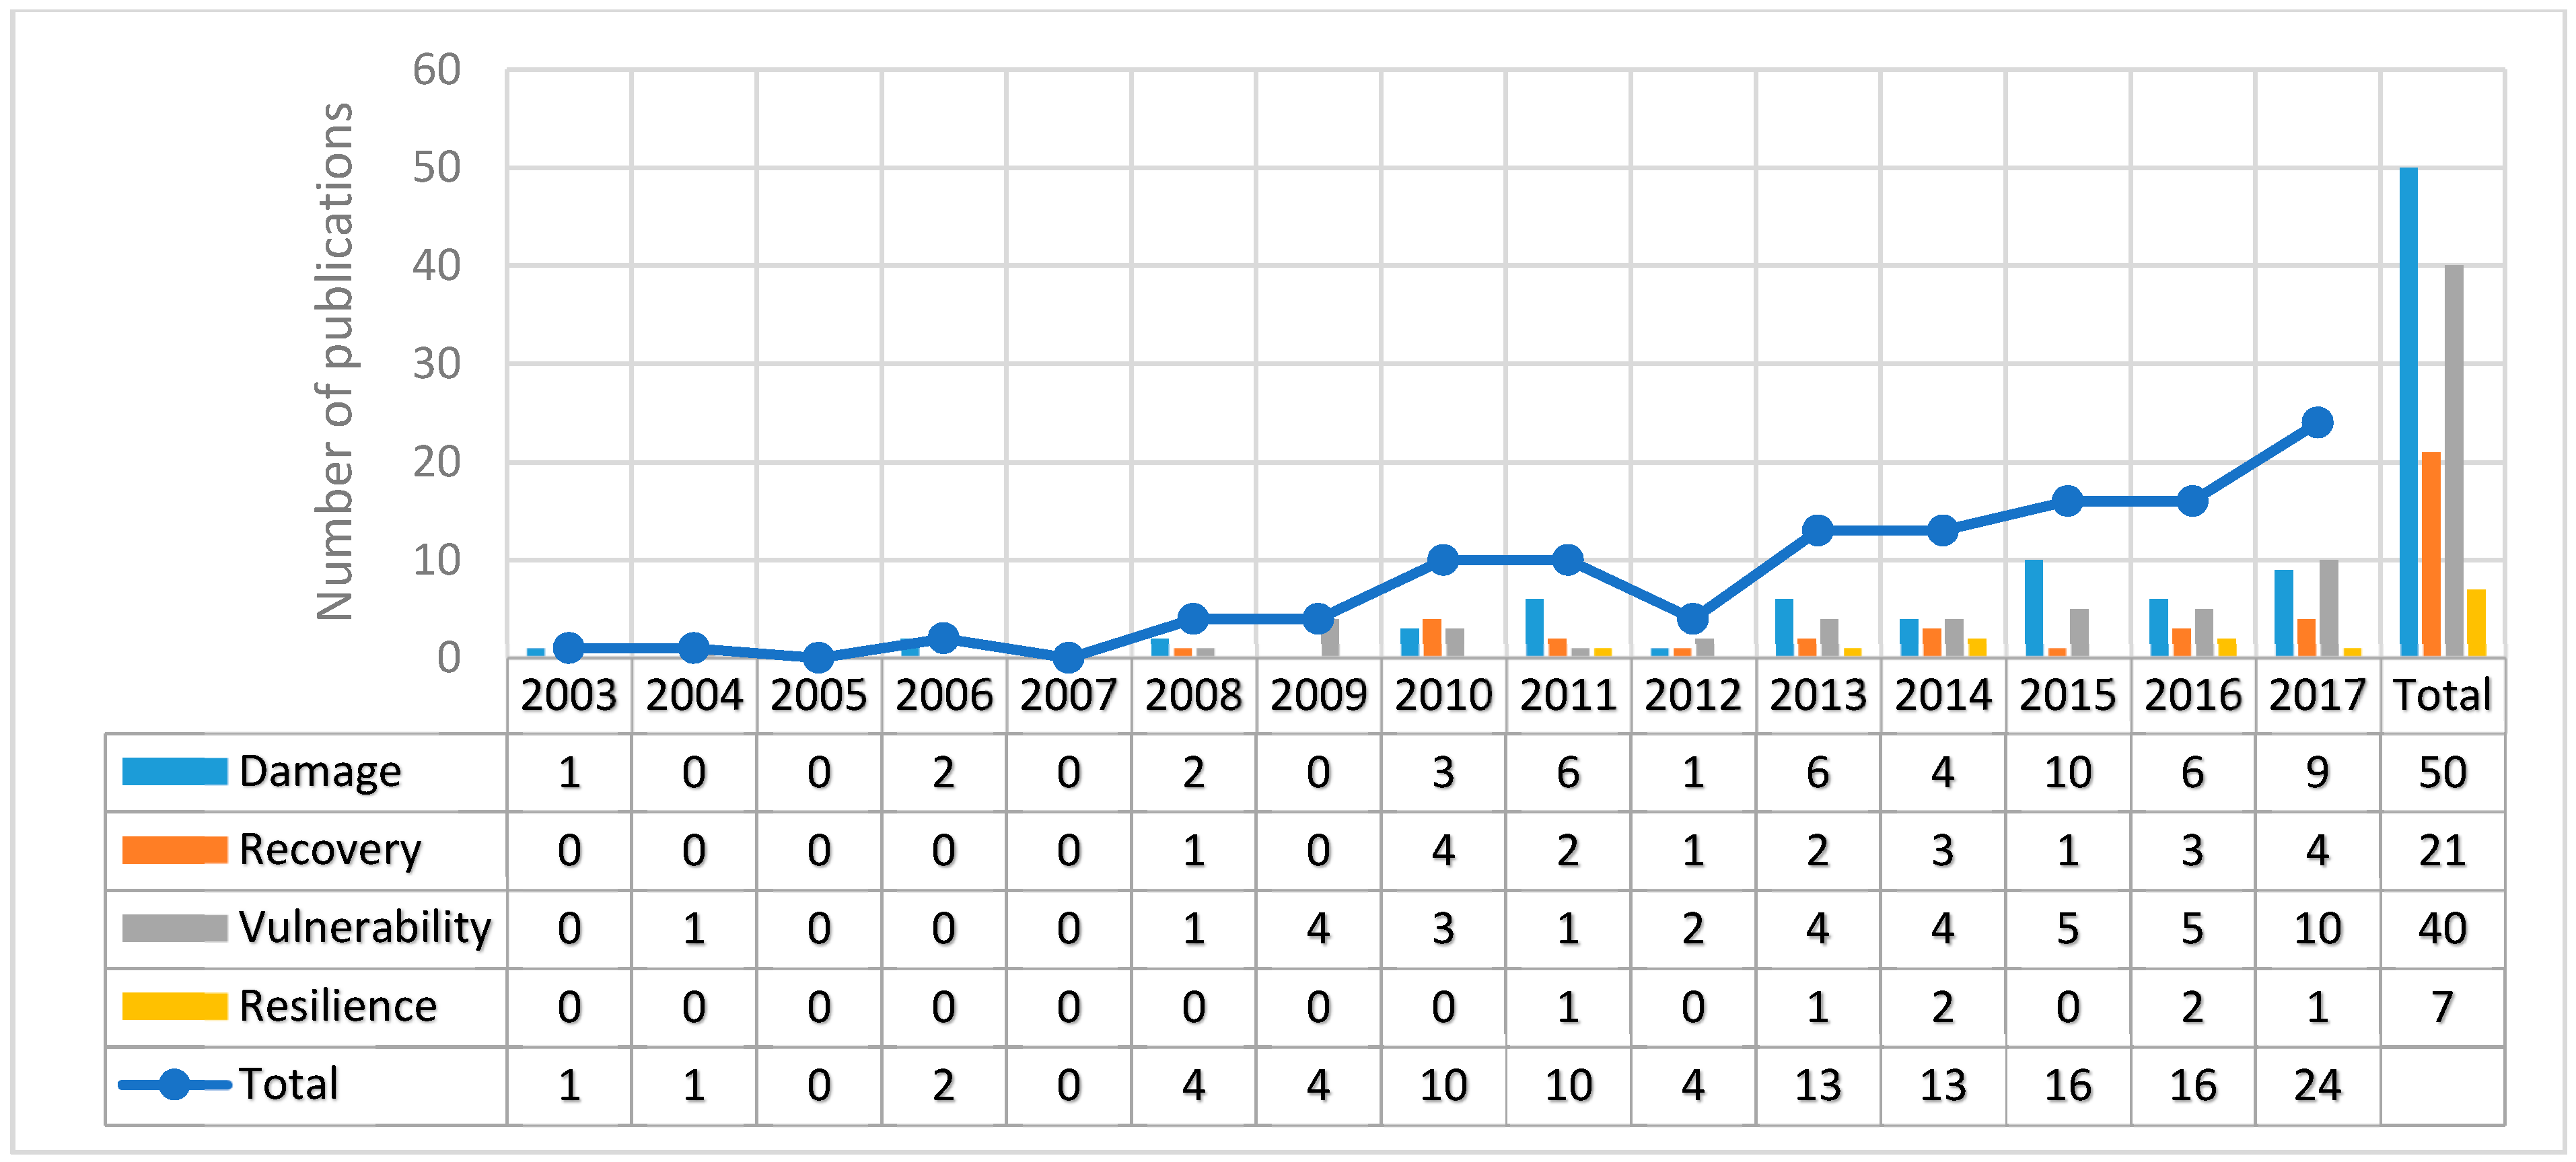
Table 1.
Remote sensing-based built-up proxies for urban DRM, Buildings category. Mono and Multi refer to mono-temporal and multi-temporal remote sensing (RS) data that are used for the extraction, respectively.
Table 1.
Remote sensing-based built-up proxies for urban DRM, Buildings category. Mono and Multi refer to mono-temporal and multi-temporal remote sensing (RS) data that are used for the extraction, respectively.
| Proxy | Essence | Used in Disaster Phase | Used RS Data to Extract | Mono | Multi | Key References |
|---|---|---|---|---|---|---|
| Structural/building damages/collapsed | Number of damaged/collapsed buildings shows the damaged area | Damage | VHR satellite images, Aerial images, UAV data | ✓ | ✓ | [25,45,47] |
| Shadow | To extract collapsed/damaged buildings (collapsed/damaged buildings do not produce regular shadow pattern) | Damage | VHR satellite images, Aerial images | ✓ | [37,44,51,52,53] | |
| Texture | To extracted damaged buildings, roads, and urban areas (irregular texture over buildings/roads indicates damaged areas) | Damage, Vulnerability | HR and VHR aerial and satellite images | ✓ | ✓ | [9,54,55,56,57,58,59,60,61,62] |
| Building offset | To extract building pancake collapse | Damage | VHR satellite images | ✓ | [37] | |
| Roofing tile displacements or collapsed | To extract building damage ratio (displaced/collapsed roofs indicates damage to buildings) | Damage | Radar images, VHR satellite images, UAV data | ✓ | [68,69,70,71] | |
| Building deformation | Damaged buildings have deformations in geometries including inclined building, discontinuous surface structure (roof) | Damage | Radar images, HR-VHR satellite images, UAV data, Aerial video | ✓ | [68,70,72,73,74] | |
| Spalling building | Spalling building indicates damages to buildings | Damage | UAV data, VHR satellite images | ✓ | [71,75] | |
| Ruble piles and debris | To extract building damage ratio | Damage | UAV data, VHR satellite images | ✓ | [71,73,75,76,77,78,79,80,81] | |
| Value of point height change | Change in building heights to detect collapsed buildings (collapsed building has lower height value than intact one) | Damage | VHR remote sensing height data (e.g., UAV data) | ✓ | [50] | |
| (Walls/facades with) Cracks | To extract building damage ratio | Damage | UAV data, Radar data, Aerial images | ✓ | [68,70,82,83] | |
| Holes/gaps on roof and facade of the structures | To extract building damage ratio | Damage | UAV data | ✓ | [69,70,71,82,84,85] | |
| Interaction of cracks with structural element | To extract building damage ratio | Damage | UAV data | ✓ | [69,70] | |
| Local symmetry pattern of facade windows | Change in the windows pattern from its original to irregular one shows damage | Damage | Oblique aerial images | ✓ | ✓ | [86] |
| Building removal and reconstruction | Number of reconstructed buildings shows a progress in recovery process | Recovery | VHR satellite images, Aerial images | ✓ | [32,38,46,47,48,49,87] [34,49,88] | |
| Building morphology | Morphology of a building is a proxy for building use/land use extraction, and change in this proxy from pre- to post-disaster shows land use changes in recovery process | Recovery, Vulnerability | VHR satellite images | ✓ | [32,34,48,49,87,89] | |
| Energy loss | Lower energy loss value shows better insulation of house | Recovery | VHR images | ✓ | ✓ | [49] |
| Position of building in relation to the street level | The difference between elevation of building to street (buildings in lower elevation in relation to street level are more vulnerable) | Vulnerability | VHR satellite images, DEM data | ✓ | [90,91] | |
| Building materials | To determine the structural vulnerability and resilience (e.g., concrete-based buildings are more resilient than wooden ones to water-related disasters) | Vulnerability, Resilience | VHR images, Urban map | ✓ | [61,62,63,64,65,66] |
Table 2.
Remote sensing-based built-up proxies for urban DRM, Transport category. Mono and Multi refer to mono-temporal and multi-temporal RS data, respectively, used for the extraction, respectively.
Table 2.
Remote sensing-based built-up proxies for urban DRM, Transport category. Mono and Multi refer to mono-temporal and multi-temporal RS data, respectively, used for the extraction, respectively.
| Proxy | Essence | Used in Disaster Phase | Used RS Data to Extract | Mono | Multi | Key References |
|---|---|---|---|---|---|---|
| Blow-out debris | To detect blocked roads (During a disaster blow-out debris block partially/completely the roads) | Damage | UAV data, HR and VHR satellite images | ✓ | ✓ | [37,71,72,75] |
| Accessibility analysis/Road accesses/road condition | Accessibility analysis shows the transportation capacity of the network | Damage, Recovery | VHR satellite images | ✓ | ✓ | [32,34,46,47,48,49,92,93] |
| Reconstruction of bridges and public transport facilities | Bridges and public transport facilities are essential parts of providing accessibility in a transport network | Damage, Recovery | VHR satellite images | ✓ | ✓ | [32,34,47,48,49] |
| Presence of vehicles | Presence of vehicles on the roads provides information about transportation condition and functioning of roads | Recovery | VHR satellite images | ✓ | [32,34,48,49] | |
| Length of roads | Length of the roads shows the capacity of the transport network. | Recovery, Vulnerability | Oblique aerial images, VHR satellite images | ✓ | [48] [39] | |
| Width of roads | Wider roads are less vulnerable to be completely blocked during a disaster | Vulnerability | VHR satellite images | ✓ | [94] | |
| Road network density | Higher ratio of road network density shows less vulnerable transport network | Vulnerability | HR satellite images, Radar data | ✓ | [95] | |
| The proportion of low-grade highway | Low-grade highways (e.g., county road) are more vulnerable | Vulnerability | HR satellite images | ✓ | [96] |
Table 3.
Remote sensing-based built-up proxies for urban DRM, Others category. Mono and Multi refer to mono-temporal and multi-temporal RS data that used for extraction, respectively.
Table 3.
Remote sensing-based built-up proxies for urban DRM, Others category. Mono and Multi refer to mono-temporal and multi-temporal RS data that used for extraction, respectively.
| Proxy | Essence | Used in Disaster Phase | Used RS Data to Extract | Mono | Multi | Key References |
|---|---|---|---|---|---|---|
| Mean flood water height | Higher mean flood water cause more damages | Damage | VHR satellite imagery | ✓ | [97] | |
| Sea water penetration on land | Low level sea water penetration on land increases the tsunami inundation zone | Damage | ALOS images, PALSAR data | ✓ | ✓ | [98] |
| Surface water areas/Level of flood water coverage | Increase in the level of flood water coverage in land increase the damage in the area | Damage | VHR satellite images, DEM data, ASTER images | ✓ | [47,99,100] | |
| Debris line | To identify how far water reached inland and extract debris zone | Damage | Landsat TM, VHR aerial and satellite imagery | ✓ | [81,101,102] | |
| Impervious surface classification | To extract permeability of the surface | Recovery | VHR satellite images | ✓ | [49] | |
| Ratio of permanent residential buildings and temporary accommodation | To extract movement to reconstructed/recovered areas | Recovery | VHR satellite images | ✓ | ✓ | [32,34,46,48] |
| Drainage network density | Lower drainage network density in case of a water-related disaster increase the vulnerability | Vulnerability | Sentinel-2 imagery, DEM data, VHR satellite images | ✓ | [103,104,105,106] | |
| River network density | Higher river network density in case of a water-related disaster increase the vulnerability | Vulnerability | DEM data, Landsat 8 images | ✓ | [95] | |
| Impervious surface | To extract permeability of the surface (impervious surface has low level of permeability, which increases the vulnerability) | Vulnerability | Landsat images | ✓ | [95] |
Table 4.
Remote sensing-based economic proxies for urban DRM, Macro, regional, and urban economics category. Mono and Multi refer to mono-temporal and multi-temporal RS data that used for extraction, respectively.
Table 4.
Remote sensing-based economic proxies for urban DRM, Macro, regional, and urban economics category. Mono and Multi refer to mono-temporal and multi-temporal RS data that used for extraction, respectively.
| Proxy | Essence | Used in Disaster Phase | Used RS Data to Extract | Mono | Multi | Key References |
|---|---|---|---|---|---|---|
| Land use | To extract economic activity types/location and economic focal spaces | Damage, Recovery, Vulnerability, | VH-H resolution satellite images, Landsat images, | ✓ | ✓ | [30,34,104,108,109,115,116,117,118,119,120] |
| Nightlight intensity | To estimate GDP and amount of economic activities | Damage, Recovery, Resilience | VIIRS nightlight satellite imagery | ✓ | ✓ | [41,110,111,114] |
| Pier length | Increase in pier length shows stronger fishery industry, which is a vital source of livelihood | Damage, Recovery | VHR images | ✓ | ✓ | [34,48] |
| Presence of boats | High number of boats indicates stronger fishery industry, which is avital source of livelihood | Damage, Recovery | VHR images | ✓ | ✓ | [34,48,49] |
| Presence of shrimp hatcheries and ponds | High number of shrimp hatcheries and ponds indicates strong fishery industry, which is a vital source of livelihood | Damage, Recovery | VHR images | ✓ | ✓ | [34,46,48] |
| Crops | Agriculture industry for livelihood recovery | Damage, Recovery | VHR images | ✓ | ✓ | [32] |
| Arable land | Agriculture industry for livelihood recovery | Recovery | VHR images | ✓ | ✓ | [34,46,48,49] |
| Presence of heavy vehicles | To extract industrial buildings | Recovery | VHR images | ✓ | ✓ | [34,49] |
| Chimneys | To extract industrial buildings | Recovery | VHR images | ✓ | ✓ | [34,49] |
| Warehouses | To extract industrial buildings | Recovery | VHR images | ✓ | ✓ | [34,49] |
| Transportation to move raw materials around site | e.g., conveyors, pipelines, Railroads to extract industrial buildings | Recovery | VHR images | ✓ | ✓ | [34,49] |
| Roof color and material | To extract industrial buildings (such buildings have different roof color and materials than other buildings such as residential) | Recovery | VHR images | ✓ | ✓ | [34,49] |
| Change in building morphology and use | Morphology of a building is a proxy for building use/land use extraction, and change in this proxy from pre- to post-disaster shows land use changes in recovery process | Recovery | VHR images | ✓ | [32,34,48,87] | |
| Change in urban morphology | To extract changes in business, economic activity types and locations | Recovery | VHR images | ✓ | [49,121] | |
| Land surface temperature | Industrial buildings produce more temperature. Used for urban land use change detection (also change in settlement locations) | Recovery | Landsat ETM+ | ✓ | ✓ | [122] |
| Building geometry and heights | Usually in an urban area commercial buildings are higher than other buildings, also industrial buildings have bigger sizes and irregular shapes. Used for building use and density calculations and then economic value | Vulnerability | Oblique imagery | ✓ | [39] | |
| Farmland ratio | Used for detecting human/economic activities. High farmland ratio shows higher economic activities | Vulnerability | VHR-HR images | ✓ | [103] |
Table 5.
Remote sensing-based economic proxies for urban DRM, Logistics category. Mono and Multi refer to mono-temporal and multi-temporal RS data that used for extraction, respectively.
Table 5.
Remote sensing-based economic proxies for urban DRM, Logistics category. Mono and Multi refer to mono-temporal and multi-temporal RS data that used for extraction, respectively.
| Proxy | Essence | Used in Disaster Phase | Used RS Data to Extract | Mono | Multi | Key References |
|---|---|---|---|---|---|---|
| Indirect street network performance | Impacts of an event not only on the effected roads but also on the other streets | Damage | VHR images | ✓ | ✓ | [40,130] |
| Spatial connectivity | Spatial connectivity to central business district | Recovery | VHR images | ✓ | ✓ | [127] |
| Transportation land and facilities | High level of transportation facilities reduces economic vulnerability | Vulnerability | VHR images | ✓ | [109] | |
| Accessible vulnerability/connectivity | Fragile accessibility increases the economic vulnerability | Vulnerability | VHR images | ✓ | [129] |
Table 6.
Remote sensing-based social proxies for urban DRM, Services and infrastructures category. Mono and Multi refer to mono-temporal and multi-temporal RS data that used for extraction, respectively.
Table 6.
Remote sensing-based social proxies for urban DRM, Services and infrastructures category. Mono and Multi refer to mono-temporal and multi-temporal RS data that used for extraction, respectively.
| Proxy | Essence | Used in Disaster Phase | Used RS Data to Extract | Mono | Multi | Key References |
|---|---|---|---|---|---|---|
| Administration, education, healthcare and religious facilities | Number buildings such as schools, prisons, libraries, the emergency services and places of worship (e.g., churches, mosques or temples) shows higher rate of social infrastructure and services | Damage, Recovery | VHR images | ✓ | ✓ | [32,34,48] |
| Temporary accommodation | Multi-temporal monitoring of size of temporary accommodation (decrease in size of temporary accommodation shows the movement towards permanent ones with higher qualities) | Recovery | VHR images | ✓ | ✓ | [32,34,47,48,49] |
| Monitoring overcrowding | Through covered living space extraction | Recovery | VHR images | ✓ | [34,49] | |
| Pedestrian access/mobility | Number of street network intersections, block parcel size | Recovery | VHR images | ✓ | ✓ | [49] |
| Building heights | To extract commercial and industrial buildings | Recovery | VHR images, DEM data | ✓ | ✓ | [49] |
| Number of inhabitants per settlement | Confirm that if the attachment level to the new settlements is low, it hinders the recovery process and hence the resilience of the city. | Recovery | VHR images | ✓ | ✓ | [131] |
| Local facility in use/number of urban facilities | Such as car parking, main high street, garden, playground, swimming pool | Recovery, Resilience | VHR images | ✓ | ✓ | [34,49,131] |
| Transport facilities | High level transport facilities shows less vulnerable urban areas | Vulnerability | VHR images | ✓ | [39] | |
| Distance to lifeline | Decrease in distance to health systems, fire stations and etc. decreases the vulnerability | Vulnerability | VHR images | ✓ | [33,93,136,137] | |
| Potential to evacuation | High level of covered road area shows resilient urban area which is calculated as Road/km2 | Resilience | Road map/road vector data | ✓ | [31] | |
| Presence open spaces | Open spaces such as green spaces, street networks, hills provide potential safe zones for disaster and increase resilience | Resilience | Urban map | ✓ | [138,139] |
Table 7.
Remote sensing-based social proxies for urban DRM, Socio-economic status category. Mono and Multi refer to mono-temporal and multi-temporal RS data that used for extraction, respectively.
Table 7.
Remote sensing-based social proxies for urban DRM, Socio-economic status category. Mono and Multi refer to mono-temporal and multi-temporal RS data that used for extraction, respectively.
| Proxy | Essence | Used in Disaster Phase | Used RS Data to Extract | Mono | Multi | Key References |
|---|---|---|---|---|---|---|
| Slope position | People living in a steep sloped position are with poor economy/income | Recovery, Vulnerability | VHR images | ✓ | [33,49,140] | |
| Proportion of built-up and vegetated area | High proportion of vegetation in an urban (built-up) area shows building with reach householders. | Recovery, Vulnerability | VHR images | ✓ | [33,49] | |
| Available infrastructure | More infrastructures are available in wealthy urban areas. | Recovery, Vulnerability | VHR images | ✓ | [33,49] | |
| Road conditions | Road conditions are better in wealthy urban areas. | Recovery, Vulnerability | VHR images | ✓ | ✓ | [33,49,148] |
| Roof type | Roofs of the buildings with high income has better type/materials | Recovery, Vulnerability | VHR images | ✓ | [33,49] | |
| Texture | To extract settlement type (e.g., irregular textures shows slum areas) | Vulnerability | VHR images | ✓ | [33,143,144] | |
| Proportion of green spaces per building block | Higher proportion of green spaces per building block shows high social status of building holders, which are less vulnerable | Vulnerability | VHR images | ✓ | [90,91] | |
| Share of population in irregular clusters | Irregular clusters as roof types refer to people with poor economy/income (Slum area) | Vulnerability | Urban map | ✓ | [146] | |
| Night time light | High night light intensity in image for an urban area shows more resilient areas due to presence more facilities | Resilience | VIIRS nightlight satellite imagery | ✓ | [114] |
Table 8.
Remote sensing-based proxies for the natural environment of urban DRM. Mono and Multi refer to mono-temporal and multi-temporal RS data that used for extraction, respectively.
Table 8.
Remote sensing-based proxies for the natural environment of urban DRM. Mono and Multi refer to mono-temporal and multi-temporal RS data that used for extraction, respectively.
| Proxy | Essence | Used in Disaster Phase | Used RS Data to Extract | Mono | Multi | Key References |
|---|---|---|---|---|---|---|
| Vegetation spatial heterogeneity | To examine the structure of ecological system | Damage | Landsat images | ✓ | [149] | |
| Vegetation cover | Vegetation cover ratio and its changes (using near-infrared band of satellite images and NDVI index) shows damages/recovery to environment | Damage, Recovery, Vulnerability | MODIS images, Landsat images, VHR images | ✓ | ✓ | [39,46,47,99,103,106,151,152,157] |
| Fractional vegetation cover | An index for ecological assessment/change | Damage, Recovery | Landsat images, MODIS images | ✓ | [153] | |
| Vegetation cover type | Change in vegetation cover type shows damage/recovery of ecology | Damage, Recovery | Landsat images, MODIS images | ✓ | ✓ | [153,154] |
| Debris and floodwater removal | Removing effects of a disaster (debris and floodwater) gives space for growth of vegetation | Recovery | Ground-based photography, VHR images | ✓ | ✓ | [32,46,49,88,97] |
| Urban green space cover/public spaces | High ratio of urban green/public space covers provide space for different biological/ecological types (Biodiversity assessment) | Recovery | VHR images | ✓ | ✓ | [34,48] |
| Presence of debris, mud and salt in water | For water contamination assessment | Recovery | VHR images | ✓ | [34,49] | |
| Access to recreation | Availability of land | Recovery | VHR images | ✓ | ✓ | [49] |
| Permeability of surfaces | Impact on urban water runoff (high permeability of surface decreases the water runoff) | Recovery, Vulnerability | VHR images | ✓ | ✓ | [49,160] |
| Land cover | To monitor environmental erosion, degradation, deforestation. | Recovery, Vulnerability | ASTER images, Landsat images, MR images, VHR images | ✓ | ✓ | [34,49,106,116,117,158,161,164,165] |
| Land use | To monitor environmental erosion, degradation, deforestation. | Recovery, Vulnerability | ALOS images, ASTER images, Landsat images, MR images, VHR images | ✓ | ✓ | [8,104,108,116,117,118,120,164] |
| Gross primary production (GPP) | To compute vegetation productivity | Recovery, Resilience | MODIS images | ✓ | ✓ | [167,168] |
| Evapotranspiration | To evaluate flood vulnerability through extracting vegetation cover and type | Vulnerability | MODIS images | ✓ | [166] |
© 2018 by the authors. Licensee MDPI, Basel, Switzerland. This article is an open access article distributed under the terms and conditions of the Creative Commons Attribution (CC BY) license (http://creativecommons.org/licenses/by/4.0/).
Share and Cite
MDPI and ACS Style
Ghaffarian, S.; Kerle, N.; Filatova, T. Remote Sensing-Based Proxies for Urban Disaster Risk Management and Resilience: A Review. Remote Sens. 2018, 10, 1760. https://doi.org/10.3390/rs10111760
AMA Style
Ghaffarian S, Kerle N, Filatova T. Remote Sensing-Based Proxies for Urban Disaster Risk Management and Resilience: A Review. Remote Sensing. 2018; 10(11):1760. https://doi.org/10.3390/rs10111760
Chicago/Turabian StyleGhaffarian, Saman, Norman Kerle, and Tatiana Filatova. 2018. "Remote Sensing-Based Proxies for Urban Disaster Risk Management and Resilience: A Review" Remote Sensing 10, no. 11: 1760. https://doi.org/10.3390/rs10111760
Note that from the first issue of 2016, this journal uses article numbers instead of page numbers. See further details here.