Semi-Automated Classification of Lake Ice Cover Using Dual Polarization RADARSAT-2 Imagery
by
 , , , and
Junqian Wang
1,* ,
,
Claude R. Duguay
1 ,
,
David A. Clausi
2,
Véronique Pinard
3 and
Stephen E. L. Howell
4 1
Department of Geography and Environmental Management, University of Waterloo, Waterloo, ON N2L 3G1, Canada
2
Department of Systems Design Engineering, University of Waterloo, Waterloo, ON N2L 3G1, Canada
3
Canadian Ice Service, Environment and Climate Change Canada, Ottawa, ON K1A 0H3, Canada
4
Climate Research Division, Environment and Climate Change Canada, Toronto, ON M3H 5T4, Canada
*
Author to whom correspondence should be addressed.
Remote Sens. 2018, 10(11), 1727; https://doi.org/10.3390/rs10111727
Submission received: 13 September 2018
/
Revised: 24 October 2018
/
Accepted: 29 October 2018
/
Published: 1 November 2018
Abstract
:Lake ice is a significant component of the cryosphere due to its large spatial coverage in high-latitude regions during the winter months. The Laurentian Great Lakes are the world’s largest supply of freshwater and their ice cover has a major impact on regional weather and climate, ship navigation, and public safety. Ice experts at the Canadian Ice Service (CIS) have been manually producing operational Great Lakes image analysis charts based on visual interpretation of the synthetic aperture radar (SAR) images. In that regard, we have investigated the performance of the semi-automated segmentation algorithm “glocal” Iterative Region Growing with Semantics (IRGS) for lake ice classification using dual polarized RADARSAT-2 imagery acquired over Lake Erie. Analysis of various case studies indicated that the “glocal” IRGS algorithm could provide a reliable ice-water classification using dual polarized images with a high overall accuracy of 90.4%. However, lake ice types that are based on stage of development were not effectively identified due to the ambiguous relation between backscatter and ice types. The slight improvement of using dual-pol as opposed to single-pol images for ice-water discrimination was also demonstrated.
1. Introduction
Lake ice is an important component of the cryosphere for several weeks to several months of the year in high-latitude regions [1]. Ice cover on lakes is known to have an effect on both regional climate and weather events (e.g., thermal moderation and lake-induced snowfall) and to be a robust indicator of climate change and variability due to its sensitivity to changing atmospheric conditions, air temperature, in particular [1,2,3]. The Laurentian Great Lakes have the world’s largest freshwater surface covering an area of 245,000 km2. Ice cover of the Great Lakes has a strong impact on the regional climate, navigation, economic activities, and public safety [4]. Knowledge of ice conditions and variability on the Great Lakes is especially important for the shipping industry and marine resource management.
Monitoring detailed ice conditions on large lakes requires the use of satellite-borne Synthetic Aperture Radar (SAR) data that provide all-weather sensing capabilities, high resolution, and large spatial coverage. For most ice centers, SAR is considered to be the most satellite data source suitable for operational ice mapping to support navigation safety [5]. C-band satellite SAR data from ENVISAT, ERS-1/2, RADARSAT-1, and Sentinel-1 have been intensively used as the prime data source for sea ice mapping in the last two decades [6]. With better ice-water discrimination and ice edge detection capabilities, multi-polarization data from RADARSAT-2 can further improve the ability for ice monitoring [7]. Using RADARSAT-2 quad-pol and ENVISAT ASAR dual-pol data, Leshkevich and Nghiem [4] successfully advanced their Great Lakes ice classification algorithm utilizing the backscatter signature library that was established from the 1997 Great Lakes Winter Experiment (GLAWEX97).
Different ice types and open water can be manually identified from the analysis of SAR images. Due to the lack of suitable automated algorithms, the Canadian Ice Service (CIS) and U.S. National Ice Center (NIC) have been manually producing Great Lakes ice charts for operational purposes based mainly on visual interpretation of SAR images with ancillary data. Ice charts can provide reliable region-based ice type and ice concentration information. However, the visual interpretation of SAR images is coarse, time-consuming, and subjective [8]. With the growing number of SAR missions, such as Sentinel-1A/B and the upcoming RADARSAT Constellation Mission, a dramatic increase of satellite imagery is becoming available for lake ice mapping. The large data volume is constrained by the time-consuming manual interpretation, and therefore, an automated or semi-automated ice classification algorithm is desired to assist the CIS ice charting process.
Numerous efforts have been made to automate ice mapping from SAR data, with a particular focus on sea ice. Various types of algorithms have been applied, including simple backscatter thresholding [9], neural network (NN) [10,11,12], Bayesian approach [13], expert system [14], k-means [15], support vector machines (SVM) [6], maximum likelihood (ML) [16], and Markov random fields (MRF) models [17]. Algorithms based only on backscatter coefficient are often constrained by the ambiguous correlation between backscatter and ice/water features [18,19]. Different ice types with varying surface roughness can have overlapping backscatter ranges with open water depending on wind conditions [20]. Therefore, additional SAR statistics, such as local mean and variance [21] and texture features [6,22,23], have been utilized to improve the classification.
Early work by [9] used unsupervised ISODATA classification followed by cluster labelling using seasonal look-up tables of different ice types. Gill [24] proposed a semi-automatic sea ice classification algorithm using fuzzy rules on SAR amplitude data and entropy derived from Gray-Level Co-occurrence Matrix (GLCM) that classifies data over the Arctic Ocean into calm water, wind-roughed water, and low and high concentration sea ice. An intelligent system called Advanced Reasoning using Knowledge for Typing Of Sea ice (ARKTOS) was developed for SAR sea ice image analysis [14] that automatically mimics the reasoning process of ice experts by extracting objects or features and using rule-based system to classify the segments. Karvonen et al. [25] developed an algorithm that was based on segment-wise thresholding of local backscatter autocorrelation for discriminating open water and Baltic Sea ice. A texture-based automatically trained ML classifier was developed from RADARSAT-1 and ENVISAT ASAR images for ice-ocean discrimination [16] by dividing the images into narrow incidence angle ranges, their results were significantly improved when compared to not dividing into slices. Geldsetzer et al. [26] established backscatter thresholds to distinguish decaying lake ice from open water using dual-pol RADARSAT-2 imagery however, their thresholds are not robust enough due to the high interlake and temporal variability of radar backscatter. Recently, Zakhvatkina et al. [6] developed a fully automatic ice-water classification algorithm that was trained from SVM classifier with backscatter values and GLCM texture features based on dual-polarized RADARSAT-2 images that achieved an average accuracy of 91%. Similar texture-based training was also previously applied to a NN-based algorithm for sea ice classification in the Central Arctic [10].
Most of the aforementioned studies on SAR ice classification have used supervised classification based on SAR statistics. Although supervised classification can be implemented automatically, the training data are generally biased due to the high interclass and intra-class variability of backscatter [27]. Additionally, well trained algorithms often perform best on specific geographic regions or seasons and thus cannot be widely applied. Unlike supervised classification, the unsupervised approach does not require a priori knowledge of the feature of investigation. While the arbitrary classes that were generated from an unsupervised algorithm often need manual labelling, it is believed to be a superior approach to many supervised methods, since it does not require prior analysis of training samples and is easy to implement [15].
Recently, an unsupervised classification algorithm named “glocal” iterative region growing with semantics (IRGS) was proposed and used for sea ice-water classification [23]. This is a hierarchical region-based method that minimizes the effect of incidence angle variation by performing segmentation separately on smaller polygons. Leigh et al. [23] used the “glocal” IRGS algorithm on HV polarization imagery and obtained well discriminated sea ice and open water segments. It has also been shown that for SAR sea-ice image segmentation, IRGS can produce homogeneous regions that are relatively consistent with visual interpretation [28]. Among other unsupervised approaches, IRGS has shown robust performance for operational SAR sea-ice classification and it has been validated by the CIS ice experts [27]. IRGS was also successfully used by [29] for grounded and floating ice classification on shallow lakes of the North Slope of Alaska. Although the multivariate version of IRGS algorithm is applicable [30], it has not been comprehensively tested on dual-pol images for lake ice mapping.
The objective of this study is to investigate the performance of the semi-automated “glocal” IRGS for lake ice classification on Lake Erie using dual polarized (HH and HV) RADARSAT-2 imagery. Here, ice-water and ice type classification are conducted separately and the performance of the algorithm on dual-pol data as opposed to single polarization is also tested. Classification results are validated against Great Lakes image analysis charts provided by the CIS.
2. Study Area
The selected lake for this study, Lake Erie, is the fourth largest of the North American Great Lakes by surface area (Figure 1). Lake Erie lies between 78° and 94°W with a surface area of 25,655 km2 and an average depth of 19 m, making it the shallowest and smallest by volume of the Great Lakes. Lake depth determines the amount of heat stored in the lake body and thus is an important factor for ice freeze-up [31]. Deeper lakes have greater heat storage capacity so that they take longer to cool down and eventually freeze [32]. Therefore during winter, the Great Lakes do not usually freeze over completely, except the shallowest Lake Erie [33].
Over the past five years (2013–2017), the mean winter air temperature (average daily air temperature of December, January, and February) and mean annual temperature recorded at the New Glasgow weather station, near the northern shore of Lake Eire (Figure 1), was −0.64 °C and 8.83 °C, respectively (Table 1). The period of analysis is the cold winter of 2013–2014, which experienced an average winter temperature of −6.36 °C. During that winter, the constant low temperature caused 92.5% of the Great Lakes to become frozen by early March, which is the second largest ice coverage since 1973 [34]. The daily minimum and maximum air temperatures in the area of Lake Erie during this winter are shown in Figure 2. The hourly air temperature at the time of each RADARSAT-2 image acquisition used in the study is also shown. Ascending and descending scenes are acquired at 6 p.m. and 6 a.m. local time, respectively.
3. Data
3.1. Synthetic Aperture Radar
In this study, 26 dual-polarized (HH+HV) RADARSAT-2 ScanSAR images acquired over Lake Erie from January to April 2014 were used for lake ice classification (Figure 3). The SAR acquisition dates for all the scenes are listed in Table 2. They have a nominal pixel spacing of 50 m × 50 m and a scene size of 500 km × 500 km in both range and azimuth directions. With a wide spatial coverage, ScanSAR Wide A (SCWA) mode is the main mode that is used by the CIS for operational lake ice monitoring. The incidence angle of the images ranges from 20° to 49°. The temporal resolution is around 1–3 days, with varying incidence angle ranges.
An example of a RADARSAT-2 scene acquired on 19 January 2014 during the ice freeze-up period is shown in Figure 4. The scene covers Lake Erie (bottom), part of Georgian Bay (top), and Lake Ontario (right). Various ice types on Lake Erie are well captured at HH polarization. As shown, HV polarization is less sensitive to incidence angle and wind-induced open water surface roughness in contrast to HH polarization. The original images were down sampled from approximately 10,000 × 10,000 pixels to 5000 × 5000 pixels by performing a 2 × 2 block averaging (100 m pixel spacing). This reduces the image size by a factor of 4, which increases the computational efficiency. This is the same procedure followed at the CIS for ice charting from SAR imagery.
3.2. CIS Image Analysis Charts
Since in situ observations on large lakes like the Great Lakes is impractical and expensive, we used the Great Lakes image analysis charts that are provided by the CIS who has decades of experience interpreting SAR imagery as the reference data. They are produced through visual interpretation of the ice conditions from SAR imagery in near real time (within 4 h of acquisition). Visual interpretation of SAR imagery is conducted by an experienced ice analyst through a digital image display and vector drawing tool. In addition to SAR imagery, historic ice patterns and meteorological conditions are also analyzed to support the ice charting. Ice analysts manually draw polygons on the SAR image, and for each polygon, the ice types, and their estimated concentrations are reported in an oval shape “egg code” (Figure 5). The egg code is the World Meteorological Organization (WMO) standard. The standard thickness-based lake-ice stage of development coding is given in Table 3. More information about the CIS image analysis charts can be found in [35].
Image analysis charts are color-coded using the international WMO code for total concentration (CT) or stage of development (SD) of ice in the area. The total ice concentration is often monitored for weather forecasting while stage of development is more useful for operational purposes, such as ship navigation. Color code CT represents the estimated total ice concentration (in tenths) in each manually drawn polygon. Fast ice that is fastened to the shore is 100 percent concentration by definition. Color code SD is the ice type that has highest partial concentration in that polygon. The color code for CT is used when concentration is more variable than stage of development, while the color code for SD is intended to be used when stage of development is more variable than concentration [36]. An example of the Eastern Great Lakes image analysis chart color coded as CT and SD drawn from the RADARSAT-2 19 January 2014 scene (Figure 4) is shown in Figure 6.
4. Methodology
4.1. “Glocal” Iterative Region Growing with Semantics Classification
To map lake ice types and open water, image segmentation was performed on the 26 RADARSAT-2 scenes. The hierarchical region-based classification called “glocal” IRGS method [11] was used in the study. This is an unsupervised classification method that can identify homogeneous regions with arbitrary class labels. It has been integrated into the MAp-Guided Ice Classification (MAGIC) System that was developed by the Vision and Image Processing Research Group at University of Waterloo [37].
The “glocal” method used in the study was built upon the IRGS algorithm developed by [28]. It is an unsupervised segmentation algorithm proposed for SAR sea-ice mapping. IRGS is an edge-based method which uses edge penalty functions and a region growing technique [28]. Basically, IRGS first breaks the scene into small homogeneous regions using a watershed segmentation algorithm and assigns each region a class label using an MRF model [27]. Then, adjacent regions with the same assigned class are successively merged until the system energy is minimized. The classification and merging process are combined in a iterative manner until the merging cannot be performed further or the maximum number of iterations is reached [38]. This algorithm incorporates the edge strength, which improves the adaptivity of the spatial context model to non-stationarity situations [28,38]. Since IRGS is performed on regions rather than pixels, long range (tens or hundreds of pixels) of the spatial interactions between pixels are efficiently accounted [38].
For large lakes, such as the Great Lakes, large SAR scenes on the order of 500 km wide are necessary for mapping lake ice. However, such large scenes introduce statistical nonstationarities across the image as a result of the incidence angle effects. To minimize the effects of incidence angle, the hierarchical “glocal” IRGS classification approach that combines the “high-detail local” and “large-scale global” information was introduced [23]. The local step divides the image into a number of autopolygons and IRGS classification is performed separately for each autopolygon. This step over-segments each autopolygon into a number of homogeneous regions. The class statistics for each autopolygon can be considered stationary [23]. The global step then glues the regions from the local autopolygon classification and forms a classification across the whole scene. This hierarchical method identifies homogeneous regions in the full scene with arbitrary class labels.
The “glocal” IRGS classification is performed in the MAGIC system and the flowchart is shown in Figure 7. The inputs to the system are HH and HV polarizations of a RADARSAT-2 image and its corresponding landmask that masks out land and other lakes. First, a number of autopolygons (10 × 10 grid) are created on the HV image while using the watershed segmentation [39]. The HV polarization is chosen because it is less sensitive to incidence angle and wind-induced surface roughness. An example of autopolygon segmentation for the 19 January 2014 scene (see original imagery in Figure 4) is presented in Figure 8a. Each autopolygon is then segmented to five arbitrary classes using IRGS classification that is based on both HH and HV bands. This step over segments the image to ensure each class is almost homogeneous. Figure 8b shows this classification for each autopolygon. Following this, the global step glues the regions of the local autopolygon classification using IRGS and then completes the full scene classification with arbitrary class labels. Here, different number of arbitrary classes are segmented for the ice-water classification and lake ice type classification.
(1) Ice-water classification: The global step glues the regions into eight classes across the entire scene. Each of the eight classes is considered to be homogeneous and contains only water or only ice. An example of the full-scene “glocal” classification is presented in Figure 9a.
(2) Lake ice type classification: The global step glues the regions into four distinct classes across the whole scene. Each of the four classes is considered as one of the WMO standard thickness-based ice types.
The last step is to manually label the classes as ice types or water based on visual interpretation of SAR imagery. A labelled ice-water classification of the example scene is shown in Figure 9b.
Experimentation was accomplished to ensure the parameters of “glocal” classification (10 × 10 grid, five classes for local, four or eight classes for global) used in the study performed well for the 26 tested scenes. To over segment the most homogenous regions, best ice-water classification results are obtained when eight classes are segmented. The number of classes that are higher than eight does not provide more homogeneous segmentation results. For ice type classification, only four classes are segmented because it is difficult to visually label different ice types. The performance of the algorithm was not sensitive to the minor adjustment of grid size and number of classes for local step.
4.2. Dual-Pol vs. Single-Pol
The advantage of utilizing dual polarization as compared to single polarization for ice observation is evident particularly for ice-water classification. One of the main challenges in discriminating open water from ice is the wind-affected water in co-polarized images. Wind-roughened open water has similar backscatter to ice in a single co-polarized image particularly at near range, whereas cross-polarization is less sensitive to wind effects and it can be useful for ice-water discrimination [40]. However, there is limited ice-water contrast in cross-polarized backscatter because of the relatively low signal-to-noise ratio [26]. Therefore, a combined use of co- and cross-polarized data should improve the potential for ice-water classification. To test the advantages of using the dual-polarization (HH+HV) opposed to single HH polarization, “glocal” IRGS ice-water classification was also performed on only HH-polarized images.
4.3. Accuracy Assessment
Classification results were assessed against the CIS image analysis charts. The charts are manually drawn directly from the same RADARSAT-2 scenes that were used in the study on the same date by trained ice analysts at the CIS. They are currently the most reliable reference data available for the ice cover over the Great Lakes. However, the quantified image analysis charts contain uncertainty from the subjectivity of visual interpretation by ice analysts and its coarse representation [8,20]. This study assumes that the CIS image analysis charts represent the “true” lake ice conditions.
For ice-water classification, the absolute difference between the charts and classification results was used as the classification error. Image analysis charts that were color coded in CT were reclassified into lake ice and open water using a total ice concentration threshold of 10%. This is the lowest ice concentration identified by ice analysts. Polygons with an ice concentration smaller than 10% were reclassified as open water, otherwise they were considered as ice. For each scene, open water and lake ice correspondence as well as the overall accuracy were obtained. Since image analysis charts are region-based products that have greater level of generalization than our pixel-based classification, per-pixel accuracy assessment was also conducted using 400 randomly selected sample points per scene labelled based on visual interpretation of SAR imagery. To provide an insight on how our results compare directly to the total ice concentration in the egg codes, we also provided an example for a polygon-based comparison for one of the scenes (1 April 2014).
For ice type classification, the image analysis charts that were color coded in SD were used for visual comparison. The ice type classification results were not quantitatively assessed because image analysis charts are coarse and do not contain homogeneous ice type polygons. The lake ice types in the image analysis charts are based on stage of development, and each category contains a wide range of ice thicknesses (Table 3). Although the CIS provides the stage of development color code, most of the polygons are heterogeneous and contain multiple ice types without identifying the exact locations of the different ice types. In most cases, multiple ice types are mixed together in the ice analysis polygons and small features are not included. Therefore, it is visually difficult to recognize different ice types from the SAR imagery without ancillary data.
5. Results and Discussion
5.1. Overall Results
The semi-automated “glocal” IRGS classification was tested on 26 ScanSAR Wide RADARSAT-2 scenes and the results were compared against the CIS image analysis charts. For ice-water classification, only 12 scenes were included because Lake Erie was fully ice covered for the remaining 14 scenes (Table 2).
Figure 10 shows an example of the validation process for both ice-water and ice type classification for the 19 January scene. The HH and HV images are shown in Figure 9a,b. The ice-water classification result (Figure 10e) was compared with the binary image analysis chart (Figure 10d) that was reclassified from the original image analysis chart color coded in CT (Figure 10c). To perform a quantitative accuracy assessment, error maps based on pixel-by-pixel differences between the reclassified image analysis charts and “glocal” IRGS results were generated (Figure 10f). The lake ice type classification result (Figure 10h) was visually compared with the image analysis chart color coded in SD (Figure 10g).
Overall, there is generally a good agreement between the image analysis charts and our ice-water classification results. The average overall accuracy of the ice-water classification is 85.1% and the highest overall accuracy reaches 93.8% (Table 4). Most of the errors come from misclassifying ice as open water. Although the HH backscatter for open water is highly dependent on incidence angle as well as wind speed and directions [20], the “glocal” IRGS algorithm can provide a good ice-water discrimination (overall accuracy > 85%) in most conditions. The random pixel sampling shows an overall accuracy of 90.4%. Examples of different cases are analyzed in Section 5.2.1.
For comparison between classification using single-pol and dual-pol, the results showed that there is generally a slight improvement of using dual-pol rather than single HH polarization (Figure 11). When compared with the image analysis charts (pixel-by-pixel difference), the average overall accuracy using single-pol for 12 scenes is 83.4%, which is around 3% lower than the accuracy for dual-pol. It is worth noting that for scenes that showed little difference (<5%) between using single-pol and dual-pol images, this difference can be ignored because some inconsistencies can be attributed to the coarse spatial resolution of the image analysis charts. The inclusion of HV polarization can improve the ice-water classification accuracy, especially at near range where wind-roughed open water tends to be as bright as lake ice (1/15/2014 in Figure 12a, 1/18/2014, 3/28/2014, and 4/4/2014). For scenes with a good ice-water contrast in the HH polarization (1/12/2014, 1/14/2014, 1/19/2014, and 3/25/2014); however, the contribution of the HV polarization is often negligible. Overall, introducing HV polarization slightly improved the ice-water classification. Example of scenes for comparison will be discussed in Section 5.2.2.
For ice type classification, visual comparison shows that “glocal” IRGS algorithm can generally identify different ice types with single-pol and dual-pol imagery, but only when the surface conditions are different for different ice types. New lake ice is often confused with open water due to their similar low backscatter range. In most cases, thick lake ice and very thick lake ice appear to be similar in the SAR imagery, so that they were not discriminated from each other in most cases. Therefore, the algorithm has limited capabilities classifying different ice types. Specific scenes are analyzed in Section 5.2.3.
The total time for ice classification of Lake Erie in a 5000 × 5000 pixels scene is under 10 min, which is much faster than the manual ice charting at the CIS. The CIS ice analyst takes around 2 h to produce a Great Lakes image analysis chart from a large swath SAR image. The local autopolygon classification takes around 1 min, the global IRGS gluing takes 30 s, and the manual labelling takes about 2–5 min, depending on the complexity of the scene.
5.2. Analysis of Specific Cases
The performance of lake ice classification can vary with incidence angle, wind speed, and direction, as well as ice conditions. Here, a sample of scenes exhibiting different ice and open water conditions are analyzed and discussed.
5.2.1. Ice-Water Classification
The scene on 15 January, presented in Figure 12, is a typical case where Lake Erie is located in the near range (incidence angle <35°) with the smallest incidence angle in the east of the image. This scene is acquired during the ice freeze-up and it mainly contains thin lake ice and medium lake ice. A Landsat-8 image acquired one day before is shown in Figure 12f. The seasonally-predominant southwesterly winds push the ice to the northeastern part of the lake. The HH backscatter of open water is highly dependent on the incidence angle with a large increase in backscatter towards smaller incidence angles, as shown in Figure 12a towards the right portion of the image. This is because at near range, open water with a high dielectric constant has a stronger surface scattering of the radar energy than that of ice [4]. With wind-induced surface roughness, open water can have even higher backscatter than the lake ice. Using this ice/water contrast, Leshkevich and Nghiem [4] successfully separated lake ice and open water using a simple threshold of HH backscatter at near range. This scene achieves an overall accuracy of 89.5%. Some errors appear at the ice-water boundaries where the contrast of the edges of open water and ice is less evident.
The scene on 21 February is a case during the spring melt when wet ice and snow or melt ponds on top of the lake ice are present (Figure 13). This scene was acquired when the minimum air temperature was higher than the freezing point during that day (Figure 3). The decaying lake ice in this scene has relatively low backscatter because melting ice and wet snow on the ice surface absorbs most of the radar signal [41]. Since this is a near-range scene, there is generally a good contrast between the bright wind-roughed open water and dark lake ice. However, the bright brash ice with high angular topography in area A of the scene can barely be distinguished from open water at HH polarization, but HV can provide a good contrast. As a result, this scene achieves a high overall accuracy of 96.0%.
The next scene shown in Figure 14 was acquired 12 h after the 21 February scene in Figure 13. This is a scene acquired in the morning around 6 am local time (descending mode) of 22 February, whereas the last scene is acquired the night before at around 6 pm (ascending mode). When compared to the 21 February scene, the ice in this scene appears much brighter because the melted ice refroze as the temperature started to drop at 4 a.m. and reached the freezing point at 6 a.m. As shown in Figure 15, there was a significant melting episode before the 21 February scene was acquired as the air temperature for the previous 24 h was greater than 1.5 °C and reached 6.3 °C at 1 a.m. A Landsat-8 image acquired around 6 h after this SAR scene is shown in Figure 14e. Melting ice or melt ponds on the surface of the ice are likely present on the western part of the lake where the signal from the ice underneath is obscured. The low radar return of ice cover makes it difficult to discriminate from open water in the near-range. As shown in Figure 14d, ice in the western part was misclassified as open water and the overall accuracy is 81.0%.
The final classification result for the 1 April scene is shown in Figure 16. This is a simple scene for ice-water discrimination because there is a good backscatter contrast between open water and lake ice in both HH and HV polarizations. Although this scene is acquired during the break-up season where the melting ice weakens the backscatter, open water in the far range scatters away most of the radar signal and appears much darker than the decaying lake ice. This scene achieves a high correspondence of 93.8% with the image analysis chart. Differences between the classification results and image analysis charts are found at the ice-water boundary and some cracks between ice floes. This can be attributed to the coarse resolution of the image analysis charts. Errors also appear at the northeastern part of Lake Erie (circled area in Figure 16d), where some fast ice is misclassified as open water. A polygon-based comparison between the image analysis chart and the IRGS classification result (Figure 16d) is shown in Table 5. For each image analysis polygon in Figure 16c, the difference between the total ice concentration from IRGS result and egg code ice concentration is mostly within 20%. Since the ice concentration in egg codes is a coarse approximation that can be rounded off to 10% or higher, this comparison showed a good agreement between the image analysis chart and IRGS result.
Of the 12 scenes, the scene on 4 April is a difficult scene during spring melt (Figure 17). The ice in this scene is mainly very thick lake ice (>70 cm) mixed with 20% to 30% of thick lake ice (30–70 cm). Since this scene is acquired during the melt season and the melting lake ice has a medium grey tone backscatter, which results in a very low contrast with open water. Some open water areas were misclassified as lake ice, but the overall accuracy achieved 87.0%. The algorithm also identified cracks in the northeastern part of the lake that were not delineated in the image analysis chart.
5.2.2. Dual-Pol vs. Single-Pol
The advantage of using dual-pol as opposed to single-pol images is more evident for scenes acquired at near range. As mentioned earlier in Section 5.2.1, the scene on 15 January is a near-range scene in which wind-roughed open water can appear just as bright as lake ice at HH polarization (area A in Figure 12a). Therefore, using only a HH image cannot discriminate some of the rougher ice types from open water (Figure 12e). However, HV polarization (Figure 12b) is less sensitive to incidence angle with open water appearing darker than the ice in area A. This provides a better backscatter contrast at the ice-water boundary. As shown in Figure 12d, the inclusion of both HH and HV polarizations in the algorithm produced a generally better ice-water classification result than using single polarization alone.
Most of the scenes analyzed showed that classification while using single-pol or dual-pol results in similar classification accuracy. For example, the scene of 1 April shown in Figure 16 is a case when using dual-pol is slightly better than using HH-pol only. Although the dual-pol result (Figure 16d) shows a better correspondence with the image analysis chart (Figure 16c), the result of using single HH-pol (Figure 16e) can identify more small cracks between ice floes, which were not delineated by the ice analyst.
5.2.3. Ice Type Classification
The lake ice type classification result for the 14 January scene is shown in Figure 18. There are three ice types including thin lake ice, medium lake ice, and new lake ice in the scene. The classified ice types (Figure 18d) have much different distribution as compared to the image analysis chart (Figure 18c). Some of the inconsistencies do not necessarily mean the results are erroneous because the ice expert at the CIS does not take into account small features in the image. Moreover, many of the image analysis polygons are not homogenous. They contain more than one ice type, as shown in the egg code (Figure 18c). New lake ice is misclassified as open water because its smooth surface results in similar low radar return as calm open water (area C in Figure 18c). Overall, most of the thin and medium lake ice is correctly discriminated from open water.
The scene of 21 March is a complicated scene that contains various ice types (Figure 19). The ice thickness in this scene ranges from less than 5 cm to more than 70 cm. Generally, the algorithm accurately identified new lake ice, medium lake ice, and very thick lake ice in the east part of the lake. However, thick lake ice cannot be differentiated from very thick lake ice due to their similar backscatter intensities.
5.3. Classification Errors
Lack of ground truth data is one of the main challenges in evaluating ice classification algorithms [27]. The coarse representation of image analysis charts imposes limitations in the validation process. The resolution of image analysis charts is significantly coarser than our pixel-based classification results. In order for clients to easily read the charts, ice conditions in image analysis charts are expressed for large polygons that are at least tens of square kilometers in size. Furthermore, since the image analysis charts are produced near real-time on almost a daily basis, SAR image analyses are performed quickly by ice analysts and they do not take into account small features such as cracks between ice floes. Therefore, an absolute quantitative comparison between image analysis charts and classification results is not possible.
To compare our pixel-based ice-water classification results with the region-based image analysis charts, we reclassified the charts into ice and open water using an ice concentration threshold of 10%. Here, polygons with total ice concentration larger than 10% are regarded as lake ice, otherwise are reclassified as open water. This means that even regions with 20% of ice are considered fully ice covered, which explains why most errors come from misclassifying ice as water (Table 4). This subjective assumption contributes to some of the discrepancy and reduces the accuracy. Considering the limitations of the validation procedure, the classification accuracy is likely to be more reliable than the calculated pixel-by-pixel differences with the image analysis charts. Therefore, we have also conducted the per-pixel validation using random sample points from visual interpretation of SAR imagery and the overall accuracy reached 90%.
Although image analysis charts are produced by ice experts, they may contain some human-made errors. The total concentration, number of classes, and ice types are assigned subjectively from visual interpretation. A quantitative assessment of the CIS visual analysis that was done by [20] has indicated the existence of anomalies in image analysis charts. To ensure navigation safety, ice analysts are generally biased toward overestimation of ice concentration and assigning thicker ice types. Additionally, the interpretation of SAR images may vary between ice analysts depending on their level of expertise. Some analysts may include more details. A study by [8] showed that manually drawn ice charts by two different ice analysts at the Norwegian Ice Service for the same scene can be inconsistent to some degree. Even given the same polygon, significant differences of the ice concentration estimations were also found between different ice analysts at the Finnish Meteorological Institute [42].
5.4. Limitations
5.4.1. Ice-Water Classification
There are two limitations of the “glocal” IRGS ice-water classification used in this study. One limitation is the difficulty in discriminating calm open water from new lake ice (Figure 18). New lake ice is a thin layer of ice that forms at the beginning of the freeze-up period. It generally has a smooth surface/ice-water interface and high optical depth allowing for light to transmit to the subsurface water, which makes it visually transparent [43]. Therefore, new lake ice can be challenging to recognize from open water in either optical or SAR imagery. Ice experts at CIS often have to rely on weather conditions to determine the presence of new lake ice. Although a robust ice-water discrimination is desirable, the very thin new lake ice is less of an issue from an operational perspective [27].
The presence of water on ice due to rainfall or melt is another challenge for ice-water classification. Melting snow on ice can absorb or melt ponds reflect away most of the radar signal resulting in similar low backscatter to open water. Melt conditions are also a challenging situation for ice analysts interpreting SAR images.
5.4.2. Ice Type Classification
The correlation between backscatter and different ice types is ambiguous [18,19]. Each ice type (stage of development) can depict a large variability of backscatter that overlaps each other. Depending on the roughness at the surface and the ice-water interface, the same ice type can display very high backscatter with heavy ridging or low backscatter with a smooth surface. As shown in Figure 20c, the CIS ice analyst provided a ridging description of the same type of ice. As they get to thicker ice types (thick and very thick lake ice), ice analysts often have to rely on freezing degree days, as well as history and weather of the last few days to determine the stage of development. Therefore, it is difficult in practice to identify different ice types and estimate ice thickness based only on SAR backscatter. For further improvement, additional image characteristics, such as texture features, could be included [10,12,23,42].
6. Conclusions
The semi-automated “glocal” IRGS classification was tested on 26 dual polarized RADARSAT-2 imagery over Lake Erie. This is hierarchical region-based approach that divides the image into small polygons and minimizes the effect of incidence angle. This unsupervised classification method identifies homogeneous regions with arbitrary classes followed by manual labeling. Validation of the classification was done via pixel-by-pixel comparison with the CIS image analysis charts. The algorithm achieved an overall accuracy of 90.4% for ice-water classification. Analysis of various case studies indicates that the “glocal” IRGS algorithm can provide a reliable ice-water classification while using dual polarized images. The algorithm has difficulty in distinguishing calm open water from new lake ice and decaying ice. However, the misidentification of new lake ice is not a significant drawback for operational purposes. For lake ice type classification, most thin ice types were effectively identified but thick and very thick lake ice were often confused due to the ambiguous relation between backscatter and ice types. GLCM texture features could be included for further improvement. Overall, our “glocal” IRGS classification results are close to visual interpretation by ice analysts and would have expected to be closer if they could draw ice charts at a more detailed level. The testing of dual- and single-pol images demonstrated the slight improvement of ice-water discrimination utilizing dual polarized data as opposed to single polarization, particularly for near-range scenes.
Although the “glocal” IRGS algorithm needs manual labelling, the whole classification process takes less than 10 min for each scene, which is likely to be operationally useful. The algorithm can be fully automated by implementing automatic labelling while using trained models, as demonstrated by [23] for application to sea ice mapping.
Author Contributions
J.W. wrote the article; C.R.D. and D.A.C. conceived and designed the methodology; V.P. provided help with validation; S.E.L.H. provided comments and suggestions on the article.
Funding
This research was supported by a grant from the Canadian Space Agency and the APC funded by Natural Sciences and Engineering Research Council of Canada (NSERC) grant number RGPIN-2017-05049.
Acknowledgments
The authors would like to thank Canadian Ice Service of Environment and Climate Canada for providing the Great Lakes image analysis chart s. The MAGIC software was developed by the Vision and Image Processing lab (D. Clausi’s group) at the University of Waterloo. This project was supported by a RADARSAT-2 Science and Operational Applications Research (SOAR) program grant from the Canadian Space Agency to C. Duguay.
Conflicts of Interest
The authors declare no conflict of interest.
References
- Brown, L.C.; Duguay, C.R. The response and role of ice cover in lake-climate interactions. Prog. Phys. Geogr. 2010, 34, 671–704. [Google Scholar] [CrossRef]
- Duguay, C.R.; Prowse, T.D.; Bonsal, B.R.; Brown, R.D.; Lacroix, M.P.; Menard, P. Recent trends in Canadian lake ice cover. Hydrol. Process. 2006, 20, 781–801. [Google Scholar] [CrossRef]
- Livingstone, D.M.; Adrian, R. Modeling the duration of intermittent ice cover on a lake for climate-change studies. Limnol. Oceanogr. 2009, 54, 1709–1722. [Google Scholar] [CrossRef] [Green Version]
- Leshkevich, G.; Nghiem, S.V. Great Lakes ice classification using satellite C-band SAR multi-polarization data. J. Great Lakes Res. 2013, 39, 55–64. [Google Scholar] [CrossRef]
- Bertoia, C.; Manore, M.; Andersen, H.S.; O’Connors, C.; Hansen, K.Q.; Evanego, C. Synthetic Aperture Radar for Operational Ice Observation and Analysis at the US, Canadian, and Danish National Ice Centers. In Synthetic Aperture Radar Marine User’s Manual; Jackson, C.R., Apel, J.R., Eds.; National Oceanic and Atmospheric Administration: Washington, DC, USA, 2004; Volume 574, pp. 417–442. [Google Scholar]
- Zakhvatkina, N.; Korosov, A.; Muckenhuber, S.; Sandven, S.; Babiker, M. Operational algorithm for ice-water classification on dual-polarized RADARSAT-2 images. Cryosphere 2017, 11, 33–46. [Google Scholar] [CrossRef]
- Ramsay, B.; Flett, D.; Andersen, H.S.; Gill, R.; Nghiem, S.; Bertoia, C. Preparation for the operational use of RADARSAT-2 for ice monitoring. Can. J. Remote Sens. 2004, 30, 415–423. [Google Scholar] [CrossRef]
- Moen, M.A.N.; Doulgeris, A.P.; Anfinsen, S.N.; Renner, A.H.H.; Hughes, N.; Gerland, S.; Eltoft, T. Comparison of feature based segmentation of full polarimetric SAR satellite sea ice images with manually drawn ice charts. Cryosphere 2013, 7, 1693–1705. [Google Scholar] [CrossRef] [Green Version]
- Kwok, R.; Rignot, E.; Holt, B. Identification of sea ice types in spaceborne synthetic aperture radar data. J. Geophys. Res. 1992, 97, 2391–2402. [Google Scholar] [CrossRef] [Green Version]
- Zakhvatkina, N.Y.; Alexandrov, V.Y.; Johannessen, O.M.; Sandvenand, S.; Frolov, I.Y. Classification of sea ice types in ENVISAT synthetic aperture radar images. IEEE Trans. Geosci. Remote Sens. 2013, 51, 2587–2600. [Google Scholar] [CrossRef]
- Hara, Y.; Atkins, R.G.; Shin, R.T.; Kong, J.A.; Yueh, S.H.; Kwok, R. Application of neural networks for sea ice classification in polarimetric SAR images. IEEE Trans. Geosci. Remote Sens. 1995, 33, 740–748. [Google Scholar] [CrossRef]
- Wang, L.; Scott, K.A.; Xu, L.; Clausi, D.A. Sea Ice Concentration Estimation during Melt from Dual-Pol SAR Scenes Using Deep Convolutional Neural Networks: A Case Study. IEEE Trans. Geosci. Remote Sens. 2016, 54, 4524–4533. [Google Scholar] [CrossRef]
- Soh, L.K.; Tsatsoulis, C. Texture analysis of sar sea ice imagery using gray level co-occurrence matrices. IEEE Trans. Geosci. Remote Sens. 1999, 37, 780–795. [Google Scholar] [CrossRef]
- Soh, L.; Tsatsoulis, C.; Gineris, D.; Bertoia, C. ARKTOS: An intelligent system for SAR sea ice image classification. IEEE Trans. Geosci. Remote Sens. 2004, 42, 229–248. [Google Scholar] [CrossRef]
- Sobiech, J.; Dierking, W. Observing lake- and river-ice decay with SAR: Advantages and limitations of the unsupervised k-means classification approach. Ann. Glaciol. 2013, 54, 65–72. [Google Scholar] [CrossRef]
- Haarpaintner, J.; Solbø, S. Automatic Ice-Ocean Discrimination in SAR Imagery; NORUT Northern Research Institute: Tromsø, Norway, 2007. [Google Scholar]
- Deng, H.; Clausi, D.A. Unsupervised Segmentation of Synthetic Aperture Radar Sea Ice Imagery Using a Novel Markov Random Field Model. IEEE Geosci. Remote Sens. Lett. 2005, 43, 528–538. [Google Scholar] [CrossRef]
- Sandven, S.; Johannessen, O.M.; Miles, M.W.; Pettersson, L.H.; Kloster, K. Barents Sea seasonal ice zone features and processes from ERS 1 synthetic aperture radar: Seasonal Ice Zone Experiment 1992. J. Geophys. Res. 1999. [Google Scholar] [CrossRef]
- Dierking, W. Mapping of different sea ice regimes using images from sentinel-1 and ALOS synthetic aperture radar. IEEE Trans. Geosci. Remote Sens. 2010, 48, 1045–1058. [Google Scholar] [CrossRef]
- Shokr, M. Compilation of a radar backscatter database of sea ice types and open water using operational analysis of heterogeneous ice regimes. Can. J. Remote Sens. 2009, 35, 369–384. [Google Scholar] [CrossRef]
- Shokr, M.E.; Jessup, R.; Ramsay, B. An interactive algorithm for derivation of sea ice classifications and concentrations from SAR images. Can. J. Remote Sens. 1999, 25, 70–79. [Google Scholar] [CrossRef]
- Karvonen, J.; Cheng, B.; Vihma, T.; Arkett, M.; Carrieres, T. The Cryosphere A method for sea ice thickness and concentration analysis based on SAR data and a thermodynamic model. Cryosphere 2012, 6, 1507–1526. [Google Scholar] [CrossRef]
- Leigh, S.; Wang, Z.; Clausi, D.A. Automated ice-water classification using dual polarization SAR satellite imagery. IEEE Trans. Geosci. Remote Sens. 2014, 52, 5529–5539. [Google Scholar] [CrossRef]
- Gill, R.S. SAR ice classification using fuzzy screening method. In Proceedings of the Workshop on Applications of SAR Polarimetry and Polarimetric Interferometry (POLinSAR), Frascati, Italy, 14–16 January 2003. [Google Scholar]
- Karvonen, J.; Similä, M.; Mäkynen, M. Open water detection from Baltic Sea ice. IEEE Geosci. Remote Sens. Lett. 2005, 2, 275–279. [Google Scholar] [CrossRef]
- Geldsetzer, T.; Van Der Sanden, J.; Brisco, B. Monitoring lake ice during spring melt using RADARSAT-2 SAR. Can. J. Remote Sens. 2010, 36, 391–400. [Google Scholar] [CrossRef]
- Ochilov, S.; Clausi, D.A. Operational SAR sea-ice image classification. IEEE Trans. Geosci. Remote Sens. 2012, 50, 4397–4408. [Google Scholar] [CrossRef]
- Yu, Q.; Clausi, D.A. IRGS: Image segmentation using edge penalties and region growing. IEEE Trans. Pattern Anal. Mach. Intell. 2008, 30, 2126–2139. [Google Scholar] [CrossRef]
- Surdu, C.M.; Duguay, C.R.; Brown, L.C.; Fernández Prieto, D. Response of ice cover on shallow lakes of the North Slope of Alaska to contemporary climate conditions (1950–2011): Radar remote-sensing and numerical modeling data analysis. Cryosphere 2014, 8, 167–180. [Google Scholar] [CrossRef] [Green Version]
- Qin, A.K.; Clausi, D.A. Multivariate image segmentation using semantic region growing with adaptive edge penalty. IEEE Trans. Image Process. 2010, 19, 2157–2170. [Google Scholar] [CrossRef]
- Williams, G.P. Correlating freeze-up and break-up with weather conditions. Can. Geotech. J. 1965, 2, 313–326. [Google Scholar] [CrossRef]
- Jeffries, M.O.; Morris, K. Some aspects of ice phenology on ponds in central Alaska, USA. Ann. Glaciol. 2007, 46, 397–403. [Google Scholar] [CrossRef]
- Cordeira, J.M.; Laird, N.F. The influence of ice cover on two lake-effect snow events over Lake Erie. Mon. Weather Rev. 2008, 136, 2747–2763. [Google Scholar] [CrossRef]
- NOAA/GLERL NOAA Great Lakes Environmental Research Laboratory—Historical Ice Cover. Available online: https://www.glerl.noaa.gov/data/ice/#historical (accessed on 13 September 2018).
- CIS. MANICE: Manual of Standard Procedures for Observing and Reporting Ice Conditions, 9th ed.; Canadian Ice Service (CIS), Meteorological Service of Canada: Ottawa, ON, Canada, 2005; ISBN 0660628589.
- CIS Interpreting Ice Charts—World Meteorological Organization Colour Code. Available online: http://ec.gc.ca/glaces-ice/default.asp?lang=En&n=D5F7EA14-1&offset=2&toc=show (accessed on 13 September 2018).
- Clausi, D.A.; Qin, A.K.; Chowdhury, M.S.; Yu, P.; Maillard, P. MAGIC: MAp-Guided Ice Classification System. Can. J. Remote Sens. 2010, 36, 13–25. [Google Scholar] [CrossRef]
- Yu, Q. Automated SAR Sea Ice Interpretation; University of Waterloo: Waterloo, ON, Canada, 2006. [Google Scholar]
- Vincent, L.; Soille, P. Watersheds in digital spaces: An efficient algorithm based on immersion simulations. IEEE Trans. Pattern Anal. Mach. Intell. 1991, 13, 583–598. [Google Scholar] [CrossRef]
- Duguay, C.R.; Bernier, M.; Gauthier, Y.; Kouraev, A. Remote sensing of lake and river ice. In Remote Sensing of the Cryosphere; Tedesco., M., Ed.; John Wiley & Sons, Ltd.: New York, NY, USA, 2015; pp. 273–306. [Google Scholar]
- Duguay, C.R.; Pultz, T.J.; Lafleur, P.M.; Drai, D. RADARSAT backscatter characteristics of ice growing on shallow sub-Arctic lakes, Churchill, Manitoba, Canada. Hydrol. Process. 2002, 16, 1631–1644. [Google Scholar] [CrossRef]
- Karvonen, J.; Vainio, J.; Marnela, M.; Eriksson, P.; Niskanen, T. A Comparison Between High-Resolution EO-Based and Ice Analyst-Assigned Sea Ice Concentrations. IEEE J. Sel. Top. Appl. Earth Obs. Remote Sens. 2015, 8, 1799–1807. [Google Scholar]
- Jeffries, M.O.; Morris, K. Instantaneous daytime conductive heat flow through snow on lake ice in Alaska. Hydrol. Process. 2006, 20, 803–815. [Google Scholar] [CrossRef]
Figure 1.
Bathymetry of Lake Erie. Lake depth contours are in meters. The locations of the New Glasgow and ERIEAU (AUT) weather stations are shown by blue dots.
Figure 1.
Bathymetry of Lake Erie. Lake depth contours are in meters. The locations of the New Glasgow and ERIEAU (AUT) weather stations are shown by blue dots.
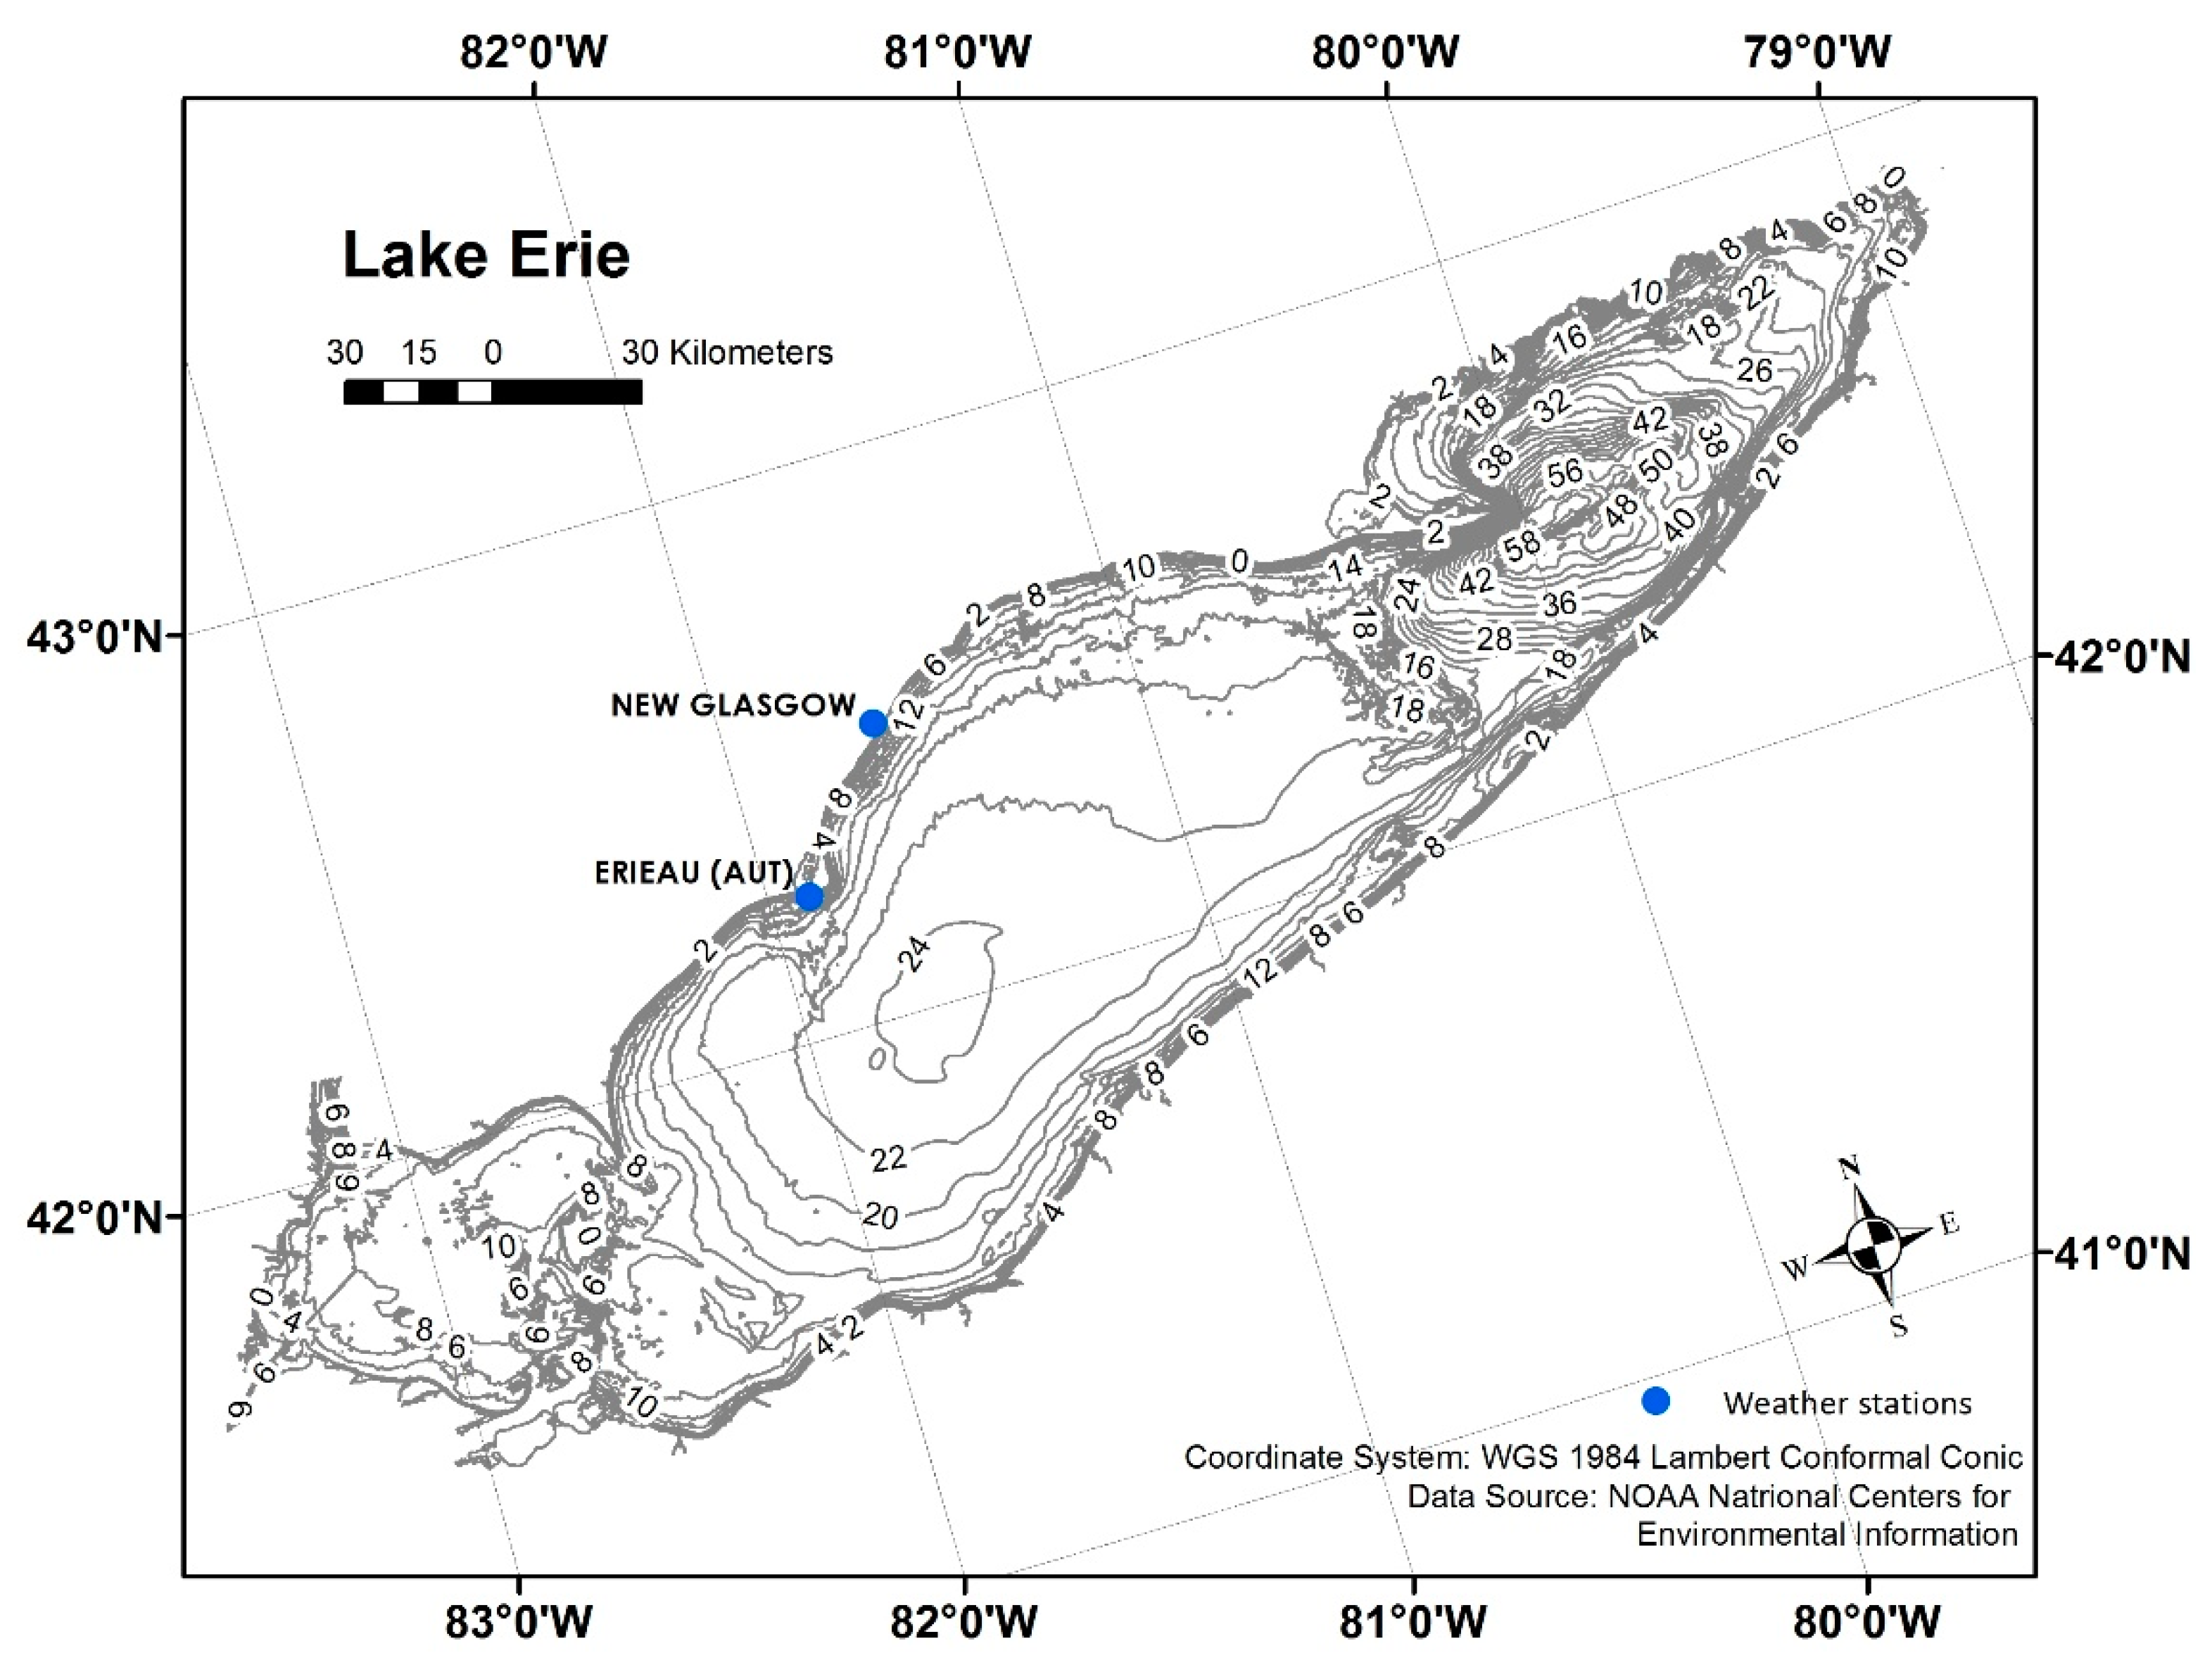
Figure 2.
Lake Erie min (grey) and max (green) daily air temperature during the winter 2013–2014 measured at the New Glasgow weather station (42°30′52.1″N 81°38′10.1″W). Hourly air temperature of the RADARSAT-2 acquisitions measured at the ERIEAU (AUT) weather station (42°15′00.4″N, 81°54′00.5″W) is shown as yellow and blue dots for ascending (6 p.m.) and descending (6 a.m.) scene, respectively.

Figure 3.
Map of Lake Erie. Coverage of the 26 RADARSAT-2 scenes is shown in white.

Figure 4.
RADARSAT-2 SCWA scene acquired on 19 January 2014. (a) HH polarization; (b) HV polarization. RADARSAT-2 Data and Products © MacDonald, Dettwiler and Associates Ltd. (2014)—All Rights Reserved.
Figure 4.
RADARSAT-2 SCWA scene acquired on 19 January 2014. (a) HH polarization; (b) HV polarization. RADARSAT-2 Data and Products © MacDonald, Dettwiler and Associates Ltd. (2014)—All Rights Reserved.

Figure 5.
The World Meteorological Organization (WMO) egg code for every polygon. The top value Ct in the egg code is the total ice concentration in the polygon area. The second line is the partial concentration for each corresponding ice type (stage of development). The third line lists the stage of development of ice from the thickest (So) to thinner ice types (Sd, Se), of which their concentrations are reported in the second line. The fourth line reports the predominant form of ice (floe size) for each corresponding stage of development. All ice concentrations are reported in tenths.

Figure 6.
Canadian Ice Service (CIS) Great Lakes Image analysis chart of 19 January 2014 with (a) WMO total concentration (CT) color code (b) WMO stage of development (SD) color code.
Figure 6.
Canadian Ice Service (CIS) Great Lakes Image analysis chart of 19 January 2014 with (a) WMO total concentration (CT) color code (b) WMO stage of development (SD) color code.

Figure 7.
“Glocal” iterative region growing with semantics (IRGS) classification flowchart.

Figure 8.
Local autopolygon classification of the 19 January 2014 scene. (a) Autopolygon segmentation boundaries in white. (b) IRGS classification of each autopolygon. Five classes are identified in each autopolygon. RADARSAT-2 Data and Products © MacDonald, Dettwiler and Associates Ltd. (2014)—All Rights Reserved.

Figure 9.
(a) “Glocal” IRGS classification (8 classes) of the 19 January 2014 scene. (b) Labelled ice-water classification (ice in yellow, water in blue). RADARSAT-2 Data and Products © MacDonald, Dettwiler and Associates Ltd. (2014)—All Rights Reserved.
Figure 9.
(a) “Glocal” IRGS classification (8 classes) of the 19 January 2014 scene. (b) Labelled ice-water classification (ice in yellow, water in blue). RADARSAT-2 Data and Products © MacDonald, Dettwiler and Associates Ltd. (2014)—All Rights Reserved.

Figure 10.
Validation process of the classification results against the CIS image analysis charts. (a) Original RADARSAT-2 HH-polarized image acquired on 19 January 2014. (b) Original HV-polarized image. (c) Collocated subset of image analysis chart (color-coded in CT) on the same date. (d) Image analysis chart reclassified into lake ice (ice concentration from 10% to 100%) and open water (ice concentration from 0% to 10%). (e) Labelled ice-water classification result. (f) Error map showing the pixel-by-pixel difference between image analysis chart and ice-water classification result: no difference, open water error (open water misclassified as lake ice), and lake ice error (lake ice misclassified as open water). (g) Image analysis chart color-coded in SD. (h) Labelled ice type classification result. RADARSAT-2 Data and Products © MacDonald, Dettwiler and Associates Ltd. (2014)—All Rights Reserved.


Figure 11.
Overall accuracy of “glocal” IRGS ice-water classification using dual-polarization (HH+HV) and single-polarization (HH).
Figure 11.
Overall accuracy of “glocal” IRGS ice-water classification using dual-polarization (HH+HV) and single-polarization (HH).

Figure 12.
(a) Original RADARSAT-2 HH-polarized image acquired on 15 January 2014. (b) Original HV-polarized image. (c) Image analysis chart reclassified into lake ice (ice concentration from 10% to 100%) and open water (ice concentration from 0% to 10%). (d) Labelled ice-water “glocal” IRGS classification using dual-pol images. (e) Labelled ice-water “glocal” IRGS classification using HH polarization. (f) Landsat 8 true color image acquired on 14 January 2014. RADARSAT-2 Data and Products © MacDonald, Dettwiler and Associates Ltd. (2014)—All Rights Reserved.

Figure 13.
(a) Original RADARSAT-2 HH-polarized image acquired on 21 February 2014. (b) Original HV-polarized image. (c) Image analysis chart reclassified into lake ice (ice concentration from 10% to 100%) and open water (ice concentration from 0% to 10%). (d) Labelled ice-water “glocal” IRGS classification using dual-pol images. RADARSAT-2 Data and Products © MacDonald, Dettwiler and Associates Ltd. (2014)—All Rights Reserved.

Figure 14.
(a) Original RADARSAT-2 HH-polarized image acquired on 22 February 2014. (b) Original HV-polarized image. (c) Image analysis chart reclassified into lake ice (ice concentration from 10% to 100%) and open water (ice concentration from 0% to 10%). (d) Labelled ice-water “glocal” IRGS classification using dual-pol images. (e) Landsat 8 true color image acquired at local time 12:17 p.m. on 22 February 2014. RADARSAT-2 Data and Products © MacDonald, Dettwiler and Associates Ltd. (2014)—All Rights Reserved.

Figure 15.
Hourly air temperature from 21 February 00:00 to 22 February 12:00 measured at the ERIEAU (AUT) weather station (42°15′00.4″N, 81°54′00.5″W). Local times of acquisition of the two SAR scenes are identified by red dots.
Figure 15.
Hourly air temperature from 21 February 00:00 to 22 February 12:00 measured at the ERIEAU (AUT) weather station (42°15′00.4″N, 81°54′00.5″W). Local times of acquisition of the two SAR scenes are identified by red dots.

Figure 16.
(a) Original RADARSAT-2 HH-polarized image acquired on 1 April 2014. (b) Original HV-polarized image. (c) Image analysis chart reclassified into lake ice (ice concentration from 10% to 100%) and open water (ice concentration from 0% to 10%). (d) Labelled ice-water “glocal” IRGS classification using dual-pol images. (e) Labelled ice-water “glocal” IRGS classification using HH polarization. RADARSAT-2 Data and Products © MacDonald, Dettwiler and Associates Ltd. (2014)—All Rights Reserved.

Figure 17.
(a) Original RADARSAT-2 HH-polarized image acquired on 4 April 2014. (b) Original HV-polarized image. (c) Image analysis chart reclassified into lake ice (ice concentration from 10% to 100%) and open water (ice concentration from 0% to 10%). (d) Labelled ice-water “glocal” IRGS classification using dual-pol images. RADARSAT-2 Data and Products © MacDonald, Dettwiler and Associates Ltd. (2014)—All Rights Reserved.

Figure 18.
(a) Original RADARSAT-2 HH-polarized image acquired on 14 January 2014. (b) Original HV-polarized image. (c) Image analysis chart color-coded in SD. (d) Labelled “glocal” IRGS classification. RADARSAT-2 Data and Products © MacDonald, Dettwiler and Associates Ltd. (2014)—All Rights Reserved.

Figure 19.
(a) Original RADARSAT-2 HH-polarized image acquired on 21 March 2014. (b) Original HV-polarized image. (c) Image analysis chart color-coded in SD. (d) Labelled “glocal” IRGS classification. RADARSAT-2 Data and Products © MacDonald, Dettwiler and Associates Ltd. (2014)—All Rights Reserved.

Figure 20.
(a) Original RADARSAT-2 HH-polarized image acquired on 8 March 2014. (b) Original HV-polarized image. (c) Requested CIS image analysis chart for Lake Erie. RADARSAT-2 Data and Products © MacDonald, Dettwiler and Associates Ltd. (2014)—All Rights Reserved.
Figure 20.
(a) Original RADARSAT-2 HH-polarized image acquired on 8 March 2014. (b) Original HV-polarized image. (c) Requested CIS image analysis chart for Lake Erie. RADARSAT-2 Data and Products © MacDonald, Dettwiler and Associates Ltd. (2014)—All Rights Reserved.


Table 1.
Seasonal mean air temperature (°C) for winter (DJF), spring (MAM), summer (JJA), and fall (SON) recorded at New Glasgow weather station (42°30′52.062″N, 81°38′10.092″W).
Table 1.
Seasonal mean air temperature (°C) for winter (DJF), spring (MAM), summer (JJA), and fall (SON) recorded at New Glasgow weather station (42°30′52.062″N, 81°38′10.092″W).
| Winter (DJF) | Spring (MAM) | Summer (JJA) | Fall (SON) | Annual Temp | |
|---|---|---|---|---|---|
| 2013 | −1.38 | 6.96 | 19.90 | 10.54 | 8.66 |
| 2014 | −6.36 | 5.33 | 19.44 | 9.91 | 7.46 |
| 2015 | 0.71 | 6.56 | 19.19 | 12.55 | 8.53 |
| 2016 | 0.56 | 7.41 | 20.97 | 13.10 | 10.05 |
| 2017 | −0.22 | 7.73 | 20.31 | 11.78 | 9.46 |
| Mean | 0.64 | 6.80 | 19.96 | 11.58 | 8.83 |
Table 2.
List of synthetic aperture radar (SAR) acquisition dates, time, ascending/descending mode of the RADARSAT-2 scenes used in the study and the incidence angle range for Lake Erie in each scene. The average wind speed across the whole lake within half an hour of the SAR acquisition time that are acquired from the National Oceanic and Atmospheric Administration (NOAA) Great Lakes Coastal Forecasting System (GLCFS) are also provided for the scenes with open water.
| SAR Acquisition Date (M/D/Y) | Ascending (A)/Descending (D) Mode | Acquisition Time (UTC: hh:mm:ss) | Incidence Angle Range for Lake Erie | Average Wind Speed (m/s) |
|---|---|---|---|---|
| 1/11/2014 | A | 23:15:15 | 19.4°–21.3° | 8.53 |
| 1/12/2014 | D | 11:26:48 | 29.5°–49.4° | 8.26 |
| 1/14/2014 | A | 23:27:48 | 32.6°–49.4° | 12.01 |
| 1/15/2014 | D | 11:40:02 | 19.6°–35.1° | 6.64 |
| 1/18/2014 | A | 23:11:16 | 19.3°–35.8° | 15.28 |
| 1/19/2014 | D | 11:22:45 | 34.4°–49.4° | 9.84 |
| 1/22/2014 | D | 11:35:00 | 19.9°–35.1° | - |
| 1/28/2014 | A | 23:19:24 | 22.8°–45.5° | - |
| 1/29/2014 | D | 11:31:04 | 24.8°–44.9° | - |
| 2/4/2014 | A | 23:15:17 | 19.4°–40.7° | - |
| 2/12/2014 | D | 11:22:49 | 34.3°–49.4° | - |
| 2/14/2014 | A | 23:23:34 | 27.5°–49.3° | - |
| 2/21/2014 | A | 23:19:22 | 22.9°–45.5° | 11.63 |
| 2/22/2014 | D | 11:31:03 | 24.8°–45.0° | 6.69 |
| 2/25/2014 | D | 11:44:06 | 19.5°–30.3° | - |
| 3/1/2014 | D | 11:26:47 | 29.6°–49.4° | - |
| 3/3/2014 | A | 23:27:43 | 32.5°–49.4° | - |
| 3/4/2014 | D | 11:40:00 | 19.6°–35.3° | - |
| 3/7/2014 | A | 23:11:06 | 19.3°–35.8° | - |
| 3/18/2014 | D | 11:31:03 | 24.8°–44.9° | - |
| 3/20/2014 | A | 23:31:55 | 37.4°–49.4° | - |
| 3/21/2014 | D | 11:44:13 | 19.5°–30.3° | - |
| 3/25/2014 | D | 11:26:48 | 29.5°–49.4° | 9.80 |
| 3/28/2014 | D | 11:40:15 | 19.6°–35.3° | 1.95 |
| 4/1/2014 | D | 11:22:38 | 34.3°–49.4° | 5.44 |
| 4/4/2014 | D | 11:35:02 | 19.9°–38.9° | 10.88 |
Shaded dates are scenes when Lake Erie is fully ice covered.
Table 3.
Description of lake-ice stages of development.
| Stage of Development | Thickness (cm) | Ice-Type Code |
|---|---|---|
| New lake ice | <5 | 1 |
| Thin lake ice | 5–15 | 4 |
| Medium lake ice | 15–30 | 5 |
| Thick lake ice | 30–70 | 7 |
| Very thick lake ice | >70 | 1 |
Table 4.
Accuracy assessment of ice-water classification for 12 scenes.
| SAR Acquisition Date (M/D/Y) | Pixel-by-Pixel Difference with Image Analysis Charts | Pixel-by-Pixel Difference Against Original SAR Images (400 Randomly Selected Pixels per Scene) | ||||
|---|---|---|---|---|---|---|
| Overall Accuracy | Open Water Error | Ice Error | Overall Accuracy | Open Water Error | Ice Error | |
| 1/11/2014 | 84.8% | 0.6% | 14.5% | 91.5% | 1.0% | 7.5% |
| 1/12/2014 | 84.1% | 7.6% | 8.3% | 87.0% | 6.5% | 6.5% |
| 1/14/2014 | 88.0% | 0.5% | 11.5% | 94.0% | 1.5% | 4.5% |
| 1/15/2014 | 87.8% | 1.8% | 10.4% | 90.8% | 4.0% | 5.2% |
| 1/18/2014 | 84.9% | 0.9% | 14.9% | 92.3% | 1.0% | 6.7% |
| 1/19/2014 | 85.2% | 0.1% | 14.7% | 88.3% | 0.0% | 11.7% |
| 2/21/2014 | 91.7% | 0.9% | 7.4% | 96.5% | 0.0% | 3.5% |
| 2/22/2014 | 78.9% | 0.1% | 21.0% | 81.8% | 0.0% | 18.2% |
| 3/25/2014 | 88.7% | 0.7% | 10.6% | 92.0% | 1.0% | 7.0% |
| 3/28/2014 | 89.1% | 2.8% | 8.1% | 90.0% | 2.5% | 7.5% |
| 4/1/2014 | 93.8% | 0.6% | 5.6% | 94.5% | 2.0% | 3.5% |
| 4/4/2014 | 86.2% | 5.7% | 8.1% | 86.0% | 5.8% | 8.2% |
| Average | 86.9% | 1.9% | 11.3% | 90.4% | 2.1% | 7.5% |
Table 5.
Comparison between total concentration (CT) from egg code and IRGS classification result for each image analysis polygon in Figure 16c.
Table 5.
Comparison between total concentration (CT) from egg code and IRGS classification result for each image analysis polygon in Figure 16c.
| Polygon ID | Egg Code CT (%) | IRGS CT (%) |
|---|---|---|
| A | 0 | 2.54 |
| B | 80 | 79.77 |
| C | 70 | 68.43 |
| D | 90 | 95.69 |
| E | 100 | 87.13 |
| F | 100 | 74.67 |
| G | 100 | 95.51 |
| H | 100 | 73.96 |
| I | 80 | 68.39 |
© 2018 by the authors. Licensee MDPI, Basel, Switzerland. This article is an open access article distributed under the terms and conditions of the Creative Commons Attribution (CC BY) license (http://creativecommons.org/licenses/by/4.0/).
Share and Cite
MDPI and ACS Style
Wang, J.; Duguay, C.R.; Clausi, D.A.; Pinard, V.; Howell, S.E.L. Semi-Automated Classification of Lake Ice Cover Using Dual Polarization RADARSAT-2 Imagery. Remote Sens. 2018, 10, 1727. https://doi.org/10.3390/rs10111727
AMA Style
Wang J, Duguay CR, Clausi DA, Pinard V, Howell SEL. Semi-Automated Classification of Lake Ice Cover Using Dual Polarization RADARSAT-2 Imagery. Remote Sensing. 2018; 10(11):1727. https://doi.org/10.3390/rs10111727
Chicago/Turabian StyleWang, Junqian, Claude R. Duguay, David A. Clausi, Véronique Pinard, and Stephen E. L. Howell. 2018. "Semi-Automated Classification of Lake Ice Cover Using Dual Polarization RADARSAT-2 Imagery" Remote Sensing 10, no. 11: 1727. https://doi.org/10.3390/rs10111727
Note that from the first issue of 2016, this journal uses article numbers instead of page numbers. See further details here.