Article

Segment-Based Spatial Analysis for Assessing Road Infrastructure Performance Using Monitoring Observations and Remote Sensing Data

1
Australasian Joint Research Centre for Building Information Modelling, School of Design and the Built Environment, Curtin University, Perth 6845, Australia
2
Office of Research and Development, Curtin University, Perth 6845, Australia
3
School of Design and the Built Environment, Curtin University, Perth 6845, Australia
4
Heavy Vehicle Services, Main Roads Western Australia, Perth 6986, Australia
5
Public Transportation Authority of Western Australia, P.O. Box 8125, Perth Business Centre, Perth 6849, Australia
6
Fremantle Ports Western Australia, Perth 6160, Australia
7
Head Office—Don Aitken Centre, Main Roads Western Australia, Perth 6004, Australia
8
School of Civil Engineering, Tongji University, Shanghai 200092, China
*
Author to whom correspondence should be addressed.
Remote Sens. 2018, 10(11), 1696; https://doi.org/10.3390/rs10111696
Submission received: 3 September 2018 / Revised: 15 October 2018 / Accepted: 25 October 2018 / Published: 26 October 2018

Abstract

:
Road infrastructure is important to the well-being and economic health of all nations. The performance of road pavement infrastructure is sophisticated and affected by numerous factors and varies greatly across different roads. Large scale spatial analysis for assessing road infrastructure performance is increasingly required for road management, therefore multi-source factors, including satellite remotely sensed climate and environmental data, and ground-monitored vehicles observations, are collected as explanatory variables. Different from the traditional point or area based geospatial attributes, the performance of pavement infrastructure is the line segment based spatial data. Thus, a segment-based spatial stratified heterogeneity method is utilized to explore the comprehensive impacts of vehicles, climate, properties of road and socioeconomic conditions on pavement infrastructure performance. Segment-based optimal discretization is applied on discretizing segment-based pavement data, and a segment-based geographical detector is utilized to assess the spatial impacts of variables and their interactions. Results show that the segment-based methods can more reasonably and accurately describe the characteristics of line segment based spatial data and assess the spatial associations. The two major categories of factors associated with pavement damage are the variables of traffic vehicles and heavy vehicles in particular, and climate and environmental conditions. Meanwhile, the interactions between the explanatory variables in these two categories have much more influence than the single explanatory variables, and the interactions can explain more than half of the pavement damage. This study highlights the great potential of remote sensing based large scale spatial analysis of road infrastructures. The approach in this study provides new ideas for spatial analysis for segmented geographical data. The findings indicate that the quantified comprehensive impacts of variables are practical for wise decision-making for road design, construction and maintenance.

Graphical Abstract

1. Introduction

The condition of road infrastructure is affected by numerous factors and varies greatly on different roads. Road infrastructure is critical to the well-being and economic health of all nations, so a large number of civil investments are made on road construction and maintenance [1,2]. The Australian Government spends more than $7 billion for maintaining and renewing transportation infrastructure every year [3], which accounts for about half of the aggregated public roads budget in Australia [4]. Transportation infrastructure plays an essential role in both public travel of passengers and freight transportation. Main roads, including national and state roads, supported 77.4% of domestic passenger travel (300.7 billion passenger kilometers (bpkm)) and 31.7% of domestic freight transportation (213.9 billion tonne kilometers (btkm)) during 2015–2016 financial year in Australia [5]. The main roads of Australia were primarily built in the last decades or half century, when the factors affecting pavement conditions were seldom considered in the road construction process. In fact, numerous factors, including traffic conditions, climate and environment, and the characteristics of the pavement itself, have sophisticated and significant influence on pavement condition, including pavement lifespan, surface texture, structure, materials, and transportation load capacity [6,7]. Ignoring these factors in road construction and pavement materials selection may lead to a cumulative burden, premature damage, reduction of longevity and increased costs for road maintenance [2,8]. Thus, researchers have started to pay attention to the quantitative analysis of the impacts of various factors on pavement conditions in recent years. Pavement infrastructure performance is the pavement conditions that can reveal the probability of road damage and pavement failure [1,9]. The pavement infrastructure performance is a sophisticated issue, since it contains different aspects of pavement conditions. A series of indicators of pavement infrastructure performance are usually used for monitoring and analyzing the pavement conditions, such as deflections [9,10], roughness [11,12] and cracking [13,14]. The monitoring indicators can generally reflect one or several aspects of the pavement infrastructure performance.
Vehicles and climate are concerned as two primary factors of pavement infrastructure performance in recent research. Impacts of vehicles on pavement performance come from multiple aspects. Roads with high traffic volumes may face higher risk of pavement damage and higher cost of road maintenance [15]. Heavy vehicles produce substantial cumulative vertical stress on pavement, due to their heavy mass [16,17]. Traffic mass overload can also increase risks of pavement damage and pavement repair costs, compared with vehicles under legal loads [18]. In addition, climate and environmental conditions have impacts on both the infrastructure quality in the use phase and the transportation activities [19,20]. The climate and environmental conditions consist of temperature, precipitation, moisture, soil type, soil moisture, soil drainage, etc. Previous research generally uses temperature and precipitation as the direct and most important factors for pavement performance assessment. Satellite remote sensing is one of the primary sources and increasingly used for generating the climate and environmental variables, such as land surface temperature, precipitation and soil moisture [21]. Studies show that the high temperatures and temperature variations usually lead to relatively large deflections [22], slab, alligator and transverse cracking [23,24], strain rate reduction of asphalt pavement [25], permanent deformation [24] and increased pavement repair costs [26]. Studies in the United States show that the longitudinal cracking of pavement is greatly influenced by temperature and precipitation, especially in wet climate areas where the expansion of frozen water contributes to cracking [24]. Precipitation also may decrease pavement life [27], due to premature damage of materials and structure.
To explore the impacts of the factors on pavement infrastructure performance, two categories of methods have been commonly utilized in previous studies, including engineering methods and statistical methods. A widely used engineering method is the Pavement Design Mechanistic-Empirical (ME) model, which can calculate pavement performance variations resulting from climate change, traffic, pavement structure and materials, and is primarily applied on flexible and proper pavement design [2,28,29,30]. The advantage of the method is that the expected performance and life of pavement can be estimated by involving parameters related to pavement structure and materials [31,32]. Another category of methods involves data-driven statistical methods, such as correlation analysis, statistical tests and regressions. For instance, Pearson correlation analysis and analysis of variance (ANOVA) are applied on assessing the effects of temperature and precipitation on pavement distresses, including various forms of cracking, rutting, pavement deformation and roughness [24]. A seemingly unrelated regression model is utilized to study the impacts of the aggregate number of heavy vehicles on the side force, roughness and profile depth of pavement [33]. However, spatial heterogeneity is seldom considered in the above two categories of methods, even though pavement infrastructure performance is a typical geospatial problem. In general, the pavement infrastructure performance is greatly varied across the space, especially the road networks distributed on relatively large-area regions. For this issue, the geographically local characteristics of the pavement infrastructure performance have to be investigated in addition to the geographically global characteristics. A major gap in the few considerations of spatial heterogeneity is that pavement observation data are distributed along line segments of the road network, which is different to traditional point or areal geographical observations distributed across the whole space and designed to capture the full range of variation of pavement condition and performance.
One of the primary objectives of spatial analysis is to explore spatially varied and local impacts of factors on geographical issues [34,35,36,37,38,39]. In this study, segment-based spatial stratified heterogeneity analysis is utilized to deal with the segment-based data and consider spatial heterogeneity in the assessment of pavement infrastructure performance. Segment-based spatial stratified heterogeneity analysis integrates spatial stratified heterogeneity analysis and line segment-based spatial values of road attributes, and it consists of optimal discretization of segment-based data and the geographical detector. Optimal discretization aims at exploring the best combination, such as the discretization method and number of breaking intervals, for discretizing continuous variables. The geographical detector is a spatial statistical method that can analyze relationships between geographical variables based on spatial variance and geographical strata. The geographical strata are the regions separated and determined by geographical variables [40]. The method was originally utilized to explore spatial stratified risk factors of disease [40]. The method is increasingly used in spatial stratified heterogeneity analysis in broad fields, including public health [41], land use [42], carbon emissions [43], air pollution [44], economy [45], etc., due to a series of advantages in spatial analysis. A primary advantage is that no linear assumptions are required for the relationships between explanatory and response variables, and for the relationships between pairs of explanatory variables, since the method objectively reveals the spatial associations between response and explanatory variables [46]. In addition, interactive impacts between two variables or among multiple variables can be quantified with the geographical detector [47,48]. Finally, the types and stratifications of explanatory variables are flexible, where continuous variables can be discretized to categorical variables.
This research therefore aims to explore the impacts of various factors on pavement infrastructure performance using segment-based spatial stratified heterogeneity analysis. The factors are from multiple sources, including the ground monitored and estimated variables about all vehicles and heavy vehicles in particular, satellite remotely sensed climate and environment data, road characteristics and the local socioeconomic conditions. The segment-based spatial stratified heterogeneity analysis includes two parts: Optimal discretization for segment-based pavement data, and assessing the impact of factors with a segment-based geographical detector. The case study used in this research is the Wheatbelt region in Western Australia (WA), Australia. Based on the case study, the influence mechanism of factors on pavement infrastructure performance is discussed, and future research directions and decision-makings in practice are recommended.

2. Materials and Methods

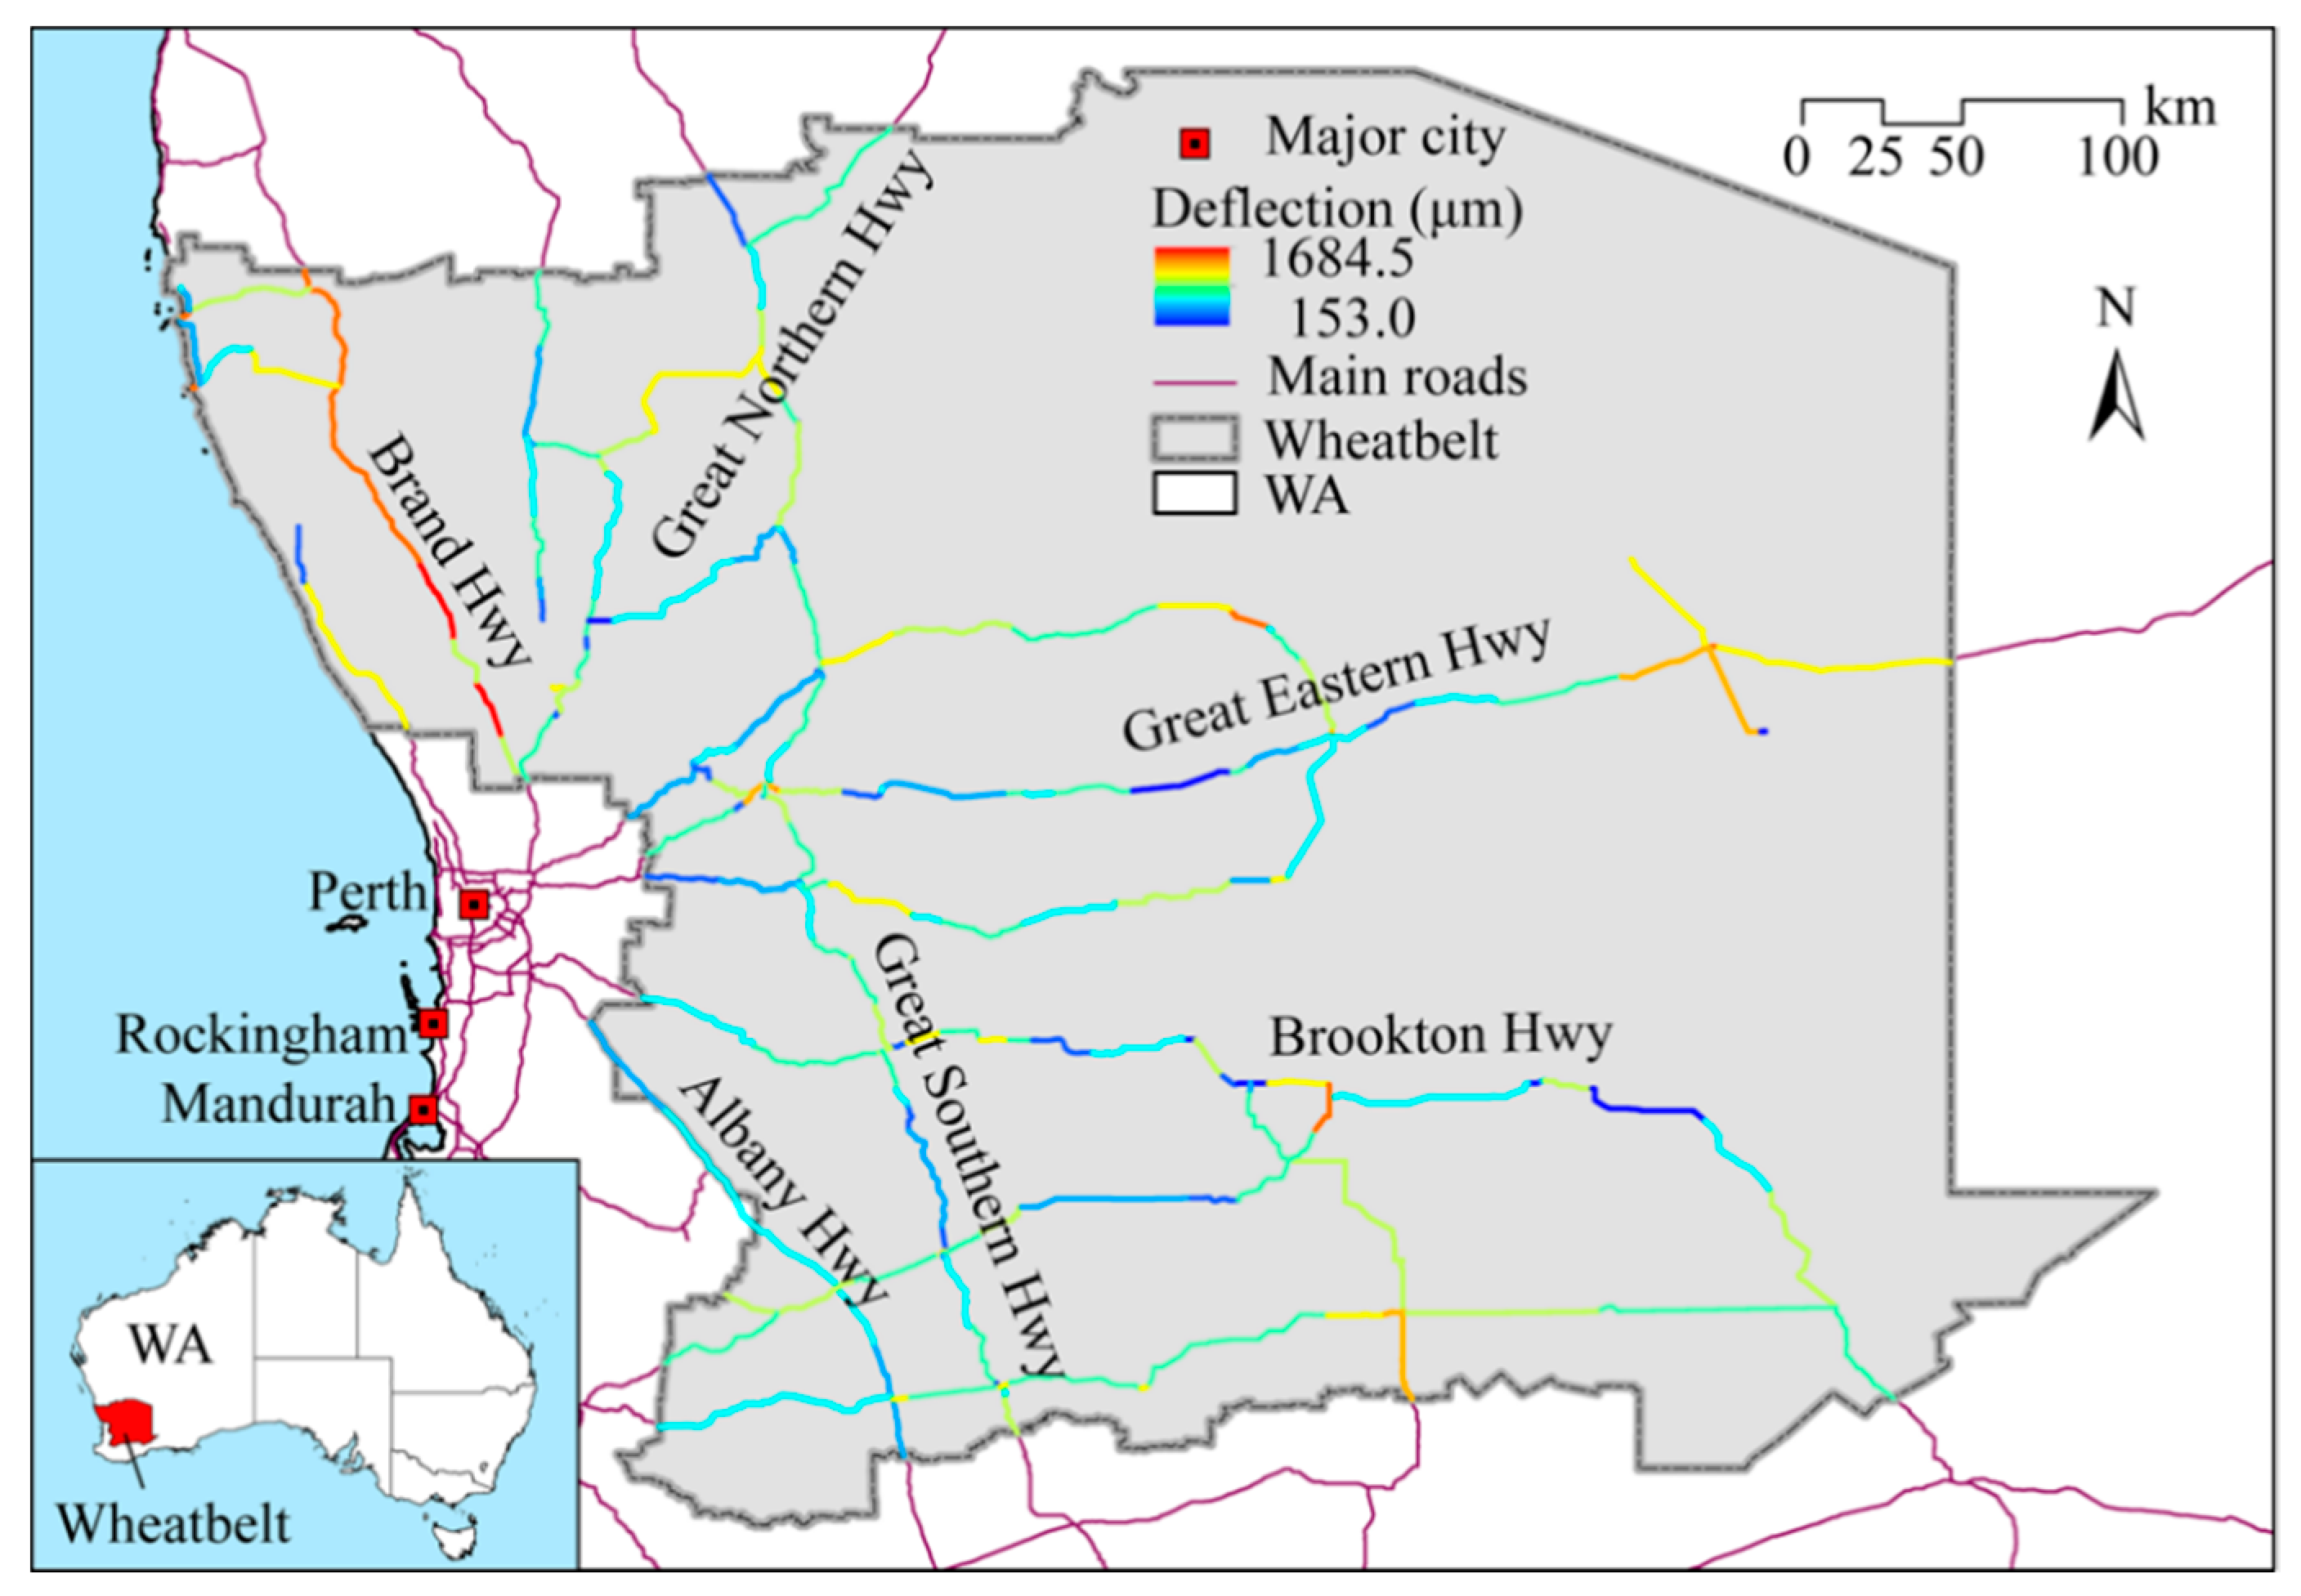
2.1. Study Area and Road Condition Data

The Wheatbelt region is located in southwestern WA and is made up of 42 local government authorities (LGAs) with an area of 154,862 km2. It is the primary grain production region in WA and includes important mining activities that generate substantial heavy haulage vehicle traffic (Figure 1). There are 280 road segments distributed on six major roads, including Brand Highway, Great Northern Highway, Great Eastern Highway, Brookton Highway, Great Southern Highway and Albany Highway. These road segments link the state capital (Perth) and major regional ports within the Wheatbelt region. Road maintenance, such as resurfacing, is a vital and regular construction task for road management authorities [49].
Road conditions are assessed via deflection measurements using a Dynatest 8000 series Falling Weight Deflectometer (FWD) and calibrated with Calibration Method WA 2060.5 by Main Roads, WA [50,51]. Deflection is a pavement strength indicator measured as the maximum depression in the surface of pavement under a standard load. Figure 1 shows the spatial distributions of mean deflections on road segments. Deflections on the 280 road segments vary across the road network, ranging from 153.0 μm to 1684.5 μm with the average value of 383.6 μm.

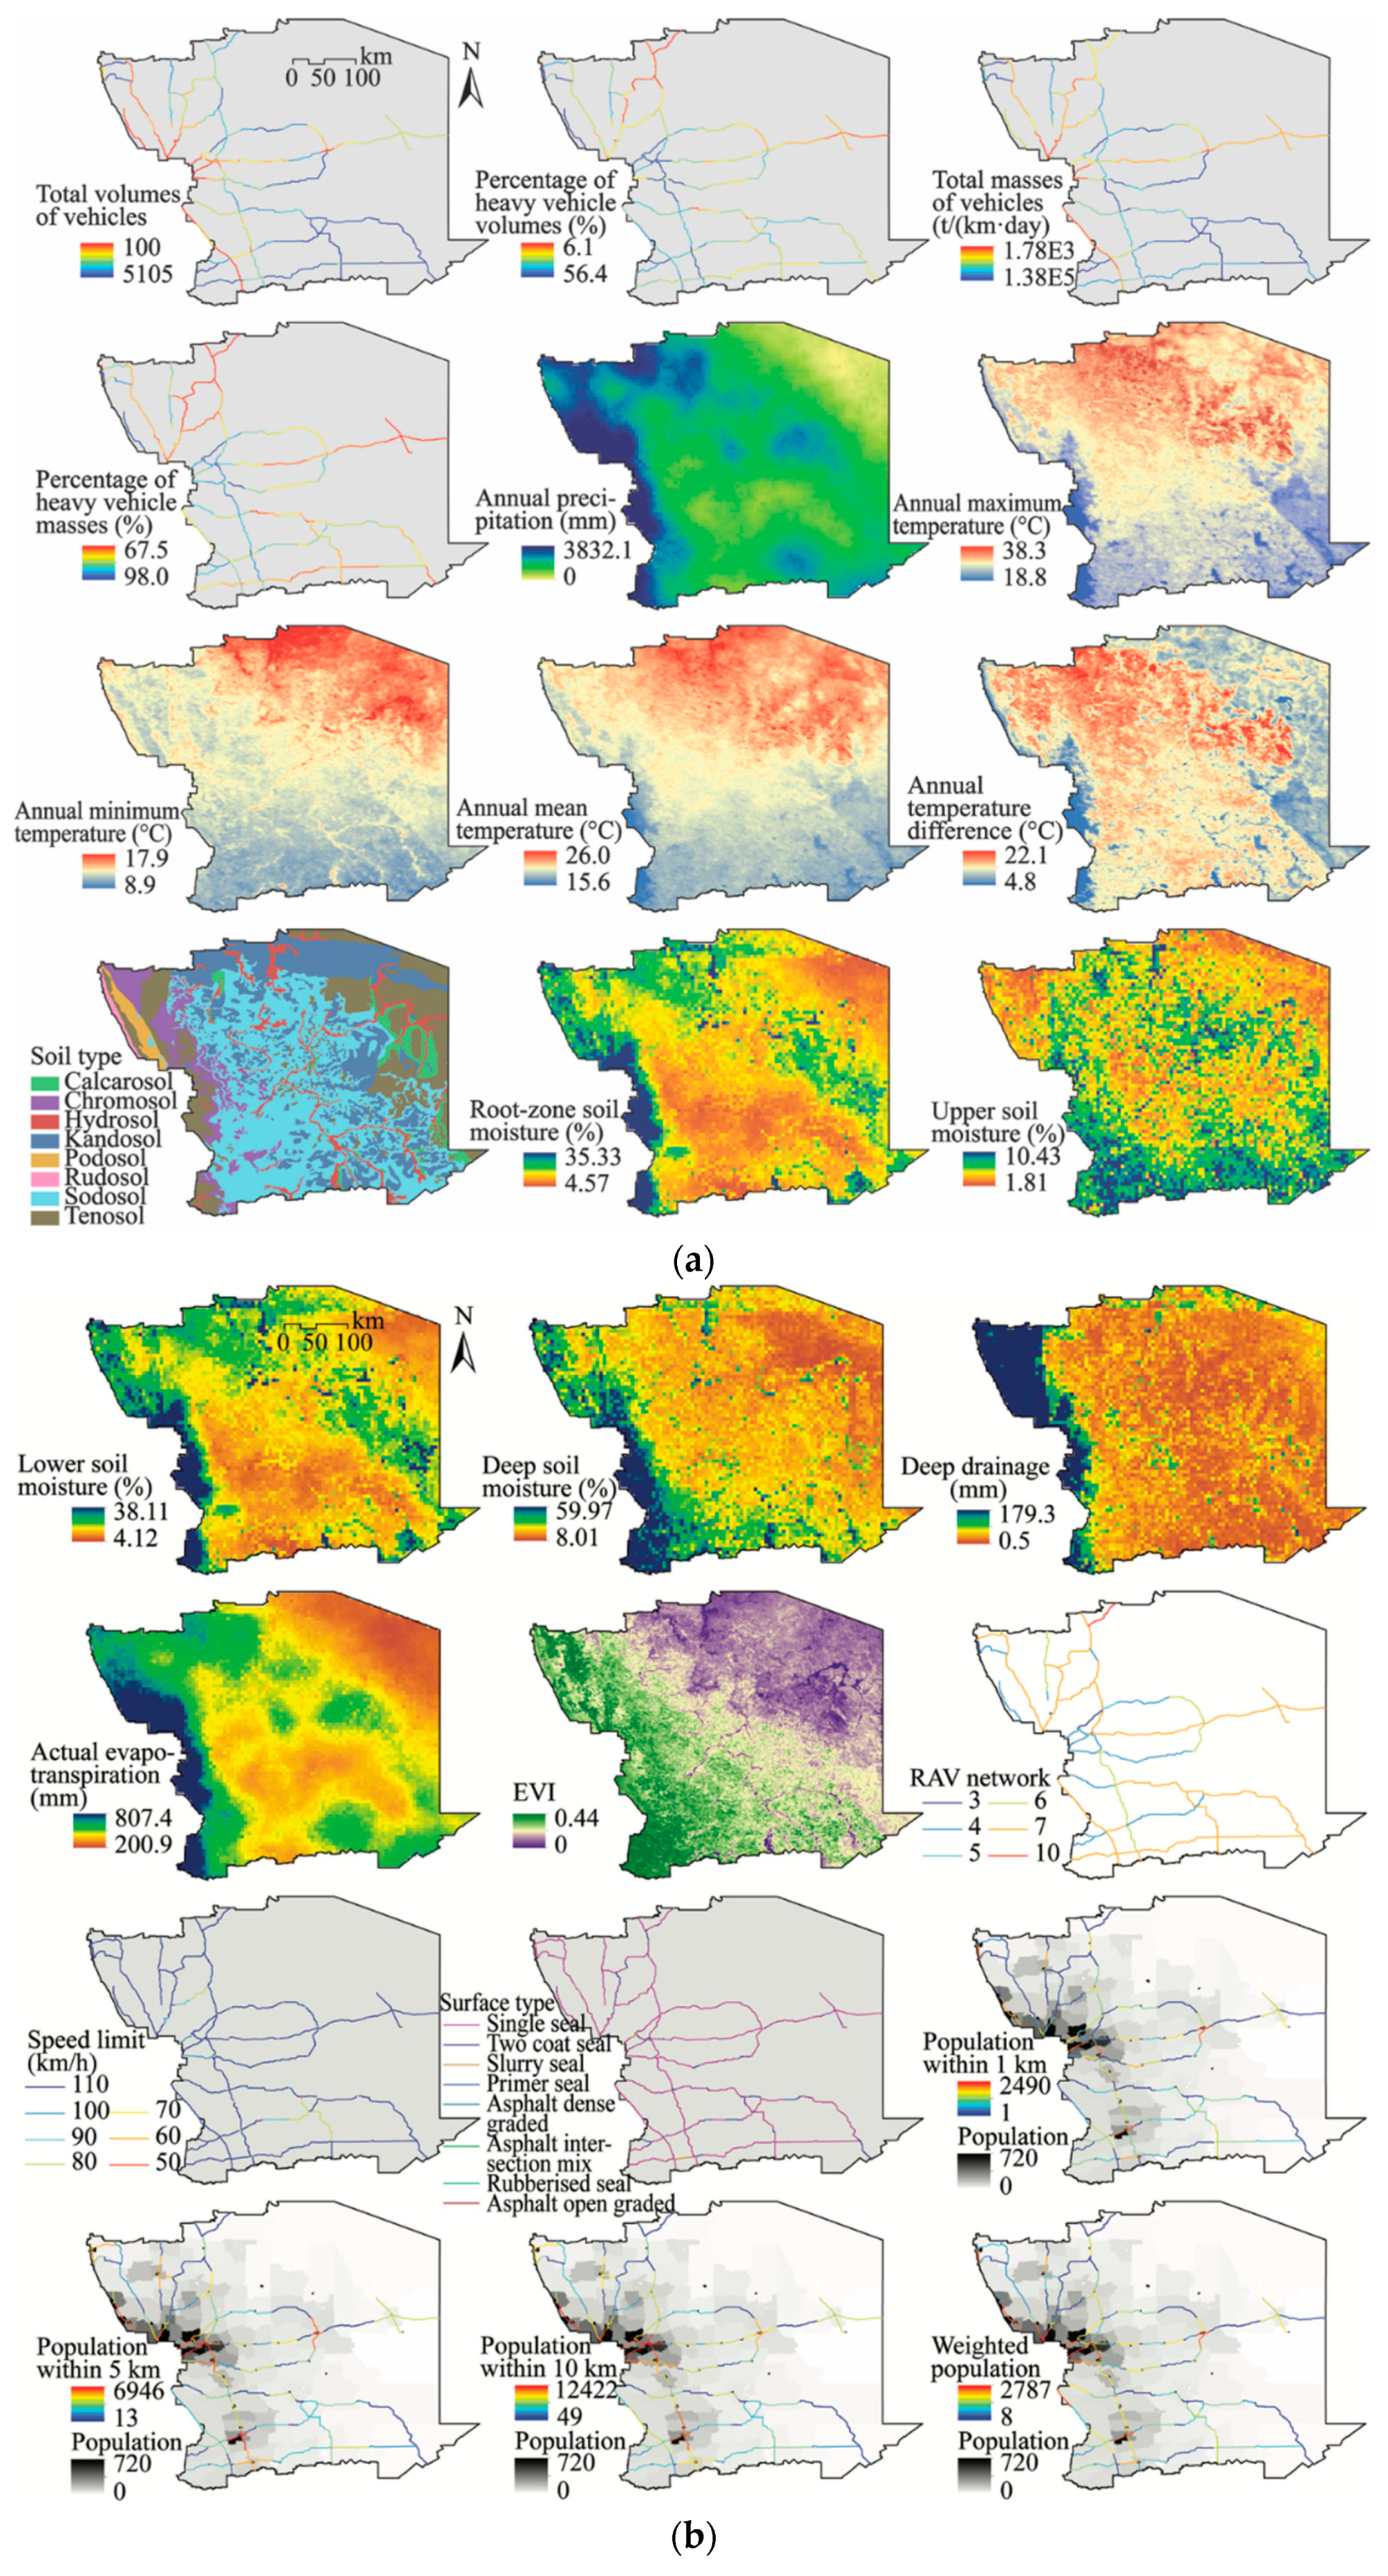
2.2. Explanatory Variables

The explanatory variables of pavement infrastructure performance are collected from multiple data sources. They are pre-processed to have the same spatial and temporal scales with pavement infrastructure performance data. During the pre-processing, data of explanatory variables with various spatial units and temporal intervals are summarized to the data with the identical spatial scale is the road network in the Wheatbelt region, WA, and temporal scale is the year 2015. The explanatory variables and their respective data sources are listed in Table 1. Based on the collected data, 24 explanatory variables are derived and they are divided into four categories. Two primary categories of variables are vehicles and heavy vehicles (C1), and climate and environment factors (C2), and another two categories of auxiliary variables are road characteristics (C3), and socioeconomic factors (C4). Variables in different categories have comprehensive impacts on the pavement conditions. Figure 2 displays the spatial distributions of all 24 variables in the order listed in Table 1. The explanatory variables data are of different formats and derived from different methods. The details of the explanatory variables in each category are respectively presented in the following paragraphs.
The four categories of explanatory variables are carefully pre-processed from the raw data to accurately reflect the impacts of the variables. The first category is the variables of vehicles and heavy vehicles. Traffic volumes are directly linked with pavement infrastructure performance, where heavy vehicles are a primary contributor, due to the heavy mass. In general, the weight of a standard light vehicle is merely 1.65 t and the gross vehicle mass (GVM) is limited to 4.5 t in Australia [62], but the mass of heavy vehicles used for freight transportation ranges from 42.5 t to 147.5 t [63]. Thus, the total traffic volumes and masses, and the respective percentages of heavy vehicles are calculated using segment-based regression kriging (SRK) methods [53] with traffic statistical data provided by Main Roads, WA [52]. SRK is a spatial prediction model for line segment-based spatial data, such as road properties and traffic conditions, by involving the spatial characteristics and spatial homogeneity of line segments [53]. Compared with raw data released by Main Roads, WA, and the data predicted using traditional aspatial and point-based spatial methods, SRK provides more accurate prediction results with significantly reduced errors and autocorrelations of residuals.
Another critical category of variables is related to the on-road and near-road climate and environmental conditions, including precipitation, temperature, soil type, soil moisture and vegetation in the Wheatbelt region, WA, in 2015. The annual precipitation data with a spatial resolution of 5 km is sourced from the Bureau of Meteorology in Australia [54]. This precipitation dataset is calculated based on daily precipitation grids produced from approximately 6500 rain gauge stations across Australia [55]. Temperature variables including maximum temperature, minimum temperature, mean temperature and the calculated temperature difference during 2015 are derived from 1-km spatial resolution 8-Day L3 Global Land Surface Temperature (LST) and Emissivity product (MOD11A2) from the Moderate Resolution Imaging Spectroradiometer (MODIS) [56]. Spatial data of soil type distributions is sourced from the 2016 State of the Environment (SoE) Land Australian Soil Classification Orders dataset [57,58]. Soil moisture variables with a spatial resolution of 5 km are sourced from the Bureau of Meteorology, Australia, and the Australian Soil Resources Information System (ASRIS) dataset [54,59]. Soil type includes Calcarosol, Chromosol, Hydrosol, Kandosol, Podosol, Rudosol, Sodosol and Tenosol in the Wheatbelt region. Soil moisture reflects the relative soil water storage capacity within a soil layer between a certain range of depths. Variables of soil moisture data include root-zone soil moisture, upper soil moisture, lower soil moisture, deep soil moisture, deep drainage, and actual evapotranspiration [54]. Root-zone soil moisture is the sum of available water in the upper and lower soil layers in the top 10 cm and 10 cm—1 m, respectively. Deep soil moisture represents the percentage of available water within the 1—6 m soil layer, which is determined based on the assumption that deep-rooted vegetation can access water down to 6 m [54]. Deep drainage is the water draining from the bottom of the deep soil layer to the groundwater and represents diffuse groundwater recharge [64]. Actual evapotranspiration is the estimated total evapotranspiration from vegetation, soil and groundwater using event-based methods and adaptive analytical models [65,66]. Vegetation along roads have both benefits and challenges for the pavement environment [67]. Ground vegetation conditions are explained by 1-km spatial resolution enhanced vegetation index (EVI) data, which is collected from the Terra Vegetation Indices 16-Day L3 MOD13A2 product from MODIS [60].
In addition to the variables of vehicles and climate, road characteristics and socioeconomic factors are also included as explanatory variables of pavement infrastructure performance. In WA, the restricted access vehicles (RAV) network used by Main Roads, WA, is a critical guideline for heavy vehicle services and road management operations for staff, operators and consultants in Main Roads and LGAs [68]. The RAV network defines ten categories of heavy vehicles and corresponding roads they can access [69]. Spatial vector data of the RAV network is provided by Main Roads WA [70]. In addition, Main Roads WA also provides speed limit spatial vector data [71] and road surface type data, where surface type includes single seal, two coat seal, slurry seal, primer seal, asphalt dense graded, asphalt intersection mix, rubberized seal and asphalt open graded in the Wheatbelt region. For socioeconomic factors, population near road segments are calculated to reflect the potential utilization of roads by surrounding residents. Population data with 1-km spatial resolution is obtained from Gridded Population of the World fourth version (GPWv4) [61], and the calculated variables include population within 1-km, 5-km and 10-km buffer areas of road segments, and the inverse weighted population within 50-km buffer areas [72].

2.3. Methods

Segment-based spatial stratified heterogeneity analysis is performed to explore the relationship between pavement infrastructure performance and its potential spatial variability along road segments. The geographical detector is commonly used for point-based or area-based geographical problems. The method contains four primary models: Factor detector, interaction detector, risk detector and ecological detector [40,47]. In this study, deflections are monitored and analyzed for each road segment and the observations are regarded as line segment-based data. Therefore, a segment-based geographical detector is utilized by integrating the geometric characteristics of road segments and the geographical detector.
The methods of segment-based spatial stratified heterogeneity analysis of pavement infrastructure performance are illustrated in Figure 3. There are two primary parts in the method: Optimal discretization for the geographical detector and assessing impacts of factors. The two parts are conducted through a three-step process. First, the factor detector model is introduced, since it is the core part of the geographical detector and the calculation of optimal discretization is based on the factor detector. Next, optimal discretization is performed to analyze the scale effect to determine the best line segment length for segmenting the road network, and selecting the best combinations of discretization methods and number of intervals for the optimal discretization solutions. Finally, spatial stratified heterogeneity is analyzed using the factor detector, interaction detector and risk detector models to assess the impacts of variables. In terms of the data and calculation processes in this study, we develop a “GD” R package for optimal discretization and spatial stratified heterogeneity analysis using the geographical detector, which can be freely downloaded from the Comprehensive R Archive Network (CRAN) (https://cran.r-project.org/web/packages/GD/index.html). No parameter optimizations and iterations are required in the package. A sample dataset sourced from this paper is also provided so that users can easily access the models and perform their own experiments.

2.3.1. Segment-Based Factor Detector Model

A key part of the geographical detector is the factor detector model, which presents the relative importance of the determinants of geographical problems [40,47]. In this study, the factor detector model is used twice. First, it is used for optimal discretization with the segment-based geographical detector. Once the optimal discretization solutions are determined, the factor detector model is then applied to the segment-based spatial stratified heterogeneity analysis for exploring the relative importance of the explanatory variables of pavement infrastructure performance. The mechanism of the segment-based factor detector is shown in Figure 3. The segment-based factor detector is measured by a Q value, which presents the consistency of spatial patterns between pavement infrastructure performance and its potential variables. The Q value is equal to one minus the ratio of accumulated dispersion variance of deflections within sub-regions to that of the whole road network:
Q = 1 ( u = 1 s N A , u σ A , u 2 ) / N σ 2 ,
where A is a segment-level variable that its observations are distributed along the road line segments with the same segmenting length, N A , u is the number of observations of pavement infrastructure performance on the road segments distributed on the u th ( u = 1 , , s ) sub-regions that are determined by segment-level variable A , the dispersion variance of these observations is σ A , u 2 , and N and σ 2 are the number and dispersion variance of all observations of pavement infrastructure performance on the whole road network. The Q value reflects the relative importance of variables, ranging from 0 to 1. A variable with a large Q value has relatively higher importance than a variable with a small Q value. The result of Q = 1 due to σ A , u 2 = 0 and σ 2 0 means that the spatial pattern of pavement infrastructure performance is identical to the distribution of variable A , and the result of Q = 0 shows that variable A is completely unrelated to pavement infrastructure performance seen from the perspective of segment-based spatial stratified heterogeneity.

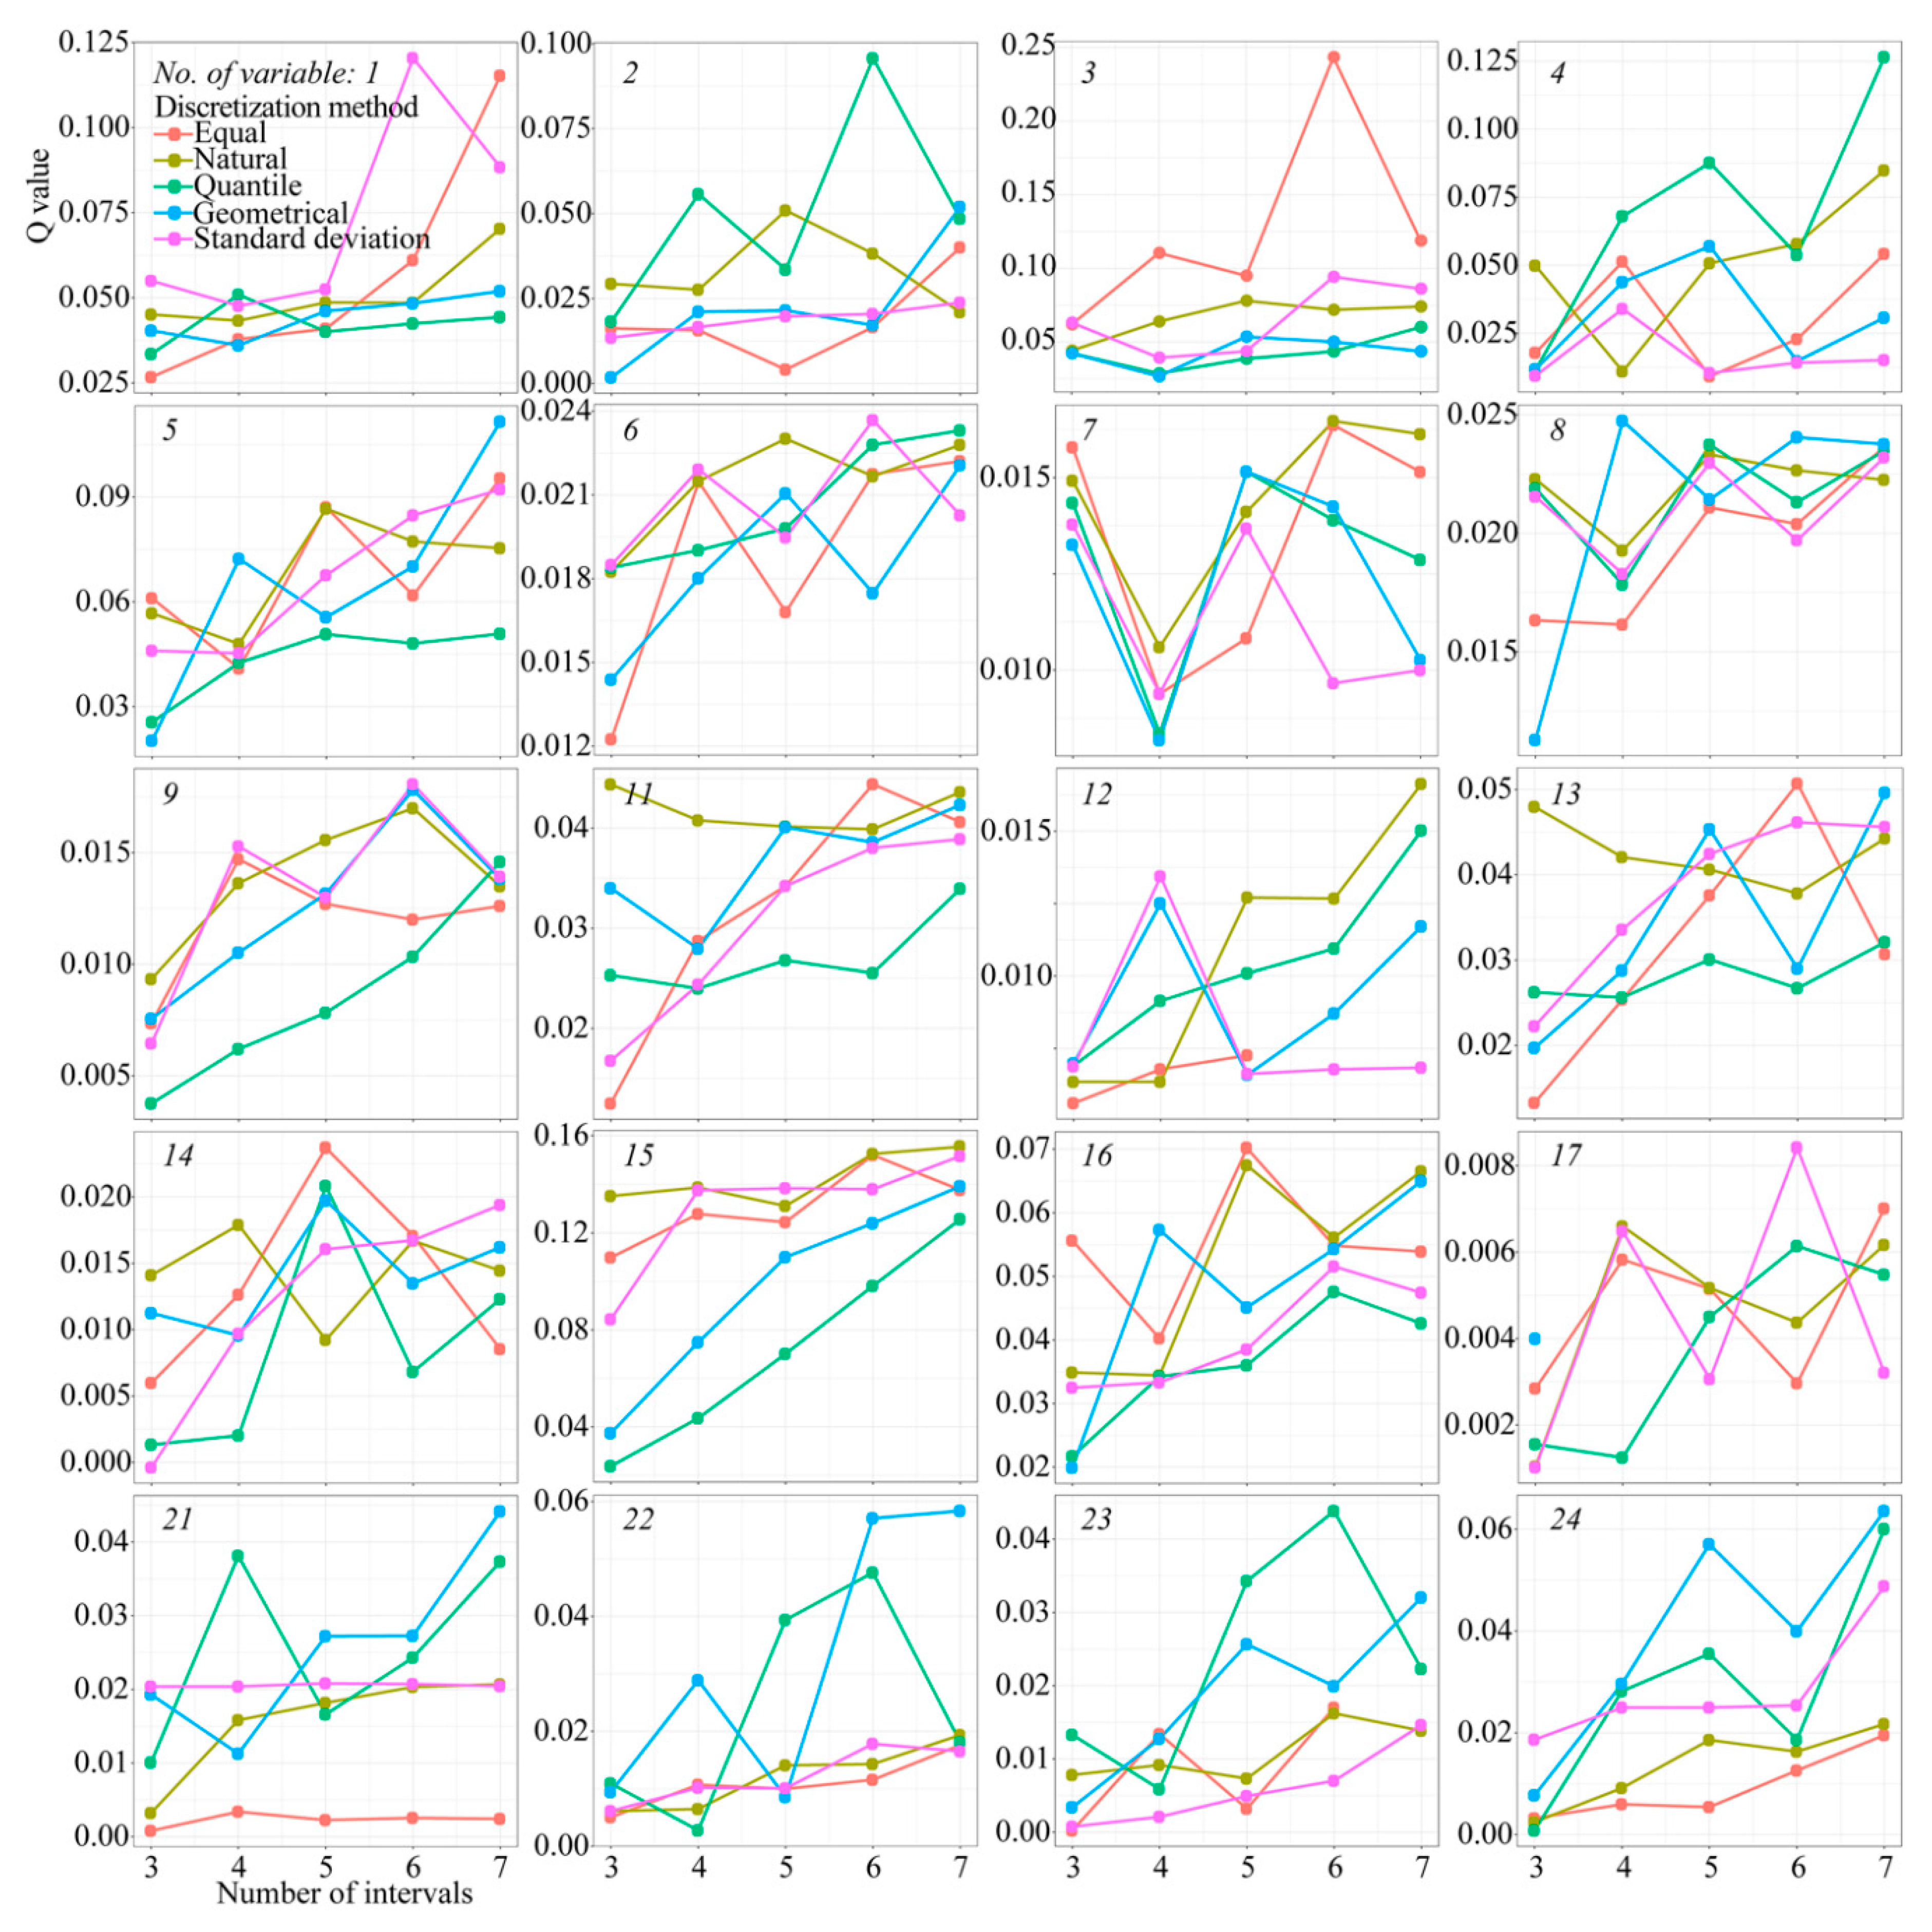
2.3.2. Optimal Discretization for Segment-Level Variables

Since the input of the geographical detector should be categorical variables, an optimal discretization framework is utilized to select the optimal discretization solutions for discretizing continuous variables along road segments (Figure 3). The optimal discretization framework includes three objectives: Assessing the impacts of scale effect of line segments to determine the best length for segmenting the road network, selecting the best combination of discretization method and number of intervals for each variable that enables the largest Q value in the segment-based factor detector model, and calculating optimal discretized segment-based continuous variables.
Scale effect is a common phenomenon in geospatial problems, due to the modifiable spatial unit defined manually according to the understanding and experience of researchers [48,73]. Spatial effect means that changes in the size of a spatial unit usually lead to different spatial analysis results [73], so scale effect analysis is critical for selecting an optimal spatial unit for reasonable geospatial analysis. For the general geographical detector for point or area based data, scale effect analysis aims at selecting the best grid size using the relative importance ( Q value) of variables, where stable ranks of Q values indicate the optimal spatial unit [48]. In this study, the best length of line segment for segmenting the road network will be obtained through the comparison of associations between line segment lengths and the variations of relative importance Q values. The optimal length of a line segment is selected when the ranks of Q values are stable. According to the geometric characteristics of the segments distributed on the road network, seven lengths of line segments in the segment-based geographical detector are utilized for the scale effect analysis, including 100 m, 250 m, 500 m, 1 km, 2 km, 4 km and 8 km, and the corresponding number of segments on the road network are 18,660, 7523, 3812, 1958, 1031, 567 and 335.
In addition to selecting the optimal length of line segments, the best combinations of discretization methods and numbers of intervals will be determined for discretizing continuous variables. Under the optimal length of line segments, different discretization methods and numbers of intervals can generate various break values. In this study, five commonly used unsupervised discretization methods are utilized for discretizing continuous variables, including equal breaks, natural breaks, quantile breaks, geometric breaks and standard deviation (SD) breaks. The five methods have their respective advantages in dividing the range of data values into specified intervals by considering data range, data distribution, data within or between intervals, and statistical characteristics [74,75]. All continuous variables are divided into ranges of 3–7 intervals using the five discretization methods. The ranges of 3–7 intervals are proper numbers of intervals for most of the geographical variables, since if the number of intervals is too small, spatial stratified heterogeneity cannot be reflected by the variables, and if they are too large, data will be scattered across space. The relative importance ( Q values) are computed using a factor detector model for all combinations of discretization methods and numbers of intervals, and the largest Q values determine the best parameter combinations for discretizing continuous variables.
Finally, once the optimal length of line segments is selected, and the best combinations of discretization methods and numbers of intervals are determined for segment-based continuous variables, the road network will be segmented and the continuous variables are discretized and converted to corresponding categorical variables. Thus, the discretized variables and categorical variables, such as soil type and surface type, are equally regarded as the explanatory variables of pavement infrastructure performance and input for the segment-based geographical detector.

2.3.3. Segment-Based Interaction Detector and Risk Detector Models

In the segment-based geographical detector, the interaction detector is utilized to explore the interactive impacts of segment-based variables on the pavement infrastructure performance, and a risk factor is computed to explore the road segments with high or low risk of damage. The interaction detector compares the importance of two combined explanatory variables to their independent importance to evaluate if the variables are enhanced or weakened by each other, or their impacts are independent. Figure 3 shows the interaction of two explanatory variables A and B , and their relationship with the distribution of pavement infrastructure performance. The importance comparison of the interaction variables and the independent variables are computed by the interaction detector as follows [40]:
{ Q A B < min ( Q A , Q B ) Nonlinear weaken min ( Q A , Q B ) Q A B max ( Q A , Q B ) Weaken / Uni enhance max ( Q A , Q B ) < Q A B < ( Q A + Q B ) Bi enhance Q A B = ( Q A + Q B ) Independent Q A B > ( Q A + Q B ) Nonlinear enhance ,
where Q A B is the relative importance of the interaction variables, and Q A and Q B are the respective relative importance of variables A and B . In Equation (2), the relative importance is gradually increased from “nonlinear-weaken” to “nonlinear-enhance”.
Further, the risk detector computed with a t-test is utilized to explore the spatial distributions of relative risks, which are computed by the difference of average values within sub-regions defined by intervals of a potential variable [40]. In this study, the average pavement deflections within sub-regions are calculated to reflect the relative conditions of road damage that are linked with the spatial patterns of potential variables. The average pavement deflection D u within u th sub-region in risk detector analysis is calculated by:
D u = j = 1 M u , j D u , j / ( L M u , j ) ,
where D u , j is the pavement deflection on j th road segment within u th sub-region, M u , j is the total number of road segments within the sub-region, and L is the optimal length of line segments determined by scale effect analysis. The average pavement deflection D u reflects the relative risk of road damage within an interval of a variable. A large value of D u indicates a relatively high risk within a certain sub-region defined by an interval of a variable. Figure 3 illustrates the spatial distribution of road segments with the highest relative risks of pavement deflections.

3. Results

3.1. Optimal Discretization

During the optimal discretization process, seven lengths of line segments are analyzed in the scale effect analysis, and five unsupervised discretization methods and five intervals are included in selecting the best parameters for segmenting the road network and discretizing continuous variables. In total, 175 groups (7 × 5 × 5) of experiments are performed for each of the 20 continuous variables listed in Table 1 for optimal discretization analysis. In the experiments, the best combinations of discretization methods and numbers of intervals are firstly selected by the comparison of relative importance using Q values for each of the seven lengths of line segments. Figure 4 shows the comparison of Q values and their ranks with the line segment lengths, where the best combinations of discretization methods and numbers of intervals are set for the variables. Ranks of Q values show that when line segment length is less than 500 m, the ranks of variables (especially the top half ranks) are relatively stable. When line segment length is larger than 500 m, the ranks of variables are changed and the number of variables with significant relationships with pavement infrastructure performance are reduced. Thus, in the scale effect analysis, 500-m line segments are used for segmenting the road network and generating segment-based explanatory and response variables. The result of 500-m line segments is also consistent with the regional practice on sealing design by Main Roads, WA. Meanwhile, Figure 5 shows the process for selecting the best combinations of discretization methods and the number of intervals for discretizing continuous variables under the line segment length of 500 m. For each continuous variable, the best combination with the largest Q value is selected from 25 combinations formed by five discretization methods and five intervals. The best combination is also calculated for the scenarios of other line segment lengths, and the results are utilized in the analysis of ranks of Q values (Figure 4).
The results of discretizing continuous variables are shown in Figure 6, and the best discretization methods and numbers of intervals for continuous variables are summarized in Table 2, together with the categorical variables to be used in the segment-based geographical detector analysis. Results show that the combinations of discretization methods and the numbers of intervals have no relationships with Q values. Thus, different discretization parameters have to be carefully determined, including discretization methods and the numbers of intervals, for different explanatory variables. The best combinations might be associated with the distributions of variable data and the relationships between spatial patterns of pavement infrastructure performance and the potential variables. In the following stages, the discretized variables with the relatively best discretization parameters can be used to compute the segment-based stratified heterogeneity analysis for road infrastructure conditions.

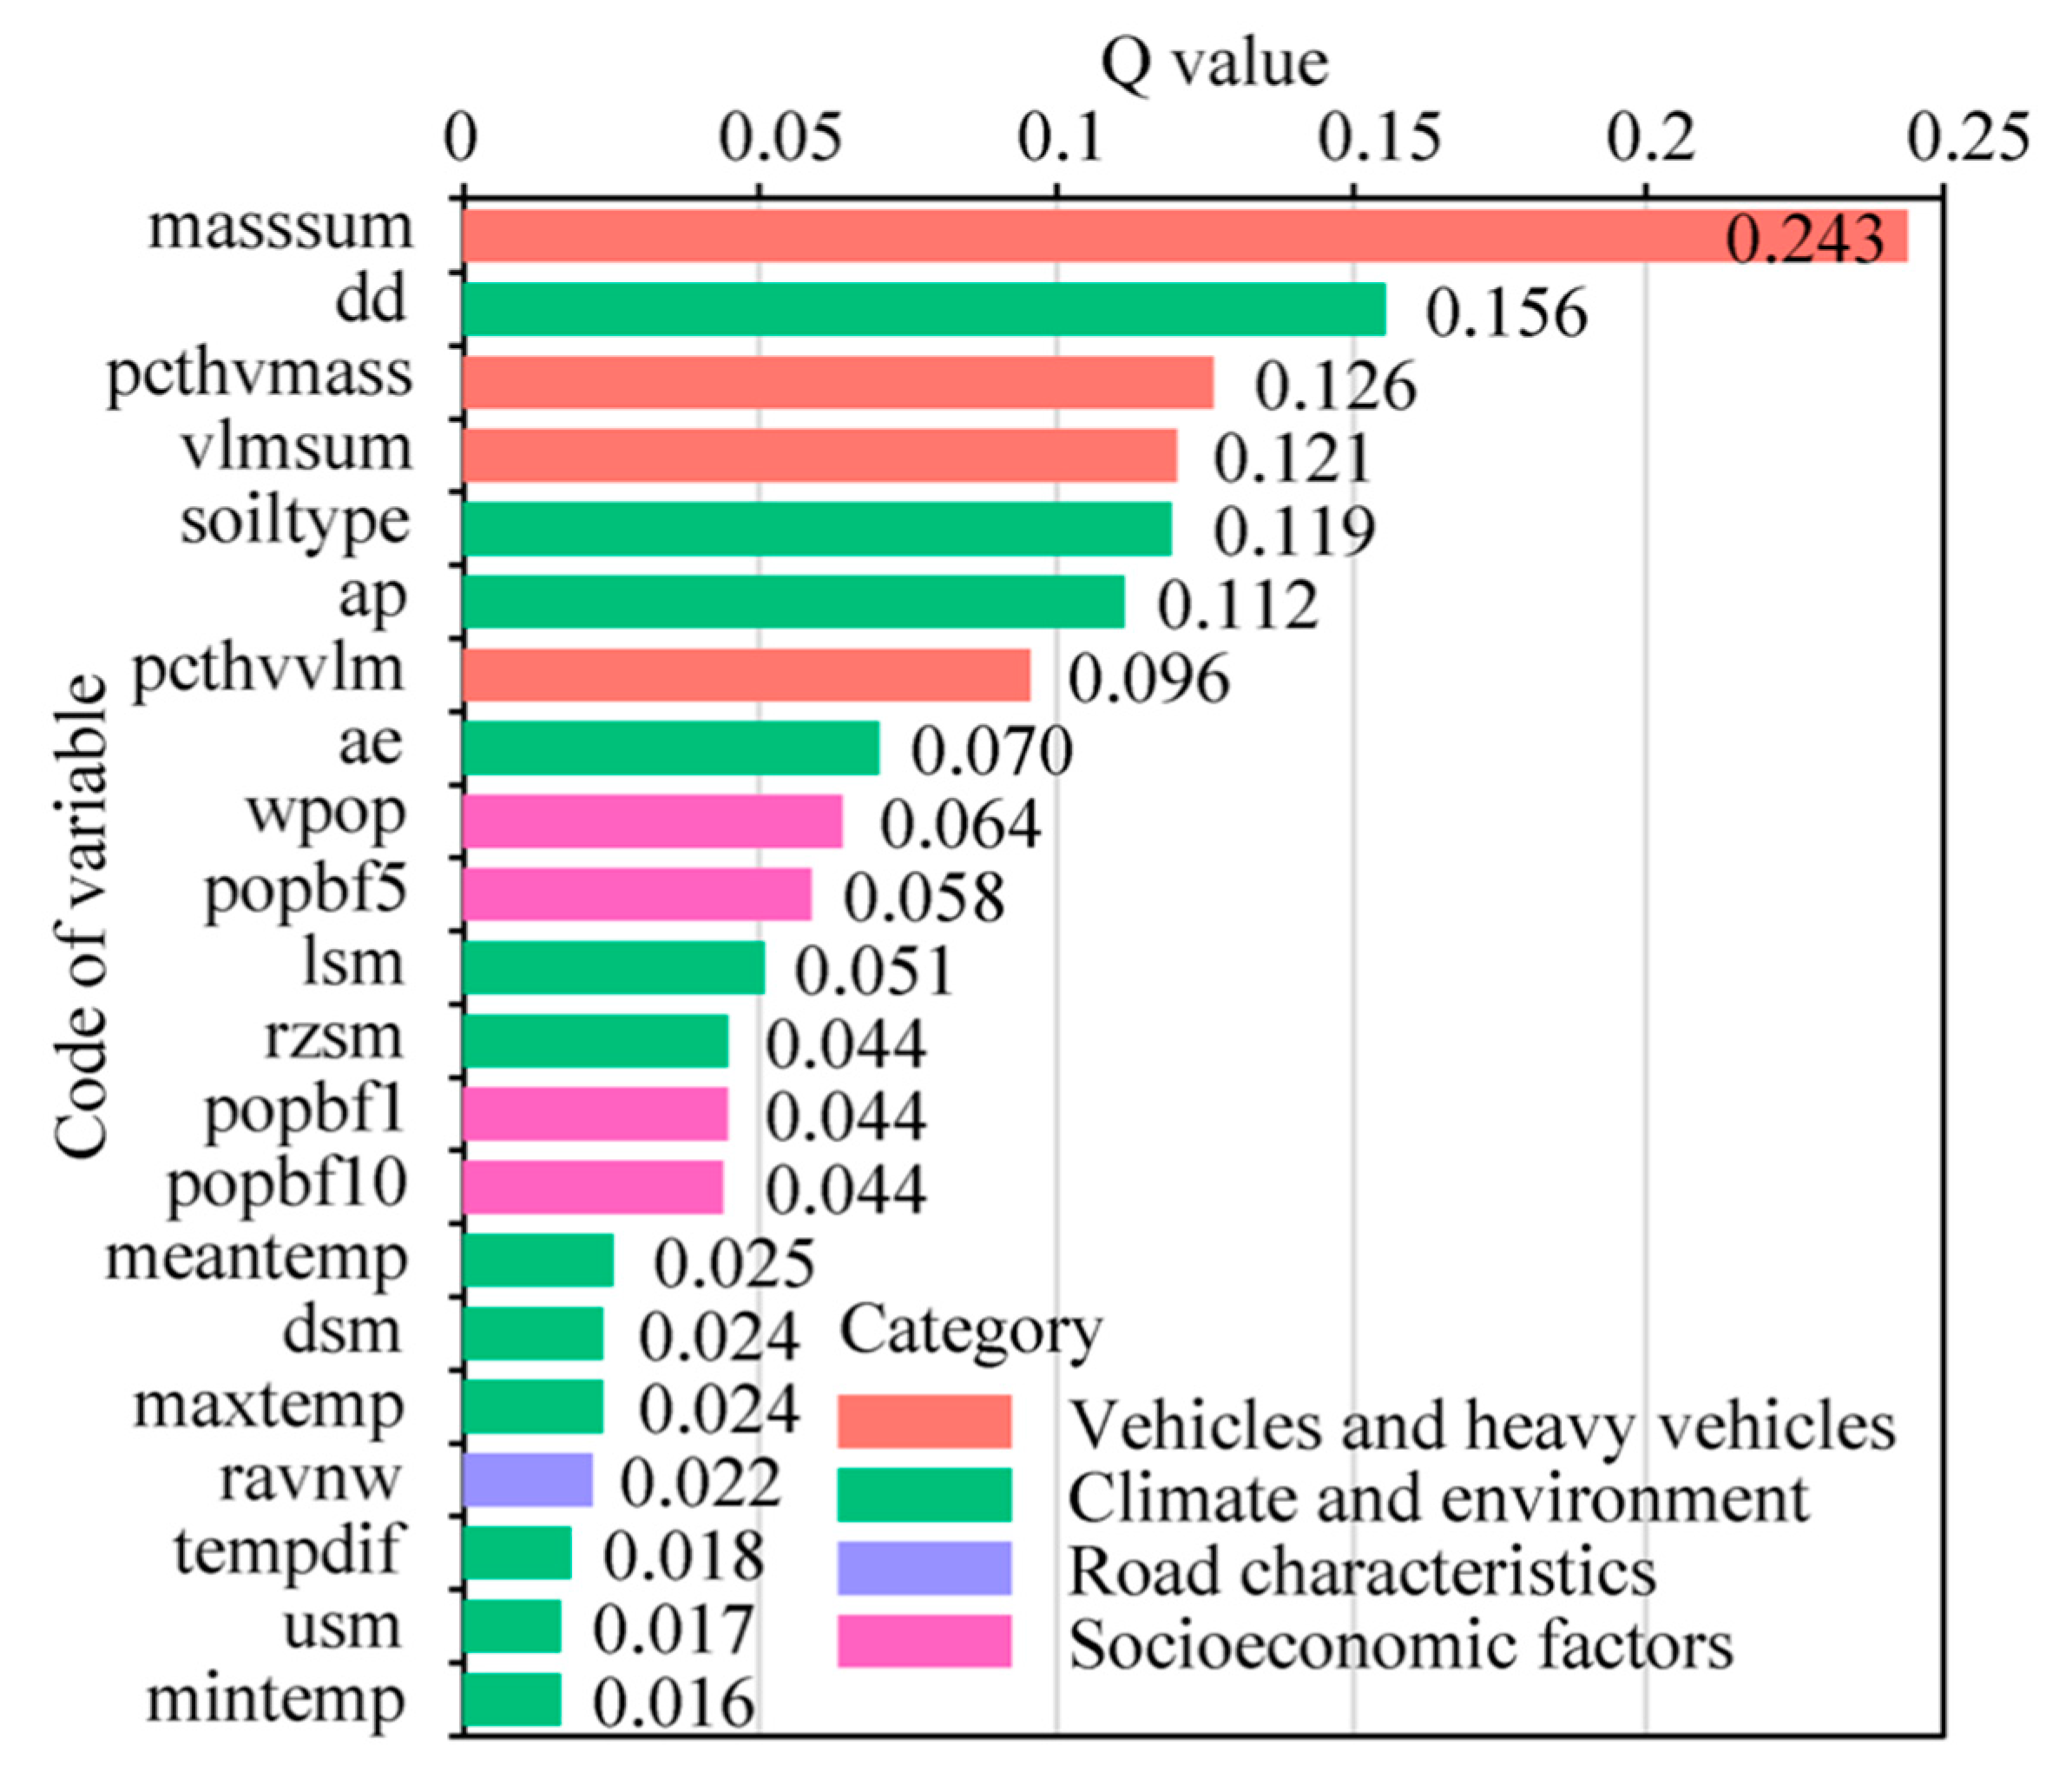
3.2. Segment-Based Factor Detector

Under the 500-m line segment scenario for segmenting the whole road network in the Wheatbelt region, the segment-based factor detector is performed for all potential variables, including category and discretized segment-level variables. Figure 7 shows the Q values and their ranks of variables with significant relationships with pavement deflections. The variables that have no significant Q values are removed. The removed variables include EVI, traffic speed limit and road surface type. In general, variables from the categories of vehicles and heavy vehicles, and climate and environment, make more contributions to the pavement deflections than the variables of road characteristics and socioeconomic factors. All four variables of vehicles and heavy vehicles are among the top-quartile ranks of Q values. The relative importance of total masses of vehicles ( Q = 0.243 ) and deep drainage ( Q = 0.156 ) are much higher than other variables. Weighted population within 50 km ( Q = 0.064 ) and RAV network ( Q = 0.022 ) are the variables that have the largest contributions among their respective category of socioeconomic factors and road characteristics.

3.3. Segment-Based Interaction Detector

In this study, 276 pairs of interactions among 10 types of category interactions are computed between the 24 potential variables in the 4 categories. Figure 8 shows the impacts of all interactions between potential variables, including variable interactions, category interactions, Q values and ranks, where the top 20 interactions are marked by the ranks. Table 3 lists the top 20 interactions, which are all nonlinearly enhanced by both variables. The top 20 interactions are identified in the category interactions of (1) vehicles and heavy vehicles (C1∩C1), (2) vehicles and heavy vehicles, and climate and environment (C1∩C2), (3) vehicles and heavy vehicles, and socioeconomic factors (C1∩C4), and (4) climate and environment, and socioeconomic factors (C2∩C4). Half of the top 20 interactions are the category interaction of vehicles and heavy vehicles, and climate and environment (C1∩C2), four interactions are included in the category interactions of vehicles and heavy vehicles (C1∩C1), and another four interactions are between the categories of climate and environment, and socioeconomic factors (C2∩C4).
The interaction that contributes the most to the pavement deflections is the percentage of heavy vehicle mass and soil type ( Q = 0.566 ), and the interaction with the second largest relative importance is the interaction between total mass of vehicles and soil deep drainage ( Q = 0.544 ). Both belong to the category interaction between vehicles and heavy vehicles, and climate and environmental factors (C1∩C2). The results indicate that the pavement infrastructure performance is significantly related to the interactive impacts between vehicles and heavy vehicles, and the climate and environmental conditions, and the impacts are nonlinearly enhanced by both categories of variables. Heavy vehicles are an important contributor among vehicles, and it has strong interactions with climate and environmental conditions. In addition to the soil type and soil deep drainage, precipitation and actual evapotranspiration also have strong interactions with the variables of vehicles and heavy vehicles, especially the percentages of heavy vehicle volume and mass.
The interactions that have third and fourth highest relative importance are related to the category interaction within vehicles and heavy vehicles (C1∩C1), including the interaction between total volume of vehicles and the percentage of heavy vehicles ( Q = 0.543 ), and the interaction between total mass of vehicles and the percentage of heavy vehicle mass ( Q = 0.532 ). Results of the interaction of vehicles and heavy vehicles reveal that the volumes of vehicles and heavy mass have significant influence on the pavement infrastructure performance, and their impacts are nonlinearly enhanced.
In addition, socioeconomic factors also have strong interactive impacts with variables from the categories of vehicles and heavy vehicles, and climate and environment. The interaction between population within 1 km from road segments and percentage of heavy vehicle mass ( Q = 0.407 ) is the most important interaction among the category interaction between socioeconomic factors and vehicles and heavy vehicles. Meanwhile, the interaction between weighted population within 50 km of road segments and annual precipitation ( Q = 0.453 ) has the largest contribution in the category interaction between socioeconomic factors and the climate and environmental conditions.

3.4. Segment-Based Risk Detector

The segment-based risk detector reveals the road segments with pavement deflections at high or low risks in different sub-regions of variables. The risks of pavement deflections are calculated using the segment-based risk detector for variables in the four categories, including vehicles and heavy vehicles (C1, Figure S1), climate and environment (C2, Figure S2), road characteristics (C3, Figure S3), and socioeconomic factors (C4, Figure S4), where the variables that have no significant relationships with pavement deflections are removed. To deeply understand the spatial patterns of pavement deflections at high or low risks, five levels of risks are defined for the sub-regions of variables, including very high risk, high risk, medium risk, low risk and very low risk. The definitions and descriptions of pavement infrastructure performance risk levels are listed in Table 4. According to the definition, risks of pavement damage are directly linked with the sub-regions of variables. In this study, the variables with the top six Q values identified by the segment-based factor detector are used as examples for illustrating the risk distributions of pavement infrastructure performance. The six values include total masses of vehicles, soil deep drainage, percentage of heavy vehicle mass, total volumes of vehicles, soil type and annual precipitation. The six variables have the largest relative contributions ( Q > 0.1 ) and they are included in 18 of the top 20 interactions. Figure 9 shows the levels of risks within sub-regions of variables and the corresponding spatial distributions at high or low risks. For instance, road segments with very high risk associated with the total masses of vehicles are primarily located at the southern part of Brand Highway. Road segments of high risk are located at Brand Highway, Great Northern Highway, Great Eastern Highway and Albany Highway, and other road segments are at low risk. For the sub-regions determined by soil deep drainage, road segments at very high risk are primarily on Brand Highway, and those at very low risk are distributed on the southern part of Great Northern Highway, western part of Great Eastern Highway, and Albany Highway.

4. Discussion

4.1. The Segment-Based Spatial Stratified Heterogeneity Analysis

Compared with traditional point or area based geographical observations, segment-based observations have specific geometric and heterogeneity characteristics. In previous studies, only a few segment-based spatial analysis methods were used for processing segment-based spatial data. Road and traffic data, such as pavement deflections, are typical segment-based observations, which are spatially homogeneous within a segment, but spatially heterogeneous on different segments across the road network [53]. In this study, optimal discretization for segment-based pavement data and geographical detector are integrated in the segment-based spatial stratified heterogeneity analysis of exploring the impacts of potential variables on pavement infrastructure performance. This approach has the following innovations and advantages.
First, the geometric and heterogeneity characteristics of segment-based pavement data are included in the spatial stratified heterogeneity analysis. In general, spatial grids with certain sizes are applied on extracting response and explanatory variables from multi-source spatial data in a geographical detector. This method is reasonable and widely used in point and area based spatial observations [40,75]. However, it is biased and unreasonable for segment-based data, which are distributed along the line segments, such as road segments across the road network, due to the various and diverse shapes of line segments. If spatial grids are applied on segment-based data, the shapes and lengths within a spatial unit will be largely different, leading to biased inputs of spatial data and errors in the spatial analysis. In this study, the road network is segmented using the spatial unit of line segments with the same length, and values of spatial variables are summarized along the corresponding line segments. As a result, the spatial units of response and explanatory variables are identical across the road network. In addition, this method is applied on the scale effect analysis in optimal discretization for segment-based data to select the best length of line segments for segmenting the road network. By involving the geometric and heterogeneity characteristics of segment-based data, the optimal discretization processes can reflect the spatial patterns and characteristics of explanatory variables and the real conditions of pavement engineering.
In addition, to the best of our knowledge, this is the first study utilizing the geographical detector to address industrial and engineering problems. Results show that the segment-based geographical detector is suitable and practical in addressing industrial problems with line segment spatial data, such as assessing pavement infrastructure performance. The key reason is that no linear assumptions are required to both response and potential explanatory variables for the geographical detector in exploring their interrelationships [40]. Meanwhile, both continuous and category spatial data can be used as explanatory variables in spatial stratified heterogeneity analysis, where continuous data are discretized. These characteristics of the geographical detector enable the wide prospects for its application on addressing industrial and engineering problems, and providing quantitative and accurate spatial analysis results for road maintenance decision-making.
Finally, the geographical detector provides various results at different levels. Exploration of potential variables and their spatially varied impacts on pavement infrastructure performance is critical for understanding current and historical conditions, and appropriate decision-making of road and transportation authorities. It is also a sophisticated issue associated with numerous factors that might have diverse impacts. In the segment-based geographical detector, the relative importance of potential variables is explained by the factor detector and the interactions between variables and between categories are revealed by the interaction detector. The road segments at high or low risk of pavement damage are identified using the risk detector. Thus, researchers and practitioners can use one or several models of geographical detector to address their own problems. Furthermore, comprehensive application of spatial analysis results at different levels is beneficial for an in-depth understanding of the mechanisms of how the factors can affect pavement infrastructure performance.

4.2. Comprehensive Impacts of Climate and Heavy Vehicles

There are three major findings in this study. Vehicles, especially heavy vehicles, and climate and environmental conditions, are two main categories of contributors to pavement damage. In general, engineers and road managers consider that vehicles are the primary contributors to road damage [76]. This study reveals the respective contributions of traffic volumes and vehicle mass. Results show that the vehicle masses have more influence than volumes on pavement infrastructure performance. The contributions of total mass of vehicles and percentage of heavy vehicle mass are 2.01 and 1.31 times the contributions of total volumes of vehicles and percentage of heavy vehicle volume, respectively. Similar results also appear in the relevant studies. For instance, vehicle mass has a cumulative effect on pavement damage [7], and pavement maintenance costs lead by overloaded vehicles are twice the costs of the same vehicles within legal loads [18]. In addition, climate and environmental conditions are usually assumed to be constant in the current and past pavement design and maintenance, but they actually vary at different times and across space. This study indicates that the impacts of climate and environment are significant and the impacts vary on different road segments on the road network. Static assumptions of climate and environmental conditions may result in premature deterioration of pavements [32]. This study also presents that different variables of climate and environmental conditions have relatively different negative impacts on the pavement. Previous studies mainly focus on the impacts of temperature on pavement damage [6,77,78,79,80,81]. For instance, it is estimated that warming temperatures will probably lead to US$13.6, US$19.0 and US$21.8 billion additional costs for pavement maintenance by 2010, 2040 and 2070 under RCP4.5 future climate change scenarios in the US [2]. In some regions that use asphalt pavements, pavement service life will be significantly reduced, due to the increased temperatures and pavement designs that are not adapted to climate change [80]. However, this study shows that the impacts of different indicators, including soil moisture, soil type and precipitation are much greater than the impacts of temperature. Pavements are generally temperature sensitive, but the degrees are different, due to various types of pavements and diverse surrounding environment. In the Wheatbelt region, the impacts of traffic masses and soil moisture are much higher than impacts of temperature on the pavement performance. For temperature variables, mean temperature along road segments is more important than the maximum temperature, minimum temperature and temperature difference. While the impacts from soil deep drainage, soil type and precipitation are 6.24, 4.76 and 4.48 times of the impacts of mean temperature, these factors were seldom considered in previous studies. The variables related to the soil water play an important role in pavement performance, since the hydrological balance is critical for pavement surfaces and the impacts are usually exceeding the expectations [82]. Compared with temperature, soil moisture and soil deep drainage are more directly linked with the performance of road pavement performance, since the strength of pavement materials are greatly affected by soil water. When the pavement materials are dry, they are of high strength, but if the rainfall and soil water penetrate into the pavement materials, the strength of pavements is reduced and the possibility of pavement failure is significantly increased [76,77,81].
In addition, variables of vehicles and heavy vehicles in particular and climate and environmental conditions have significant interactive influence on pavement infrastructure performance. The impacts from the interactions can explain more than half of the pavement damage. Only a few previous studies investigated the interactive or combined impacts of vehicles and climate on pavements, even though multiple variables are used for the prediction of pavement performance [83,84]. For example, experiments performed in Guangzhou, China, indicate that the dynamic behaviors of asphalt pavement structure are largely affected by the coupled loads of different temperature and vehicle masses using a coupling dynamic model [85]. In this study, the interactions between different variables of vehicles and climate are explored and discussed in detail. From the perspective of relative importance measured by Q value, multiple interactions between the category of vehicles and heavy vehicles, and climate and environment, can explain more than half of the pavement damage. The interactions between percentage of heavy vehicle mass and soil type, soil deep drainage, and precipitation, can explain 56.6%, 52.5% and 50.5% of pavement deflections respectively. The interaction between the total mass of vehicles and soil deep drainage explains 54.4% of pavement deflections. The interactions between the percentage of heavy vehicle volume and precipitation, and actual evapotranspiration, explain 53.5% and 51.6% of pavement deflections in the Wheatbelt. Meanwhile, this study shows that the interactions between vehicles and the percentage of heavy vehicles also make significant contributions to pavement damage. The interaction between total volume of vehicles and percentage of heavy vehicle volume, and the interaction between total masses of vehicles and percentage of heavy vehicle mass account for 54.3% and 53.2% of pavement deflections, respectively.
Finally, the impacts of the above two categories of variables are also linked with the local socioeconomic conditions, such as populations that reflect the usage of local road segments. Segment-based spatial stratified heterogeneity analysis reveals that the weighted population within 50 km of road segments contributes to 6.4% of pavement deflection, and its interaction with precipitation can explain 45.3% of pavement deflection. The interaction between population within 1 km of road segments and percentage of heavy vehicle mass explains 40.7% of pavement deflection. Growing population usually leads to multiplied vehicles on the roads and can sharply increase the necessity for freight transportation, which have cumulative impacts on pavement damage [7]. Thus, socioeconomic factors are effective supplements for vehicles and climate variables for explaining the sophisticated problems of pavement damage.

4.3. Practical Recommendations

Based on the spatial analysis results, this study has the following practical recommendations for optimizing and improving pavement design, management, construction and maintenance practices. First, for the design and construction of new roads, data-driven analysis of potential pavement performance should be assessed in terms of the surrounding climate, environment and socio-economic conditions to design the road pavement, such as the pavement service life, materials and thickness of asphalt concrete overlay [86,87]. The quantitative and accurate assessment of pavement performance can avoid underestimation of the burden of road maintenance and overestimation of pavement service life. Next, more attention should be paid to the impacts of climate and surrounding environmental conditions on pavement performance. In general road management and pavement engineering practices, traffic volumes, especially the masses of heavy vehicles are regarded as the primary source of pavement damage [53]. In this study, the spatial segment-based stratified heterogeneity analysis indicates that the contributions of climate and environmental factors are as high as the impacts of vehicles, and they have nonlinearly enhanced interactive impacts on the pavement. Finally, spatial difference needs to be involved in the whole life-cycle of road pavement. The performance of pavement and its factors are significantly varied across the road network. The spatially local identification of pavement performance and the factors benefit for the more accurate and reasonable decision-makings for reducing the impacts of factors and resurfacing costs, and prolonging pavement life.

4.4. Recommendations for Future Research

Even though this research demonstrates the contributions of vehicles and heavy vehicles, climate and environment, socioeconomic factors and the characteristics of roads, and their interactions on pavement damage, more investigations are still required in the future research. Assessing the comprehensive impacts of multi-source factors on pavement infrastructure performance has been a key research area for researchers, engineers and managers since the 1930s [1]. In Australia, 12.9 million dollars was spent in 2015–2016 on the 24-year long Austroads Long Term Pavement Performance Program [88]. In this research, several recommendations are proposed for future research about understanding factors of pavement infrastructure performance. From the perspective of methodology, prediction methods can be considered for spatial stratified heterogeneity analysis, so that future scenarios of pavement infrastructure performance can be predicted based on historical data, which is one of the most important sources of evidence for decision-making of predictive road maintenance. From the perspective of data, more variables can be monitored, collected and analyzed, such as adverse and extreme weather condition data, agriculture, mining and other economic activities data. Studies in other regions are also necessary to reflect the local pavement conditions and potential factors.

5. Conclusions

This study explores the comprehensive impacts of vehicles and heavy vehicles, climate and environment, road characteristics and socioeconomic conditions on pavement infrastructure performance with spatial stratified heterogeneity of segment-based variables. Multi-source data including ground monitored and estimated vehicles data, and satellite remotely sensed climate and environmental data are applied for explaining the potential factors. The approach used in this study has the following advantages. First, the segment-based spatial analysis provides new ideas for spatial analysis of segment geographical data. Different from point and area geographical observation data, indicators of pavement performance are segment data distributed along road segments of the road network. Segment-based optimal discretization is used to discretize segment-based pavement data on the road network and applied on a segment-based geographical detector. Second, the methodology in this study can objectively reveal the spatial associations between pavement performance and explanatory variables. Third, compared with commonly used linear statistical models for the exploration of pavement performance factors, the segment-based spatial stratified heterogeneity analysis can accurately quantify the spatial associations and the geographically local impacts.
Spatial analysis reveals that vehicles and climate variables are the major factors associated with pavement damage, where the variables having the largest relative importance include total masses of vehicles, soil deep drainage, percentage of heavy vehicle mass, total volume of vehicles, soil type and precipitation. Vehicle masses have more influence than volumes. The contributions of total mass of vehicles and percentage of heavy vehicle mass are 2.01 and 1.31 times the contributions of total volumes of vehicles and percentage of heavy vehicle volume, respectively. Meanwhile, the impacts from soil deep drainage, soil type and precipitation are 6.24, 4.76 and 4.48 times the impacts of mean temperature on pavement damage, but these factors are rarely considered. Instead, temperature has been a commonly used as an indicator of climate in previous studies. In this research, soil and precipitation have more influence on pavement infrastructure performance than temperature, which may be linked with the temperature insensitive pavements on some roads in the Wheatbelt region. The interactions between variables of vehicles and heavy vehicles and variables of climate and environmental conditions have significant influence on pavement infrastructure performance, which can explain more than half of the pavement damage. Population density also have impacts on pavement performance to some extent, but the impacts of attributes of road itself are limited. Nowadays pavement practices in developed countries focus more on maintenance and renewal. Remote sensing based large spatial scale analysis is increasingly required for road infrastructure studies. The findings provide quantitative contributions of variables on pavement performance, so the variations of pavement performance that are affected by variables needs to be considered in the practical decision-making for road design, construction and maintenance.

Supplementary Materials

The following are available online at https://www.mdpi.com/2072-4292/10/11/1696/s1, Figure S1: Levels of risk within sub-regions of variables within the category of all vehicles and heavy vehicles, Figure S2: Levels of risk within sub-regions of variables within the category of climate and environmental factors, Figure S3: Levels of risk within sub-regions of variables within the category of road characteristics, Figure S4: Levels of risk within sub-regions of variables within the category of socioeconomic factors.

Author Contributions

Conceptualization, Y.S., G.W., D.T., T.M., Q.L. and X.W.; Data curation, Y.S. and S.J.L.; Formal analysis, Y.S.; Funding acquisition, P.W. and X.W.; Methodology, Y.S.; Project administration, P.W. and X.W.; Software, Y.S.; Supervision, G.W., D.T. and X.W.; Writing–original draft, Y.S.; Writing–review and editing, Y.S., G.W., P.W., T.M., Q.L. and S.J.L.

Funding

This research was funded by the Australian Research Council Linkage Project (grant number No. LP140100873), the Australia Research Council Discovery Early Career Researcher Award (grant number No. DE170101502) and the Australian Research Council Discovery Projects (grant numbers No. DP180104026 and No. DP170104613).

Acknowledgments

We would like to thank Brett Belstead, Les Marchant, Neil Trethowen, Steve Atkinson and Wayne Cannell from Main Roads Western Australia for providing their practical experiences in remote sensing data application, pavement engineering, road maintenance and road asset management.

Conflicts of Interest

The authors have declared that they have no completing interests.

References

  1. Main Roads Western Australia. Road Maintenance: Issues and Directions; Main Roads Western Australia: Perth, Australia, 1996.
  2. Underwood, B.S.; Guido, Z.; Gudipudi, P.; Feinberg, Y. Increased costs to us pavement infrastructure from future temperature rise. Nat. Clim. Chang. 2017, 7, 704. [Google Scholar] [CrossRef]
  3. Commonwealth Grants Commission—Australian Government. Australian Local Governments Association, Study of Local Roads Funding in Australia 1999–00 to 2019–20, 2010; Commonwealth Grants Commission: Braddon, Australia, 2011.
  4. Department of Infrastructure and Transport—Australia Government. Public Road-Related Expenditure and Revenue in Australia; Department of Infrastructure and Transport: Canberra, Australia, 2011.
  5. Department of Infrastructure and Regional Development—Australia Government. Australian Infrastructure Statistics Yearbook 2017; Department of Infrastructure and Regional Development: Canberra, Australia, 2017.
  6. Neumann, J.E.; Price, J.; Chinowsky, P.; Wright, L.; Ludwig, L.; Streeter, R.; Jones, R.; Smith, J.B.; Perkins, W.; Jantarasami, L. Climate change risks to us infrastructure: Impacts on roads, bridges, coastal development, and urban drainage. Clim. Chang. 2015, 131, 97–109. [Google Scholar] [CrossRef]
  7. Ede, A.N. Cumulative damage effects of truck overloads on nigerian road pavement. Int. J. Civ. Environ. Eng. 2014, 14, 21–26. [Google Scholar]
  8. Wang, T.; Wang, J.; Wu, P.; Wang, J.; He, Q.; Wang, X. Estimating the environmental costs and benefits of demolition waste using life cycle assessment and willingness-to-pay: A case study in Shenzhen. J. Clean. Prod. 2018, 172, 14–26. [Google Scholar] [CrossRef]
  9. Salour, F.; Erlingsson, S. Investigation of a pavement structural behaviour during spring thaw using falling weight deflectometer. Road Mater. Pavement Des. 2013, 14, 141–158. [Google Scholar] [CrossRef]
  10. Flintsch, G.; Katicha, S.; Bryce, J.; Ferne, B.; Nell, S.; Diefenderfer, B. Assessment of Continuous Pavement Deflection Measuring Technologies; The National Academies Press: Washington, DC, USA, 2013. [Google Scholar]
  11. Bridgelall, R. Connected vehicle approach for pavement roughness evaluation. J. Infrastruct. Syst. 2013, 20, 04013001. [Google Scholar] [CrossRef]
  12. Shah, Y.U.; Jain, S.; Tiwari, D.; Jain, M. Development of overall pavement condition index for urban road network. Procedia-Soc. Behav. Sci. 2013, 104, 332–341. [Google Scholar] [CrossRef]
  13. Solla, M.; Lagüela, S.; González-Jorge, H.; Arias, P. Approach to identify cracking in asphalt pavement using gpr and infrared thermographic methods: Preliminary findings. NDT E Int. 2014, 62, 55–65. [Google Scholar] [CrossRef]
  14. Yang, Q.; Deng, Y. Evaluation of cracking in asphalt pavement with stabilized base course based on statistical pattern recognition. Int. J. Pavement Eng. 2017, 1–8. [Google Scholar] [CrossRef]
  15. Smith, K.; Peshkin, D. Pavement preservation on high-traffic-volume roadways. Transp. Res. Rec. 2011, 54–65. [Google Scholar] [CrossRef]
  16. Steenkamp, A.; Berman, R.; Benade, R. Modelling the vertical uniform contact stress of heavy vehicle tyres: Transportation engineering. Civ. Eng. 2016, 24, 52–56. [Google Scholar]
  17. Lee, K.W.; Peckham, W.L. Assessment of Damage Caused to Pavements by Heavy Trucks in New England. Transp. Res. Rec. 1990, 1286, 164–172. [Google Scholar]
  18. Pais, J.C.; Amorim, S.I.; Minhoto, M.J. Impact of traffic overload on road pavement performance. J. Transp. Eng. 2013, 139, 873–879. [Google Scholar] [CrossRef]
  19. Van Cauwenberg, J.; Clarys, P.; De Bourdeaudhuij, I.; Ghekiere, A.; de Geus, B.; Owen, N.; Deforche, B. Environmental influences on older adults’ transportation cycling experiences: A study using bike-along interviews. Landsc. Urban Plan. 2018, 169, 37–46. [Google Scholar] [CrossRef]
  20. Gao, Y.; Babin, N.; Turner, A.J.; Hoffa, C.R.; Peel, S.; Prokopy, L.S. Understanding urban-suburban adoption and maintenance of rain barrels. Landsc. Urban Plan. 2016, 153, 99–110. [Google Scholar] [CrossRef]
  21. Lillesand, T.; Kiefer, R.W.; Chipman, J. Remote Sensing and Image Interpretation; John Wiley & Sons: Hoboken, NJ, USA, 2014. [Google Scholar]
  22. Lukanen, E.O.; Stubstad, R.; Briggs, R. Temperature Predictions and Adjustment Factors for Asphalt Pavement; Turner-Fairbank Highway Research Center, Federal Highway Administration, United States Department of Transportation: McLean, VA, USA, 2000.
  23. Yu, H.; Khazanovich, L.; Darter, M.; Ardani, A. Analysis of concrete pavement responses to temperature and wheel loads measured from Intrumented slabs. Transp. Res. Rec. 1998, 1, 94–101. [Google Scholar] [CrossRef]
  24. Mohd Hasan, M.R.; Hiller, J.E.; You, Z. Effects of mean annual temperature and mean annual precipitation on the performance of flexible pavement using me design. Int. J. Pavement Eng. 2016, 17, 647–658. [Google Scholar] [CrossRef]
  25. Yin, J.; Soleimanbeigi, A.; Likos, W.J.; Edil, T.B. Effects of temperature on creep behavior of compacted recycled asphalt pavement. J. Geotech. Geoenviron. Eng. 2016, 143, 06016028. [Google Scholar] [CrossRef]
  26. Fletcher, C.G.; Matthews, L.; Andrey, J.; Saunders, A. Projected changes in mid-twenty-first-century extreme maximum pavement temperature in Canada. J. Appl. Meteorol. Climatol. 2016, 55, 961–974. [Google Scholar] [CrossRef]
  27. Mndawe, M.; Ndambuki, J.; Kupolati, W.; Badejo, A. Assessment of the effects of climate change on the performance of pavement subgrade. Afr. J. Sci. Technol. Innov. Dev. 2015, 7, 111–115. [Google Scholar] [CrossRef]
  28. Chatti, K.; Kutay, M.E.; Lajnef, N.; Zaabar, I.; Varma, S.; Lee, H.S. Enhanced Analysis of Falling Weight Deflectometer Data for Use with Mechanistic-Empirical Flexible Pavement Design and Analysis and Recommendations for Improvements to Falling Weight Deflectometers; Turner-Fairbank Highway Research Center: McLean, VA, USA, 2017.
  29. Gu, F.; Zhang, Y.; Luo, X.; Sahin, H.; Lytton, R.L. Characterization and prediction of permanent deformation properties of unbound granular materials for pavement me design. Construct. Build. Mater. 2017, 155, 584–592. [Google Scholar] [CrossRef]
  30. Yang, X.; You, Z.; Hiller, J.; Watkins, D. Sensitivity of flexible pavement design to Michigan’s climatic inputs using pavement me design. Int. J. Pavement Eng. 2017, 18, 622–632. [Google Scholar] [CrossRef]
  31. Priest, A.L.; Timm, D.H. Methodology and Calibration of Fatigue Transfer Functions for Mechanistic Empirical Flexible Pavement Design; NCAT: Greensboro, NC, USA, 2006. [Google Scholar]
  32. Li, B.Q.; Mills, L.; McNeil, S. The Implications of Climate Change on Pavement Performance and Design; University of Delaware University Transportation Center: Newark, DE, USA, 2011. [Google Scholar]
  33. Caliendo, C.; Guida, M.; Pepe, E. Seemingly unrelated regression equations for developing a pavement performance model. Mod. Appl. Sci. 2015, 9, 199. [Google Scholar] [CrossRef]
  34. Song, Y.; Wang, X.; Tan, Y.; Wu, P.; Sutrisna, M.; Cheng, J.C.; Hampson, K. Trends and opportunities of bim-gis integration in the architecture, engineering and construction industry: A review from a spatio-temporal statistical perspective. ISPRS Int. J. Geo-Inf. 2017, 6, 397. [Google Scholar] [CrossRef]
  35. Song, Y.; Ge, Y.; Wang, J.; Ren, Z.; Liao, Y.; Peng, J. Spatial distribution estimation of malaria in northern China and its scenarios in 2020, 2030, 2040 and 2050. Malar. J. 2016, 15, 345. [Google Scholar] [CrossRef] [PubMed]
  36. Ge, Y.; Song, Y.; Wang, J.; Liu, W.; Ren, Z.; Peng, J.; Lu, B. Geographically weighted regression-based determinants of malaria incidences in northern China. Trans. GIS 2017, 21, 934–953. [Google Scholar] [CrossRef]
  37. Song, Y.-Z.; Yang, H.-L.; Peng, J.-H.; Song, Y.-R.; Sun, Q.; Li, Y. Estimating pm2. 5 concentrations in Xi’an city using a generalized additive model with multi-source monitoring data. PLoS ONE 2015, 10, e0142149. [Google Scholar] [CrossRef] [PubMed]
  38. Cai, J.; Huang, B.; Song, Y. Using multi-source geospatial big data to identify the structure of polycentric cities. Remote Sens. Environ. 2017, 202, 210–221. [Google Scholar] [CrossRef]
  39. Song, Y.; Long, Y.; Wu, P.; Wang, X. Are all cities with similar urban form or not? Redefining cities with ubiquitous points of interest and evaluating them with indicators at city and block levels in China. Int. J. Geogr. Inf. Sci. 2018, 32, 2447–2476. [Google Scholar] [CrossRef]
  40. Wang, J.F.; Li, X.H.; Christakos, G.; Liao, Y.L.; Zhang, T.; Gu, X.; Zheng, X.Y. Geographical detectors-based health risk assessment and its application in the neural tube defects study of the Heshun region, China. Int. J. Geogr. Inf. Sci. 2010, 24, 107–127. [Google Scholar] [CrossRef]
  41. Ge, E.; Zhang, R.; Li, D.; Wei, X.; Wang, X.; Lai, P.-C. Estimating risks of inapparent avian exposure for human infection: Avian influenza virus a (h7n9) in Zhejiang province, China. Sci. Rep. 2017, 7, 40016. [Google Scholar] [CrossRef] [PubMed]
  42. Gao, B.; Lu, A.; Pan, Y.; Huo, L.; Gao, Y.; Li, X.; Li, S.; Chen, Z. Additional sampling layout optimization method for environmental quality grade classifications of farmland soil. IEEE J. Sel. Top. Appl. Earth Obs. Remote Sens. 2017, 10, 5350–5358. [Google Scholar] [CrossRef]
  43. Fang, Y.; Wang, L.; Ren, Z.; Yang, Y.; Mou, C.; Qu, Q. Spatial heterogeneity of energy-related CO2 emission growth rates around the world and their determinants during 1990–2014. Energies 2017, 10, 367. [Google Scholar] [CrossRef]
  44. Zhou, C.; Chen, J.; Wang, S. Examining the effects of socioeconomic development on fine particulate matter (pm 2.5) in China’s cities using spatial regression and the geographical detector technique. Sci. Total Environ. 2018, 619, 436–445. [Google Scholar] [CrossRef] [PubMed]
  45. Yang, S.; Hu, S.; Li, W.; Zhang, C.; Torres, J.A. Spatiotemporal effects of main impact factors on residential land price in major cities of China. Sustainability 2017, 9, 2050. [Google Scholar] [CrossRef]
  46. Wang, J. Geodetector and Its Applications in Environmental and Social Sciences; State Key Laboratory of Resource & Environmental Information System, Institute of Geographical Science & Nature Resources Research, Chinese Academy of Sciences: Beijing, China, 2017. [Google Scholar]
  47. Wang, J.-F.; Zhang, T.-L.; Fu, B.-J. A measure of spatial stratified heterogeneity. Ecol. Indic. 2016, 67, 250–256. [Google Scholar] [CrossRef] [Green Version]
  48. Ju, H.; Zhang, Z.; Zuo, L.; Wang, J.; Zhang, S.; Wang, X.; Zhao, X. Driving forces and their interactions of built-up land expansion based on the geographical detector—A case study of Beijing, China. Int. J. Geogr. Inf. Sci. 2016, 30, 2188–2207. [Google Scholar] [CrossRef]
  49. Chong, H.Y.; Lopez, R.; Wang, J.; Wang, X.; Zhao, Z. Comparative analysis on the adoption and use of bim in road infrastructure projects. J. Manag. Eng. 2016, 32, 05016021. [Google Scholar] [CrossRef]
  50. Main Roads Western Australia. Falling Weight Deflectometer. Available online: https://www.mainroads.wa.gov.au/BuildingRoads/StandardsTechnical/MaterialsEngineering/Pages/Falling_Weight_Deflectometer.aspx (accessed on 30 January 2018).
  51. Main Roads Western Australia. Calibration of Falling Weight Deflectometers, Calibration Method Wa 2060.5; Main Roads Western Australia: Perth, Australia, 2017.
  52. Main Roads Western Australia. Main Roads Western Australia—Annual Report 2015; Main Roads Western Australia: Perth, Australia, 2015.
  53. Song, Y.; Wang, X.; Wright, G.; Thatcher, D.; Wu, P.; Felix, P. Traffic volume prediction with segment-based regression kriging and its implementation in assessing the impact of heavy vehicles. IEEE Trans. Intell. Transp. Syst. 2018. [Google Scholar] [CrossRef]
  54. Bureau of Meteorology Australian Government. Australian Landscape Water Balance. Available online: http://www.bom.gov.au/water/landscape (accessed on 30 May 2017).
  55. Jones, D.A.; Wang, W.; Fawcett, R. High-quality spatial climate data-sets for Australia. Aust. Meteorol. Ocean 2009, 58, 233. [Google Scholar] [CrossRef]
  56. Wan, Z.; Hook, S.; Hulley, G. Mod11a2 Modis/Terra Land Surface Temperature/Emissivity 8-Day l3 Global 1 Km sin Grid v006; NASA EOSDIS Land Processes DAAC, USGS Earth Resources Observation and Science (EROS) Center: Sioux Falls, SD, USA, 2015; 10. Available online: https://lpdaac.usgs.gov/dataset_discovery/modis/modis_products_table/mod11a2_v006 (accessed on 16 June 2016).
  57. Ashton, L.; McKenzie, N. Conversion of the Atlas of Australian Soils to the Australian Soil Classification; CSIRO Land and Water: Acton, Australia, 2001. [Google Scholar]
  58. State of the Environment in Australia. 2016 Soe Land Australian Soil Classification Orders; State of the Environment in Australia: Canberra, ACT, Australia, 2017.
  59. Johnston, R.; Barry, S.; Bleys, E.; Bui, E.N.; Moran, C.; Simon, D.; Carlile, P.; McKenzie, N.; Henderson, B.; Chapman, G. Asris: The database. Soil Res. 2003, 41, 1021–1036. [Google Scholar] [CrossRef]
  60. Didan, K. MOD13A2 MODIS/Terra Vegetation Indices 16-Day L3 Global 1km SIN Grid V006; NASA EOSDIS Land Processes DAAC, USGS Earth Resources Observation and Science (EROS) Center: Sioux Falls, SD, USA, 2015. Available online: https://lpdaac.usgs.gov/dataset_discovery/modis/modis_products_table/mod13a2_v006 (accessed on 30 January 2017).
  61. NASA. Gridded Population of the World (gpw), v4. Available online: http://beta.sedac.ciesin.columbia.edu/data/set/gpw-v4-population-count-adjusted-to-2015-unwpp-country-totals/data-download (accessed on 30 March 2016).
  62. Department of Transport—The Government of Western Australia. Driver and Vehicle Services, Licensing Fees and Charges; Department of Transport: Perth, WA, Australia, 2016.
  63. Main Roads Western Australia. Prime Mover, Trailer Combinations—Vehicle Categories, Rav 2016; Main Roads Western Australia: Perth, Australia, 2016.
  64. Keese, K.; Scanlon, B.; Reedy, R. Assessing controls on diffuse groundwater recharge using unsaturated flow modeling. Water Resour. Res. 2005, 41. [Google Scholar] [CrossRef] [Green Version]
  65. Gash, J. An analytical model of rainfall interception by forests. Q. J. R. Meteorol. Soc. 1979, 105, 43–55. [Google Scholar] [CrossRef]
  66. Van Dijk, A.; Bruijnzeel, L. Modelling rainfall interception by vegetation of variable density using an adapted analytical model. Part 1. Model description. J. Hydrol. 2001, 247, 230–238. [Google Scholar] [CrossRef]
  67. Mullaney, J.; Lucke, T.; Trueman, S.J. A review of benefits and challenges in growing street trees in paved urban environments. Landsc. Urban Plan. 2015, 134, 157–166. [Google Scholar] [CrossRef]
  68. Main Roads Western Australia. Heavy Vehicle Services—Standard Restricted Access Vehicle (RAV) Route Assessment Guidelines; Main Roads Western Australia: Perth, Australia, 2017.
  69. Main Roads Western Australia. Prime Mover Trailer Combinations and Truck Trailer Combinations. Available online: https://www.mainroads.wa.gov.au/UsingRoads/HeavyVehicles/notices/Pages/default.aspx (accessed on 20 August 2016).
  70. Main Roads Western Australia. Restricted Access Vehicle Networks MRWA. Available online: https://catalogue.data.wa.gov.au/dataset/restricted-access-vehicle-networks-mrwa (accessed on 20 August 2016).
  71. Main Roads Western Australia. Legal Speed Limit (mrwa-520). Available online: https://catalogue.data.wa.gov.au/dataset/rivn-legal-speed-limit (accessed on 30 December 2017).
  72. Song, Y.; Tan, Y.; Song, Y.; Wu, P.; Cheng, J.C.P.; Kim, M.J.; Wang, X. Spatial and temporal variations of spatial population accessibility to public hospitals: A case study of rural-urban comparison. GISci. Remote Sens. 2018. [Google Scholar] [CrossRef]
  73. Jelinski, D.E.; Wu, J. The modifiable areal unit problem and implications for landscape ecology. Landsc. Ecol. 1996, 11, 129–140. [Google Scholar] [CrossRef]
  74. Fischer, M.M.; Wang, J. Spatial Data Analysis: Models, Methods and Techniques; Springer Science & Business Media: Berlin, Germany, 2011. [Google Scholar]
  75. Cao, F.; Ge, Y.; Wang, J.-F. Optimal discretization for geographical detectors-based risk assessment. GISci. Remote Sens. 2013, 50, 78–92. [Google Scholar] [CrossRef]
  76. Cebon, D. Theoretical road damage due to dynamic tyre forces of heavy vehicles Part 1: Dynamic analysis of vehicles and road surfaces. Proc. Inst. Mech. Eng. Part C 1988, 202, 103–108. [Google Scholar] [CrossRef]
  77. Chinowsky, P.S.; Price, J.C.; Neumann, J.E. Assessment of climate change adaptation costs for the US road network. Glob. Environ. Chang. 2013, 23, 764–773. [Google Scholar] [CrossRef]
  78. Chinowsky, P.; Schweikert, A.; Strzepek, N.; Manahan, K.; Strzepek, K.; Schlosser, C.A. Climate change adaptation advantage for african road infrastructure. Clim. Chang. 2013, 117, 345–361. [Google Scholar] [CrossRef]
  79. Byram, D.; Xiao, D.X.; Wang, K.C.; Hall, K.D. Sensitivity Analysis of Climatic Influence on Mepdg Flexible Pavement Performance Predictions. In Proceedings of the Transportation Research Board 91st Annual Meeting, Washington, DC, USA, 22–26 January 2012. [Google Scholar]
  80. Qiao, Y.; Flintsch, G.; Dawson, A.; Parry, T. Examining effects of climatic factors on flexible pavement performance and service life. Transp. Res. Rec. 2013, 2349, 100–107. [Google Scholar] [CrossRef]
  81. Chen, Y.; Wang, X.; Jiang, B.; Wen, Z.; Yang, N.; Li, L. Tree survival and growth are impacted by increased surface temperature on paved land. Landsc. Urban Plan. 2017, 162, 68–79. [Google Scholar] [CrossRef]
  82. Timm, A.; Kluge, B.; Wessolek, G. Hydrological balance of paved surfaces in moist mid-latitude climate—A review. Landsc. Urban Plan. 2018, 175, 80–91. [Google Scholar] [CrossRef]
  83. Bianchini, A.; Bandini, P. Prediction of pavement performance through neuro-fuzzy reasoning. Comput.-Aided Civ. Infrastruct. Eng. 2010, 25, 39–54. [Google Scholar] [CrossRef]
  84. Marcelino, P.; Lurdes Antunes, M.d.; Fortunato, E. Comprehensive performance indicators for road pavement condition assessment. Struct. Infrastruct. Eng. 2018, 1–13. [Google Scholar] [CrossRef]
  85. Xue, Q.; Liu, L.; Zhao, Y.; Chen, Y.-J.; Li, J.-S. Dynamic behavior of asphalt pavement structure under temperature-stress coupled loading. Appl. Therm. Eng. 2013, 53, 1–7. [Google Scholar] [CrossRef]
  86. Wang, Y. Ordinal logistic regression model for predicting ac overlay cracking. J. Perform. Construct. Facil. 2012, 27, 346–353. [Google Scholar] [CrossRef]
  87. Wen, Y.; Wang, Y.; Zhao, K.; Sumalee, A. The use of natural rubber latex as a renewable and sustainable modifier of asphalt binder. Int. J. Pavement Eng. 2017, 18, 547–559. [Google Scholar] [CrossRef]
  88. Austroads Ltd. Austroads Annual Report 2015–16; Austroads Ltd.: Sydney, Australia, 2016. [Google Scholar]
Figure 1. Study area and spatial distribution of pavement deflections across road network.
Remotesensing 10 01696 g001
Figure 2. Spatial distribution of explanatory variables of pavement infrastructure performance. (a) Part 1; (b) part 2.
Remotesensing 10 01696 g002
Figure 3. Schematic overview of assessing impacts of climate and heavy vehicles on pavement infrastructure performance with segment-based spatial stratified heterogeneity analysis.
Remotesensing 10 01696 g003
Figure 4. Scale effects of line segment length on Q values (A), and ranks of variables (B).
Remotesensing 10 01696 g004
Figure 5. Process of selecting the best combinations of discretization methods and number of interactions for continuous variables.
Remotesensing 10 01696 g005
Figure 6. Results of optimal discretization of continuous variables.
Remotesensing 10 01696 g006
Figure 7. Relative importance of potential variables explored by factor detector.
Remotesensing 10 01696 g007
Figure 8. Relative importance of interactions of variables and categories derived by interaction detector.
Remotesensing 10 01696 g008
Figure 9. Levels of risks within sub-regions of variables with top six Q values and the corresponding spatial distributions of pavement performance at high or low risks.
Remotesensing 10 01696 g009
Table 1. Descriptions of explanatory variables of pavement infrastructure performance.
CategoryNo.CodeName (Unit)Data Source
Vehicles and heavy vehicles (C1)1vlmsumTotal volume of vehiclesMain Roads Western Australia [52] and calculating using segment-based regression kriging methods [53].
2pcthvvlmPercentage of heavy vehicle volume (%)
3masssumTotal mass of vehicles (t/(km·day)
4pcthvmassPercentage of heavy vehicle mass (%)
Climate and environment (C2)5apAnnual precipitation (mm)Bureau of Meteorology, Australia [54,55].
6maxtempAnnual maximum temperature (°C)Land surface temperature (LST) MOD11A2 from Moderate Resolution Imaging Spectroradiometer (MODIS) [56].
7mintempAnnual minimum temperature (°C)
8meantempAnnual mean temperature (°C)
9tempdifAnnual temperature difference (°C)
10soiltype 1Soil type2016 State of the Environment (SoE) Land Australian Soil Classification Orders dataset [57,58].
11rzsmRoot-zone soil moisture (%)Bureau of Meteorology, Australia, and the Australian Soil Resources Information System (ASRIS) dataset [54,59].
12usmUpper soil moisture (%)
13lsmLower soil moisture (%)
14dsmDeep soil moisture (%)
15ddDeep drainage (mm)
16aeActual evapotranspiration (mm)
17eviEnhanced vegetation index (EVI)Enhanced vegetation index (EVI) MOD13A2 from Moderate Resolution Imaging Spectroradiometer (MODIS) [60].
Road characteristics (C3)18ravnw 1Restricted access vehicles (RAV) networkMain Roads Western Australia.
19speed 1Road speed limit (km/h)
20surftype 1Road surfacing type
Socioeconomic factors (C4)21popbf1Population within 1 kmPopulation data with 1-km spatial resolution is from Gridded Population of the World fourth version (GPWv4) [61].
22popbf5Population within 5 km
23popbf10Population within 10 km
24wpopWeighted population within 50 km
1 The marked variables are categorical variables, and other variables are continuous variables.
Table 2. Summary of best discretization methods and numbers of intervals for continuous variables.
No.CodeMinMaxMethodNumber of Intervals
1vlmsum1005105standard deviation (SD)7
2pcthvvlm6.156.4quantile6
3masssum1780.1138,391.3equal6
4pcthvmass67.598.0quantile7
5ap237.6761.8geometric7
6maxtemp20.733.9SD6
7mintemp9.815.4natural6
8meantemp16.424.0geometric4
9tempdif8.620.6SD6
10soiltypeCategorical variable, including Calcarosol, Chromosol, Hydrosol, Kandosol, Podosol, Rudosol, Sodosol and Tenosol.8
11rzsm4.6433.11equal6
12usm1.9610.43natural7
13lsm4.1237.33equal6
14dsm9.8454.31equal5
15dd0.5179.3natural7
16ae239.3807.4equal5
17evi0.040.38SD6
18ravnwCategorical variable, including 3, 4, 5, 6, 7 and 10.6
19speedCategorical variable, including 50, 60, 70, 80, 90, 100 and 110 (km/h).7
20surftypeCategorical variable, including single seal, two coat seal, slurry seal, primer seal, asphalt dense graded, asphalt intersection mix, rubberized seal and asphalt open graded.8
21popbf112490geometric7
22popbf5136946geometric7
23popbf104912,422quantile6
24wpop82787geometric7
Table 3. Interactions between variables of pavement deflections (top 20 interactions).
Category C1 1C2 2
Variablevlmsumpcthvvlmmasssumpcthvmassapdd
C1vlmsum
pcthvvlm0.543 *,3
masssum 0.451
pcthvmass0.457 0.532
C2ap 0.535 0.505
soiltype 0.4810.4640.566 *
dd 0.4960.5440.525
ae 0.516 0.435
C4 4popbf1 0.407 *
popbf5 0.393
wpop0.3850.384 0.453 *0.423
1 C1: Vehicles and heavy vehicles; 2 C2: Climate and environment; 3,* indicates the largest interaction within each category, including C1∩C1, C1∩C2, C1∩C4, and C2∩C4; 4 C4: Socioeconomic factors.
Table 4. Definitions and descriptions of pavement infrastructure performance risk levels.
Level of RiskDescription
Very high riskRoad segments within the sub-region of the highest risk of pavement deflections.
High riskRoad segments within the sub-region of the second highest risk of pavement deflections.
Medium riskRoad segments within the sub-regions of median risks of pavement deflections, and outside of other levels of risks.
Low riskRoad segments within the sub-region of the second lowest risk of pavement deflections.
Very low riskRoad segments within the sub-region of the lowest risk of pavement deflections.

