Article

Towards Operational Satellite-Based Damage-Mapping Using U-Net Convolutional Network: A Case Study of 2011 Tohoku Earthquake-Tsunami

International Research Institute of Disaster Science, Tohoku University, Aoba 468-1-E301, Aramaki, Aoba-ku, Sendai 980-8572, Japan
*
Author to whom correspondence should be addressed.
Remote Sens. 2018, 10(10), 1626; https://doi.org/10.3390/rs10101626
Submission received: 1 September 2018 / Revised: 3 October 2018 / Accepted: 5 October 2018 / Published: 12 October 2018
(This article belongs to the Section Remote Sensing Image Processing)

Abstract

:
The satellite remote-sensing-based damage-mapping technique has played an indispensable role in rapid disaster response practice, whereas the current disaster response practice remains subject to the low damage assessment accuracy and lag in timeliness, which dramatically reduces the significance and feasibility of extending the present method to practical operational applications. Therefore, a highly efficient and intelligent remote-sensing image-processing framework is urgently required to mitigate these challenges. In this article, a deep learning algorithm for the semantic segmentation of high-resolution remote-sensing images using the U-net convolutional network was proposed to map the damage rapidly. The algorithm was implemented within a Microsoft Cognitive Toolkit framework in the GeoAI platform provided by Microsoft. The study takes the 2011 Tohoku Earthquake-Tsunami as a case study, for which the pre- and post-disaster high-resolution WorldView-2 image is used. The performance of the proposed U-net model is compared with that of deep residual U-net. The comparison highlights the superiority U-net for tsunami damage mapping in this work. Our proposed method achieves the overall accuracy of 70.9% in classifying the damage into “washed away,” “collapsed,” and “survived” at the pixel level. In future disaster scenarios, our proposed model can generate the damage map in approximately 2–15 min when the preprocessed remote-sensing datasets are available. Our proposed damage-mapping framework has significantly improved the application value in operational disaster response practice by substantially reducing the manual operation steps required in the actual disaster response. Besides, the proposed framework is highly flexible to extend to other scenarios and various disaster types, which can accelerate operational disaster response practice.

Graphical Abstract

1. Introduction

In recent years, mega natural disasters such as the 2011 Tohoku Earthquake-Tsunami and 2004 Sumatra Earthquake Tsunami have frequently hit the world [1,2,3] and are considered some of the primary tremendous and tragic threats to the safety of human life and property [4]. The increased awareness of the role of rapid damage assessment in post-disaster response to reduce the damage losses and casualties has raised much attention in implementing satellite-based methods to monitor the disaster damage information [5,6,7]. Considering the high timeliness requirements of disaster emergency response, high-precision and efficient damage estimation methods at a fine scale to support the response are urgently required.
The implementation of streamlined, efficient damage assessment is critical in operational disaster response. There is an ongoing lag with existing damaged assessment methods considering the timeliness and accuracy [8]. To grasp the damage situation, the current practice largely relies on the field survey and social media report. Since late 2017, DigitalGlobe’s open data program has provided a dedicated stream of accurate high-resolution satellite imagery to support large-scale disaster response activities worldwide [9], which provides a good opportunity for developing a satellite-based method to map the damage. Visual interpretation of the damage from the satellite imagery has been widely used in practice for damage assessment for a long time because of its high precision [10,11]. However, this method is time-consuming, particularly if the affected areas are notably large.
Therefore, studies about automatically detect the damage information from remote-sensing imagery have spurred much interest. The most typical method is image enhancement based on the change detection technology. The images collected before and after a disaster event are precisely co-registered and subtracted to generate a difference image, which represents the change between the two temporal datasets. The detection of building damage is based on the changes in shape [12], brightness [13] or texture [14]. The method is notably straightforward. However, the limitation of this method is the arbitrarily selected features, which may not be generalized to other scenarios. In such a circumstance, machine learning methods were introduced and made significant progress [15,16]. The advantage of machine learning methods is that they can make full use of multidimensional features to achieve better accuracy. Consequently, the advanced change detection algorithms to identify the building damage are promoted, although these initiatives are represented by sophisticated procedures that are not suitable to implement in real disaster practice [17,18]. To make the delivered damage-mapping product more reliable and of a great reference value, a more generalized model should be developed. For example, Anniballe et al. (2018) proposed a method to assess the individual earthquake damaged buildings in a broad area using pre-event and a post-event very-high-resolution optical image. In this work, a straightforward supervised machine learning framework is proposed [17]. However, the method is a time-consuming high-dimensional feature extraction and selection procedure, which is not practical for disaster response considering the time cost. In addition, the selected features may only be suitable for earthquake scenarios of specific damage patterns, which dramatically increases the difficulty in promoting the model for other situations and damages.
The deep learning method, which is represented by automatic feature extraction and selection, has achieved state-of-the-art performance in various remote-sensing-based damage assessment applications [8,19,20]. Convolutional neural networks have outperformed the state of the art in many remote-sensing image recognition tasks, but from the perspective of operational disaster response, many challenges remain.
(1)
The superior performance of deep learning algorithms is limited to the size of the available training sets and the size of the considered networks. One of the most significant challenges for applying the deep learning technique to disaster damage-mapping practice is that thousands of training images of damaged targets are commonly beyond reach in disaster tasks, which is particularly true for earthquakes and landslides, where only a few samples are available [21]. Therefore, an algorithm that works with notably few training samples and yields more precise results is highly in demand.
(2)
The previous method mainly focuses on assessing the accuracy of deep learning algorithms in classifying the damage from remote-sensing images [22,23,24,25]. Although damage assessment is essential and indispensable because it can improve our perception of which algorithm or scheme can achieve the best accuracy and should be used for damage-mapping practice, from this viewpoint, the damage assessment is a more theoretical argumentation. To satisfy the requirements of disaster emergency response, a framework that integrates accuracy assessment and damage-mapping is urgently needed. The scientific value of previous works is significantly reduced because they only focus on the damage assessment without providing the damage-mapping demonstration, and many manual steps must be implemented to successfully derive the damage-mapping results of these methods, which is impractical in disaster response considering the time cost.
(3)
The mainstream application of convolutional neural networks is on classification tasks, where the output to an image is a single class label. However, in many real application tasks, the desired output should also include localization, which requires that the algorithm can assign the output class label into specific pixels [26]. Damage-mapping is a task that highly depends on the location information, whereas the framework proposed in previous work can only output the label of tiles, and the label information requires an additional procedure to project to a map [5,22,24]. This lag or gap dramatically increases the time cost of the actual disaster response.
(4)
The accuracy of the class label has a significant effect on the accuracy. The previous method mostly uses the patch-based label, where a single label is assigned to a large patch [5,22]. However, this patch contains many unrelated pixels. Theoretically, the pixel-based labelling method [25] is more precise. However, it has not been applied to the practice of damage-mapping.
(5)
To rapidly respond to a disaster, a high-efficiency commercial platform that can implement our deep learning algorithm and visualize the geospatial-based damage-mapping products is highly required.
Fortunately, the U-Net convolutional network [26], which is the so-called fully convolutional network, is an excellent network that can perfectly mitigate challenges (1), (2), (3) and (4). U-Net uses a sliding-window setup to predict the class label of each pixel by providing a local region (patch) around that pixel while generating a much more substantial amount of training data. It works with notably few training images and yields more precise semantic segmentation [27] with the location information. In addition, on 7 March 2018, Microsoft and Esri launched Geospatial AI (GeoAI) on Azure [28], which provides a platform that integrates geospatial information with deep learning algorithms and powerful visualization, which can enable unique insights to challenge (5) and can make a breakthrough for the satellite remote-sensing-based intelligent disaster management practice.
To the best of the authors’ knowledge, this paper presents the original solution of implementing the U-net convolutional neural network to map tsunami damage from high-resolution remote-sensing images. For the first time, the pixel-based fine-scale damage-mapping method is proposed; by introducing the U-net network structure, it can resolve the limitation of required training data size to build the model in disaster scenarios, and the model prediction result does not contain the spatial position information. The performance of the U-net network structures to map tsunami damage was quantitatively evaluated. The study attempts to provide a more efficient solution for rapid damage-mapping practice by implementing a deep learning algorithm and damage map visualization through the Microsoft GeoAI platform. The rare 2011 Tohoku Earthquake-Tsunami, which triggered extensive building damage, and Microsoft’s new GeoAI platform provide unique conditions for the implementation of intelligent damage-mapping service-related research. The outline of this paper is as follows. Section 2 introduces the case study 2011 Japan Tohoku Tsunami-Earthquake, related high-resolution optical image and ground-truth data. Section 3 describes the experiment environment, data-processing method, training, evaluation method, and U-net neural network structure in details. The performance of the proposed method in mapping the tsunami damage is described in Section 4, followed by the conclusions in Section 5.

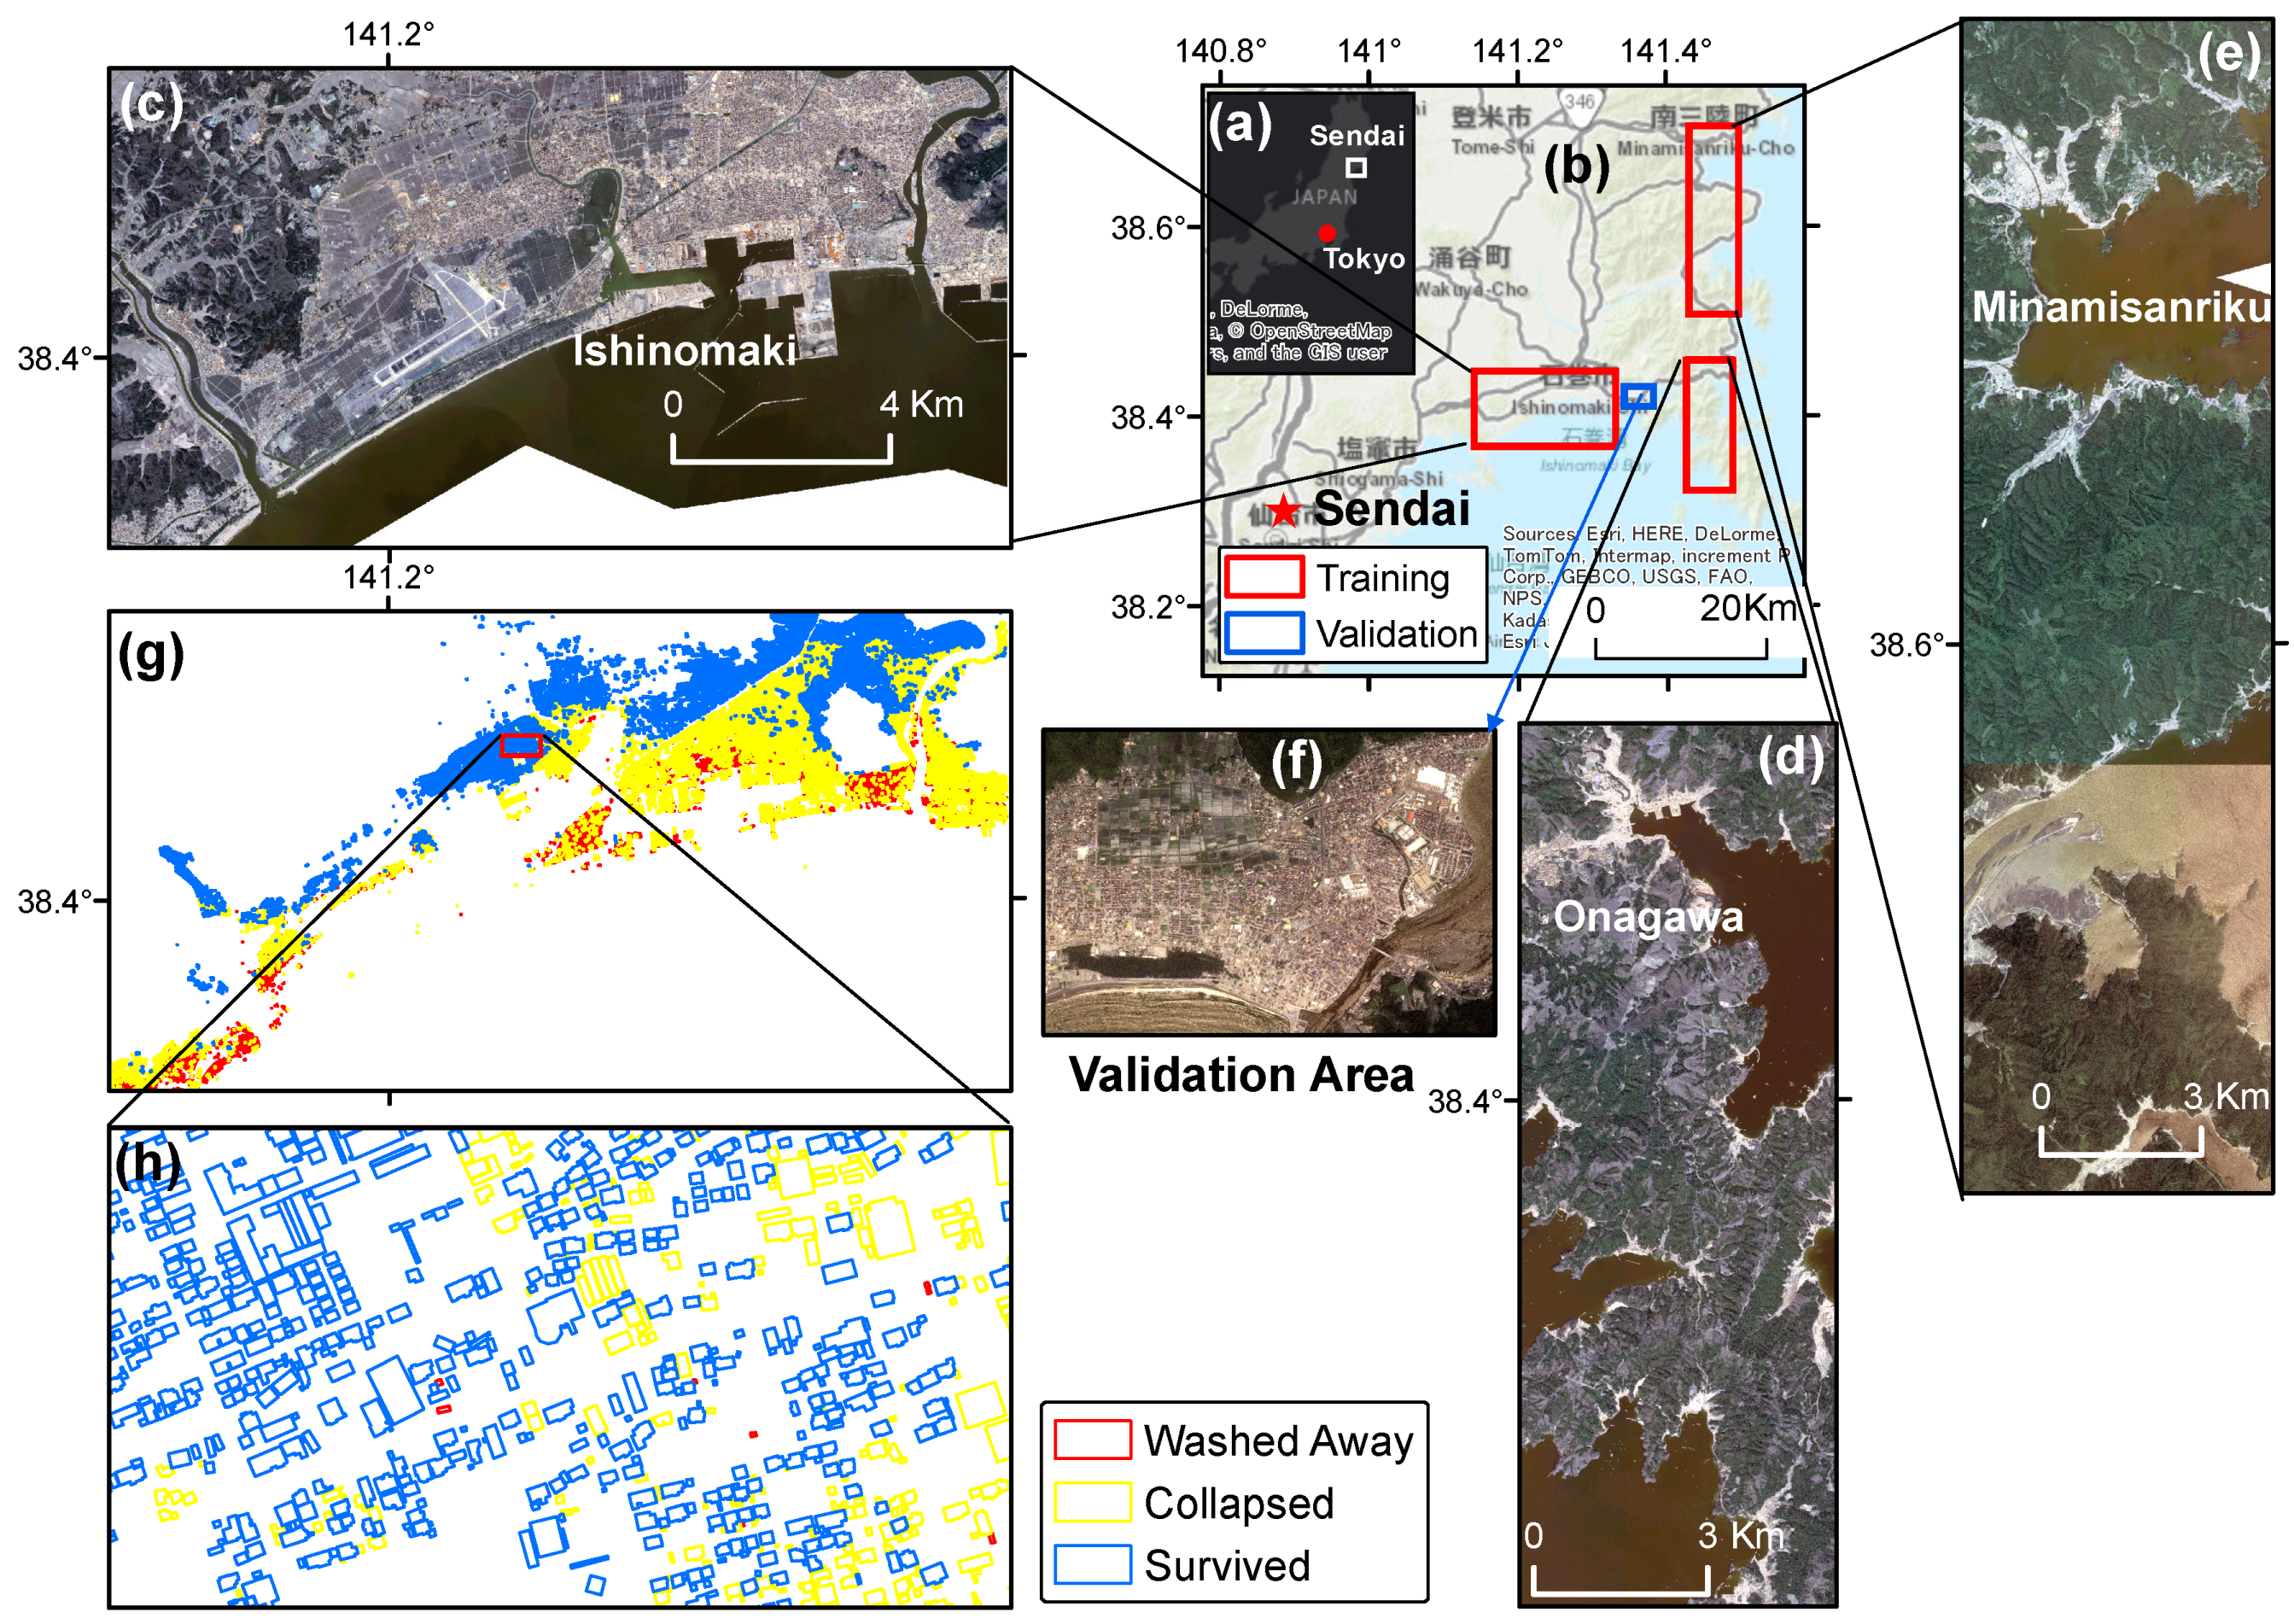
2. Case Study and Datasets
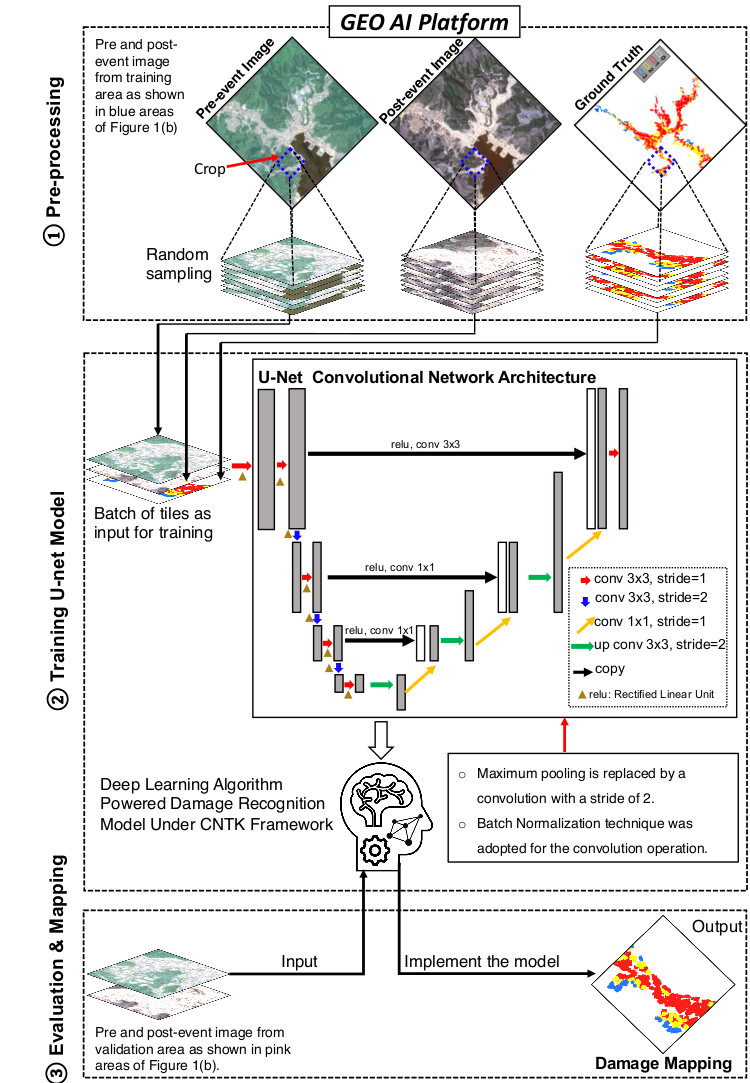
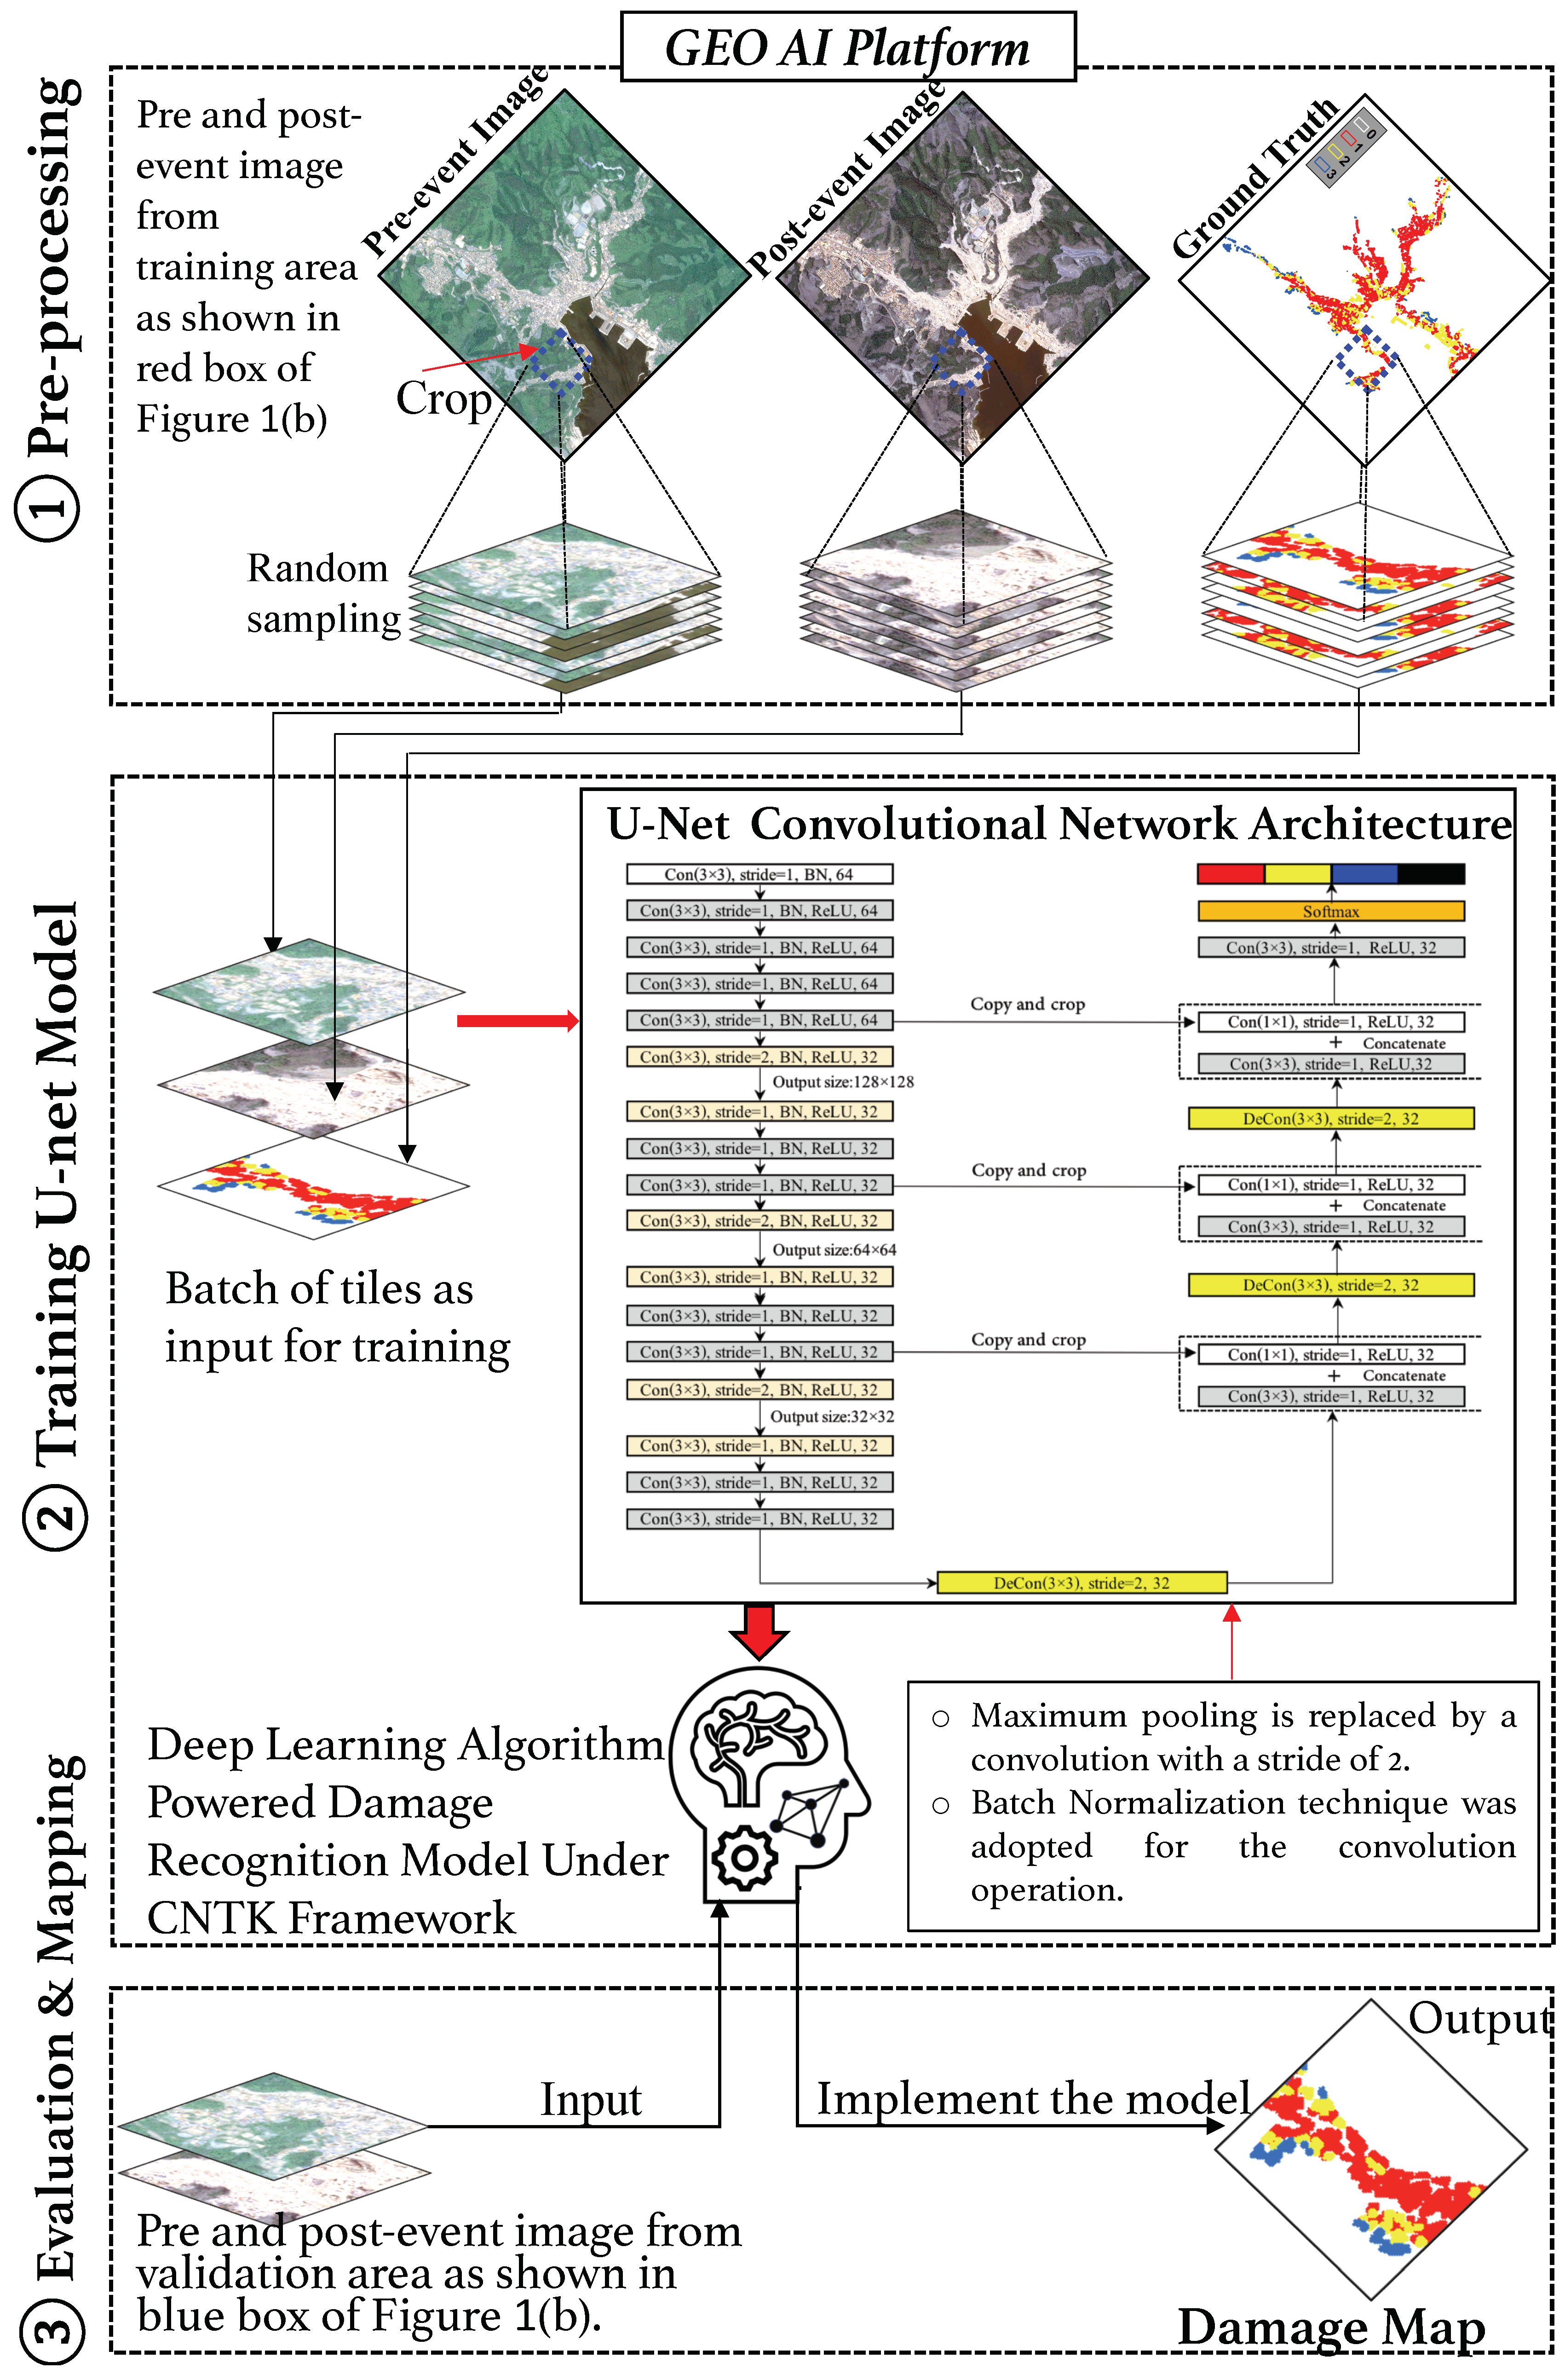
This study highlights the coastal areas of Northern Miyagi prefecture in the Tohoku region of Japan (Figure 1a), which was the most severely destroyed area by the 2011 Tohoku earthquake and tsunami off the Pacific coast of Tohoku that occurred at 14:46 JST on 11 March 2011. The earthquake and subsequent tsunami destroyed millions of buildings and caused extensive and severe structural.
Damage in north-eastern Japan [29]. The Ishinomaki, Onagawa and Minamisanriku areas, which were three most severely damaged areas in this event, were used for this study. The Ishinomaki and Onagawa areas are used to train the model, and the Minamisanriku area is used to validate the model (Figure 1b).
The four-band multispectral high-resolution Worldview-2 images with a ground sample distance of 0.6 m, which were collected before and after the 2011 Tohoku Earthquake-Tsunami, were used in this study (Table 1). The large-scale destroyed areas are characterized by a great diversity of environmental settings, building structure and spatial distribution, tsunami processes and image acquisition conditions as shown in Figure 1c–f, respectively. These conditions help us to maximize the real scenario to construct a general model to better serve future disaster assessments.
The building damage inventories for the study area are based on the field investigation conducted by the Ministry of Land Infrastructure, Transport and Tourism (MLIT) [30]. The inventories categorized the building into seven classes based on the damaged character; the damage categories in order from high to low are “washed away,” “collapsed,” “complete damage,” “major damage,” “moderate damage,” “minor damage,” and “no damage.” Buildings defined as “washed away” are characterized by only foundations remaining; buildings classified as “collapsed” are represented by a large number of ruins of buildings; the buildings that are categorized as “complete damage,” “major damage,” “moderate damage,” “minor damage,” and “no damage” is characterized by the relatively complete building structure. We recategorized MLIT building damage data into three classes: “washed away”, “collapsed”, and “survived” (ranging from “no damage” to “complete damage”) as shown in Figure 1g based on the structural integrity of the buildings. The zoomed-in image of the reference data is shown in Figure 1h.
The damage caused by the tsunami disaster has unique characteristics in spatial distribution, the damage degree decreases from the coast to inland as shown in Figure 1g, it is challenging to select one area as training areas because of sample class imbalance problem. In this study, the training areas and validation areas were determined as shown in Figure 1b to guarantee the training and validation areas contain more or less balanced damage sample classes. The training areas and validation areas were also determined because they cover the majority of the damage.

3. Methodology

The framework of the proposed methodology is shown in Figure 2: after the pre-processing step in Section 3.1, batches of training datasets (See Section 3.2) were used as the input for the U-net neural network (Section 3.3) to construct the model (Section 3.4). This model was defined as a deep-learning-algorithm-powered damage recognition model. After the model has been prepared, we can input the new remote-sensing image from the validation areas for evaluation (Section 3.5). Finally, we output the damage-mapping result in the ArcGIS platform (Section 3.6). The details of the methodology are described as follows.

3.1. Pre-Processing HR Images and Ground-Truth Data

The high-resolution (HR) images collected before and after the event were compiled into a large image. The co-registration procedure was executed on the pre- and post-event images. As a result, only the area that was covered by both pre- and post-event HR images was cropped as the study area. Accordingly, the ground-truth data that contained the label of “washed away,” “collapsed,” “survived” and non-built-up regions of the training areas were constructed based on the field investigation report. The HR images and ground-truth data of building damage were projected into the UTM/WGS84 geo-referenced coordinate system.

3.2. Preparation of Datasets for Training

Our input data consist of pairs of GeoTIFF images. The first two images in each pair are stacked pre- and post-disaster four-channel (red, green, blue, and near-infrared) HR images in the region of the training areas (Figure 1b). The third image is a single-channel image that corresponds to the same training region, where the value of each pixel represents a label: 0: Non-built-up; 1: Washed Away; 2: Collapsed; and 3: Survived. These three images corresponding to the features and labels of the training data. To generate image patches for batch training, subregions of the input image pair were cropped. Theoretically and ideally, the image tiles with the pixel size of an arbitrary 2 n are suitably used as the input. However, more GPU memory is required to store the feature maps with the increase in image size. In this study, the image tiles with a pixel size of 256 × 256 were used. These randomly cropped tiles are the candidate training datasets. Since the class of the non-built-up region occupies the vast majority of randomly cropped data, only the interesting patches are selected to reduce the calculation cost. The interested patches consist of two parts: the randomly selected patches with probability greater than 0.5 and the patches containing half of the pixels that are labeled as “Washed Away,” “Collapsed,” or “Survived.”

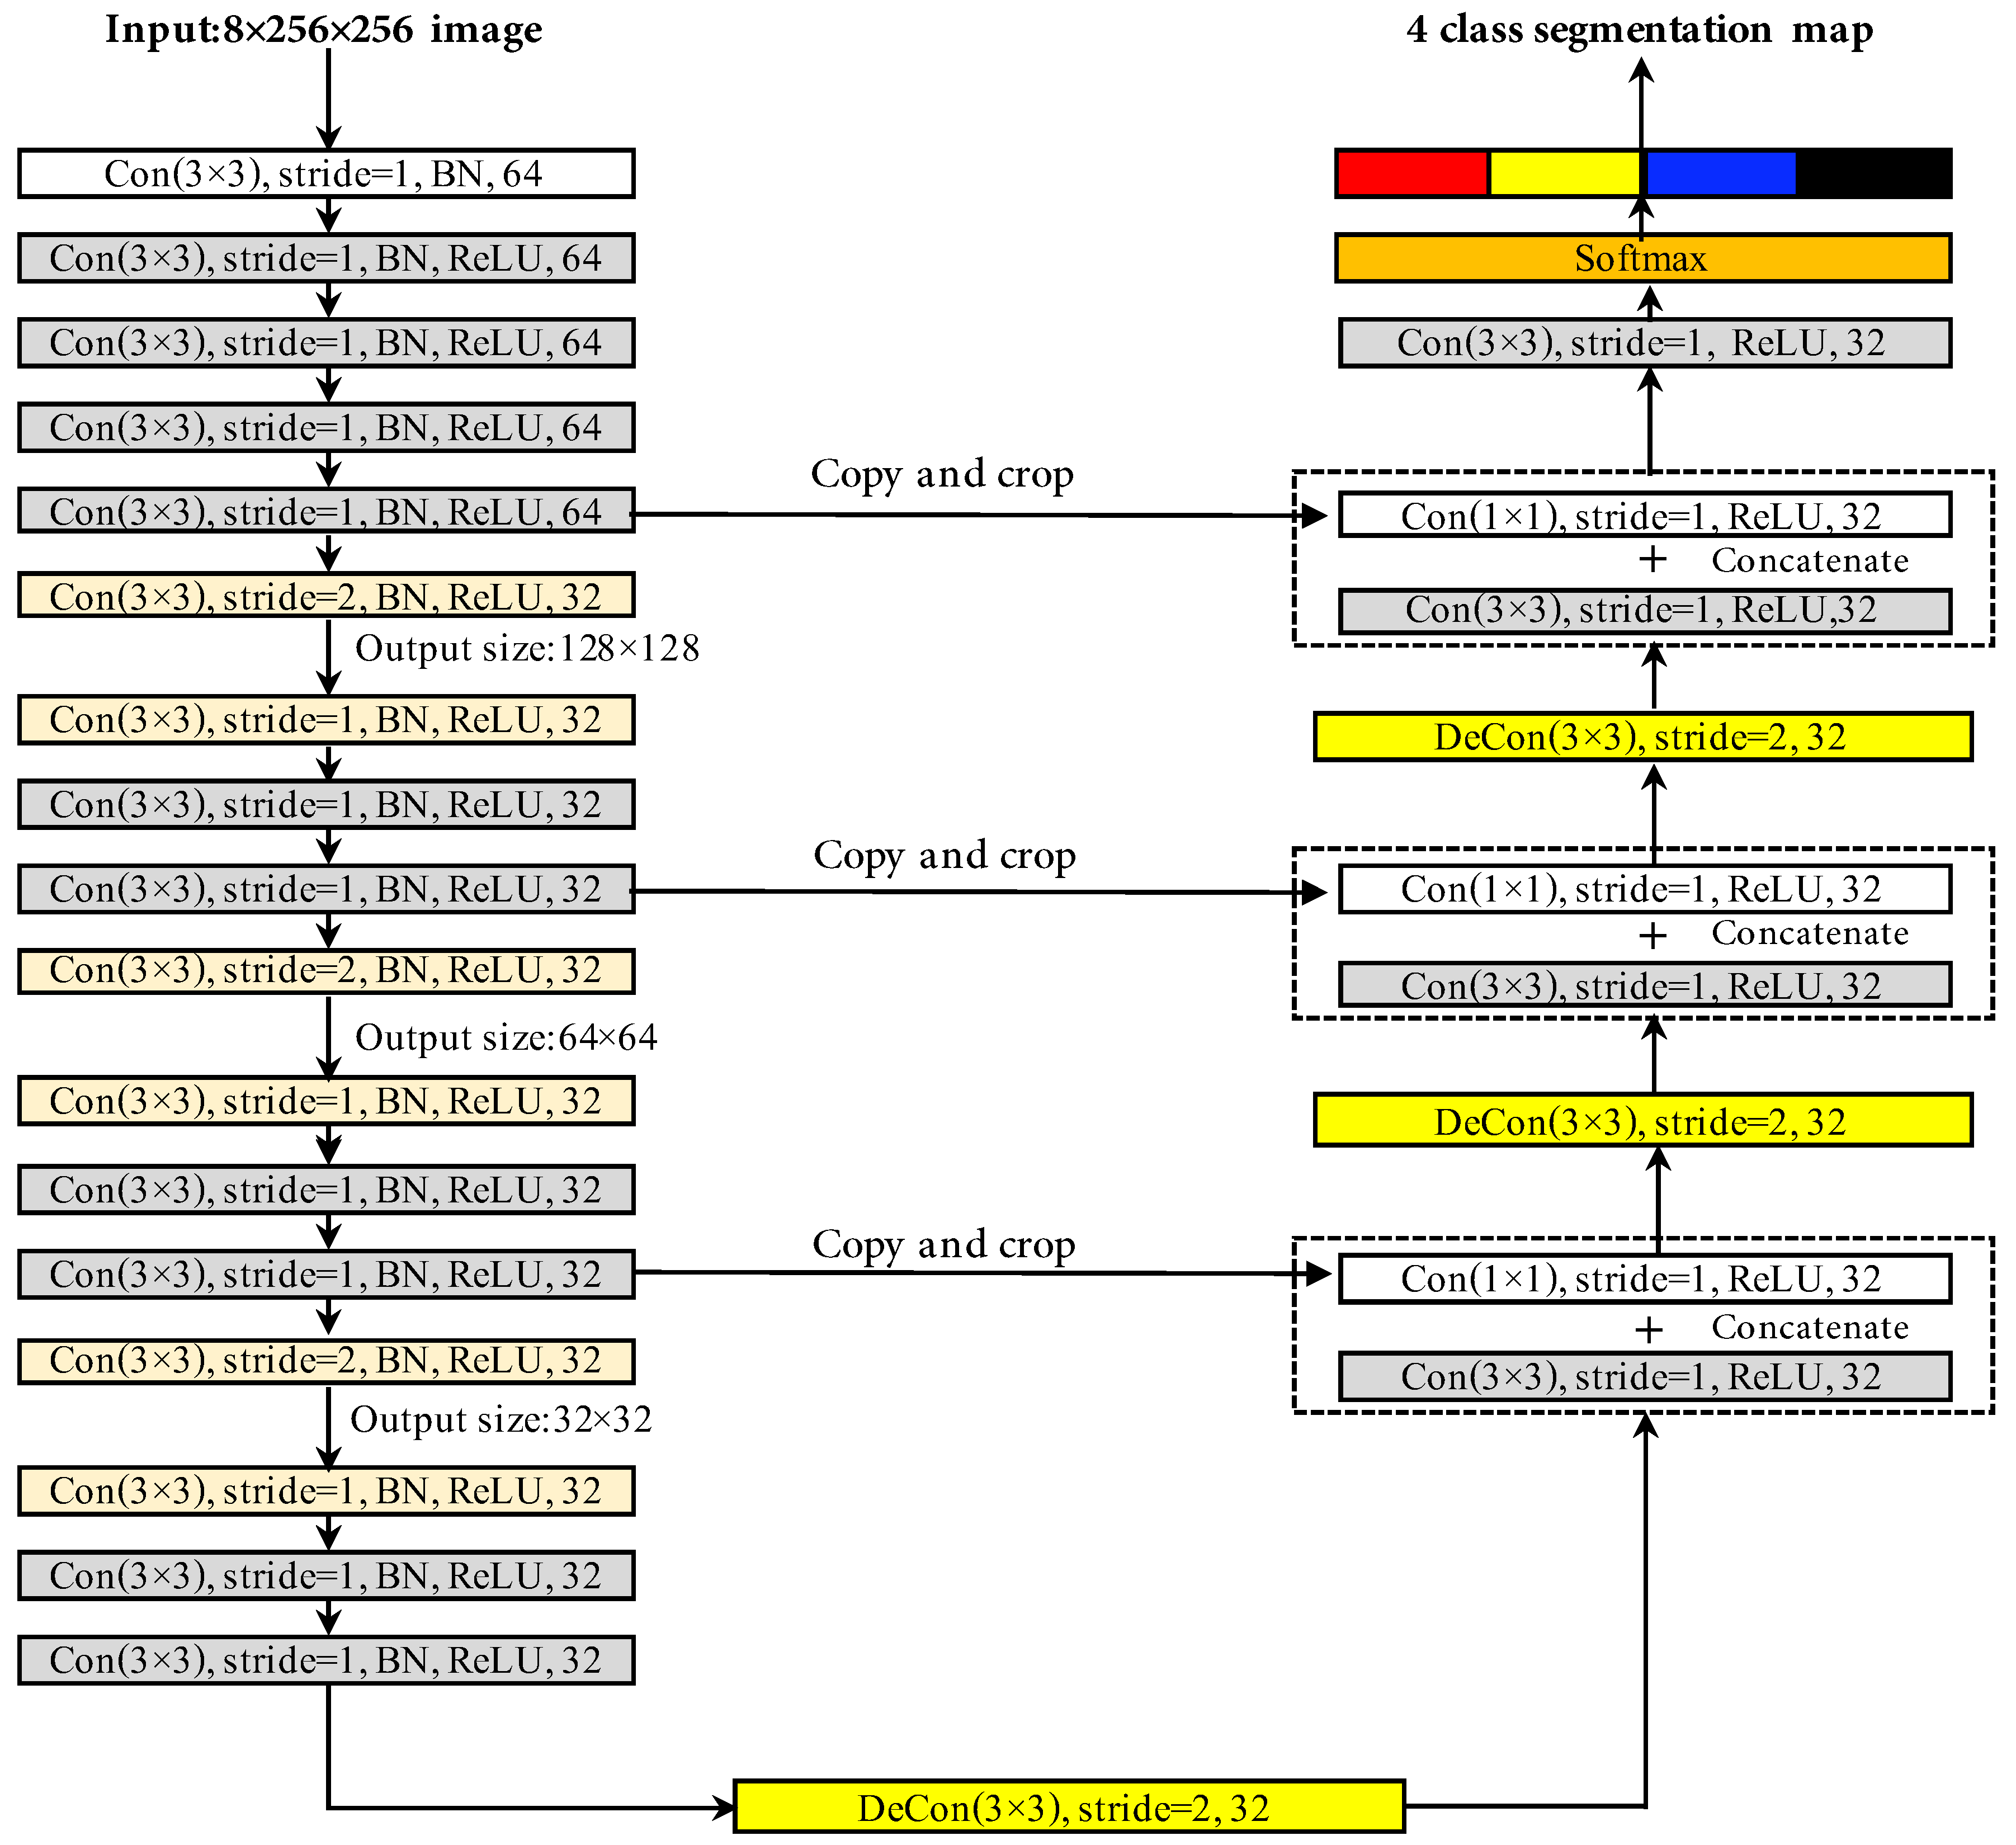
3.3. U-Net Neural Network Architecture

Our adopted U-net network structure is basically originated from U-net(Ronneberger et al., 2015) [26].U-net was originally proposed to solve biomedical imaging problems. With the development of deep learning technology, the latest Batch normalization(BN) [31] and residual network [32] structure has been introduced into U-net.The blocks of neural network units of U-net [26], U-net adopted in this study and Deep Residual U-net(Zhang et al., 2018) [33] are shown in Figure 3a–c respectively.
The details of the U-net convolutional neural network are shown in Figure 4. Specifically, the U-net architecture adopted in this study is slightly different from U-net(Ronneberger, et al., 2015) [26] and Deep Residual U-net(Zhang, et al., 2018) [33] as follows.
  • Compared with U-net [26], the batch normalization operation is used in this work as shown in Figure 3a,b. Batch normalization is a new technique to accelerate deep network training by alleviating the internal covariate shifting issue while training a notably deep neural network. It normalizes its inputs for every minibatch using the minibatch mean/variance and de-normalizes it with a learned scaling factor and bias. Batch normalization uses a long-term running mean and variance estimate, and the estimate is calculated during training by low-pass filtering minibatch statistics [31]. Many studies have demonstrated that batch normalization can significantly reduce the number of iterations to converge and improves the final performance [34]. In this study, BN is used in every convolutional operation, and the time constant of the low-pass filter is set to 4096.
  • The max pooling layer used in U-net [26] was replaced by a convolutional layer with a stride of 2 as shown in Figure 3a,b. This change was used because the convolutional layer with increased stride outperforms the max-pooling with regards to several image recognition benchmarks [35].
  • To reduce the calculation time cost, we reduced the filter number to half of the first block as shown in Table 2. This strategy was recommended because it was demonstrated effective for remote-sensing recognition tasks [36].
  • Deep Residual U-net(Zhang et al., 2018) [33] adopted identity mapping function as shown in Figure 3c, while the U-net in this study does not.

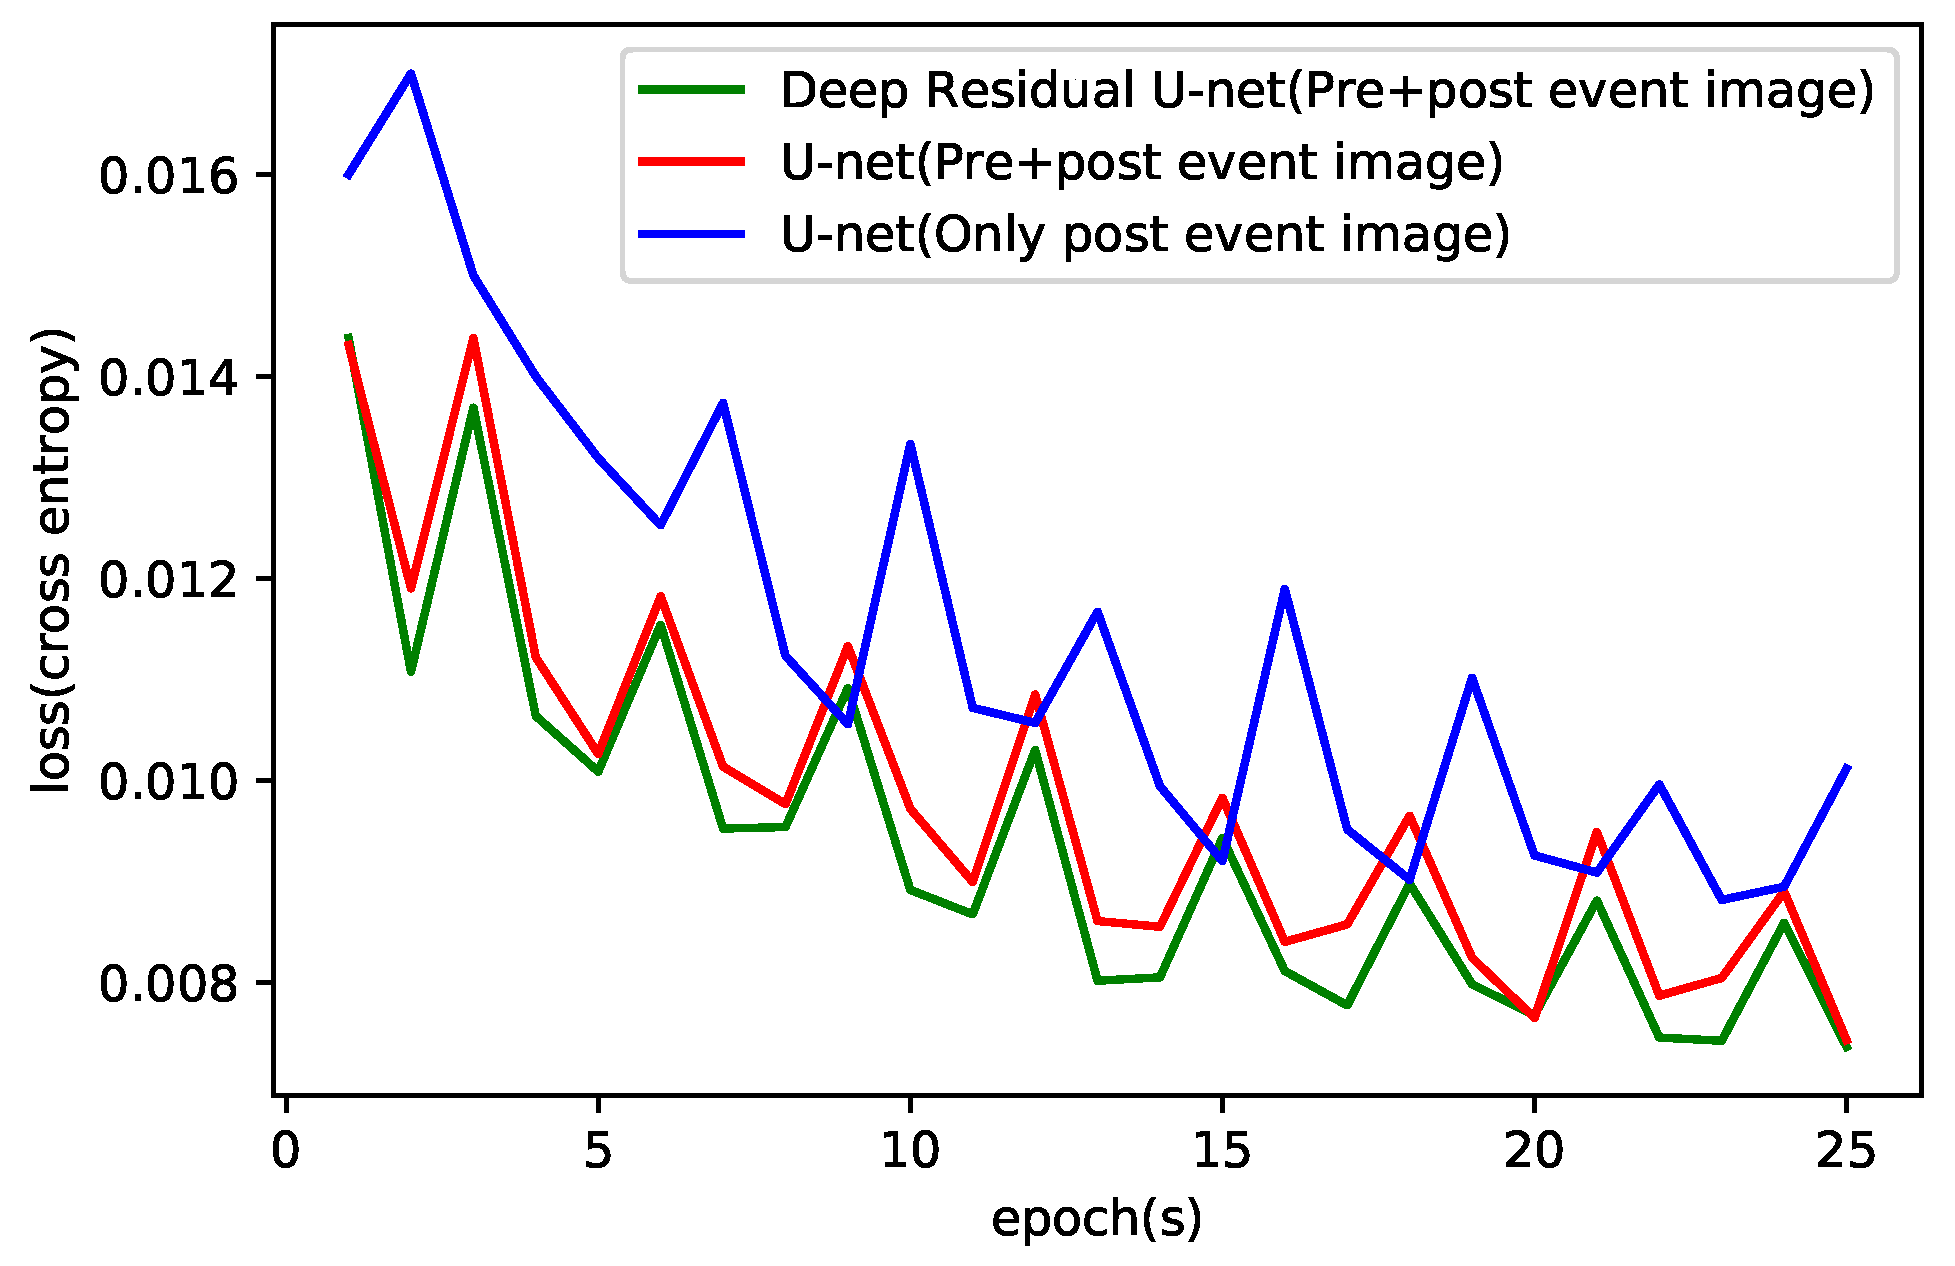
3.4. Training Damage Recognition Model

The prepared training datasets are used to train the deep learning model. We use a batch size of 25 and a patch size of 256 × 256 pixels for the U-net models (with padding). The models were trained for 25 epochs with 1600 batches per epoch. We trained the networks with a learning rate of 10 4 for all epochs. The process of constructing a deep learning model is the process of determining the best parameters, among which the optimization algorithm plays an important role in learning parameters to achieve the best accuracy. The root mean square prop (RMSprob) optimization algorithm was used because it is notably suitable for large, redundant datasets that use mini-batches [37]. The energy function is calculated by a pixel-wise Softmax operation over the final feature map with the cross-entropy loss function (an average cross-entropy loss); a smaller loss function corresponds to a higher accuracy of the model. We use the rectified linear unit (ReLU) as activation functions because of its superiority in gradient.

3.5. Evaluating the Performance of Damage Recognition Model

The training model was applied to the validation area to evaluate the performance of the model. In the validation step, only the co-registration pre- and post-event HR images are required as the input, and the output will be four class classification maps. The accuracy of our model’s predictions is quantified by the fraction of pixels that are correctly labelled by the model’s best guess.

3.6. Damage Mapping and Visualization

As mentioned in the introduction, one of the largest advantages of our proposed method is that the output is a localized classification map with exactly the size of the input remote-sensing image. Therefore, it is notably convenient to visualize the damage map through the ArcGIS platform.

3.7. Experiment Environment

In this work, we used the Computational Network Toolkit (CNTK) as the deep learning framework. CNTK is Microsoft’s cutting-edge open-source, commercial-grade toolkit that trains deep learning algorithms for Windows and Linux. CNTK supports convolutional networks for image recognition tasks. CNTK scales to multiple GPU servers and is designed around efficiency [38].
All experimentation and modelling environment tasks are implemented in GeoAI Data Science Virtual Machine (DSVM) in the x64 Windows environment on Azure provided by Microsoft and ESRI. The virtual machine is configured with 56 GB of RAM, a 2.60 GHz 6-core Intel(R) Xeon(R) CPU E5-2690 v3 processor, and an NVIDIA Tesla K80 GPU with 56 GB memory.
The satellite images are preprocessed with ArcGIS 10.6 and ENVI/SARscape 5.4, and all other processing and analysis steps are implemented in Python using the GDAL, NumPy, pandas, PIL and CNTK libraries. The deep learning algorithms are achieved in the Microsoft Cognitive Toolkit (CNTK) framework, which is a free, easy-to-use, open-source, commercial-grade toolkit that efficiently trains deep learning algorithms.

4. Results and Discussions

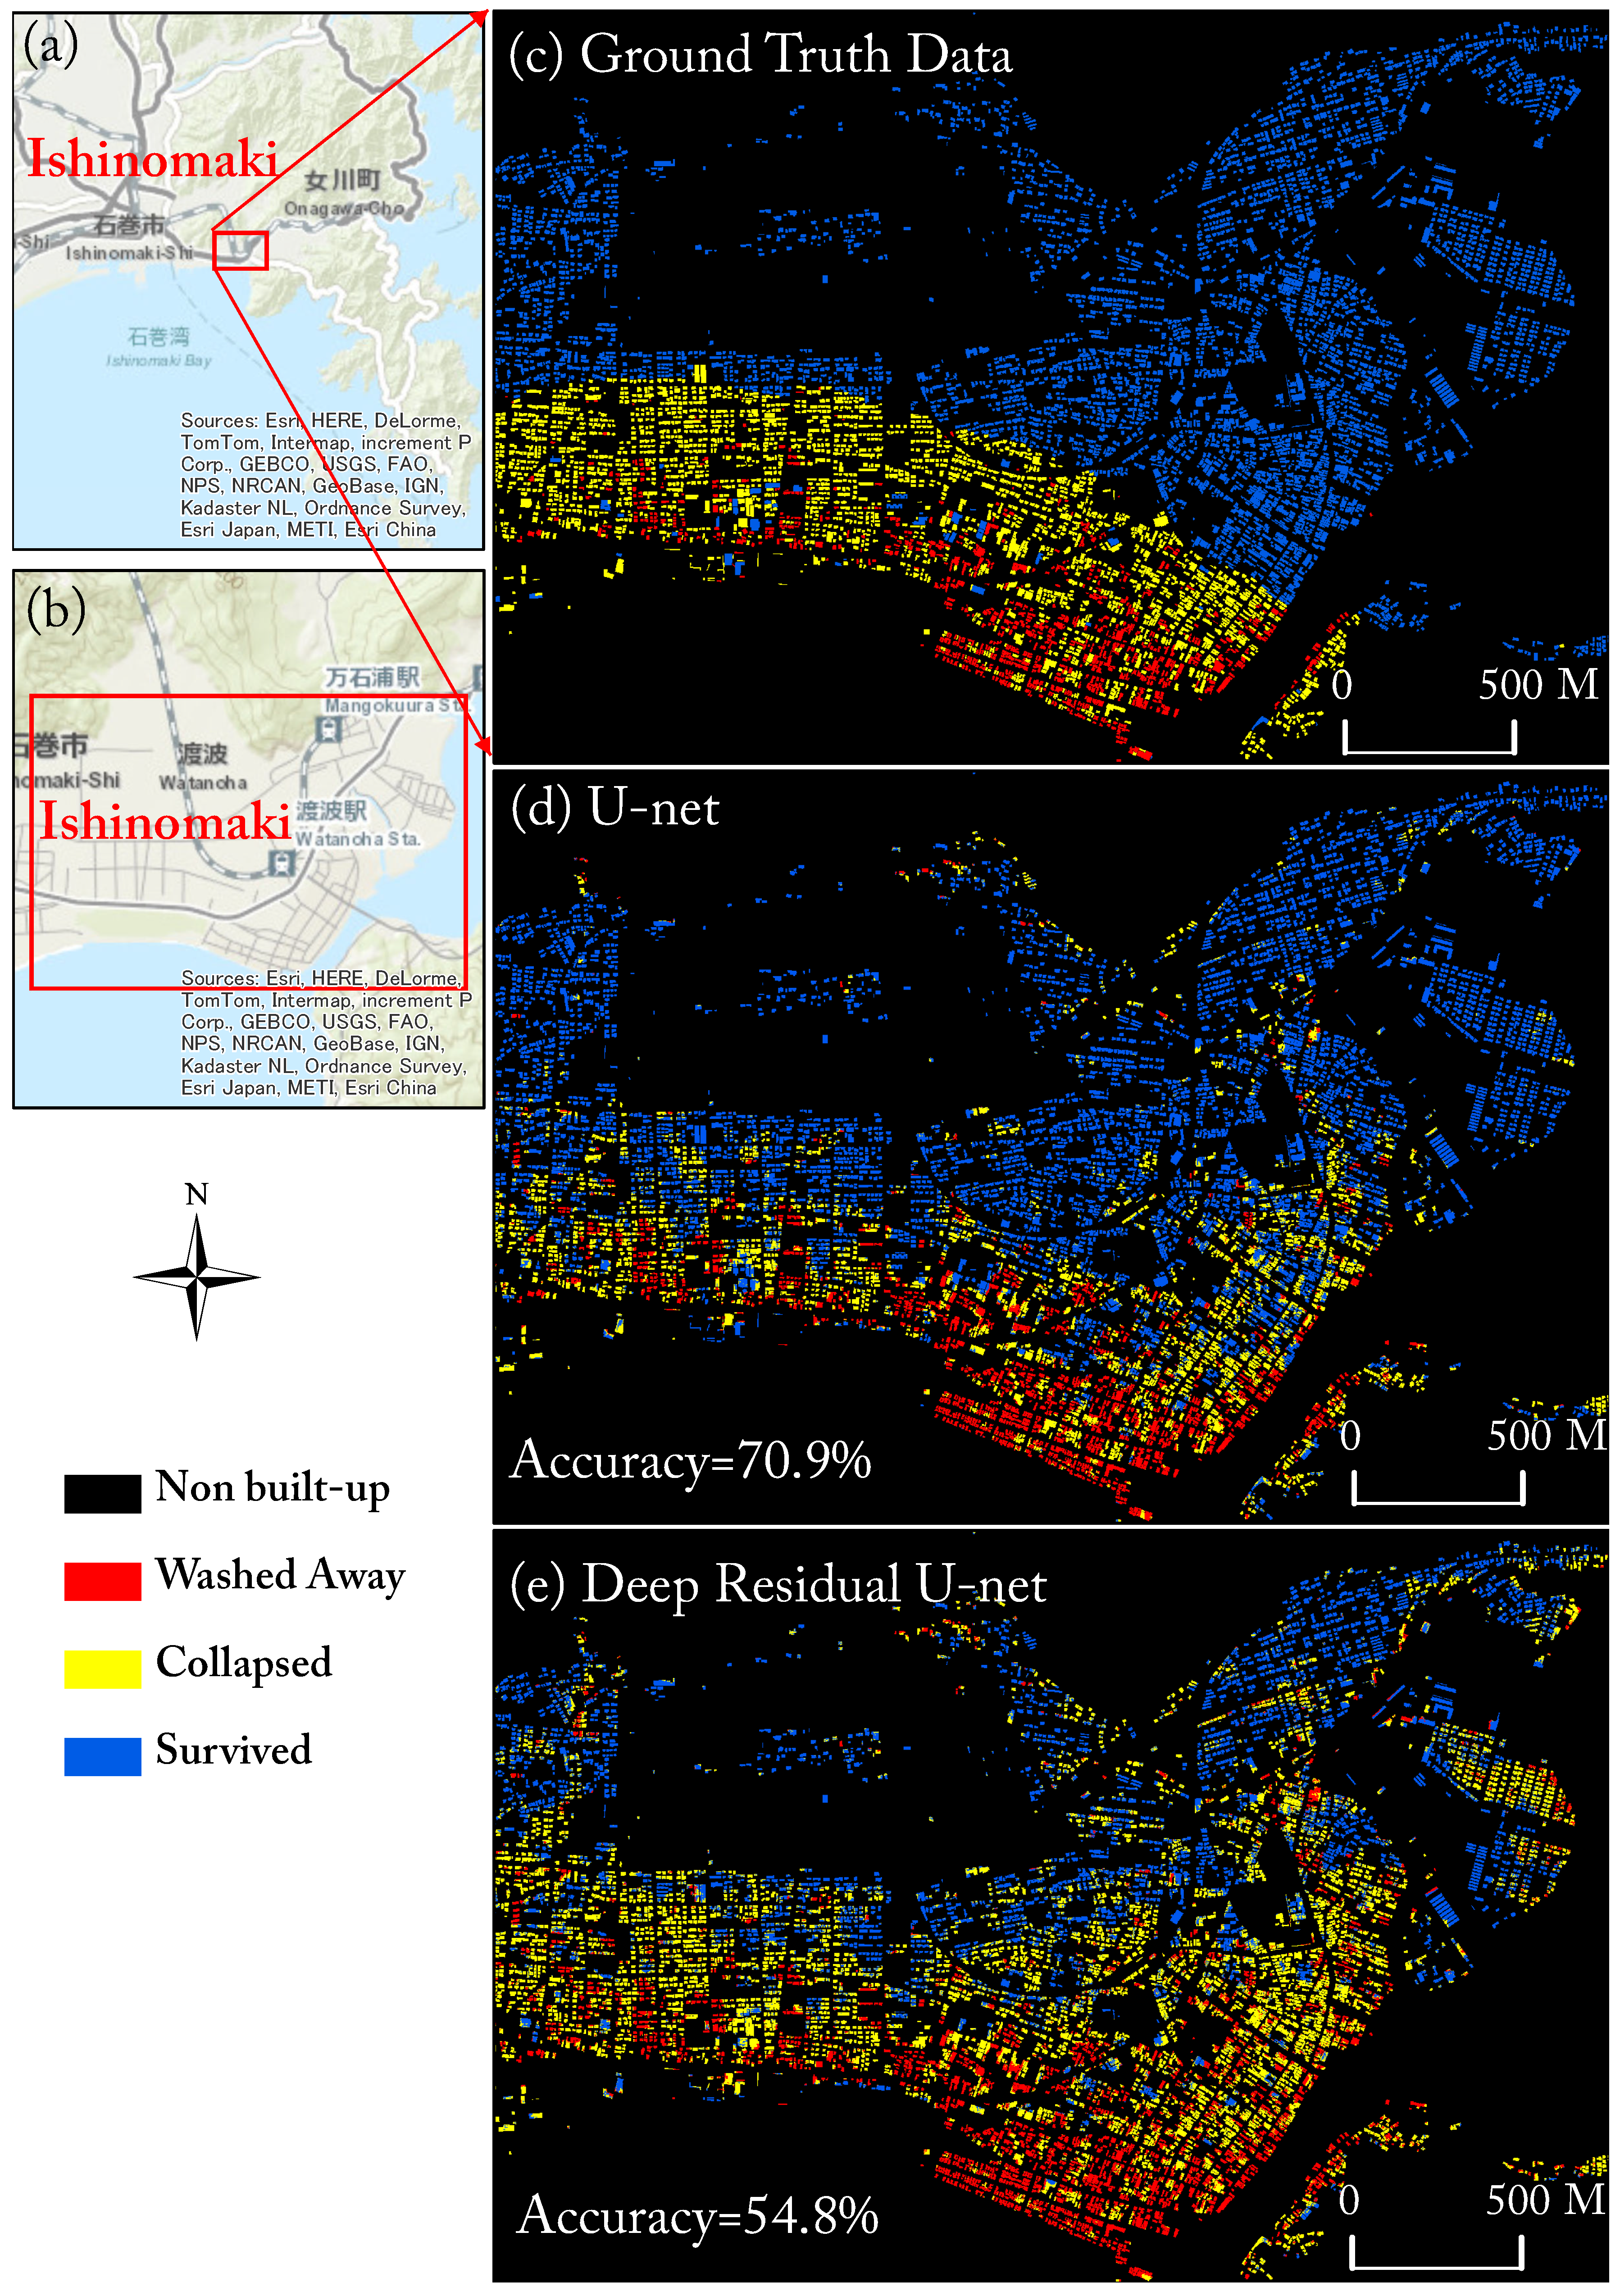
4.1. Accuracy Assessment of Damage-Mapping

In the experiments, we performed 25 epochs for both U-net model and deep residual U-net to obtain the trained damage recognition model. The relationship between the cross-entropy loss and the iteration of epochs is shown in Figure 5. A notably steady downward trend is observed for both models, which proves that our network structure and training datasets are qualified. Both models begin to converge at the 20th epochs. Basically, one epoch takes approximately 56 min to finish. The validation area is located in the south-east part of Ishinomaki city, as shown in Figure 6a. More details of the validation area are shown in Figure 6b. This area was selected for validation because it has a considerable amount of three different types of damage as shown in Figure 6c. The damage-mapping results of the U-net and deep residual U-net models are presented in Figure 6d and Figure 6e, respectively. The U-net damage-mapping results in Figure 5d are more consistent with the ground-truth data in Figure 6c than the deep residual U-net result in Figure 6e. The accuracy assessment confusion matrix for both damage-mapping results derived from U-net and deep residual U-net is detailed in Table 3. The metrics of accuracy, precision, recall, and F-score are used to evaluate the accuracy [39]. These metrics are defined in the following equations.
Here, the U-net has much lower omission error (39.0%, 51.2% and 22.7%) and commission error ( 75.6%, 66.2%, and 29.9%) than the deep residual U-net (35.2%, 48.6%, 51.9% and 85.6%, 72.3% and 28.2%, respectively). In general, the overall accuracy and F-score for U-net are better than those of deep residual U-net. The introduction of identity mapping in the deep residual U-net structure appears to reduce the network performance, which may explain why the previous study has only used basic U-net structures. This conclusion requires further verification.
In addition, most of the washed-away class pixels and survived class pixels are correctly identified, whereas many collapsed class pixels are misclassified either as washed-away or surviving. Because of the orthographic projection characteristic of the optical remote sensing observation, the sensor can only record the contour information on top of each building, and the damage situation below the roof is not reflected. For the tsunami disaster, a large portion of the collapsed buildings is characterized by the intact roof and destroyed ground floor as shown in Figure 7a, whereas the remote-sensing image can record the complete roof information as shown in Figure 7b. The problem can be mitigated by integrating the Synthetic Aperture Radar imagery information because the Synthetic Aperture Radar is represented by the side-looking observation; thus, it is more sensible to the side-wall damage information [40].

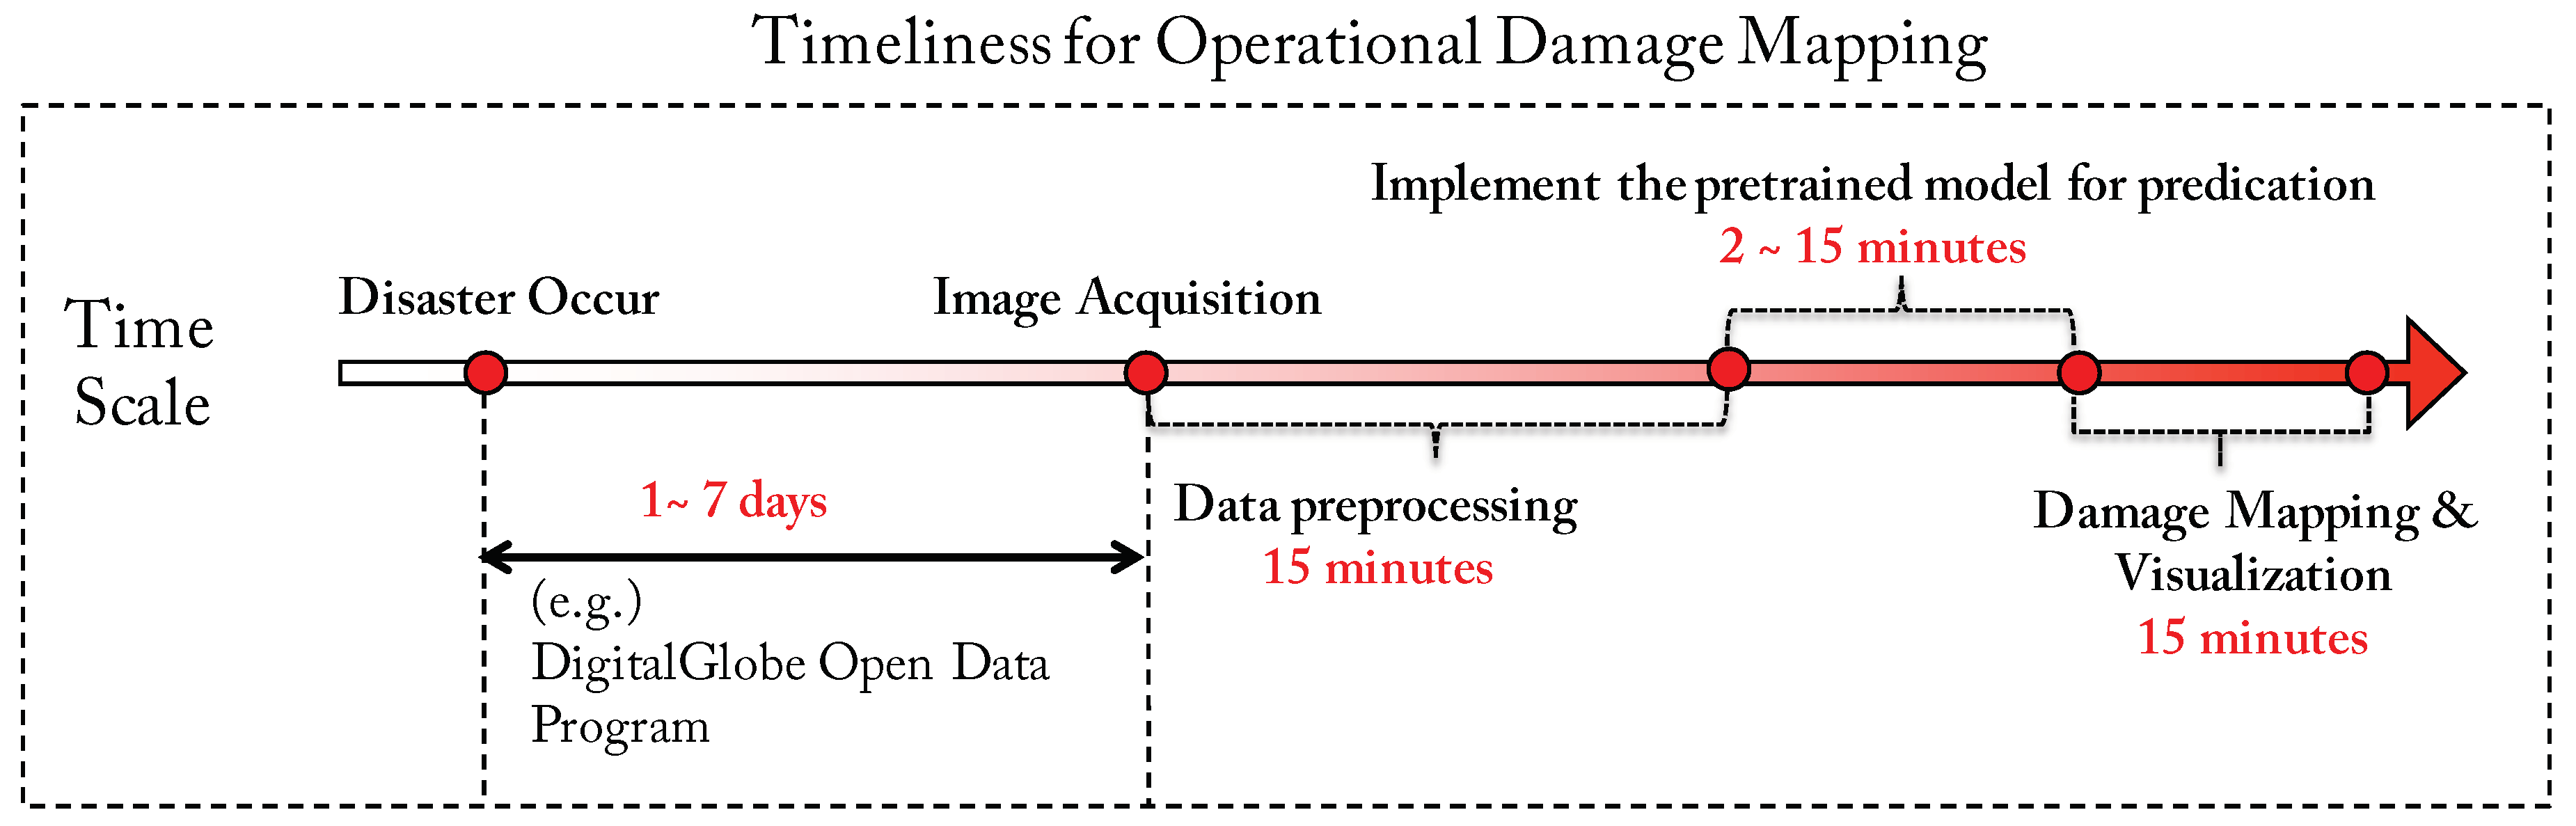
4.2. Timeliness Estimation for Operational Damage-Mapping

Disaster emergency response requires high timeliness; thus, the timeliness to implement the damage-mapping is of great interest. The timeliness framework basically consists of the time to access the remote-sensing datasets and the time to implement the trained model to map and visualize the damage information as shown in Figure 8. In general, it takes one to seven days to access the free-source high-resolution satellite imagery provided through the DigitalGlobe Open Data program for major disaster events as detailed in Table 3, for which the time range is not artificially controllable by the damaged-mapping agency. Thus, the significance of accelerating the efficiency of implementing the damage-mapping process immediately after we obtain the datasets is highlighted. The previous method includes the time-consuming and laborious extraction of various target features as the input to run the model, which is especially deadly for large-area remote-sensing image processing because it greatly delays the process of damage-mapping. The superiority of our proposed method is the simplified data pre-processing process, which only requires the basic processing, such as the calibration, Georeference, and coregistration, which may take approximately 30 min. With cloud coverage, the processing time will increase. The procedure to implement the pre-trained model to generate the damage map only takes approximately 2–15 min depending on the remote-sensing image size, which implies that in future disaster response practice, it will only take 2–15 min to generate the damage map after the processed remote-sensing data have been provided. This procedure is also superior to the previous method because the end-to-end symmetric U-net network structure can directly localize the predicted label information on the map, which avoids manually projecting the label information onto the map as done in the previous work [5]. This process is followed by the damage mapping and visualization procedure to display the damage map on the ArcGIS server platform to share the damage-mapping results.

4.3. Contribution of the Proposed Framework for Accelerating Operational Damage-Mapping Practice

For operational damage-mapping, the availability of remote-sensing datasets is critical. The proposed damage-mapping framework is designed for the high-resolution satellite imagery, which is always available and freely accessible soon after major disaster events as demonstrated in Table 3. The proposed framework is highly flexible to extend to other scenarios. Although our method was demonstrated based on the pre- and post-event high-resolution remote-sensing images, the pre- and post-event images are integrated into an eight-channel layer stack as the input, and the pre-event images before the disaster only provide supplementary reference information for damage classification. Therefore, the model also works smoothly when only post-event images are used as the input if the pre-event remote-sensing images are not accessible. We also experimented using only the post-event image, and The comparison demonstrates that the utilization both pre and the post-event image did outperform than that of only post-event image as shown by the higher cross-entropy loss in Figure 5, the result is also consistent with our pre-assumption. Therefore, in the future disaster scenario, if the pre and post-event image are both available, we recommend adopting both the pre and post-event image as input.
In addition, although our model was demonstrated for mapping the tsunami damage, the framework also works for other disasters such as floods and landslides. To generalize our framework to other disaster types, the high-resolution satellite imagery and corresponding ground truth data for different types of disaster should be used to fine-tune the new model. Notwithstanding that the proposed model is a supervised classification model, it can be easily implemented to respond to future disasters after these models are well prepared.
Although the building footprint data were used in this work, the role of building footprint data is to create training data labels. Assuming that the label of land that covers the forest, river, etc. of the non-built-up regions is also available, we can train a new model that does not depend on the building footprint data. From this perspective, the proposed framework does not depend on building footprint data and is a generalized framework.

5. Conclusions

The state-of-the-art image processing algorithm is often used in high-resolution remote-sensing image-based damage-mapping approaches, but it has seldom been improved from the perspective of operational practice. In this work, a framework aiming to enhance the operational damage-mapping practice was proposed. The framework is implemented using a deep learning algorithm under the CNTK framework through an end-to-end improved U-net convolutional network. The 2011 Tohoku Earthquake-Tsunami was selected as the case study to developed and validate the framework. The design of the framework considers the availability of data sources, the feasibility of model implementation, time cost and accuracy of the method immediately after the disaster. The design has enhanced the operational-oriented disaster management practice by introducing the perspective and solution, although it is understood that the proposed framework is not fully operational because of specific limitations.
The development of an intelligent image processing technique represented by the U-net convolutional network is pushing to enable the satellite-based operational damage-mapping practice. Therefore, it is of great significance to explore the role of the state-of-the-art image-processing technology in remote-sensing-based damage identification tasks. The validation results in this work reveal the limitation of a single optical sensor in detecting the collapsed building, particularly the sidewall damage caused by tsunami disasters. These problems can be mitigated by incorporating the synthetic aperture radar image information as a supplement.

Author Contributions

Y.B. is in charge of Methodology, Conceptualization, Formal analysis, Validation, Writing—original draft, and Writing—review & editing; E.M. and S.K. are in charge of Supervision, Project administration, Resources and Software.

Funding

This research was funded by JST (Japan Science and Technology Agency) CREST (grant number JP-MJCR1411), JSPS Grants-in-Aid for Scientific Research (grant number 17H06108), Microsoft AI for Earth grant and China Scholarship Council (CSC).

Acknowledgments

We would like to thank Microsoft for providing the Azure service through AI for Earth grant and ESRI for providing the ArcGIS package to guarantee the fulfillment of this work. We would also like to show our great gratitude to Yanzhang from RIKEN, Xing Liu and Luis Moya from Tohoku University for providing good suggestions to this work.

Conflicts of Interest

The authors declare no conflict of interest.

Abbreviations

The following abbreviations are used in this manuscript:
HRHigh-Resolution
GeoAIGeospatial Artifical Intelligence
CNTKComputational Network Toolkit
BNBatch Normalization
RMSprobRoot Mean Square Prop
ReLURectified Linear Unit

References

  1. Mori, N.; Takahashi, T.; 2011 Tohoku Earthquake Tsunami Joint Survey Group. Nationwide post event survey and analysis of the 2011 Tohoku Earthquake Tsunami. Coast. Eng. J. 2012, 54, 1250001-1–1250001-27. [Google Scholar] [CrossRef]
  2. Ruangrassamee, A.; Yanagisawa, H.; Foytong, P.; Lukkunaprasit, P.; Koshimura, S.; Imamura, F. Investigation of tsunami-induced damage and fragility of buildings in Thailand after the December 2004 Indian Ocean tsunami. Earthq. Spectra 2006, 22, 377–401. [Google Scholar] [CrossRef]
  3. Suppasri, A.; Koshimura, S.; Imai, K.; Mas, E.; Gokon, H.; Muhari, A.; Imamura, F. Damage characteristic and field survey of the 2011 Great East Japan Tsunami in Miyagi Prefecture. Coast. Eng. J. 2012, 54, 1250005-1–1250005-30. [Google Scholar] [CrossRef]
  4. Schultz, C.H.; Koenig, K.L.; Noji, E.K. A medical disaster response to reduce immediate mortality after an earthquake. N. Engl. J. Med. 1996, 334, 438–444. [Google Scholar] [CrossRef] [PubMed]
  5. Bai, Y.; Gao, C.; Singh, S.; Koch, M.; Adriano, B.; Mas, E.; Koshimura, S. A Framework of Rapid Regional Tsunami Damage Recognition From Post-event TerraSAR-X Imagery Using Deep Neural Networks. IEEE Geosci. Remote Sens. Lett. 2018, 15, 43–47. [Google Scholar] [CrossRef]
  6. Moya, L.; Yamazaki, F.; Liu, W.; Yamada, M. Detection of collapsed buildings from lidar data due to the 2016 Kumamoto earthquake in Japan. Nat. Hazards Earth Syst. Sci. 2018, 18, 65–78. [Google Scholar] [CrossRef] [Green Version]
  7. Chen, S.W.; Wang, X.S.; Sato, M. Urban damage level mapping based on scattering mechanism investigation using fully polarimetric SAR data for the 3.11 East Japan earthquake. IEEE Trans. Geosci. Remote Sens. 2016, 54, 6919–6929. [Google Scholar] [CrossRef]
  8. Trekin, A.; Novikov, G.; Potapov, G.; Ignatiev, V.; Burnaev, E. Satellite imagery analysis for operational damage assessment in Emergency situations. arXiv, 2018; arXiv:1803.00397. Available online: https://arxiv.org/abs/1803.00397(accessed on 1 September 2018).
  9. Digital Globe. Open Data Program. 2017. Available online: https://www.digitalglobe.com/opendata (accessed on 24 August 2018).
  10. Mas, E.; Bricker, J.; Kure, S.; Adriano, B.; Yi, C.; Suppasri, A.; Koshimura, S. Field survey report and satellite image interpretation of the 2013 Super Typhoon Haiyan in the Philippines. Nat. Hazards Earth Syst. Sci. 2015, 15, 805–816. [Google Scholar] [CrossRef]
  11. Gokon, H.; Koshimura, S. Mapping of building damage of the 2011 Tohoku earthquake tsunami in Miyagi Prefecture. Coast. Eng. J. 2012, 54, 1250006. [Google Scholar] [CrossRef]
  12. Gamba, P.; Casciati, F. GIS and image understanding for near-real-time earthquake damage assessment. Photogramm. Eng. Remote Sens. 1998, 64, 987–994. [Google Scholar]
  13. Yusuf, Y.; Matsuoka, M.; Yamazaki, F. Damage assessment after 2001 Gujarat earthquake using Landsat-7 satellite images. J. Indian Soc. Remote Sens. 2001, 29, 17–22. [Google Scholar] [CrossRef]
  14. Rathje, E.M.; Woo, K.S.; Crawford, M.; Neuenschwander, A. Earthquake damage identification using multi-temporal high-resolution optical satellite imagery. IEEE Int. Geosci. Remote Sens. Symp. 2005, 7, 5045–5048. [Google Scholar] [CrossRef]
  15. Bai, Y.; Adriano, B.; Mas, E.; Koshimura, S. Building Damage Assessment in the 2015 Gorkha, Nepal, Earthquake Using Only Post-Event Dual Polarization Synthetic Aperture Radar Imagery. Earthq. Spectra 2017, 33, S185–S195. [Google Scholar] [CrossRef]
  16. Thomas, J.; Kareem, A.; Bowyer, K.W. Automated poststorm damage classification of low-rise building roofing systems using high-resolution aerial imagery. IEEE Trans. Geosci. Remote Sens. 2014, 52, 3851–3861. [Google Scholar] [CrossRef]
  17. Anniballe, R.; Noto, F.; Scalia, T.; Bignami, C.; Stramondo, S.; Chini, M.; Pierdicca, N. Earthquake damage mapping: An overall assessment of ground surveys and VHR image change detection after L’Aquila 2009 earthquake. Remote Sens. Environ. 2018, 210, 166–178. [Google Scholar] [CrossRef]
  18. Ranjbar, H.R.; Ardalan, A.A.; Dehghani, H.; Saradjian, M.R. Using high-resolution satellite imagery to proide a relief priority map after earthquake. Nat. Hazards 2018, 90, 1087–1113. [Google Scholar] [CrossRef]
  19. Duarte, D.; Nex, F.; Kerle, N.; Vosselman, G. Satellite Image Classification of Building Damages Using Airborne and Satellite Image Samples in a Deep Learning Approach. ISPRS Ann. Photogramm. Remote Sens. Spatial Inf. Sci. 2018, IV-2, 89–96. [Google Scholar] [CrossRef]
  20. Alidoost, F.; Arefi, H. Application of Deep Learning for Emergency Response and Disaster Management. In Proceedings of the AGSE Eighth International Summer School and Conference, University of Tehran, Tehran, Iran, 29 April–4 May 2017; pp. 11–17. [Google Scholar]
  21. Stumpf, A.; Kerle, N. Object-oriented mapping of landslides using Random Forests. Remote Sens. Environ. 2018, 115, 2564–2577. [Google Scholar] [CrossRef]
  22. Fujita, A.; Sakurada, K.; Imaizumi, T.; Ito, R.; Hikosaka, S.; Nakamura, R. Damage detection from aerial images via convolutional neural networks. In Proceedings of the Fifteenth IAPR International Conference on Machine Vision Applications (MVA), Nagoya, Japan, 8 May–12 May 2017; pp. 8–12. [Google Scholar] [CrossRef]
  23. Vetrivel, A.; Gerke, M.; Kerle, N.; Nex, F.; Vosselman, G. Disaster damage detection through synergistic use of deep learning and 3D point cloud features derived from very high resolution oblique aerial images, and multiple-kernel-learning. ISPRS J. Photogramm. Remote Sens. 2018, 140, 45–59. [Google Scholar] [CrossRef]
  24. Cao, Q.D.; Choe, Y. Deep Learning Based Damage Detection on Post-Hurricane Satellite Imagery. arXiv, 2018; arXiv:1807.01688. [Google Scholar]
  25. Kemker, R.; Salvaggio, C.; Kanan, C.W. Algorithms for semantic segmentation of multispectral remote sensing imagery using deep learning. ISPRS J. Photogramm. Remote Sens. 2018, 60–77. [Google Scholar] [CrossRef]
  26. Ronneberger, O.; Fischer, P.; Brox, T. U-net: Convolutional networks for biomedical image segmentation. In Proceedings of the 18th International Conference on Medical Image Computing and Computer-Assisted Intervention, Munich, Germany, 5–9 October 2015; pp. 234–241. [Google Scholar]
  27. Long, J.; Shelhamer, E.; Darrell, T. Fully convolutional networks for semantic segmentation. In Proceedings of the IEEE Conference on Computer Vision and Pattern Recognition, Boston, Massachusetts, 8–12 June 2015; pp. 3431–3440. [Google Scholar]
  28. Microsoft. Geospatial AI on Azure. 2018. Available online: http://aka.ms/dsvm/geoai/docs (accessed on 25 August 2018).
  29. National Police Agency of Japan. Police Countermeasures and Damage Situation Associated with 2011 Tohoku District-Off the Pacific Ocean Earthquake. Available online: https://www.npa.go.jp/news/other/earthquake2011/pdf/higaijokyo_e.pdf (accessed on 18 June 2018).
  30. Ministry of Land, Infrastructure and Transportation (MLIT), Survey of Tsunami Damage Condition. Available online: http://www.mlit.go.jp/toshi/toshi-hukkou-arkaibu.html (accessed on 20 Novermber 2014).
  31. Ioffe, S.; Szegedy, C. Batch normalization: Accelerating deep network training by reducing internal covariate shift. In Proceedings of the 32nd International Conference on International Conference on Machine Learning-Volume, Lille, France, 6–11 July 2015; pp. 448–456. [Google Scholar]
  32. He, K.; Zhang, X.; Ren, S.; Sun, J. Deep residual learning for image recognition. In Proceedings of the Fifteenth IEEE Conference on Computer Vision and Pattern Recognition (CVPR), Las Vegas, NV, USA, 26 June–1 July 2016; pp. 770–778. [Google Scholar]
  33. Zhang, Z.; Liu, Q.; Wang, Y. Road extraction by deep residual u-net. IEEE Geosci. Remote Sens. Lett. 2018, 15, 749–753. [Google Scholar] [CrossRef]
  34. Kampffmeyer, M.; Salberg, A.B.; Jenssen, R. Semantic Segmentation of Small Objects and Modeling of Uncertainty in Urban Remote Sensing Images Using Deep Convolutional Neural Networks. In Proceedings of the IEEE Conference on Computer Vision and Pattern Recognition (CVPR) Workshops, Las Vegas, NV, USA, 26 June–1 July 2016; pp. 680–688. [Google Scholar] [CrossRef]
  35. Springenberg, J.T.; Dosovitskiy, A.; Brox, T.; Riedmiller, M. Striving for simplicity: The all convolutional net. arXiv, 2014; arXiv:1412.6806. [Google Scholar]
  36. Maggiori, E.; Tarabalka, Y.; Charpiat, G.; Alliez, P. Can Semantic Labeling Methods Generalize to Any City? the inria aerial image labeling benchmark. In Proceedings of the IEEE International Symposium on Geoscience and Remote Sensing (IGARSS), Fort Worth, TX, USA, 23–28 July 2017; pp. 3226–3229. [Google Scholar] [CrossRef]
  37. Hinton, G.; Srivastava, N.; Swersky, K. Rmsprop: Divide the Gradient by a Running Average of Its Recent Magnitude. COURSERA: Neural Networks for Machine Learning. Available online: https://www.coursera.org/lecture/neural-networks/rmsprop-divide-the-gradient-by-a-running -average-of-its-recent-magnitude-YQHki (accessed on 1 September 2018).
  38. Seide, F.; Agarwal, A. CNTK: Microsoft’s open-source deep-learning toolkit. In Proceedings of the 22nd ACM SIGKDD International Conference on Knowledge Discovery and Data Mining, San Francisco, CA, USA, 13–17 August 2016; p. 2135. [Google Scholar] [CrossRef]
  39. Goutte, C.; Gaussier, E. A probabilistic interpretation of precision, recall and F-score, with implication for evaluation. In Proceedings of the European Conference on Information Retrieval, Vienna, Austria, 29 March–1 April 2015; Springer: Berlin/Heidelberg, Germany; pp. 345–359. [Google Scholar]
  40. Yamazaki, F.; Iwasaki, Y.; Liu, W.; Nonaka, T.; Sasagawa, T. Detection of damage to building side-walls in the 2011 Tohoku, Japan earthquake using high-resolution TerraSAR-X images. In Proceedings of the Image and Signal Processing for Remote Sensing XIX, Dresden, Germany, 23–25 September 2013. [Google Scholar] [CrossRef]
Figure 1. Study area and WorldView-2 data used in this study. (a) Map of the study area in the Tohoku region of Japan: (b) training area (red rectangle areas) and validation area (blue rectangle areas). (c) Post-event WorldView-2 Imagery in Ishinomak area. (d) Post-event WorldView-2 Imagery in Onagawa area. (e) Post-event WorldView-2 Imagery in Minamisanriku area. (f) Post-event WorldView-2 Imagery in validation area. (g) Re-categorized three classes of reference data in Ishinomak area. (h) Zoomed-in reference data in Ishinomak area.
Remotesensing 10 01626 g001
Figure 2. Framework of damage-mapping proposed in this study.
Remotesensing 10 01626 g002
Figure 3. Blocks of neural network units. (a) Neural unit in U-net (Ronneberger et al., 2015). (b) Neural unit of U-net in this work. (c) Neural unit in Deep Residual U-net(Zhang et al., 2018) [33].
Remotesensing 10 01626 g003
Figure 4. Architecture of the U-net convolutional neural network in this study.
Remotesensing 10 01626 g004
Figure 5. Relationship between the cross-entropy loss and the number of epochs during the training.
Remotesensing 10 01626 g005
Figure 6. Damage-mapping result: (a) Validation area in the south-eastern part of Ishinomaki city; (b) zoomed-in details in the validation area; (c) ground-truth data; (d) damage-mapping result using U-net; (e) damage-mapping result using deep residual U-net.
Remotesensing 10 01626 g006
Figure 7. Error analysis. (a) An example of collapsed buildings in the 2011 Tohoku Tsunami; (b) post-event high-resolution optical image of the collapsed building.
Remotesensing 10 01626 g007
Figure 8. Timeliness for Operational Damage-Mapping.
Remotesensing 10 01626 g008
Table 1. Description of the high-resolution WorldView-2 imagery in the study.
DatasetsAcquisition TimeSensorSpectral BandsGround Sample Distance
Pre-disaster13 May 2009WorldView-24-band multispectral0.6 m
9 November 2006
17 February 2006
18 July 2004
Post-disaster8 June 2011
6 April 2011
18 July 2011
Table 2. Assessment of the regional damage-mapping.
U-Net Model Deep Residual U-net Model
Omission ErrorCommission ErrorF-score Omission ErrorCommission ErrorF-Score
Washed Away39.0%75.6%0.35 35.2%85.6%0.24
Collapsed51.2%66.2%0.40 48.6%72.3%0.36
Survived22.7%29.9%0.76 51.9%28.2%0.58
Overall Accuracy = 70.9% Overall Accuracy = 54.8%
Table 3. Free-source high-resolution satellite imagery provided through the DigitalGlobe Open Data program for major disaster events in the past decades 1 .
Disaster EventOccur DateData Available TimeTime Gap (Day)
2017 Santa Rosa Wildfires8 October 201710 October 20172
2017 Southern Mexico Earthquake8 September 20178 September 20171
2017 Monsoon in Nepal, India14 August 201717 August 20173
2017 Sierra Leone Mudslide14 August 201715 August 20171
2017 Mocoa Landslide1 April 20178 April 20177
2017 Tropical Cyclone Enawo7 March 201710 March 20173
2016 Ecuador Earthquake16 April 201517 April 20151
2015 Nepal Earthquake25 April 201526 April 20151
2010 Haiti Earthquake12 January 201012 January 20103
1 The information was obtained from the DigitalGlobe Open Data Program website (https://www.digitalglobe.com/opendata/all-events).

