Ecosystem Services in a Protected Mountain Range of Portugal: Satellite-Based Products for State and Trend Analysis

 ,
,  , ,
, ,  , and
, and
Abstract
:
1. Introduction
2. Materials and Methods
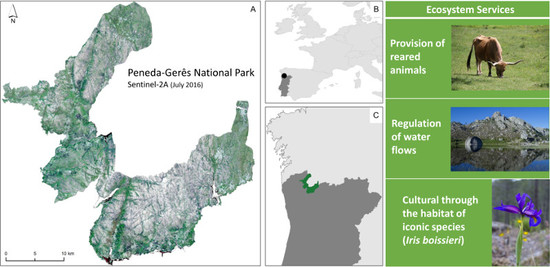
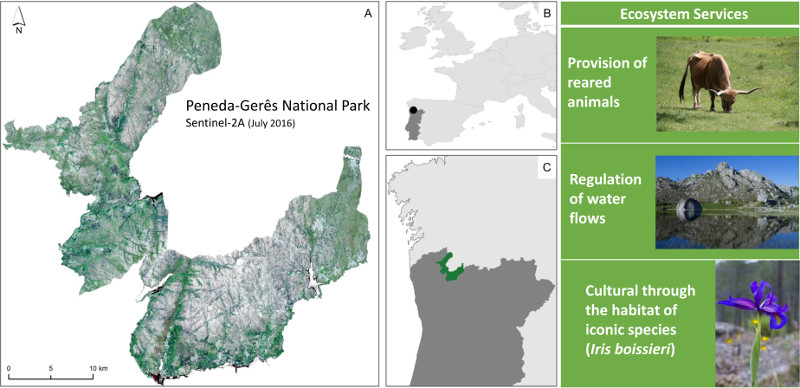
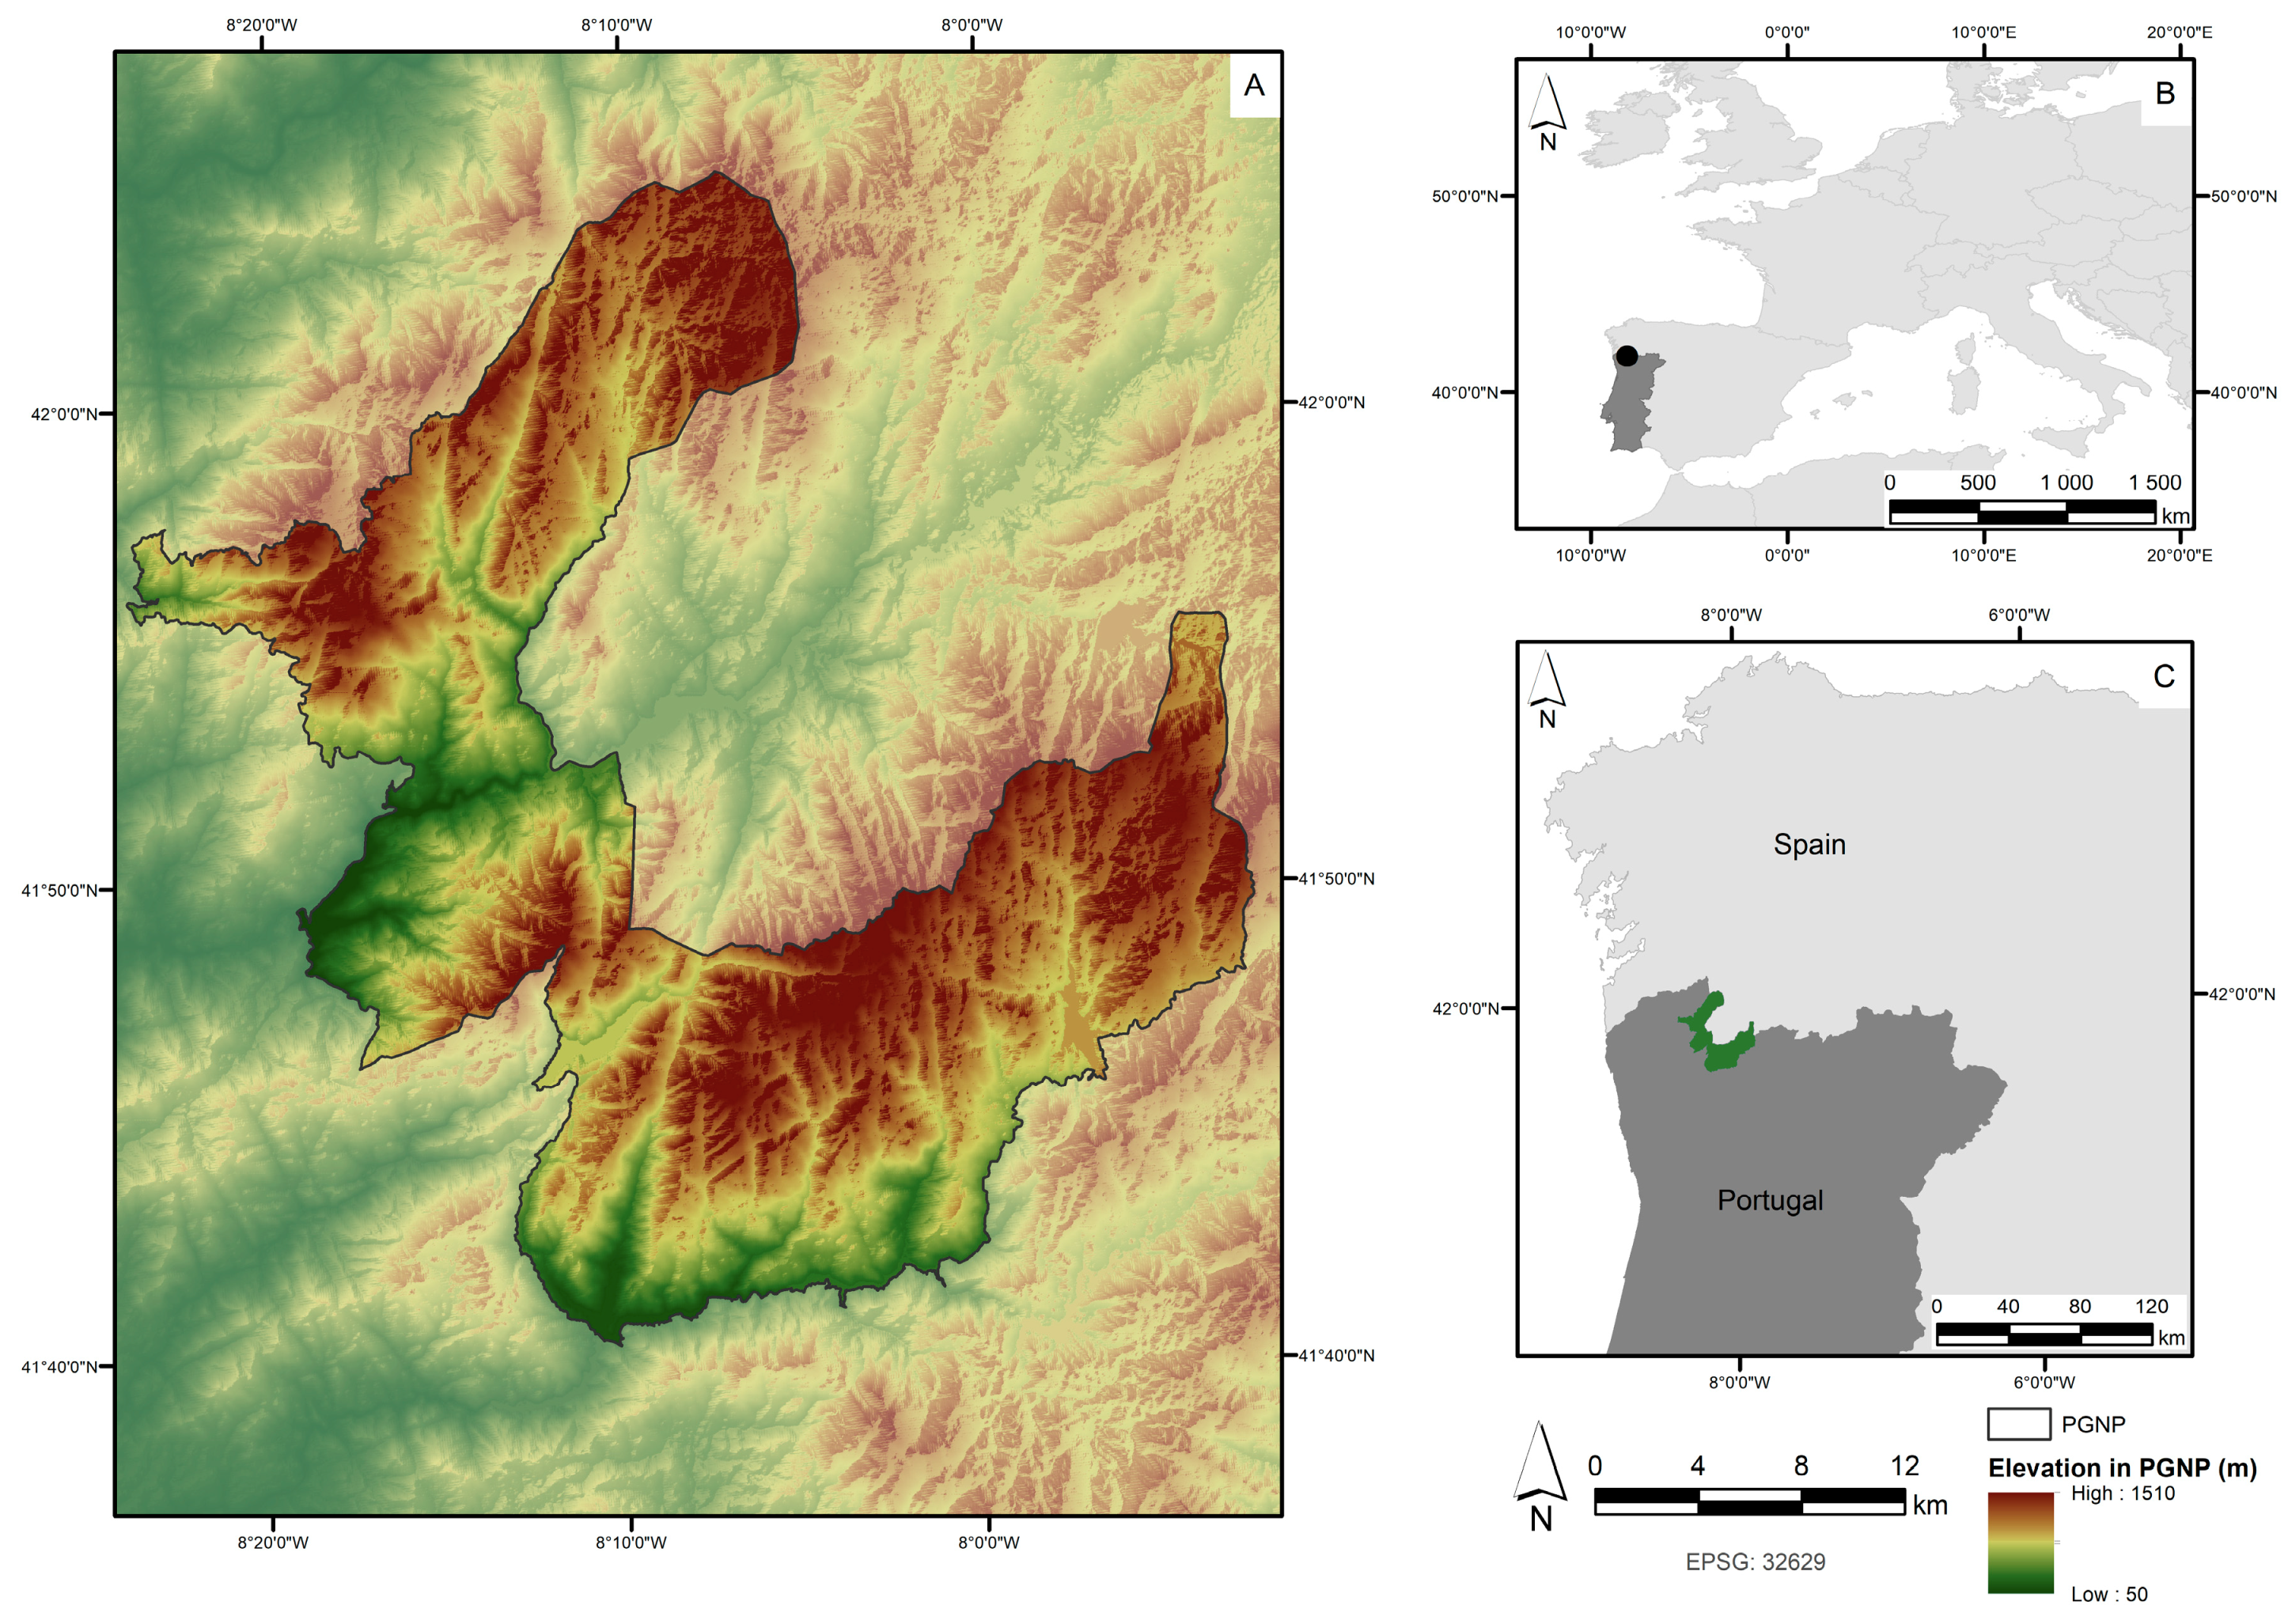
2.1. Study Area
2.2. Selection of Ecosystem Services and Indicators
2.3. Computation of Ecosystem Service Indicators
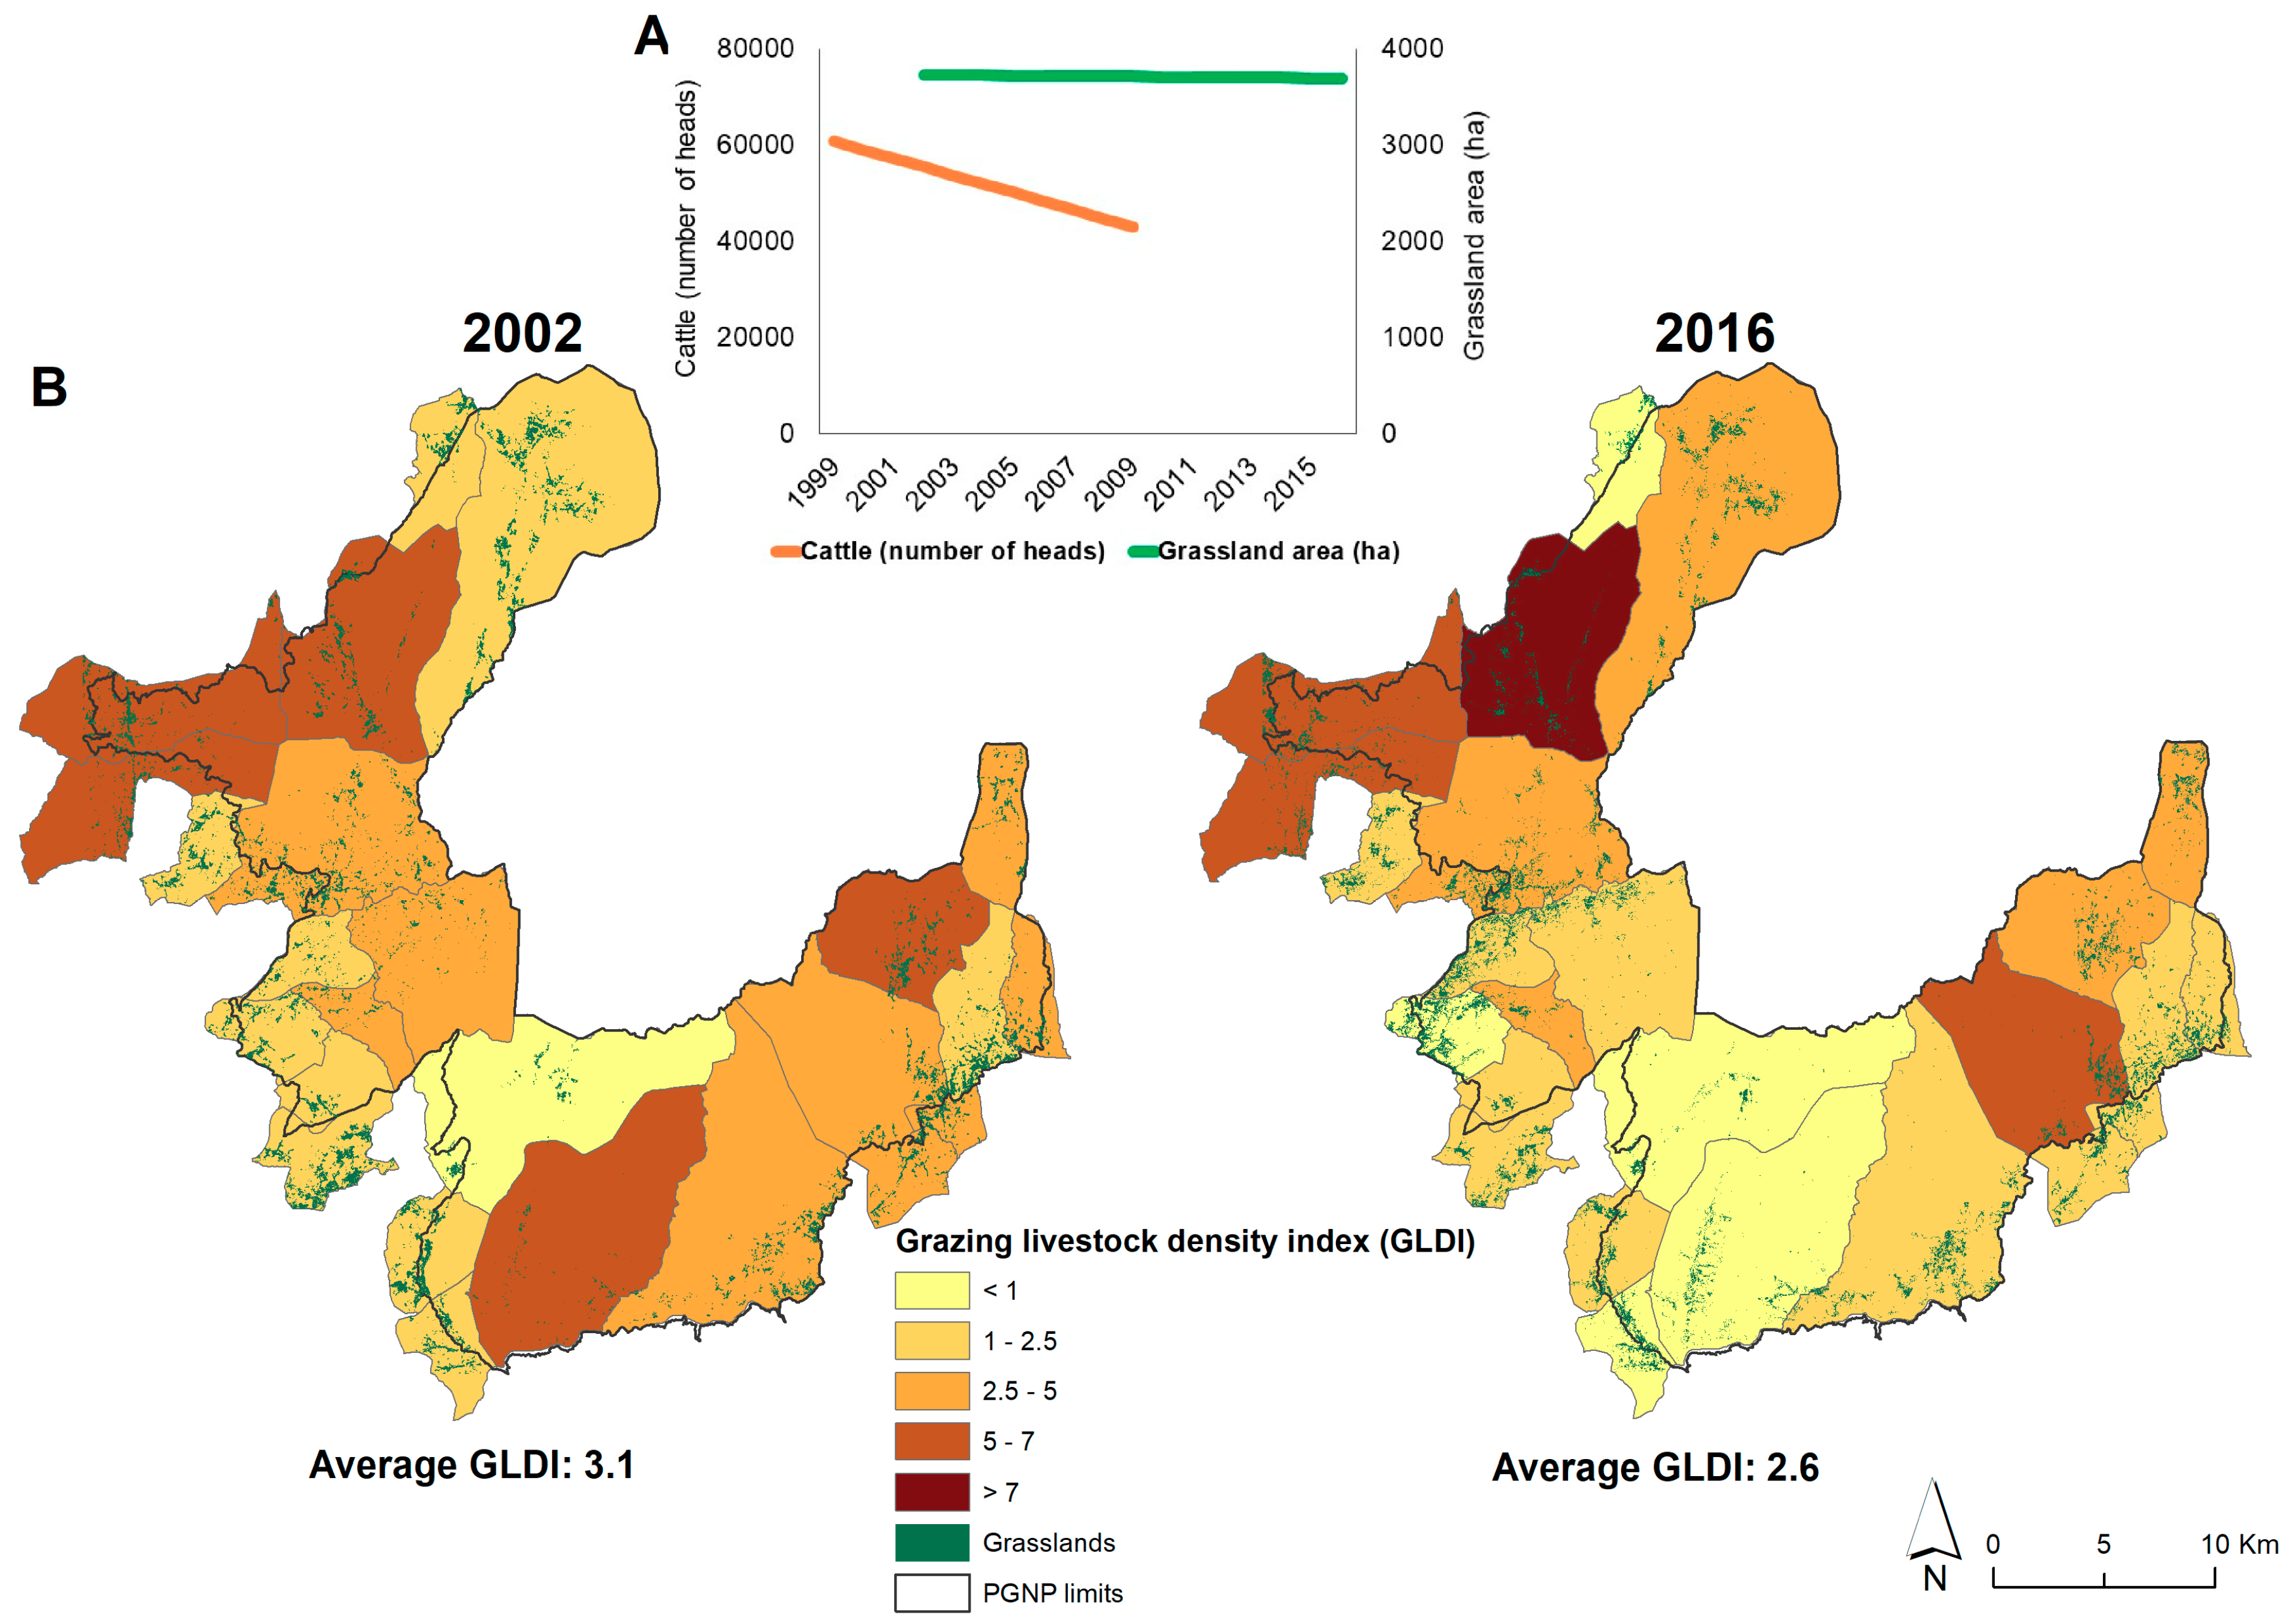
2.3.1. Provision of Reared Animals
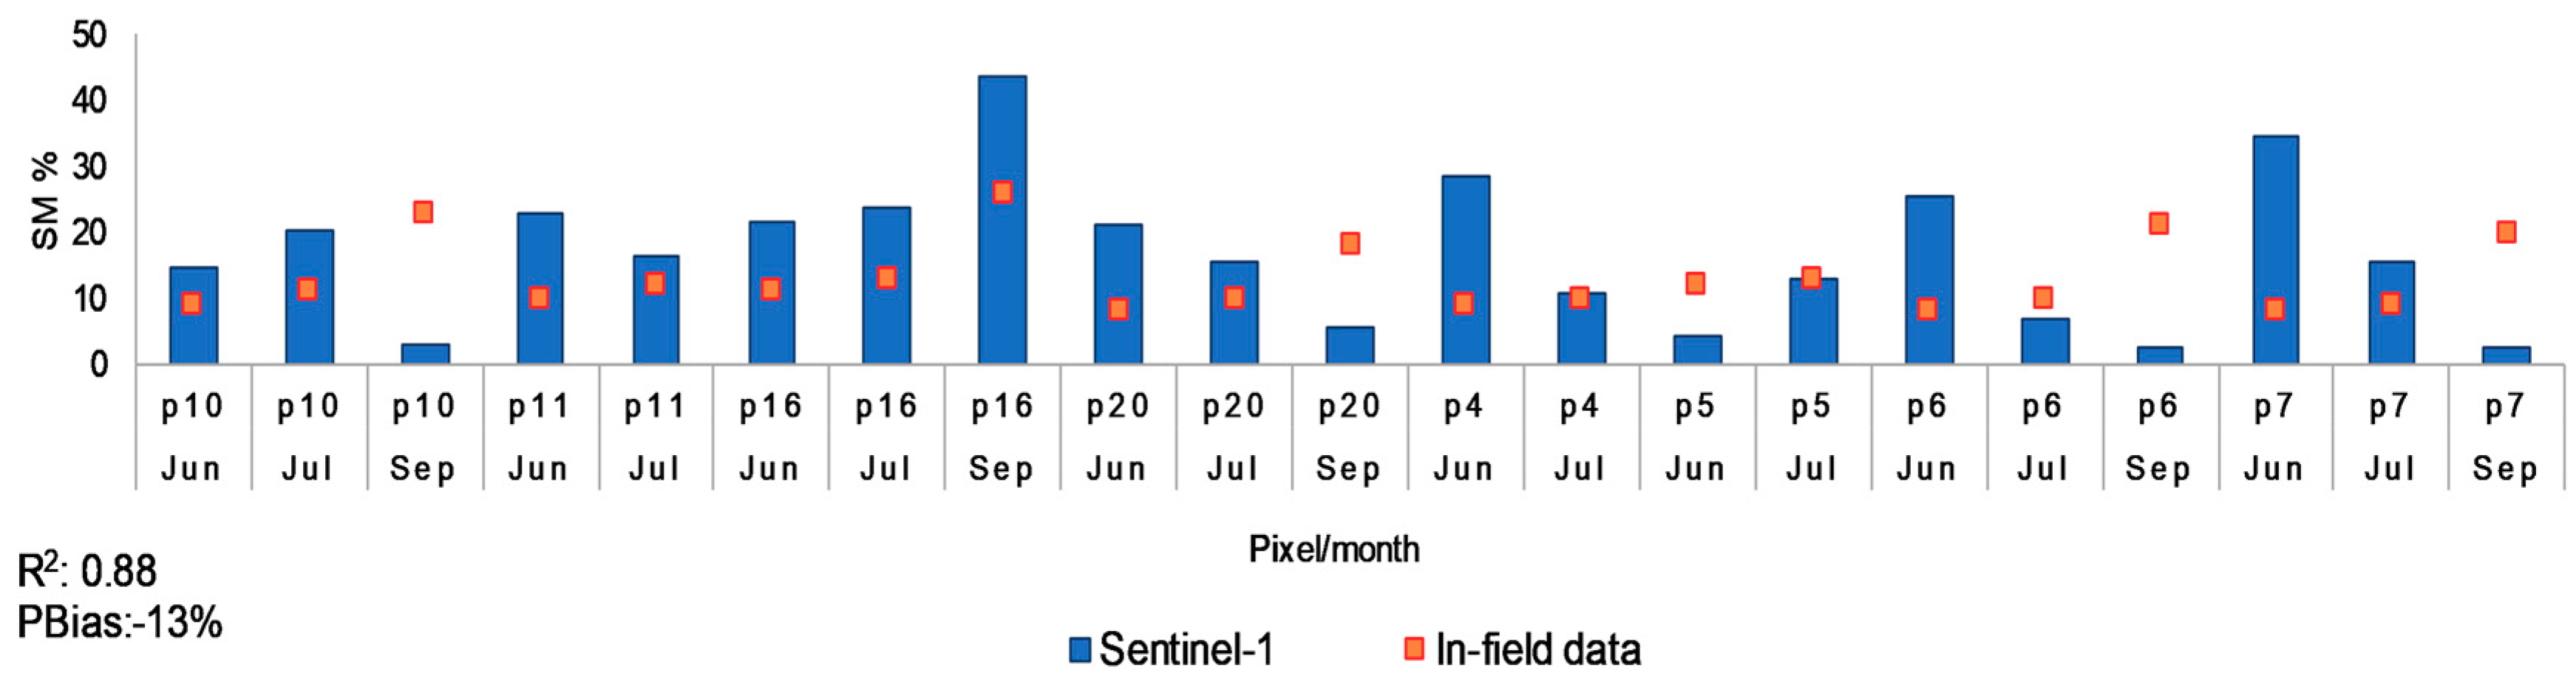
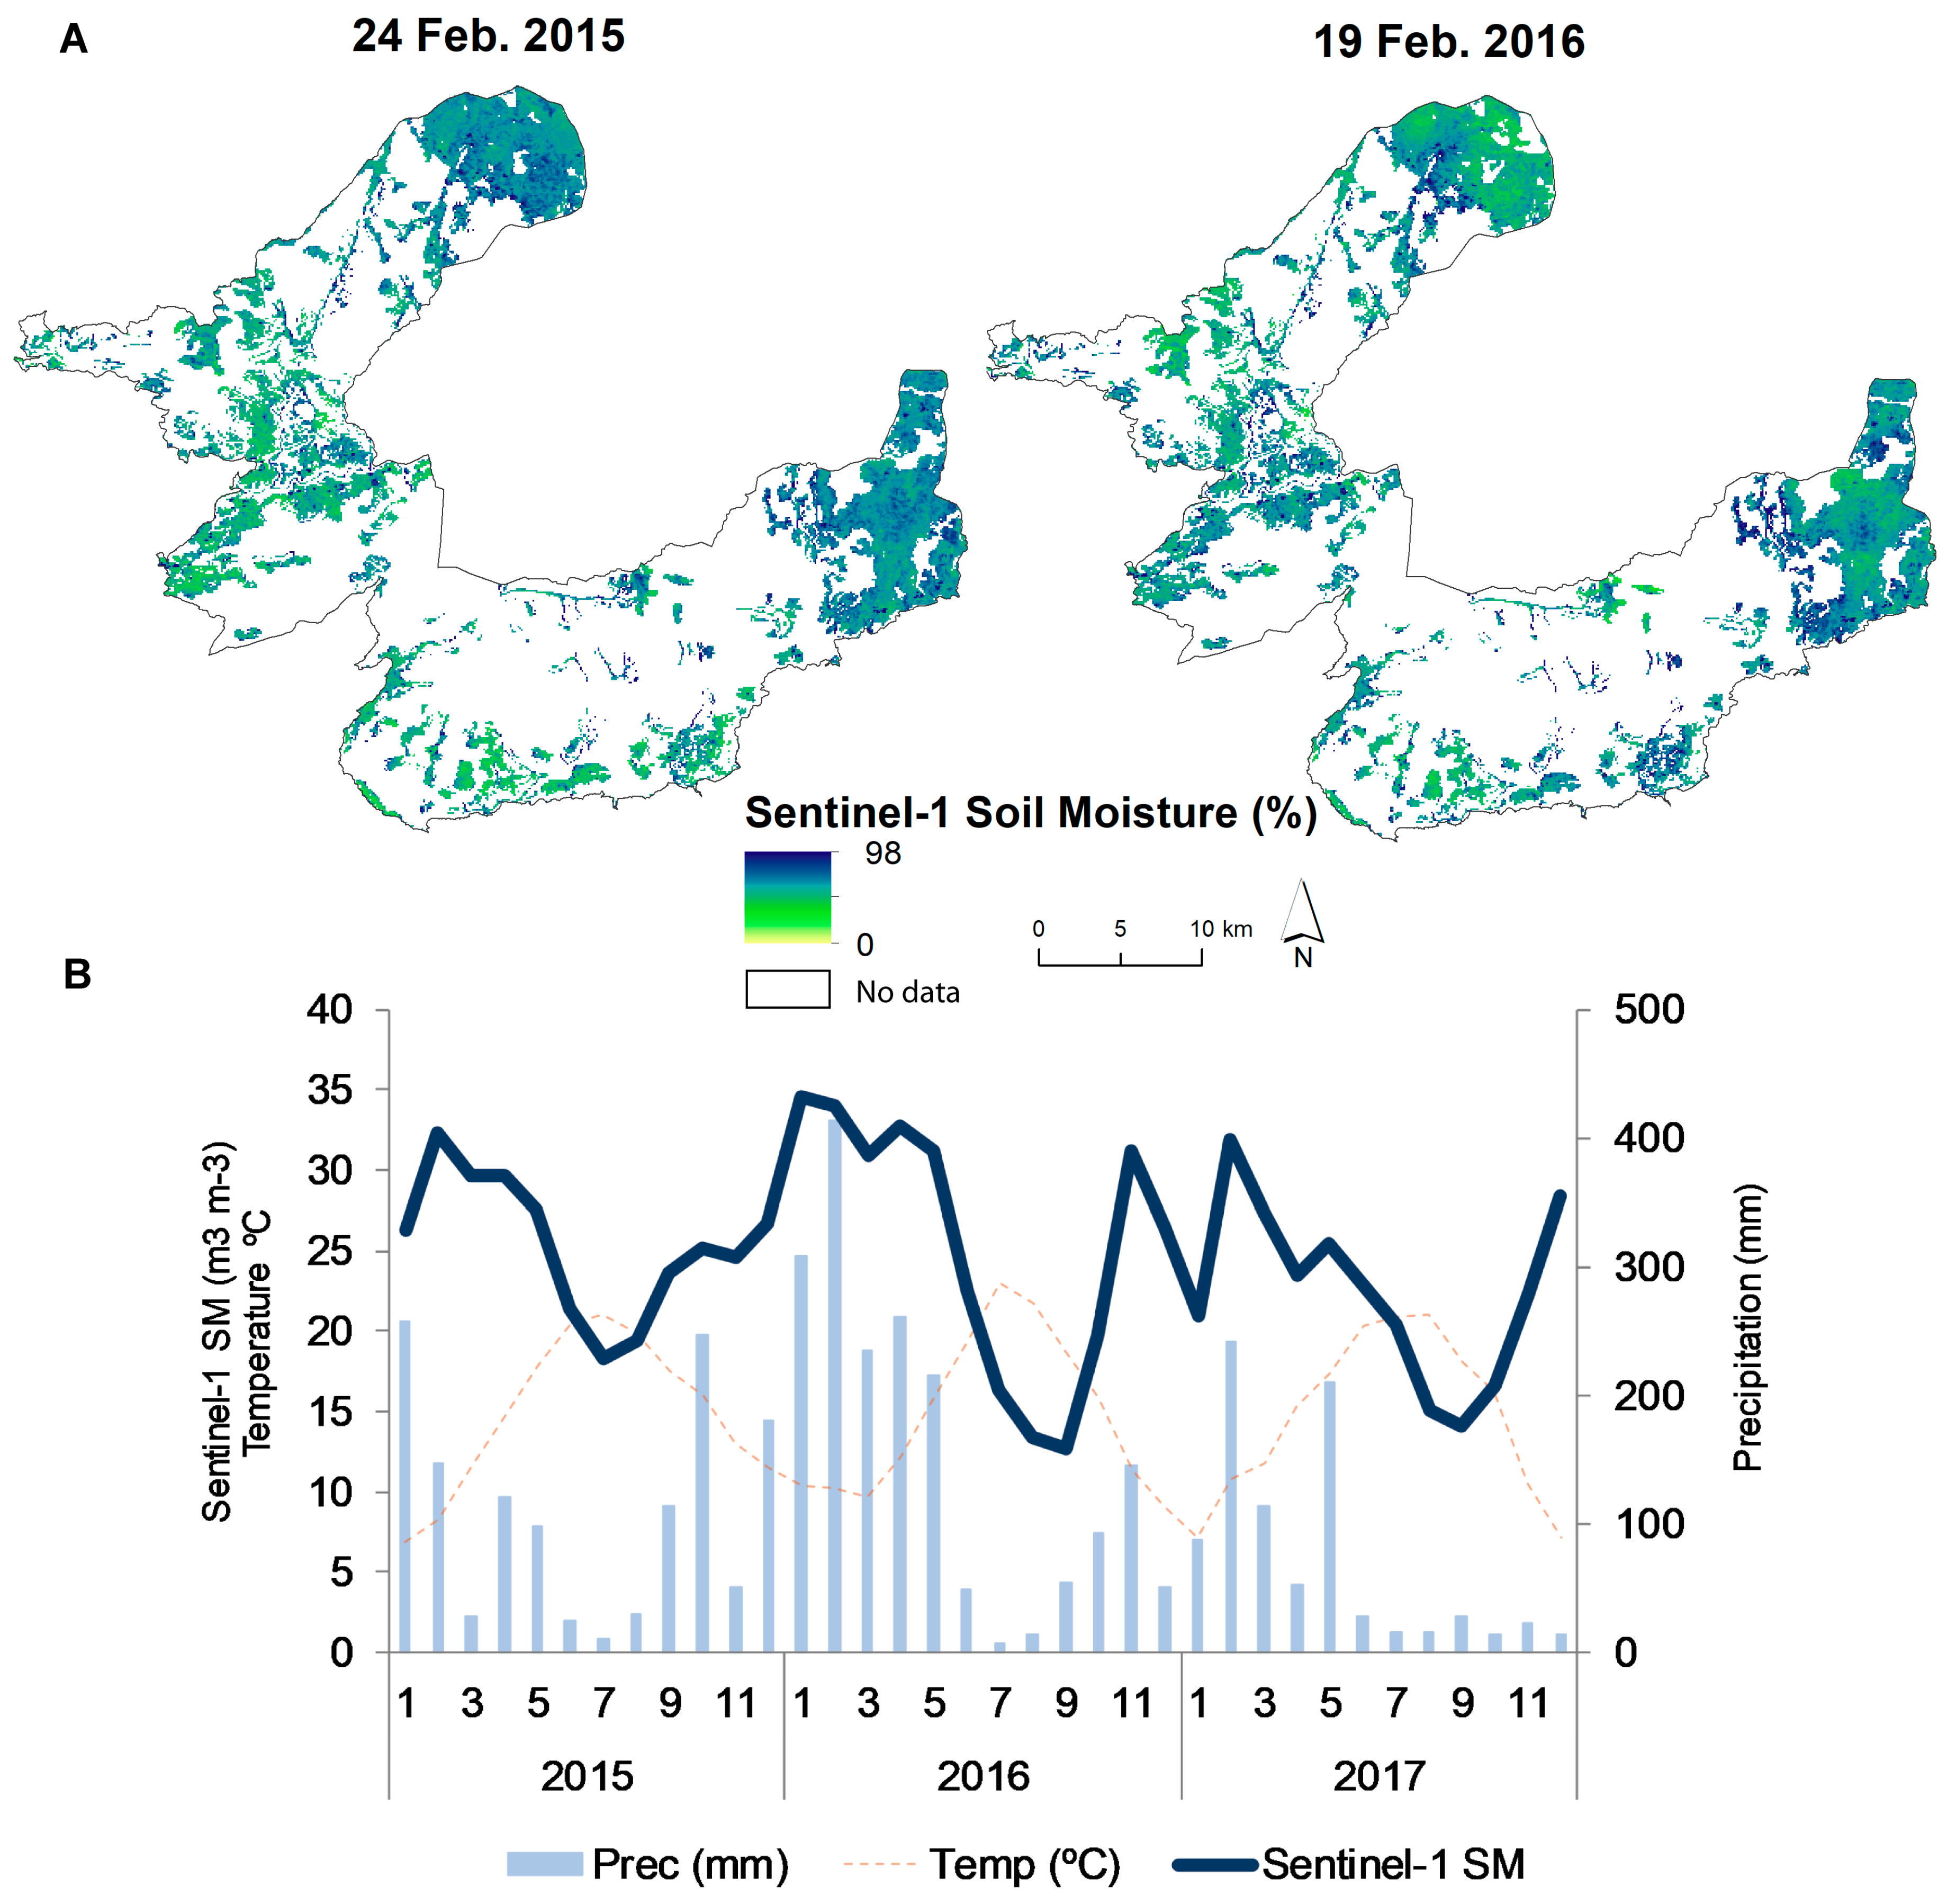
2.3.2. Regulation of Water Flows
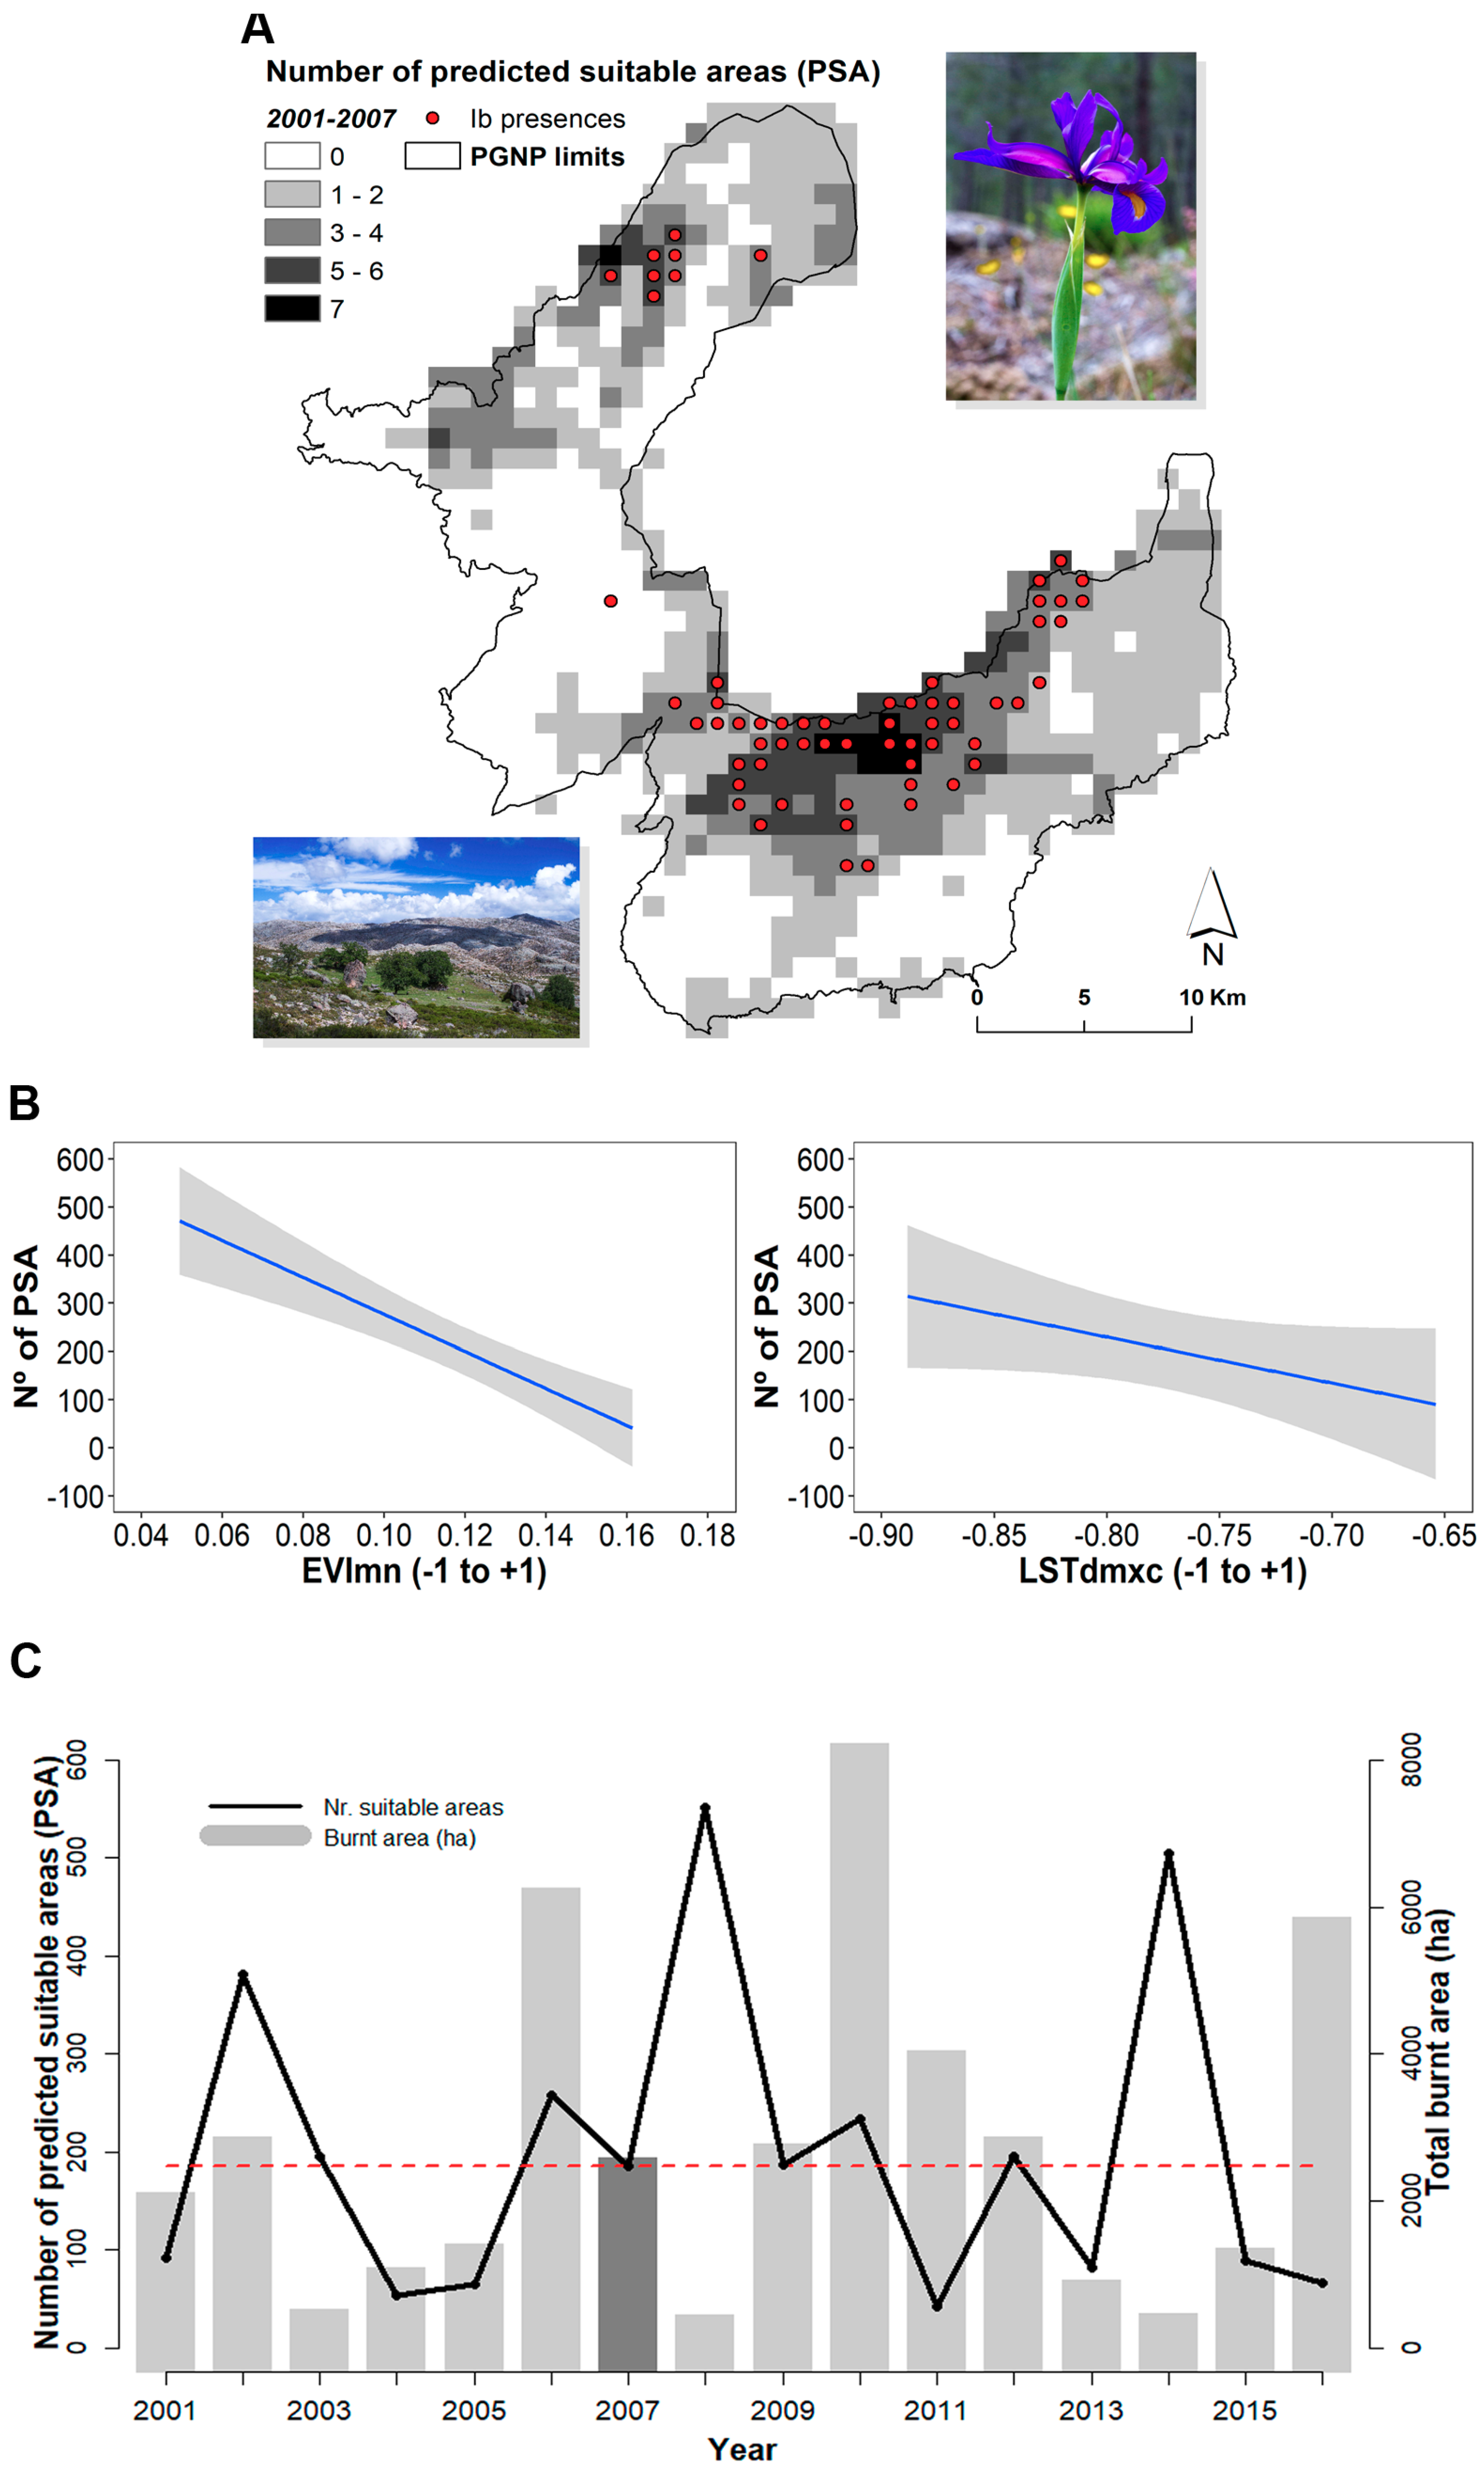
2.3.3. Habitat Suitability for the Iconic Species Iris boissieri
3. Results and Discussion
3.1. Reared Animals
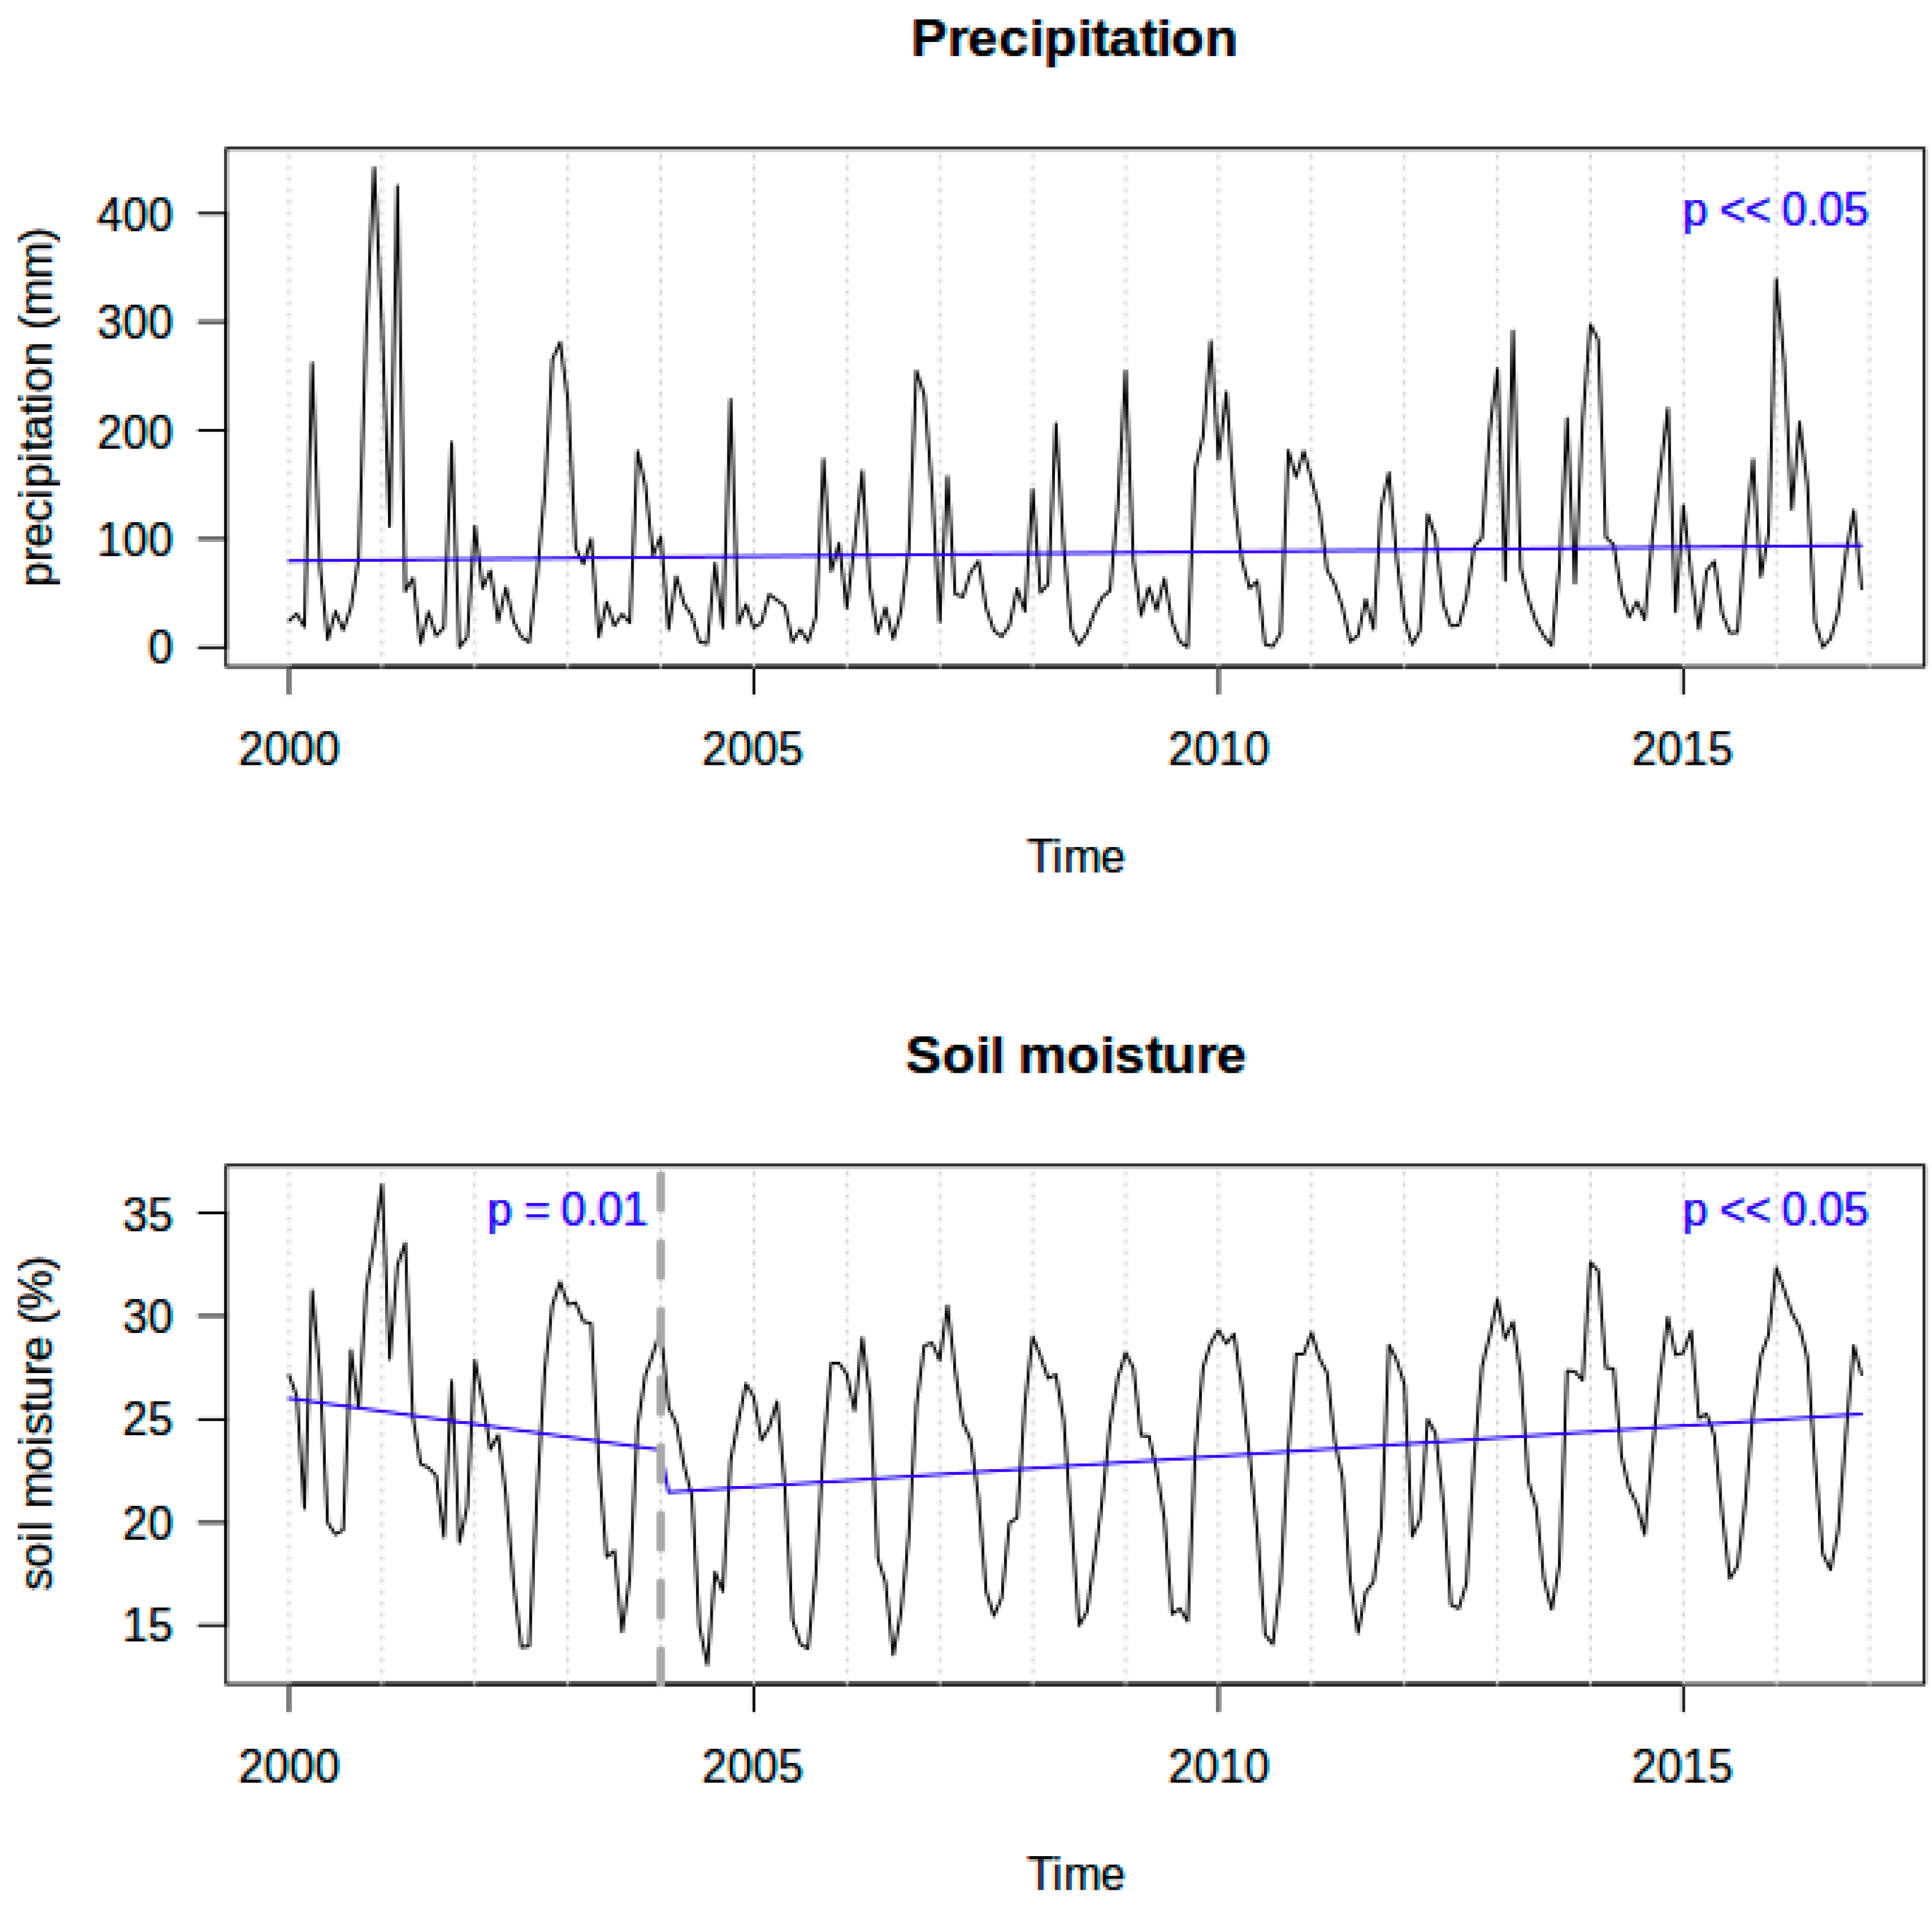
3.2. Regulation of Water Flows
3.3. Habitat Suitability for the Iconic Species Iris boissieri
3.4. Satellite-Based Indicators for Monitoring Ecosystem Services in Mountains
4. Conclusions
Author Contributions
Funding
Acknowledgments
Conflicts of Interest
References
- Grêt-Regamey, A.; Brunner, S.H.; Kienast, F. Mountain Ecosystem Services: Who Cares? Mt. Res. Dev. 2012, 32, S23–S34. [Google Scholar] [CrossRef]
- Walz, A.; Grêt-Regamey, A.; Lavorel, S. Social valuation of ecosystem services in mountain regions. Reg. Environ. Chang. 2016, 16, 1985–1987. [Google Scholar] [CrossRef] [Green Version]
- Viviroli, D.; Weingartner, R. “Water Towers”—A Global View of the Hydrological Importance of Mountains. In Mountains: Sources of Water, Sources of Knowledge; Wiegandt, E., Ed.; Springer: Dordrecht, The Netherlands, 2008; pp. 15–20. [Google Scholar]
- Lasanta, T.; Arnáez, J.; Pascual, N.; Ruiz-Flaño, P.; Errea, M.P.; Lana-Renault, N. Space–time process and drivers of land abandonment in Europe. Catena 2017, 149, 810–823. [Google Scholar] [CrossRef]
- Bernués, A.; Rodríguez-Ortega, T.; Ripoll-Bosch, R.; Alfnes, F. Socio-Cultural and Economic Valuation of Ecosystem Services Provided by Mediterranean Mountain Agroecosystems. PLoS ONE 2014, 9, e102479. [Google Scholar] [CrossRef] [PubMed]
- Leal Filho, W.; Mandel, M.; Al-Amin, A.Q.; Feher, A.; Chiappetta Jabbour, C.J. An assessment of the causes and consequences of agricultural land abandonment in Europe. Int. J. Sustain. Dev. World Ecol. 2017, 24, 554–560. [Google Scholar] [CrossRef]
- Estel, S.; Kuemmerle, T.; Alcántara, C.; Levers, C.; Prishchepov, A.; Hostert, P. Mapping farmland abandonment and recultivation across Europe using MODIS NDVI time series. Remote Sens. Environ. 2015, 163, 312–325. [Google Scholar] [CrossRef]
- Sil, Â.; Rodrigues, A.P.; Carvalho-Santos, C.; Nunes, J.P.; Honrado, J.; Alonso, J.; Marta-Pedroso, C.; Azevedo, J.C. Trade-offs and Synergies Between Provisioning and Regulating Ecosystem Services in a Mountain Area in Portugal Affected by Landscape Change. Mt. Res. Dev. 2016, 36, 452–464. [Google Scholar] [CrossRef] [Green Version]
- Schirpke, U.; Meisch, C.; Tappeiner, U. Symbolic species as a cultural ecosystem service in the European Alps: insights and open issues. Landsc. Ecol. 2018, 33, 1–20. [Google Scholar] [CrossRef]
- Castro, A.J.; Martín-López, B.; López, E.; Plieninger, T.; Alcaraz-Segura, D.; Vaughn, C.C.; Cabello, J. Do protected areas networks ensure the supply of ecosystem services? Spatial patterns of two nature reserve systems in semi-arid Spain. Appl. Geogr. 2015, 60, 1–9. [Google Scholar] [CrossRef]
- Cabello, J.; Lourenço, P.; Reyes, A.; Alcaraz-Segura, D. Ecosystem services assessment of national park networks for functional diversity and carbon conservation strategies with remote sensing. In Earth Observations of Ecosystem Services; Alcaraz-Segura, D., Di Bella, C.M., Straschnoy, J.V., Eds.; CRC Press Taylors and Francis Group: Boca Raton, FL, USA, 2013; pp. 179–200. [Google Scholar]
- Pettorelli, N.; Schulte to Bühne, H.; Tulloch, A.; Dubois, G.; Macinnis-Ng, C.; Queirós, A.M.; Keith, D.A.; Wegmann, M.; Schrodt, F.; Stellmes, M.; et al. Satellite remote sensing of ecosystem functions: opportunities, challenges and way forward. Remote Sens. Ecol. Conserv. 2018, 4, 71–93. [Google Scholar] [CrossRef]
- de Araujo Barbosa, C.C.; Atkinson, P.M.; Dearing, J.A. Remote sensing of ecosystem services: A systematic review. Ecol. Indic. 2015, 52, 430–443. [Google Scholar] [CrossRef]
- Carvalho-Santos, C.; Marcos, B.; Espinha Marques, J.; Hein, L.; Honrado, J.P. Evaluation of Hydrological Ecosystem Services through Remote Sensing. In Earth Observations of Ecosystem Services; Alcaraz-Segura, D., Di Bella, C.M., Straschnoy, J.V., Eds.; CRC Press: Boca Raton, FL, USA, 2013; pp. 219–249. [Google Scholar]
- Cord, A.F.; Brauman, K.A.; Chaplin-Kramer, R.; Huth, A.; Ziv, G.; Seppelt, R. Priorities to Advance Monitoring of Ecosystem Services Using Earth Observation. Trends Ecol. Evol. 2017, 32, 416–428. [Google Scholar] [CrossRef] [PubMed] [Green Version]
- Pereira, H.M.; Ferrier, S.; Walters, M. Essential Biodiversity Variables. Science 2013, 339, 277–278. [Google Scholar] [CrossRef] [PubMed] [Green Version]
- Reyers, B.; Stafford-Smith, M.; Erb, K.H.; Scholes, R.J.; Selomane, O. Essential Variables help to focus Sustainable Development Goals monitoring. Curr. Opin. Environ. Sustain. 2017, 26–27, 97–105. [Google Scholar] [CrossRef]
- Su, Z.; Roebeling, R.A.; Schulz, J.; Holleman, I.; Timmermans, W.J.; Rott, H.; Mognard-Campbell, N.; de Jeu, R.; Wagner, W.; Rodell, M.; et al. Observation of hydrological processes using remote sensing BT—Treatise on Water Science. In Treatise on Water Science; Wilderer, P., Ed.; ELSEVIER: Amsterdam, The Netherlands, 2012; Volume 2, pp. 351–399. [Google Scholar]
- Ceauşu, S.; Gomes, I.; Pereira, H.M. Conservation Planning for Biodiversity and Wilderness: A Real-World Example. Environ. Manag. 2015, 55, 1168–1180. [Google Scholar] [CrossRef] [PubMed] [Green Version]
- Aguiar, C.; Rodrigues, O.; Azevedo, J.; Domingos, T. Montanha. Ecossistemas e Bem-Estar Humano—Avaliação do Millenium Ecosystem Assessment Portugal. Available online: https://bit.ly/2DqdemQ (accessed on 15 September 2015).
- Haines-Young, R.; Potschin, M. CICES (Common International Classification of Ecosystem Services) V5.1 and Guidance on the Application of the Revised Structure. Available online: https://bit.ly/2xBmcbv (accessed on 15 September 2018).
- Maes, J.; Liquete, C.; Teller, A.; Erhard, M.; Paracchini, M.L.; Barredo, J.I.; Grizzetti, B.; Cardoso, A.; Somma, F.; Petersen, J.E.; et al. An indicator framework for assessing ecosystem services in support of the EU Biodiversity Strategy to 2020. Ecosyst. Serv. 2016, 17, 14–23. [Google Scholar] [CrossRef]
- Wang, L.; Qu, J.J. Satellite remote sensing applications for surface soil moisture monitoring: A review. Front. Earth Sci. China 2009, 3, 237–247. [Google Scholar] [CrossRef]
- INE Instituto Nacional de Estatística (Statistics Portugal) Recenseamento Agrícola for 2009 and 1999 (Agrarian Census). Available online: www.ine.pt (accessed on 25 September 2018).
- Olofsson, P.; Foody, G.M.; Stehman, S.V.; Woodcock, C.E. Making better use of accuracy data in land change studies: Estimating accuracy and area and quantifying uncertainty using stratified estimation. Remote Sens. Environ. 2013, 129, 122–131. [Google Scholar] [CrossRef]
- Hu, Q.; Wu, W.; Xia, T.; Yu, Q.; Yang, P.; Li, Z.; Song, Q. Exploring the use of google earth imagery and object-based methods in land use/cover mapping. Remote Sens. 2013, 5, 6026–6042. [Google Scholar] [CrossRef]
- Bojinski, S.; Verstraete, M.; Peterson, T.C.; Richter, C.; Simmons, A.; Zemp, M. The concept of essential climate variables in support of climate research, applications, and policy. Bull. Am. Meteorol. Soc. 2014, 95, 1431–1443. [Google Scholar] [CrossRef]
- Dorigo, W.; Wagner, W.; Albergel, C.; Albrecht, F.; Balsamo, G.; Brocca, L.; Chung, D.; Ertl, M.; Forkel, M.; Gruber, A.; et al. ESA CCI Soil Moisture for improved Earth system understanding: State-of-the art and future directions. Remote Sens. Environ. 2017, 203, 185–215. [Google Scholar] [CrossRef]
- Blonda, P.; Lucas, R. EO Biophysical Parameters, Land Use and Habitats Extraction Modules (Deliverable 4.2) ECOPOTENTIAL-SC5-16-2014-N. 641762. 2017, pp. 1–129. Available online: http://www.ecopotential-project (accessed on 30 September 2018).
- Rodell, M.; Houser, P.R.; Jambor, U.; Gottschalck, J.; Mitchell, K.; Meng, C.J.; Arsenault, K.; Cosgrove, B.; Radakovich, J.; Bosilovich, M.; et al. The Global Land Data Assimilation System. Available online: https://bit.ly/2O7olF7 (accessed on 25 September 2018).
- Dorigo, W.A.; Wagner, W.; Hohensinn, R.; Hahn, S.; Paulik, C.; Xaver, A.; Gruber, A.; Drusch, M.; Mecklenburg, S.; Van Oevelen, P.; et al. The International Soil Moisture Network: A data hosting facility for global in situ soil moisture measurements. Hydrol. Earth Syst. Sci. 2011, 15, 1675–1698. [Google Scholar] [CrossRef]
- F. Greifeneder PYthon Sentinel-1 Soil-Moisture Mapping Toolbox (PYSMM). Available online: https://bit.ly/2xMYubq (accessed on 30 September 2018).
- R Core Team. R: A Language and Environment for Statistical Computing; R Foundation for Statistical Computing: Vienna, Austria, 2014; Available online: https://www.R-project.org/ (accessed on 25 September 2018).
- Gruber, A.; Dorigo, W.A.; Crow, W.; Wagner, W. Triple Collocation-Based Merging of Satellite Soil Moisture Retrievals. IEEE Trans. Geosci. Remote Sens. 2017, 55, 6780–6792. [Google Scholar] [CrossRef]
- Haylock, M.R.; Hofstra, N.; Klein Tank, A.M.G.; Klok, E.J.; Jones, P.D.; New, M. A European daily high-resolution gridded data set of surface temperature and precipitation for 1950–2006. J. Geophys. Res. Atmos. 2008, 113, 1–12. [Google Scholar] [CrossRef]
- Verbesselt, J.; Hyndman, R.; Newnham, G.; Culvenor, D. Detecting trend and seasonal changes in satellite image time series. Remote Sens. Environ. 2010, 114, 106–115. [Google Scholar] [CrossRef]
- Hirsch, R.M.; Slack, J.R.; Smith, R.A. Techniques of trend analysis for monthly water quality data. Water Resour. Res. 1982, 18, 107–121. [Google Scholar] [CrossRef]
- MEA (Millenium Ecosystem Assessment). Available online: https://bit.ly/2xVWygI (accessed on 30 September 2018).
- Daniel, T.C.; Muhar, A.; Arnberger, A.; Aznar, O.; Boyd, J.W.; Chan, K.M.A.; Costanza, R.; Elmqvist, T.; Flint, C.G.; Gobster, P.H.; et al. Contributions of cultural services to the ecosystem services agenda. Proc. Natl. Acad. Sci. USA 2012, 109, 8812–8819. [Google Scholar] [CrossRef] [PubMed] [Green Version]
- Arenas-Castro, S.; Gonçalves, J.; Alves, P.; Alcaraz-Segura, D.; Honrado, J.P. Assessing the multi-scale predictive ability of ecosystem functional attributes for species distribution modelling. PLoS ONE 2018, 13, 1–31. [Google Scholar] [CrossRef] [PubMed]
- Thuiller, W.; Georges, D.; Engler, R. Biomod2: Ensemble Platform for Species Distribution Modeling. R Package Version 3.1±64. Available online: https://bit.ly/2xIR6xC (accessed on 25 September 2018).
- Lawson, C.R.; Hodgson, J.A.; Wilson, R.J.; Richards, S.A. Prevalence, thresholds and the performance of presence-absence models. Methods Ecol. Evol. 2014, 5, 54–64. [Google Scholar] [CrossRef]
- Freeman, E.A.; Moisen, G.G. A comparison of the performance of threshold criteria for binary classification in terms of predicted prevalence and kappa. Ecol. Model. 2008, 217, 48–58. [Google Scholar] [CrossRef]
- Cerqueira, Y.; Araújo, C.; Vicente, J.; Pereira, H.M.; Honrado, J. Ecological and Cultural Consequences of Agricultural Abandonment in the Peneda-Gerês National Park (Portugal). In Natural Heritage from East to West: Case Studies from 6 EU Countries; Evelpidou, N., Figueiredo, T., Mauro, F., Tecim, V., Vassilopoulos, A., Eds.; Springer: Berlin, Germany, 2010; pp. 175–183. [Google Scholar]
- Pereira, E.; Queiroz, C.; Pereira, H.M.; Vicente, L. Ecosystem Services and Human Well-Being: A Participatory Study in a Mountain Community in Portugal. Available online: https://bit.ly/2Q3M6vf (accessed on 25 September 2018).
- van der Zanden, E.H.; Carvalho-Ribeiro, S.M.; Verburg, P.H. Abandonment landscapes: user attitudes, alternative futures and land management in Castro Laboreiro, Portugal. Reg. Environ. Chang. 2018, 18, 1509–1520. [Google Scholar] [CrossRef] [Green Version]
- Pôças, I.; Cunha, M.; Marcal, A.R.S.; Pereira, L.S. An evaluation of changes in a mountainous rural landscape of Northeast Portugal using remotely sensed data. Landsc. Urban Plan. 2011, 31, 871–880. [Google Scholar] [CrossRef]
- Moço, G.; Serrano, E.; Guerreiro, M.; Ferreira, A.F.; Petrucci-Fonseca, F.; Santana, D.; Maia, M.J.; Soriguer, R.C.; Pérez, J.M. Does livestock influence the diet of Iberian ibex Capra pyrenaica in the Peneda-Gerês National Park (Portugal)? Mammalia 2014, 78, 393–399. [Google Scholar] [CrossRef]
- Moreira, F.; Viedma, O.; Arianoutsou, M.; Curt, T.; Koutsias, N.; Rigolot, E.; Barbati, A.; Corona, P.; Vaz, P.; Xanthopoulos, G.; et al. Landscape-wildfire interactions in southern Europe: Implications for landscape management. J. Environ. Manag. 2011, 92, 2389–2402. [Google Scholar] [CrossRef] [PubMed] [Green Version]
- Lomba, A.; Gonçalves, J.; Moreira, F.; Honrado, J. Simulating Long-Term Effects of Abandonment on Plant Diversity in Mediterranean Mountain Farmland. Available online: https://bit.ly/2xzANUM (accessed on 25 September 2018).
- Guilherme, J.L.; Miguel Pereira, H. Adaptation of Bird Communities to Farmland Abandonment in a Mountain Landscape. PLoS ONE 2013, 8. [Google Scholar] [CrossRef] [PubMed]
- Cui, C.; Xu, J.; Zeng, J.; Chen, K.S.; Bai, X.; Lu, H.; Chen, Q.; Zhao, T. Soil Moisture Mapping from Satellites: An Intercomparison of SMAP, SMOS, FY3B, AMSR2, and ESA CCI over Two Dense Network Regions at Different Spatial Scales. Remote Sens. 2017, 10. [Google Scholar] [CrossRef]
- Carvalho-Santos, C.; Nunes, J.P.; Monteiro, A.T.; Hein, L.; Honrado, J.P. Assessing the effects of land cover and future climate conditions on the provision of hydrological services in a medium-sized watershed of Portugal. Hydrol. Process. 2016, 30, 720–738. [Google Scholar] [CrossRef]


| CICES Code | Section | Division | Class | Ecological Clause | Use Clause | Service | Pressures |
|---|---|---|---|---|---|---|---|
| 1.1.3.1 | Provisioning (Biotic) | Biomass | Reared animals for nutritional purposes | Ecological contribution to the rearing of domesticated land-based animals Satellite-based grassland cover (Sentinel-2 and Landsat-7) | Production of food | Reared animals Livestock—Number of cattle heads (state and trend) | Land abandonment Grazing livestock density index |
| 2.2.1.3 | Regulation and Maintenance (Biotic) | Regulation of physical, chemical, biological conditions | Hydrological cycle and water flow regulation | The regulation of water flows by virtue of the chemical and physical properties or characteristics of ecosystems Satellite-based soil moisture (Sentinel-1 and ESA CCI SM) | Assists people in managing and using hydrological systems, and mitigates or prevents potential damage to human use, health or safety | Regulation of water flows Satellite-based soil moisture (state and trend) | Climate change Change in the precipitation pattern |
| 3.2.2.2 | Cultural (Biotic) | Indirect, remote, often indoor interactions with living systems that do not require presence in the environmental setting | Characteristics or features of living systems that have an option or bequest value | The biophysical characteristics or qualities of species or ecosystems Satellite-based ecosystem functional attributes (EFA): EVImn = enhanced vegetation index annual minimum; LSTdmxc = cosine of the date of maximum of land surface temperature | People seek to preserve for future generations for whatever reason | Endangered species or habitat suitability Predicted suitable areas (PSA) for Iris boissieri (model) | Land cover change Habitat disturbance Burnt areas |
© 2018 by the authors. Licensee MDPI, Basel, Switzerland. This article is an open access article distributed under the terms and conditions of the Creative Commons Attribution (CC BY) license (http://creativecommons.org/licenses/by/4.0/).
Share and Cite
Carvalho-Santos, C.; Monteiro, A.T.; Arenas-Castro, S.; Greifeneder, F.; Marcos, B.; Portela, A.P.; Honrado, J.P. Ecosystem Services in a Protected Mountain Range of Portugal: Satellite-Based Products for State and Trend Analysis. Remote Sens. 2018, 10, 1573. https://doi.org/10.3390/rs10101573
Carvalho-Santos C, Monteiro AT, Arenas-Castro S, Greifeneder F, Marcos B, Portela AP, Honrado JP. Ecosystem Services in a Protected Mountain Range of Portugal: Satellite-Based Products for State and Trend Analysis. Remote Sensing. 2018; 10(10):1573. https://doi.org/10.3390/rs10101573
Chicago/Turabian StyleCarvalho-Santos, Claudia, António T. Monteiro, Salvador Arenas-Castro, Felix Greifeneder, Bruno Marcos, Ana Paula Portela, and João Pradinho Honrado. 2018. "Ecosystem Services in a Protected Mountain Range of Portugal: Satellite-Based Products for State and Trend Analysis" Remote Sensing 10, no. 10: 1573. https://doi.org/10.3390/rs10101573