1. Introduction
Wildfires in Southern California (SoCal) are part of the natural cycle under Mediterranean climatic conditions. However, excessive urban growth in SoCal significantly increases the wildland-urban interface, and thus seriously compounds wildfire hazards, resulting in loss of human life and property [
1,
2]. Thus, improving fire danger assessment systems with a high spatial resolution and a wide coverage across the vast wildland is essential for decision makers and fire agencies to develop and implement pro-active policies. To assess wildfire danger, the United States Forest Service (USFS) has developed and utilized the National Fire Danger Rating System (NFDRS) [
3], for which vegetation moisture is a key input.
While the moisture content of dead vegetation in NFDRS can be rather easily obtained from weather-dependent models since dead fuels are dependent on atmospheric variability [
4], estimating the moisture content of live vegetation is more complicated because it depends on physiological properties that may significantly vary among different plant species [
5]. To quantify moisture content of live vegetation, live fuel moisture (LFM) is defined as the percentage ratio of the difference between wet and dry weight to the dry weight of a vegetation sample [
6].
In general, LFM is closely related to fire ignition, propagation, and intensity [
7,
8,
9]. LFM has been incorporated into many fire behavior models (e.g., Fire Area Simulator or FARSITE model). Per Weise et al. [
5], wildfire danger can be categorized with LFM levels (e.g., low: greater than 120%, moderate: between 80% and 120%, high: between 60% and 80%, and critical; less than 60%). Dennison et al. [
9] have suggested that LFM lower than 77% appears to be historically associated with large fires in the Santa Monica Mountains of Los Angeles County, CA. Understanding seasonal trends of LFM can improve seasonal outlooks of LFM change and help to improve effective wildfire management as fire agencies operationally rely on field observations of LFM [
6].
Currently, spatial coverage and temporal sampling of LFM data are severely limited as fieldwork for LFM measurements is labor intensive. LFM is manually measured weekly, biweekly, or monthly at a limited number of sampling sites across SoCal. For example, the Los Angeles County Fire Department typically samples LFM only at 11 disparate sites in its jurisdiction once every two weeks, leaving large data voids in areas where weather and geophysical variations can substantially affect LFM. In this regard, the capability of satellite data to observe LFM in each area around a given LFM site on a nearly daily basis, as compared to the weekly-monthly data from the manual method, can be a major advantage that is beneficial to fire agencies.
A potential approach to overcome the spatial and temporal limitations of manual measurements of LFM is to use vegetation indices (VIs) derived from satellite data. Satellite VI-based LFM estimations that have been attempted in the past were mostly for chamise ecosystems in California [
10,
11,
12,
13] and in Spain [
8]. However, many studies were based on short-term records and statistical relationships without investigating seasonal and interannual characteristics of LFM and VIs based on obsolete satellite data collections with an inaccurate calibration.
Physically, LFM is dependent on precipitation, soil moisture, evapotranspiration, and the physiology of plants [
6,
14]. VIs retrieved from satellite remote sensing measurements are related to surface greenness and biomass of vegetation represented by the green leaf area index [
15], which are impacted by and thereby correlated with LFM. Thus, VI and LFM are interdependent variables with similar seasonal and interannual trends, which suggest a possible estimation of LFM from remotely sensed VI. However, dissimilarities between them also exist. For example, plant growth requires not only moisture, but also optimal temperature and solar radiation, and vegetation moisture can also vary during the complex photosynthetic and xylem embolism processes in different plant species [
16,
17]. Therefore, to retrieve LFM from satellite VI data, it is necessary to conduct a careful investigation of LFM and VI characteristics by utilizing decadal datasets of in-situ and satellite measurements.
Previous studies have attempted to make a point-to-point comparison between LFM and VI or a combination of other VIs (e.g., [
10,
11,
12,
13]). Here, we examine the validity of multiple remotely sensed products used to estimate LFM, and thus we will investigate confounding factors and additional physical parameters necessary in the development of LFM model functions. Moreover, a review of past analyses raised concerns in remotely sensed LFM products [
18]; however, many past results based on Moderate Resolution Imaging Spectroradiometer (MODIS) Collection 5 or earlier versions suffered from serious calibration problems [
19,
20], which caused significant errors in the remotely sensed VI products as recently published by Zhang et al. [
21]. Such calibration problems necessitate a re-evaluation of the use of remotely sensed products to estimate LFM. Our novel approach is to test the LFM relationship with enhanced vegetation index (EVI) that is averaged over various spatial extents centered at each in-situ LFM sampling location. The objectives of this study are to: (1) Compare seasonal and interannual characteristics of LFM with those of VIs calculated from satellite data in SoCal; (2) develop an empirical model function of LFM based on an optimal vegetation index together with temperature data; and, (3) evaluate the feasibility, as well as limitations of the empirical model for wildfire danger assessments.
2. Methods and Materials
2.1. Live Fuel Moisture
Moisture content in live biomass is quantitatively characterized by LFM. LFM is defined as the percentage difference between wet and dry vegetation material over the dry mass of vegetation. Explicitly,
where
mw is weight of the sampled vegetation, and
md is the dry weight of the same sample. Our analysis was carried out primarily on chamise chaparral (
Adenostoma fasciculatum), the most common shrub in the chaparral and regarded as an important fuel component in SoCal. The in-situ LFM dataset was obtained from the national live fuel moisture database (
http://www.wfas.net/index.php/national-fuel-moisture-database-moisture-drought-103). LFM data are collected regularly every one or two weeks; however, the intervals can be longer during wet seasons when leaves and twigs remain wet after rainfall events. In these cases, fire agencies postpone their LFM sampling by a few days to avoid errors in LFM caused by excessive rainwater onto vegetation. To be compared to VIs, the LFM dataset was linearly interpolated at a daily time scale.
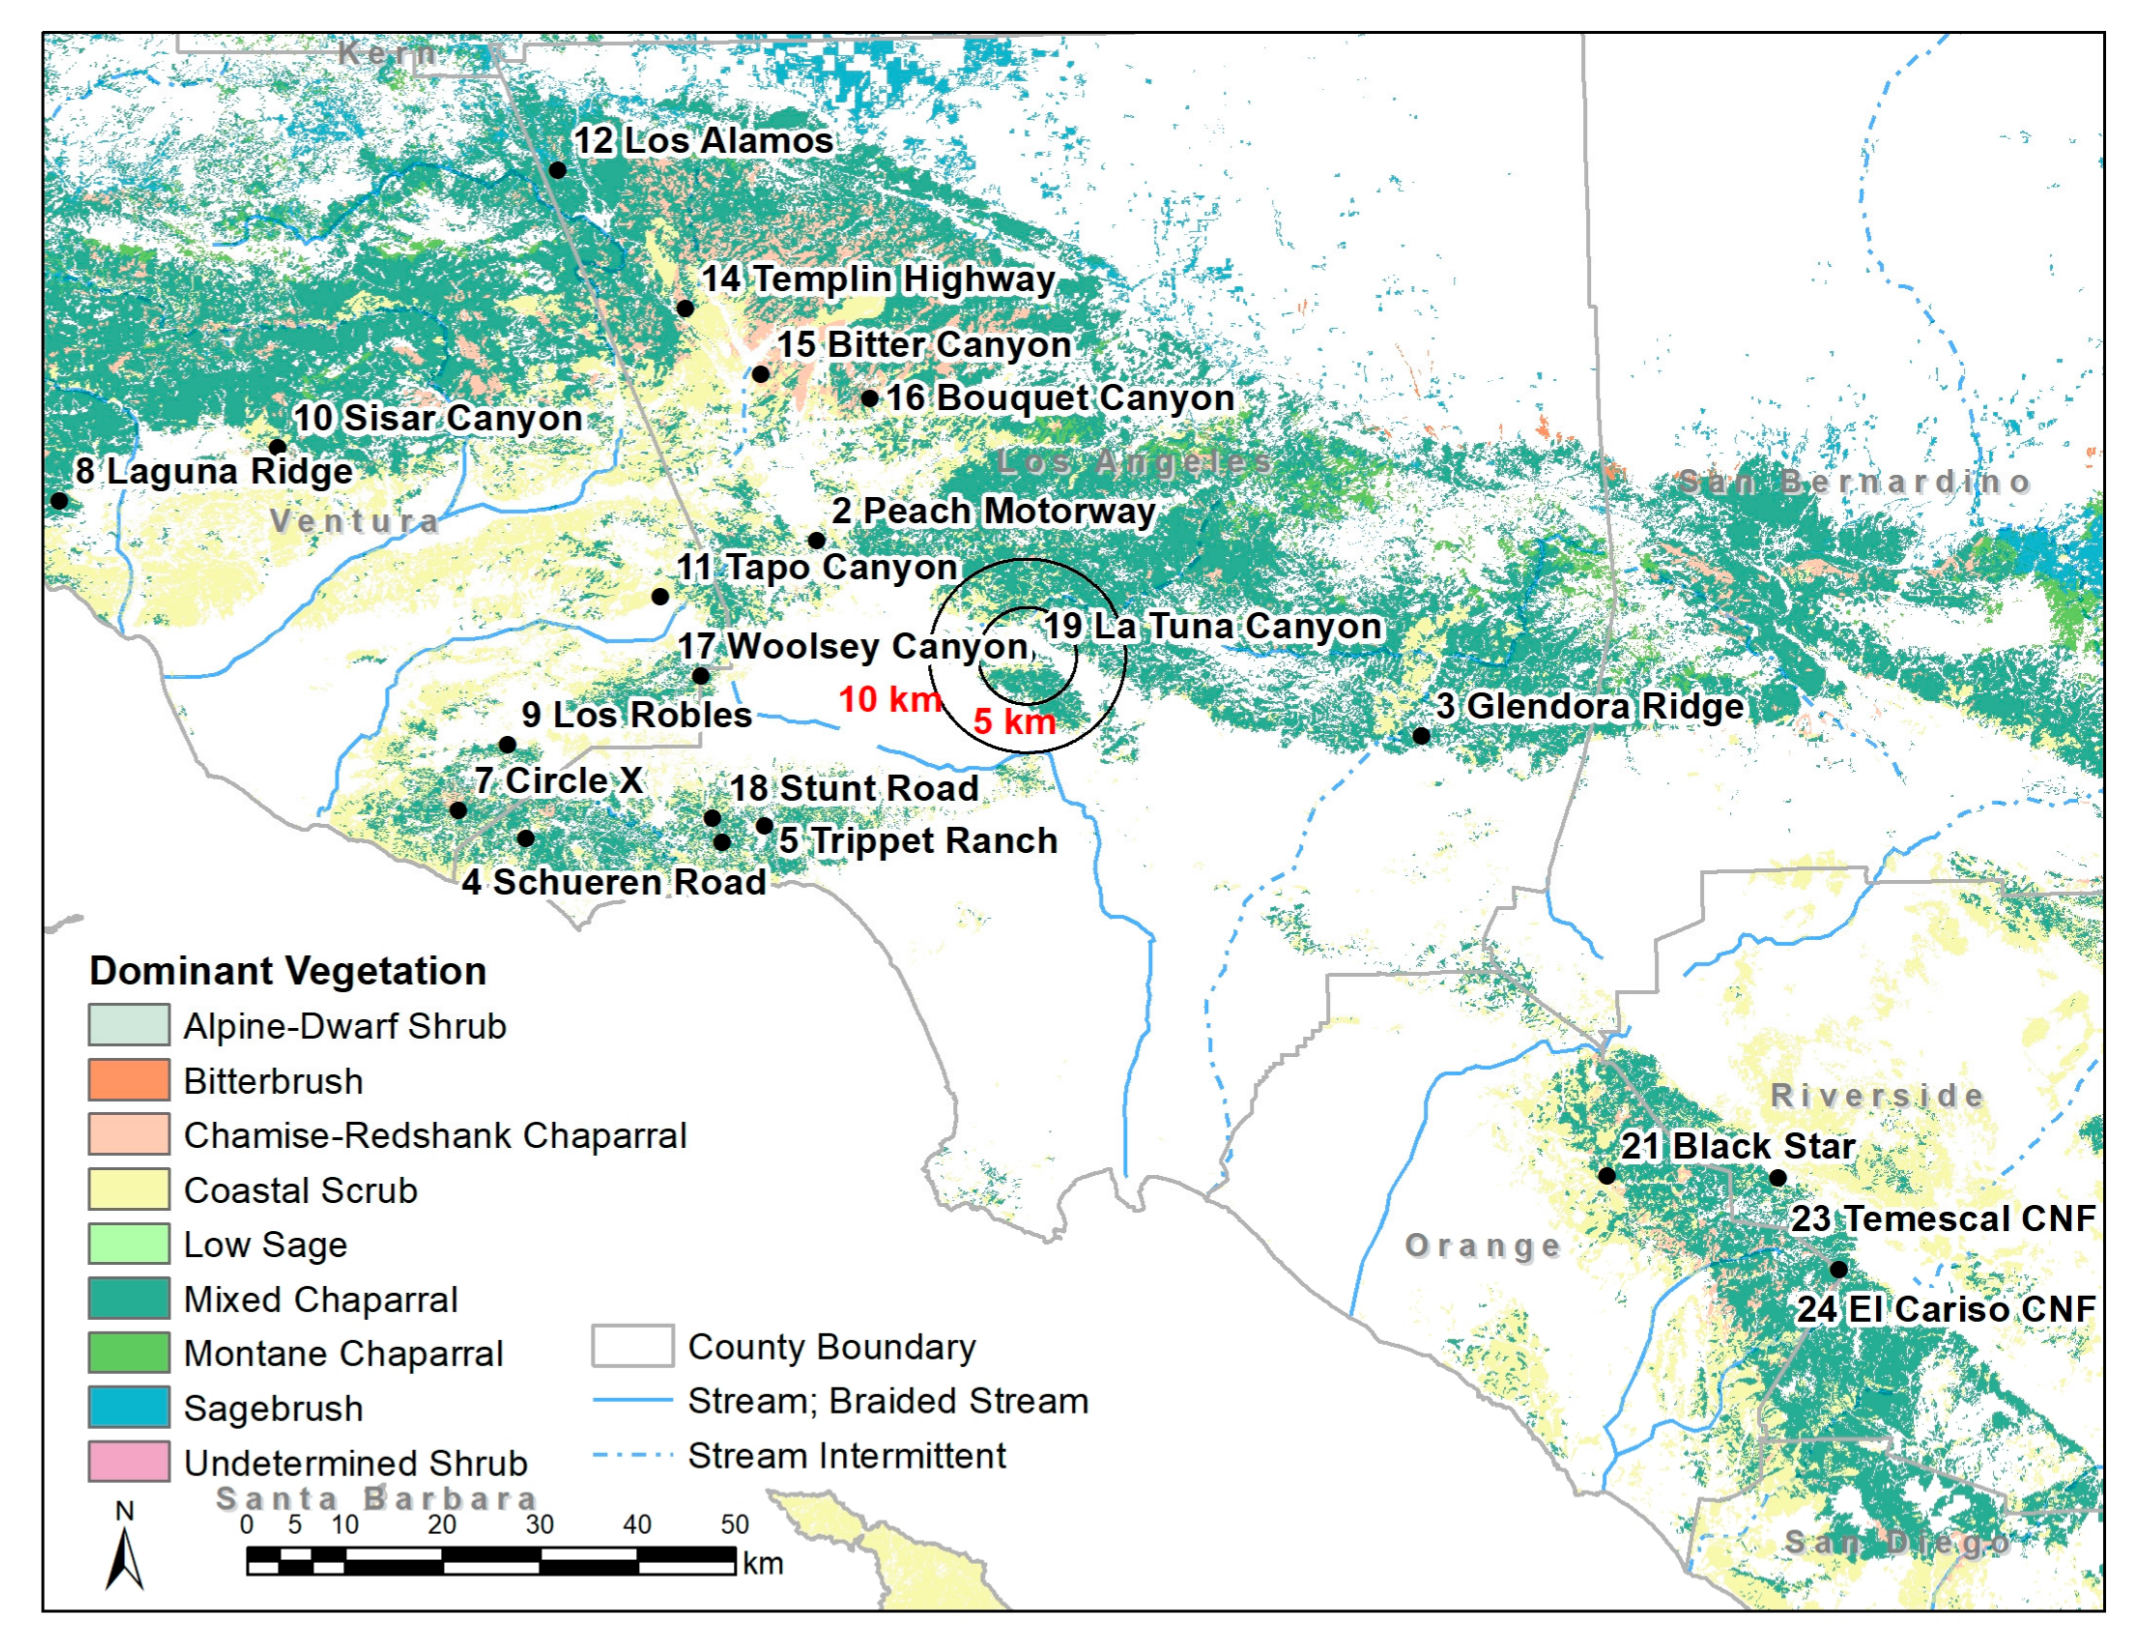
Among the 24 LFM sampling sites in Los Angeles, Ventura, and Orange County, 16 sites had data coverage for more than three years (
Table 1). The data from these 16 sites were selected for the regression analysis between LFM and VIs. For the longer-term analysis, data were selected from seven sites having more than 10 years of record from 2002 (bold characters in
Table 1 and
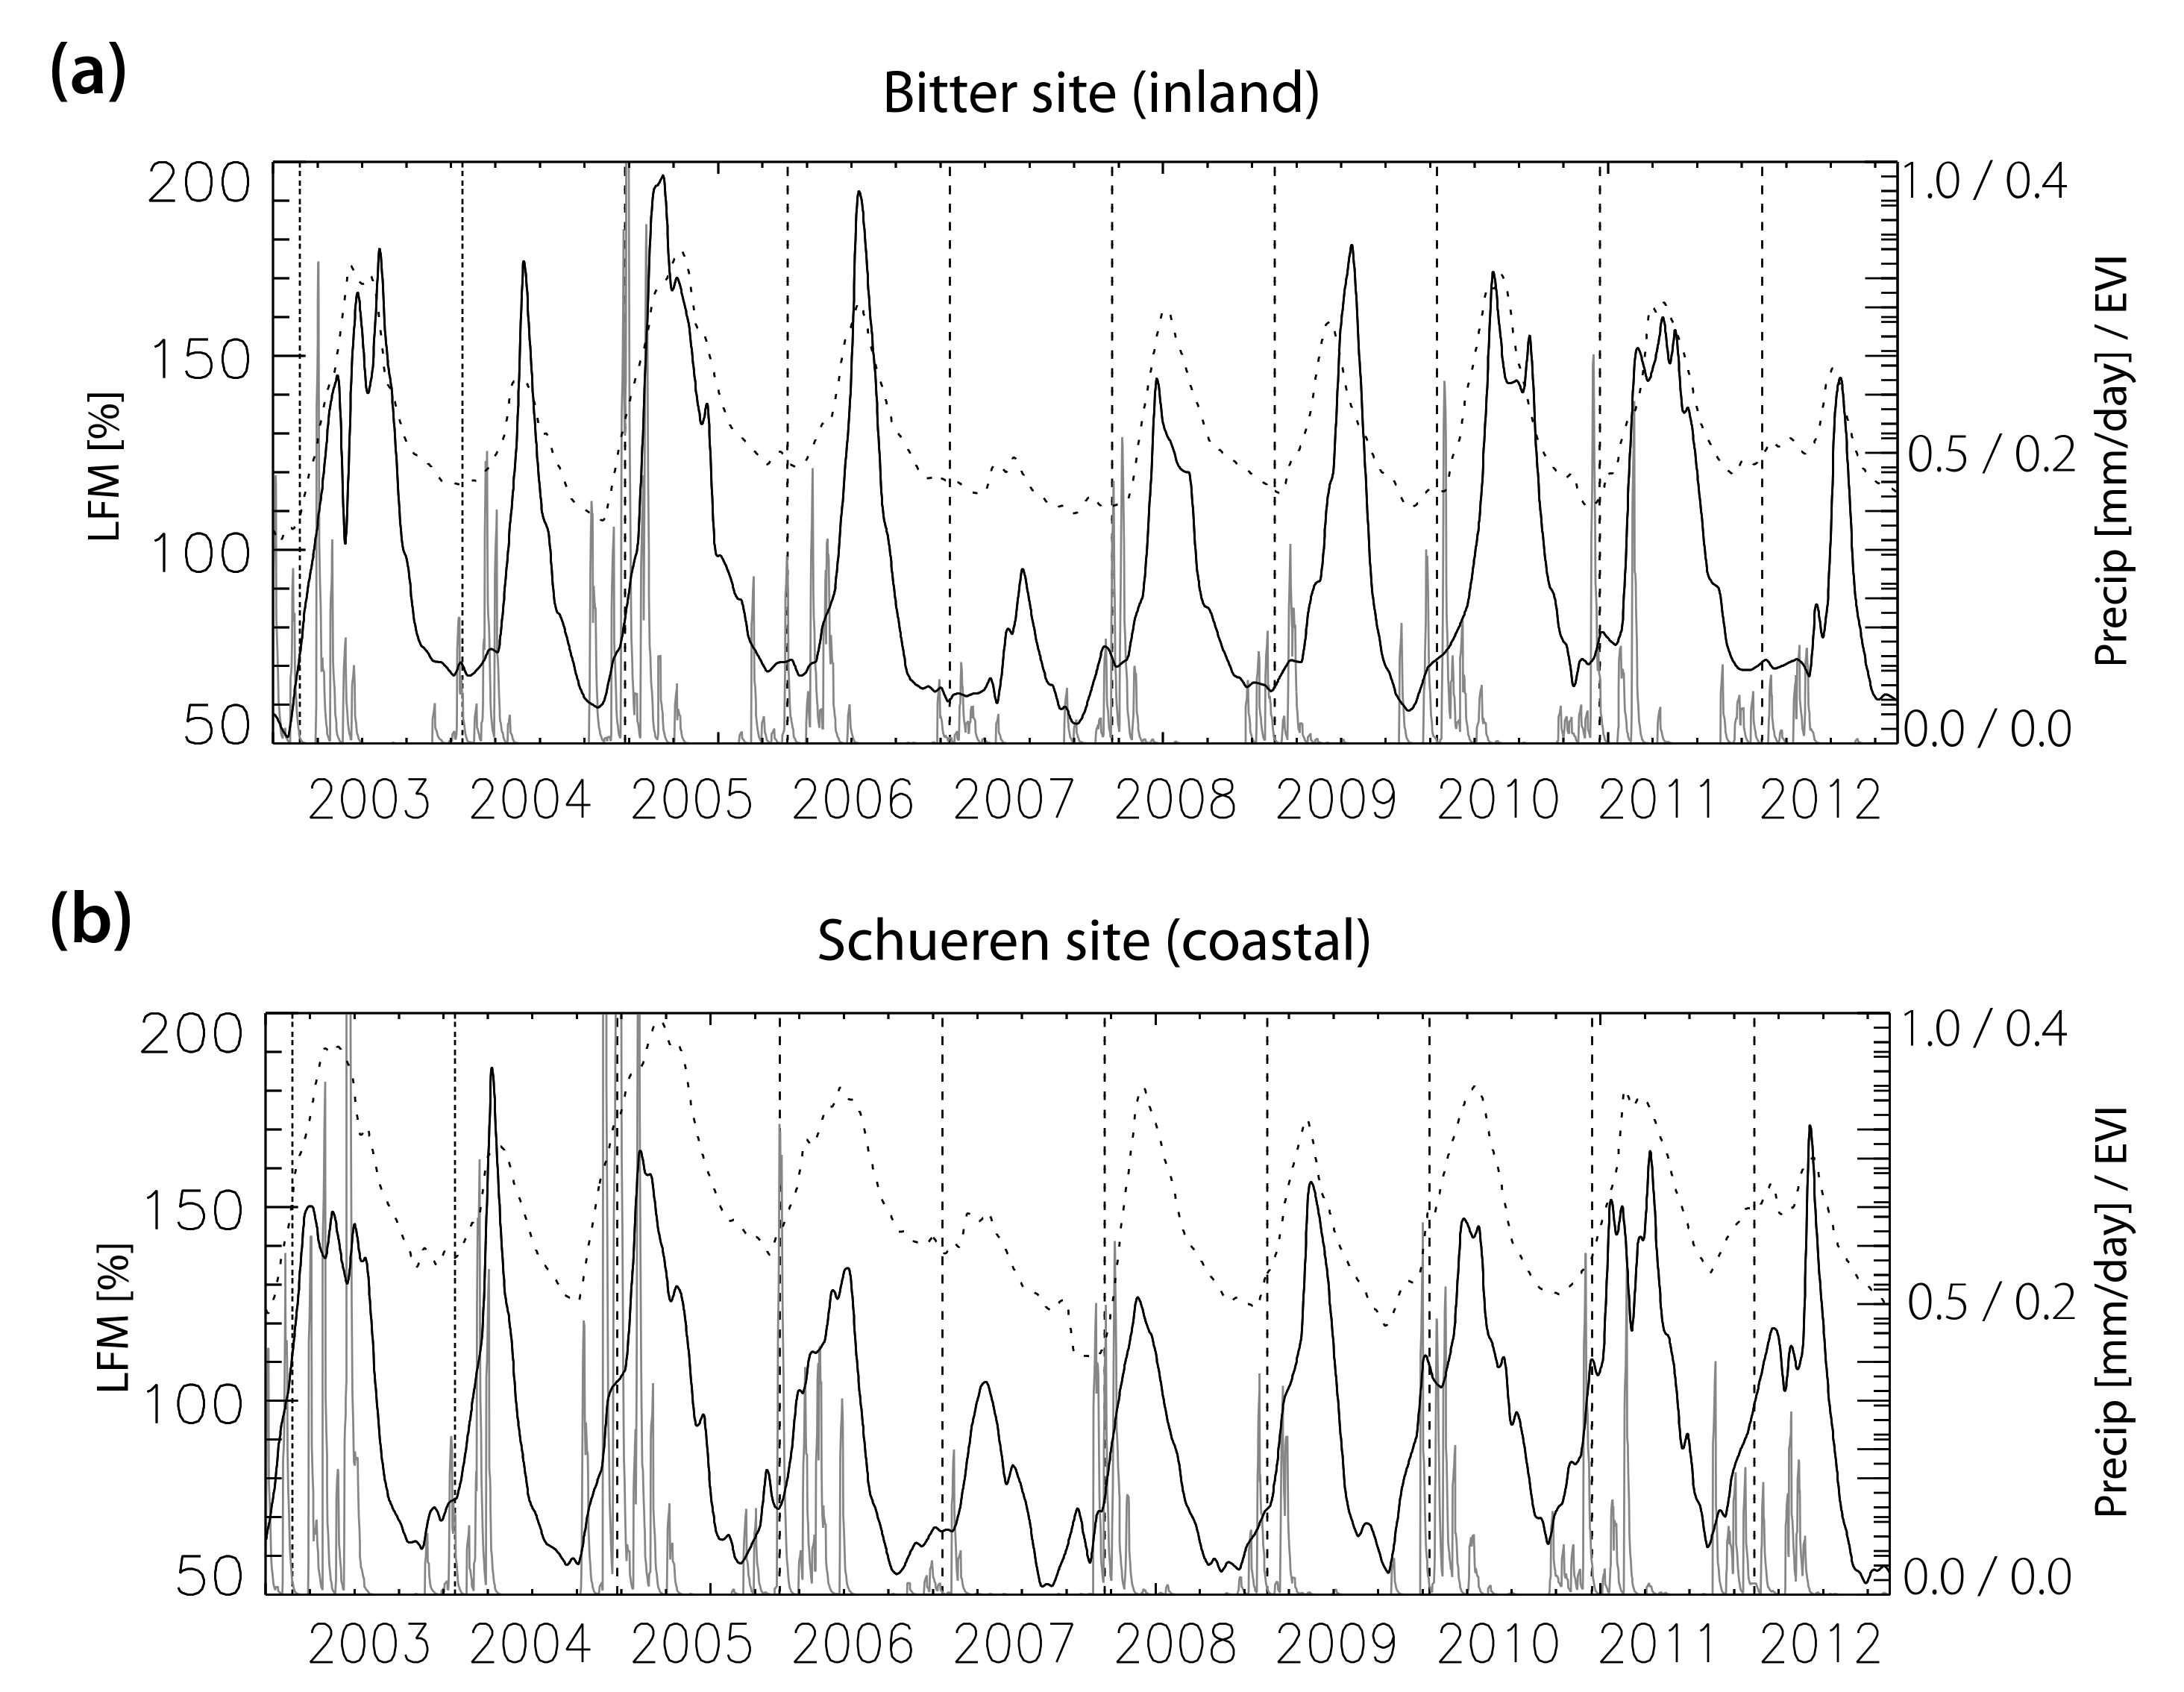
Figure 1). Four sites (Bitter, Placerita, La Tuna, and Laurel) were in inland areas (inland sites, hereafter), whereas the other three sites (Trippet, Schueren, and Clark) were in coastal areas (coastal sites, hereafter). Bitter and Schueren sites had corresponding meteorological stations, called Remote Automatic Weather Stations (RAWS); therefore, LFM and EVI comparisons with their corresponding atmospheric conditions were also investigated at these two sites. While utilizing LFM data at all of the sites to investigate and determine an overall universal LFM-EVI function may be desirable in principle, it is cautious that long-term data records at all the sites are required to ensure sufficient statistical sampling over the vast wildland in SoCal.
2.2. Remote Sensing Data
The present study focuses on the two most relevant VIs among an array of many VIs defined and used for different purposes: the normalized difference vegetation index (NDVI) and the EVI. NDVI and EVI were derived from the MODIS’ Vegetation Indices 16-Day L3 Global 250 m (MOD13Q1 and MYD13Q1)’ products from both the Terra and Aqua satellites [
22]. The datasets were provided by the NASA EOSDIS Land Processes Distributed Active Archive Center (LP DAAC) at the USGS/Earth Resources Observation and Science (EROS) Center. The analysis period covered 10 years between October 2002 and September 2012, as VIs from MODIS have been available since 2001 for Terra and since 2002 for Aqua. We also investigated other VIs derived from MODIS land surface reflectance products (MOD09A1) for the same sites, including normalized difference water index (NDWI), normalized difference infrared index (NDII), and visible atmospherically resistant index (VARI) [
23] (e.g.,
Table S1). These three VIs were recognized as effective indicators of vegetation water content and soil moisture [
24,
25].
To test the sensitivity of the LFM relationship with different areal averages of VIs, the values of the VIs were averaged over circular areal extents with various radii, ranging from 0.5 to 25 km. Then, the averaged VIs were used to correlate with LFM. This method allows for an independent assessment of the spatial extent where the in-situ LFM measurements are valid beyond the central sampling point. This is important because fire agencies intentionally select their LFM sampling locations to be representative of the surrounding vegetation conditions as far as possible so that measured LFM values are representative over an extensive area instead of being valid only at each sampling site. The sensitivity test results showed that a slightly higher correlation is observed at the 10-km radius (correlation coefficient of about 0.79) than that at 0.5-km radius (about 0.72 correlation coefficient). This suggests that a spatial average of VIs over a larger extent (~10-km radius) around each LFM location includes a larger ensemble of VI data, which statistically reduces satellite measurement noises as well as the effects of heterogeneous mixtures of different plant species within each sampling area. Thus, in this study, results for the areal extent of a 10-km radius, having the highest correlations, were selected to carry out the analysis.
2.3. Empirical Model
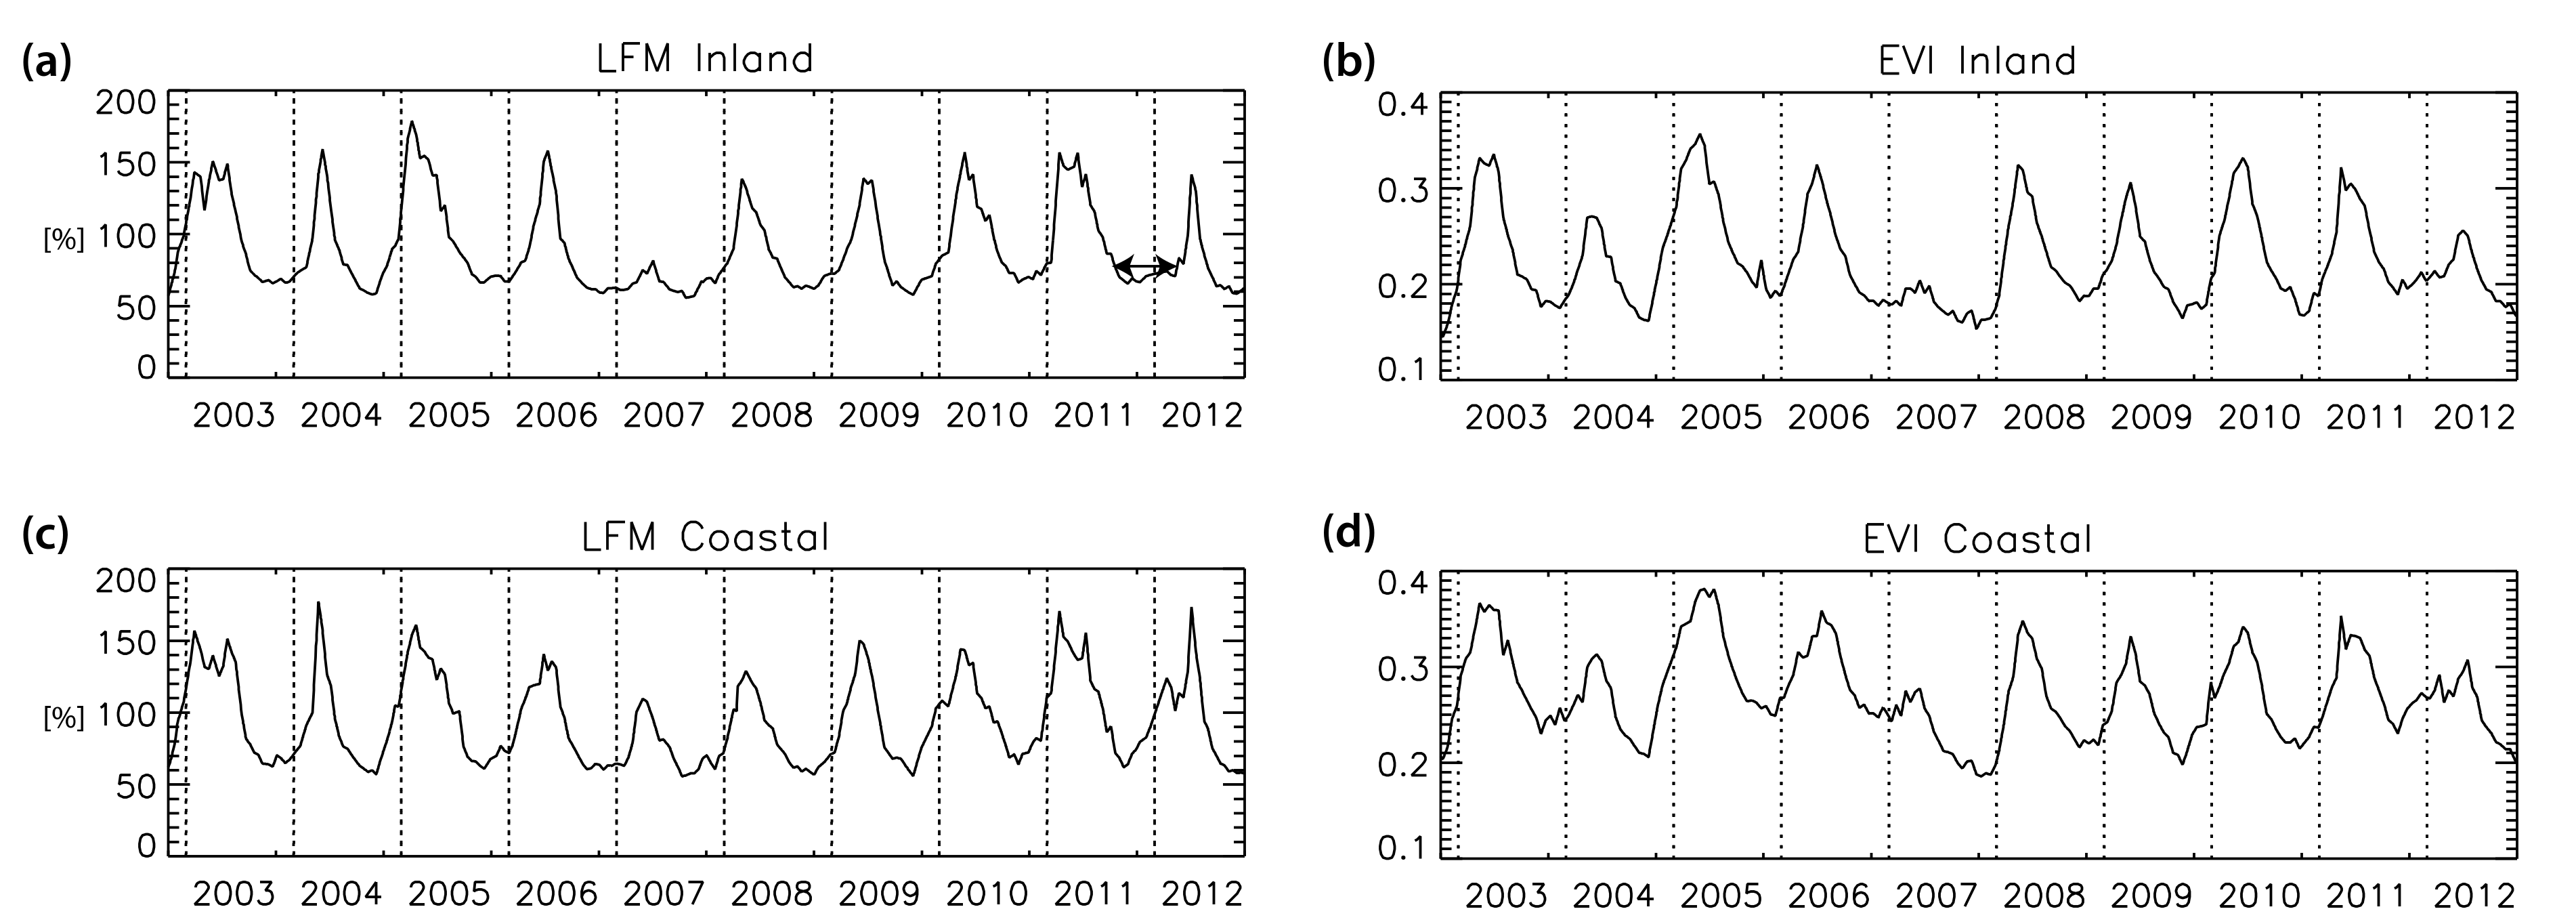
First, the Pearson correlation analysis is carried out to investigate the relationship between LFM and multiple VIs at 16 LFM sites to find the VI with the highest correlation against LFM. This VI is later employed as the major MODIS-derived indicator of vegetation water content for further analysis. LFM data available at the seven LFM sites in a 10-year period were separated into two different groups, representing the inland region and coastal region. Regional characteristics of LFM and EVI between inland and coastal regions were investigated together with their interannual variations. We then examined possible reasons for the different regional characteristics.
Next, linear regression models of VIs for LFM at the seven sites with decadal records were developed and evaluated across the 10-year data period with respect to the averages and inter-annual variability of maxima, minima, and transitional levels of LFM. We also tested non-linear models with a quadratic term or log transformation of the predictor, but a substantial improvement was not found. Therefore, in this study, two linear models are developed and tested. The first model uses each VI as a sole predictor (Equation (2)), while the second model includes a composite of collocated and contemporaneous VI and meteorological variables as predictors to account for the environmental dependence of LFM (Equation (3)), as follows:
where MI is a meteorological factor with index i refers to various observations (i = 1, …,
N), and ε
i is a residual error term.
VIs alone may not be sufficient to fully replicate LFM since using them is an indirect approach to infer the vegetation moisture. The other factors that were related to the dryness of vegetation conditions were selected for a test as an independent variable in addition to VIs. In this study, meteorological observations such as daily temperature (minimum, maximum and mean), relative humidity, and precipitation are chosen as additional variables in the composite estimation model. Due to large fluctuations in daily data, we used a 15-day running mean on LFM, EVI, and meteorological data in our analyses.
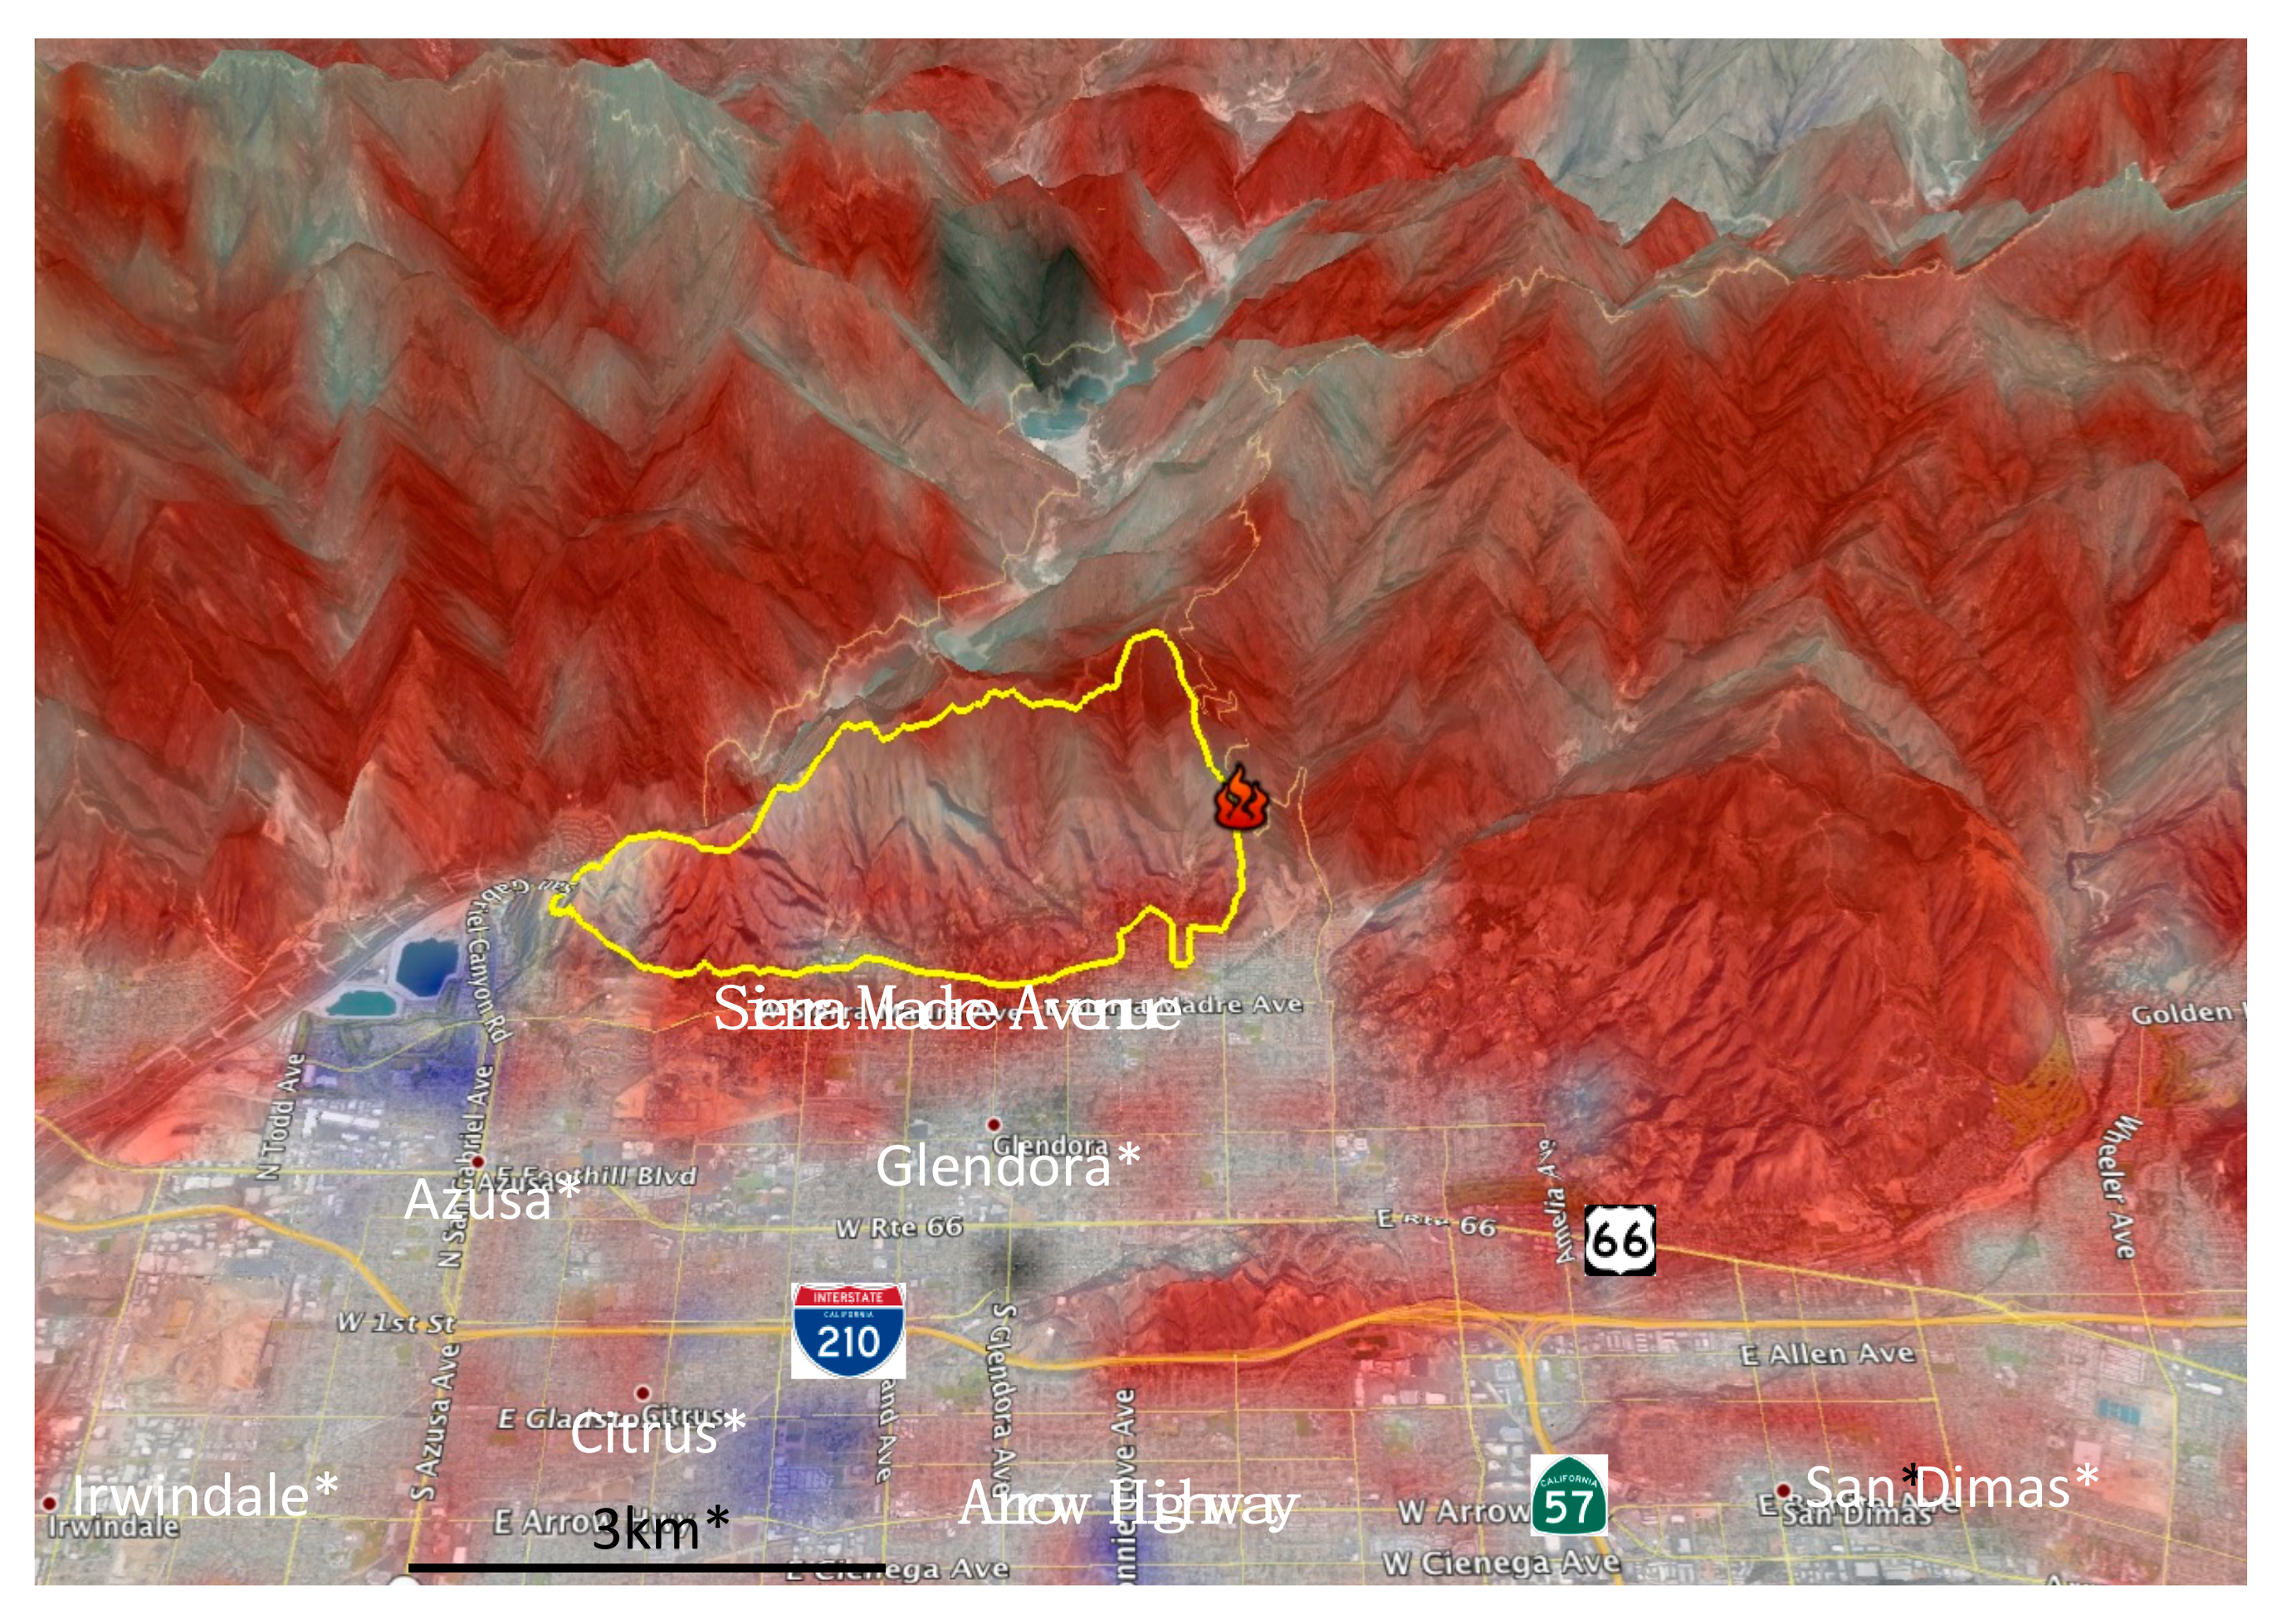
Finally, the capability of our satellite derived LFM model is tested in the case of the 2014 Colby Fire. The Colby Fire was ignited by an illegal campfire along the Colby Truck Trail in the San Gabriel Mountains of the Angeles National Forest on 16 January 2014 [
26]. Fanned by dry and powerful Santa Ana winds, it burned over 1962 acres by 25 January at 98% containment. The fire destroyed five homes, damaged 17 other structures, injured one person, and forced an evacuation of 3600 people in the cities of Glendora and Azusa, California.
4. Discussion
In this study, we have analyzed climatological, seasonal, and interannual characteristics of LFM and satellite VIs in SoCal in order to develop empirical model functions of LFM based on VIs together with air temperature data based on statistical analyses. Correlation results between LFM and various VIs indicated that LFM was most strongly correlated with EVI from Aqua. Unlike previous studies attempting a point-to-point comparison, we tested the LFM relationship with EVI averaged over different areal coverages in chamise-dominant grids (i.e., 0.5 km to 25 km radius circles), and found that LFM was well correlated with EVI averaged over large areas. It was most strongly correlated with the area of a 10-km radius centered around each in-situ LFM site. As LFM measurements represented information over a large spatial extent, LFM could have high correlations between the time-series data records at different locations as indicated in the high cross correlations. In addition, we found that the higher the cross correlation, the longer the distance between the LFM sampling sites (
Table S3). This was an independent verification that measured LFM values at in-situ sites, strategically selected by fire agencies, are indeed a good representation of moisture levels over the extensive neighboring area.
A possible explanation of the better correlation between EVI and LFM is the co-varying leaf pigment concentrations with the change of vegetation water content in Southern California [
18]. When plants are under water stress, depletion of chlorophyll may produce a decrease in reflectance in visible and NIR bands. Such change can be prominent in Mediterranean plants as they have a quick response under dehydration. This change may produce a stronger signal than the response in SWIR bands due to the change of vegetation water content.
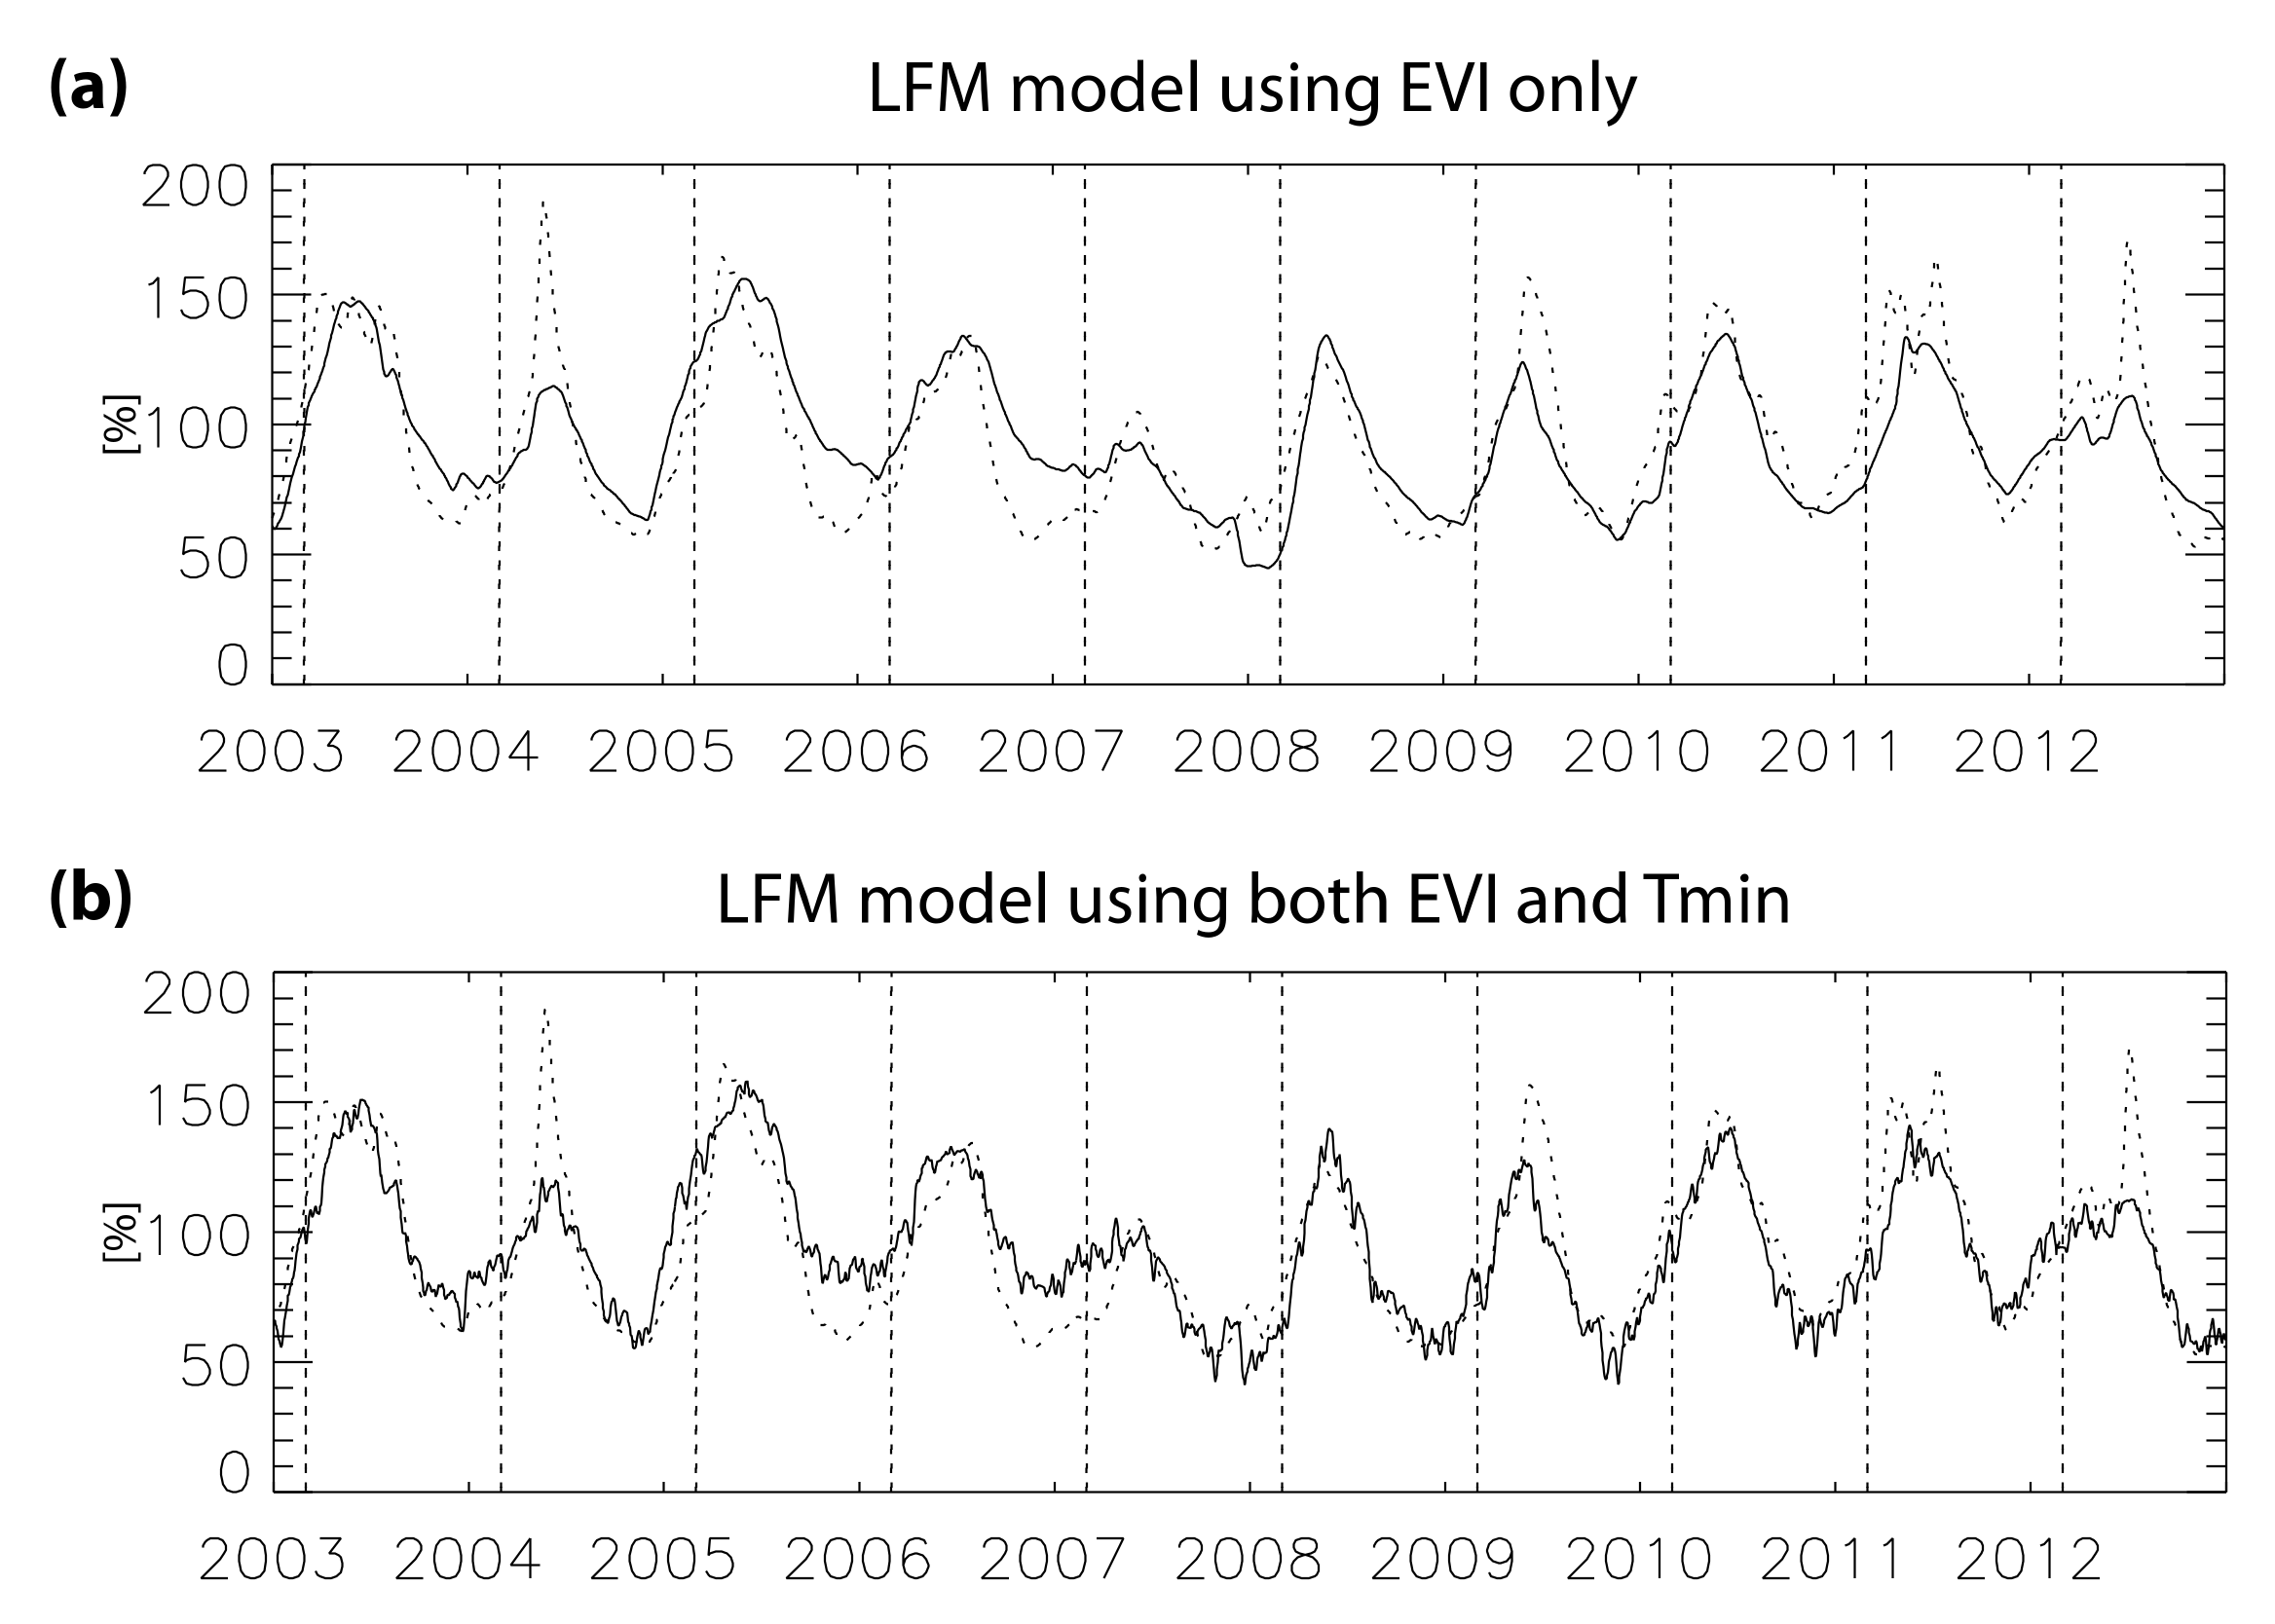
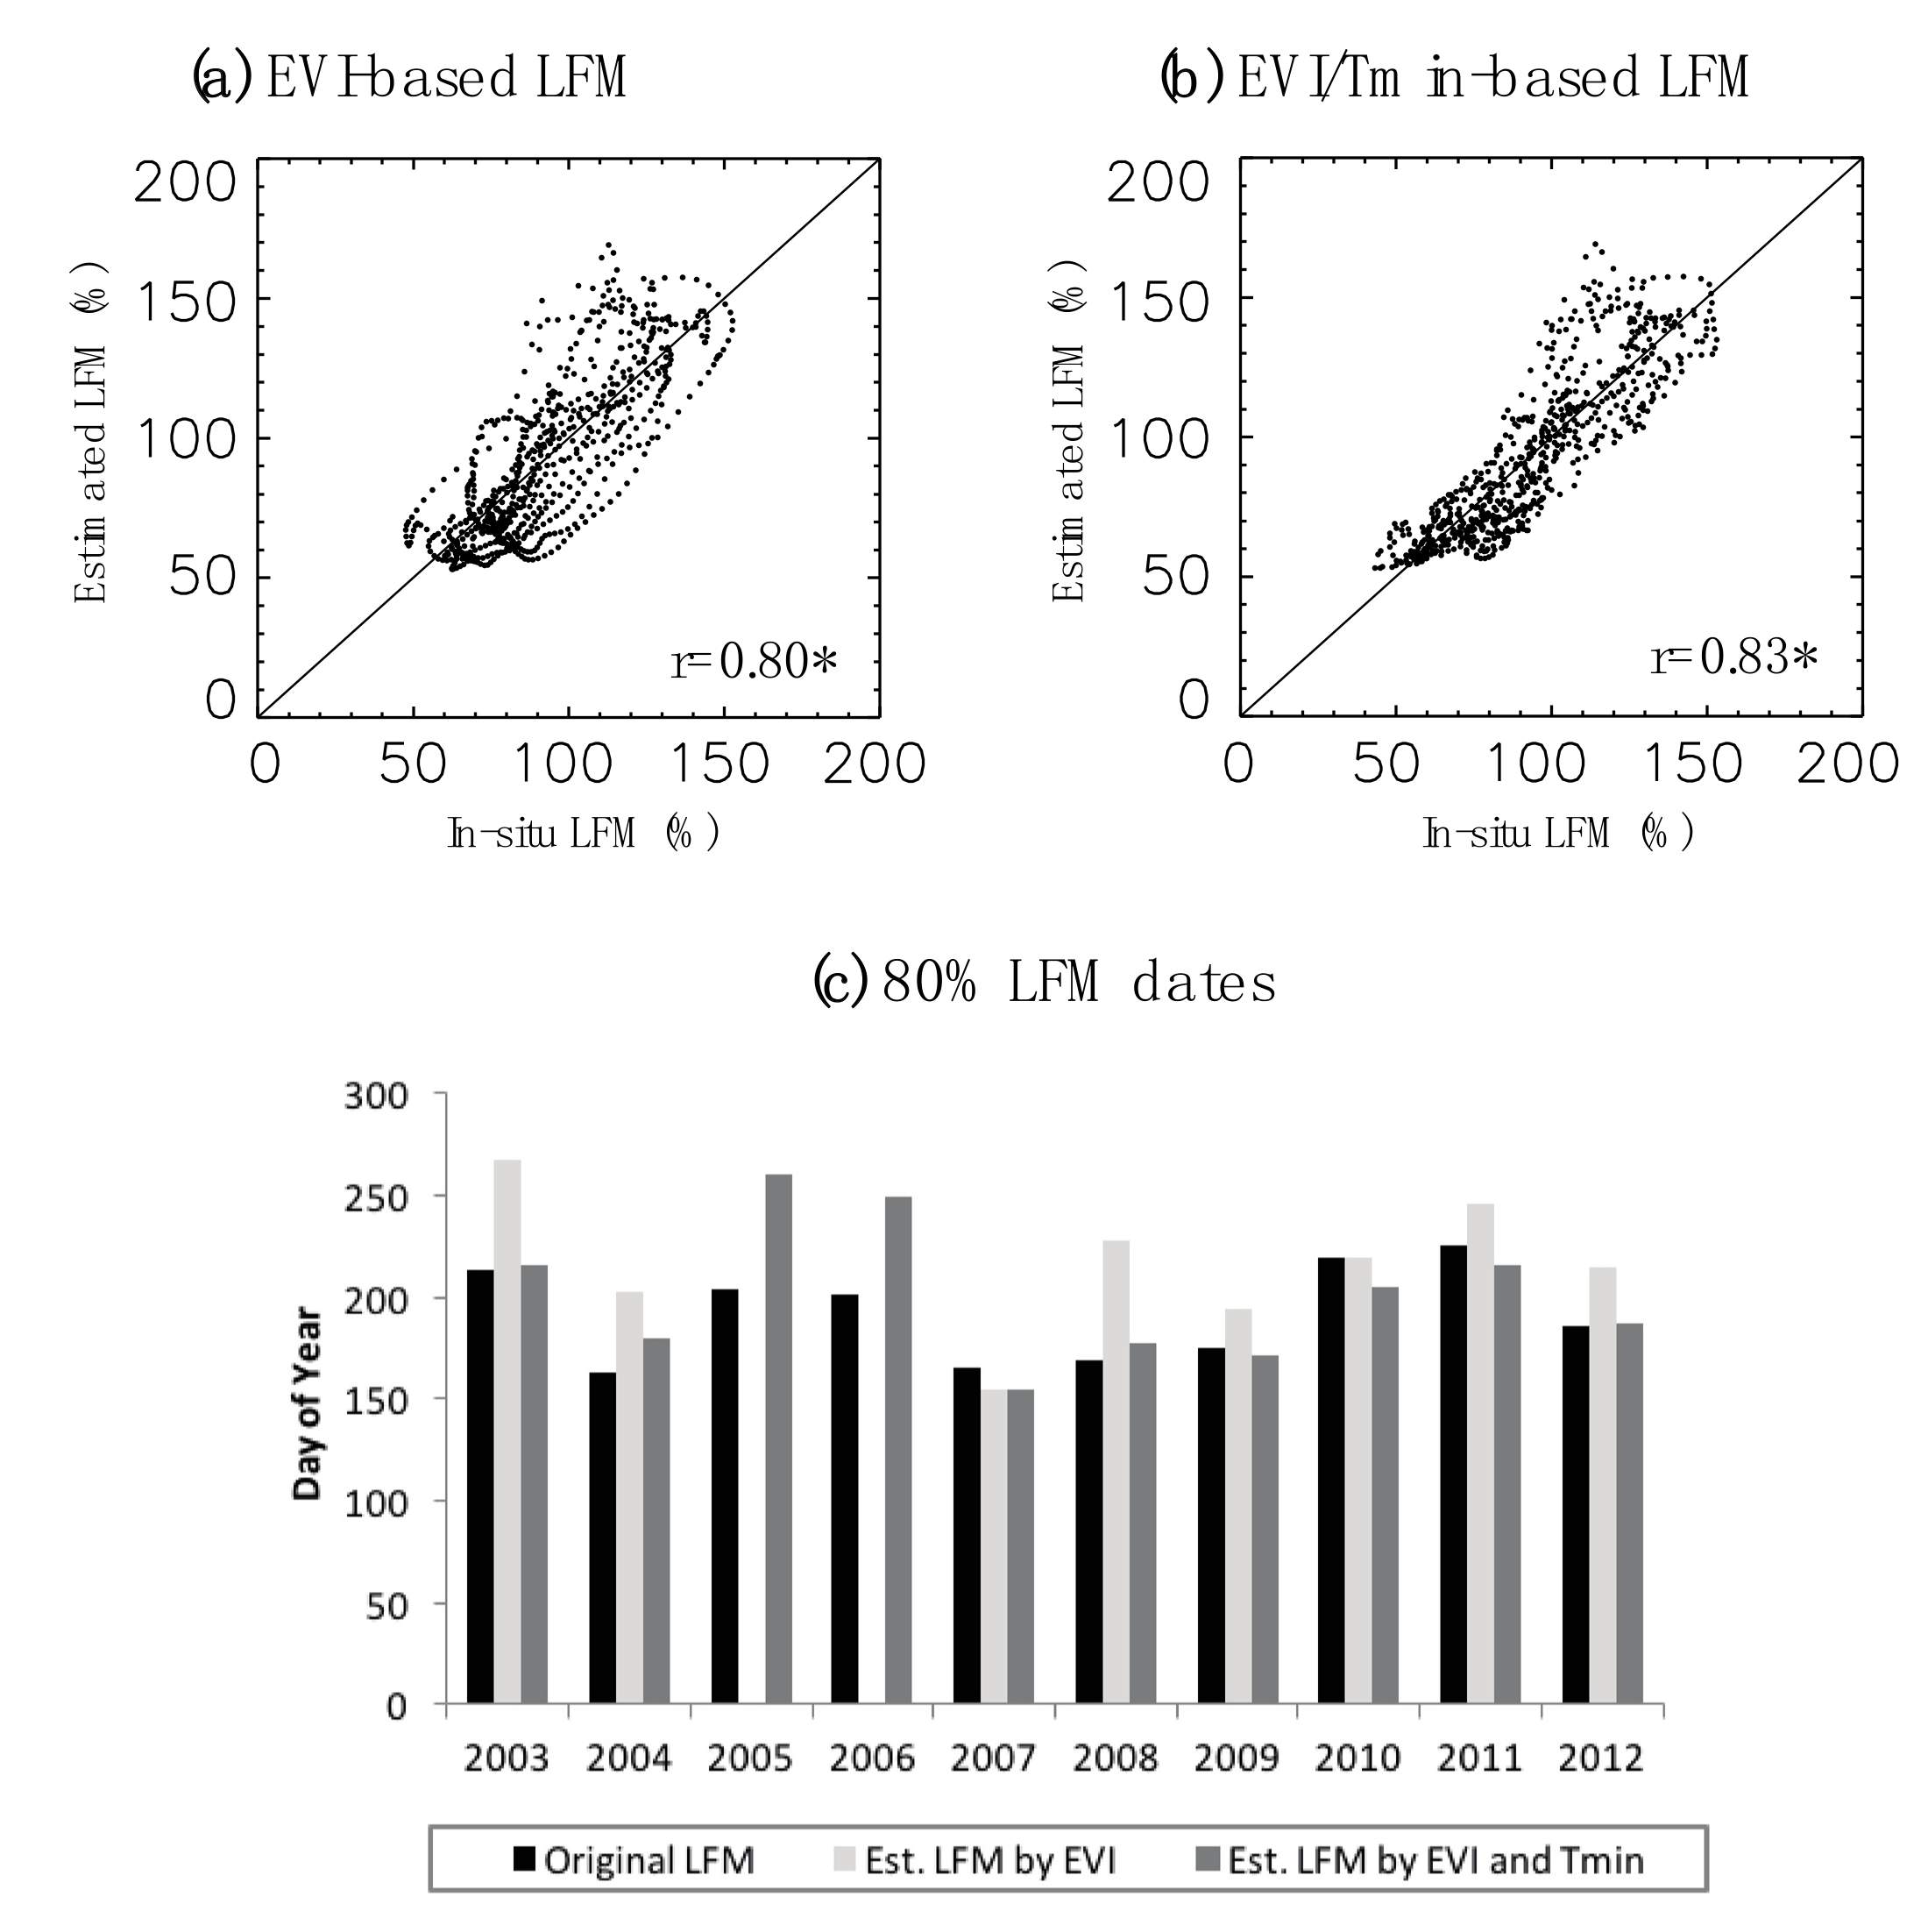
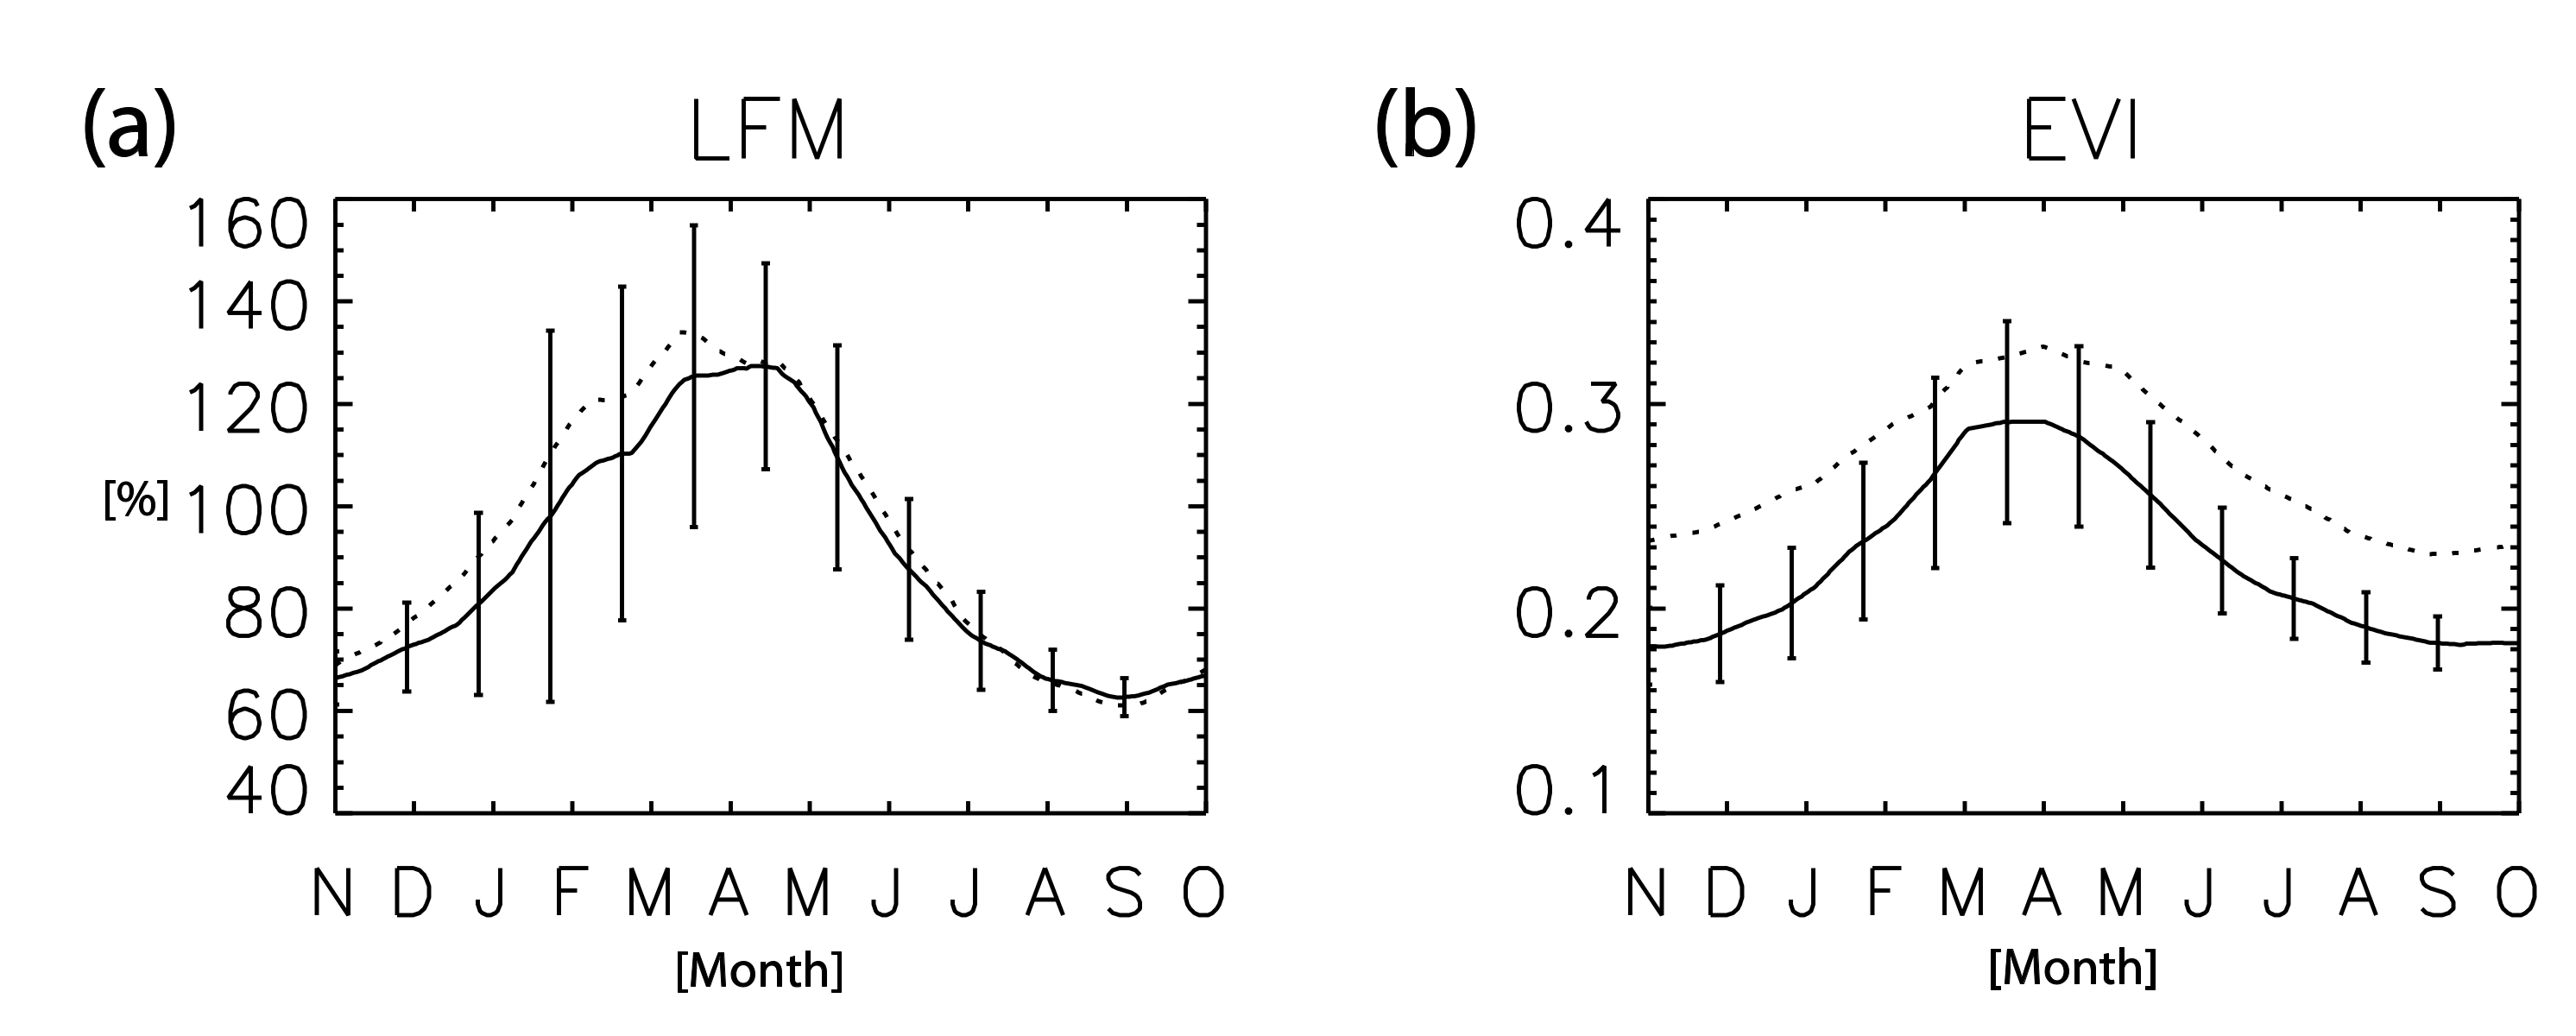
We have developed the EMF models based on the actual relationship with in-situ LFM, and evaluated the model performance with respect to the 10-year averages and interannual variability. The EVI-alone model showed a limited ability in estimating the timings and magnitudes of annual maxima and minima of LFM primarily because of consistently high in-situ LFM values, even in dry years for the maxima and the delayed response of EVI to precipitation when compared to LFM for the minima. However, seasonal variations, especially wet-to-dry trends of LFM (e.g., 90% LFM date in spring and early summer), were well estimated even on an interannual time scale. This result was consistent with the fact that vegetation greenness represented by EVI was also sensitive to environmental dryness [
30]. The study here also found that the EMF model performance for low LFM values during summer and fall could be improved by including an air temperature variable as an additional predictor. This implies that excessive loss of moisture in vegetation on extremely hot days is better captured with the temperature parameter in addition to EVI.
While the 15-day running averaged data were utilized during our model development, a partial autocorrelation error might become non-negligible. We have investigated a transformation method using the Cochrane-Orcutt procedure to adjust the excessive correlation introduced by the temporal autocorrelation at lag 1 [
31]. The transformed model showed some reduction in adjusted values of R
2. However, the outcome indicated a similar pattern as results of non-transformed model, thus the temporal autocorrelation will not affect the overall conclusion of this study.
The high correlation results of time-series data at different locations supported the significance of high-resolution satellite data in advancing the capability for fire danger assessment. This is because high-resolution satellite data would enable: (1) A selection of the appropriate vegetation type while eliminating irrelevant land-use classes (e.g., lakes, bare soil, urban areas, etc.); and, (2) an estimation of vegetation moisture condition over the vast extent where in-situ LFM measurements would not be extensively and frequently possible. Moreover, the correlations of time-series data between different locations, while characterizing the seasonal behavior consistently pertaining to the chaparral ecosystem, would not necessarily imply a homogenous spatial pattern of the vegetation conditions. In fact, as shown in
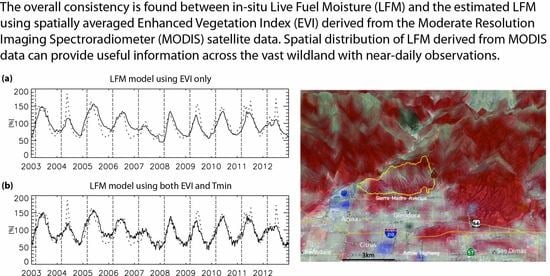
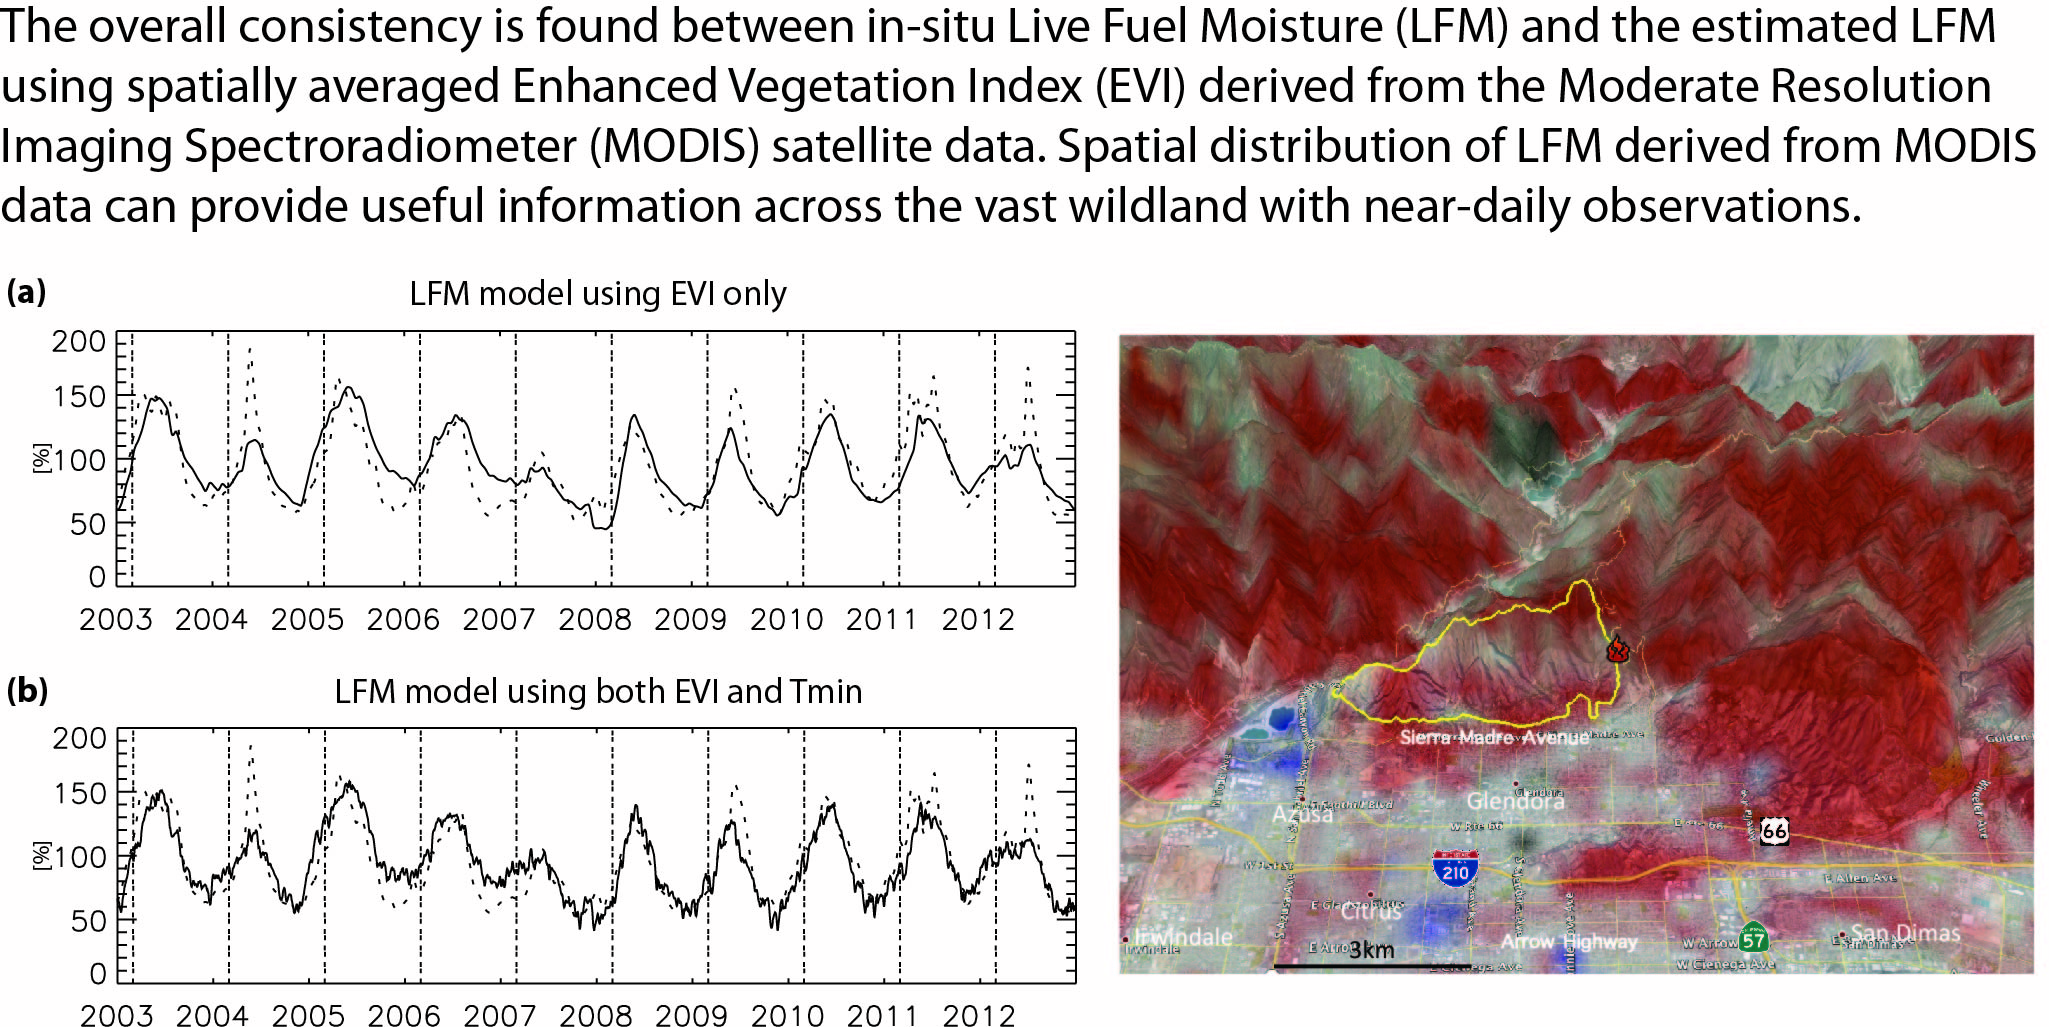
Figure 8, the spatial distribution of LFM, as enabled by satellite observations, could be quite variable across the vast wildland. Such observations clearly and independently justified efforts by fire agencies to make LFM measurements at multiple sites critical to fire danger assessment. This result indicates that satellite-derived vegetation data could provide useful information in estimating vegetation moisture levels in SoCal after reducing multiple errors by spatial averaging, and also that in-situ LFM measurements were valid over a large extent beyond the intermediate vicinity of individual sampling sites.
5. Conclusions
The example of LFM map derived by the EMF shown in
Figure 8 demonstrates the utility of satellite-based vegetation information for fire danger assessment with a high spatial resolution in SoCal. Such capability would improve more than one order of magnitude the current temporal and spatial coverage of the in-situ LFM measurement method conducted by fire agencies. The quality of such a kind of map could be further enhanced by LFM observations over the north-facing slopes and their modeling. Note that current LFM sampling sites were typically located in south-facing slopes, and thus the EMF model based on these data may be skewed towards the warmer and generally drier conditions that may result in an overestimation of fire risks. Therefore, LFM observations over the north-facing slopes and their modeling would be necessary for a more complete representation of LFM over complex terrain. Additional effective predictor(s), such as rainfall and soil moisture [
32], should also be considered and tested for further improvement of the EMF model. Remotely sensed high-resolution soil moisture data, such as data from the Soil Moisture Active Passive (SMAP) mission [
33], might provide additional information about regional soil moisture for synergistic enhancement of LFM estimation models.
There are uncertainties in both in-situ LFM and satellite VI data. First, a small sample size of the in-situ LFM may be insufficient for statistical analysis, resulting in large uncertainty. Weise et al. [
5] reported that the uncertainty of LFM measurements varies significantly from ±20 to ±100%, depending on particular sites. Second, because of more intense insolation on the south sides of mountains, vegetation samples were only collected at south-facing mountain slopes; however, actual sample locations could change in different sampling excursions within an approximate three-acre lot selected by fire agencies where the topographic complexity might introduce more uncertainty. Regarding satellite data, VIs might have residual errors due to contaminations from clouds and aerosols that are not completely removed by the processing algorithms. Moreover, minor vegetation species might coexist within the chamise-dominant grid cells. There could be also uncertainties in the spatial coverage mismatch between LFM and VI data.
This study is only focused on the chaparral ecosystem in SoCal. However, the results can be applied to the Mediterranean region in Europe and elsewhere having similar climatic conditions via cross-validation process. In addition, our research framework can be adapted for applications to other wildfire-prone areas in the world with different climate conditions. Moreover, a universal model function approach should be considered in a future research, and such effort can be a key objective when sufficient statistical sampling across the extensive wildland and in-situ data records become sufficiently lengthened.


