1. Introduction
Urbanization is a complicated process involving increased populations, intensified socioeconomic activity, spatially expanded urban built-up area, and infrastructures [
1,
2,
3]. Measurement and monitoring of urbanization dynamics at national to global scales is significant for further understanding anthropogenic changes in the Earth’s landscape and their associated environmental consequences [
4,
5]. When compared to traditional remote sensing products from visible, near-infrared or radar sensors, satellite-derived nighttime light data focus more on the intensity information of anthropogenic activity involving demographic dynamics, socioeconomic growth, and urbanization level, and therefore have been extensively used to capture more comprehensive spatiotemporal characteristics about urbanization dynamics and regional development [
6,
7,
8,
9,
10,
11,
12,
13].
Previous studies have verified that satellite-based nighttime light datasets derived from the Defense Meteorological Satellite Program’s Operational Linescan System (DMSP/OLS) could provide uniform, spatially explicit, continuous, and timely observations and measurements of human activity related to settlement changes and socioeconomic dynamics [
6,
9,
14,
15,
16]. Because of the significant positive correlations between DMSP/OLS nighttime light brightness and demographic and socioeconomic variables, plenty of studies focus on exploring the responses of nighttime light signals to regional socioeconomic activity through constructing various nighttime light indices (e.g., the total radiance of nighttime lights, the total count of lit pixels, average nighttime light intensity, etc.) [
9,
15,
17,
18]. Additionally, accurately and quickly identifying urban extent is also an important content for assessing urbanization dynamics using nighttime light data. Based on the spatiotemporal changes of urban extent, urbanization patterns, as well as corresponding driving factors and impacts, are also extensively discussed [
19,
20,
21,
22,
23].
During the estimation of urbanization dynamics, the thresholding approach has been widely used to partition nighttime light imagery and thereby extract urban information at local, national, regional, and global scales. To further reduce the overestimates or underestimates of urban extent caused by the effects of over-glow and shrink of nighttime light [
24,
25], subsequent studies proposed various thresholding methods based on neighborhood analysis that fully consider the local spatial variations of nighttime light signals [
26,
27,
28]. Su et al. [
28] generated topographic maps of nighttime light signals based on spatial neighboring analysis to identify the demarcation lines between built-up areas and non-built-up areas. This method helps to accurately extract the large patches of built-up areas in urban regions and small settlements in surrounding towns, but fails to capture the spatial variations with different intensity of anthropogenic activity within the extracted results. Ma et al. [
27] proposed a spatially explicit approach based on the quadratic relationship between pixel-level nighttime light brightness and corresponding spatial gradient at the local scales to identify different types of urban sub-regions experienced various development levels for more than 200 China’s cities. Kamarajugedda et al. [
26] delineated three urban categories for each city based on Ma’s brightness gradient approach to assess urban growth dynamics for 15 major Southeast Asian cities. Though neighborhood variations of nighttime light signals were considered in these studies, these partition approaches were carried out at the city scales, easily leading to multi-standards of the extracted sub-areas from different cities, and this further hinders the comparative analysis on urbanization dynamics of the larger region. An improved approach of extracting different types of nighttime lighting areas using a unified standard is therefore needed for studying spatiotemporal characteristics of urbanization dynamics across the large region, based on nighttime light imagery.
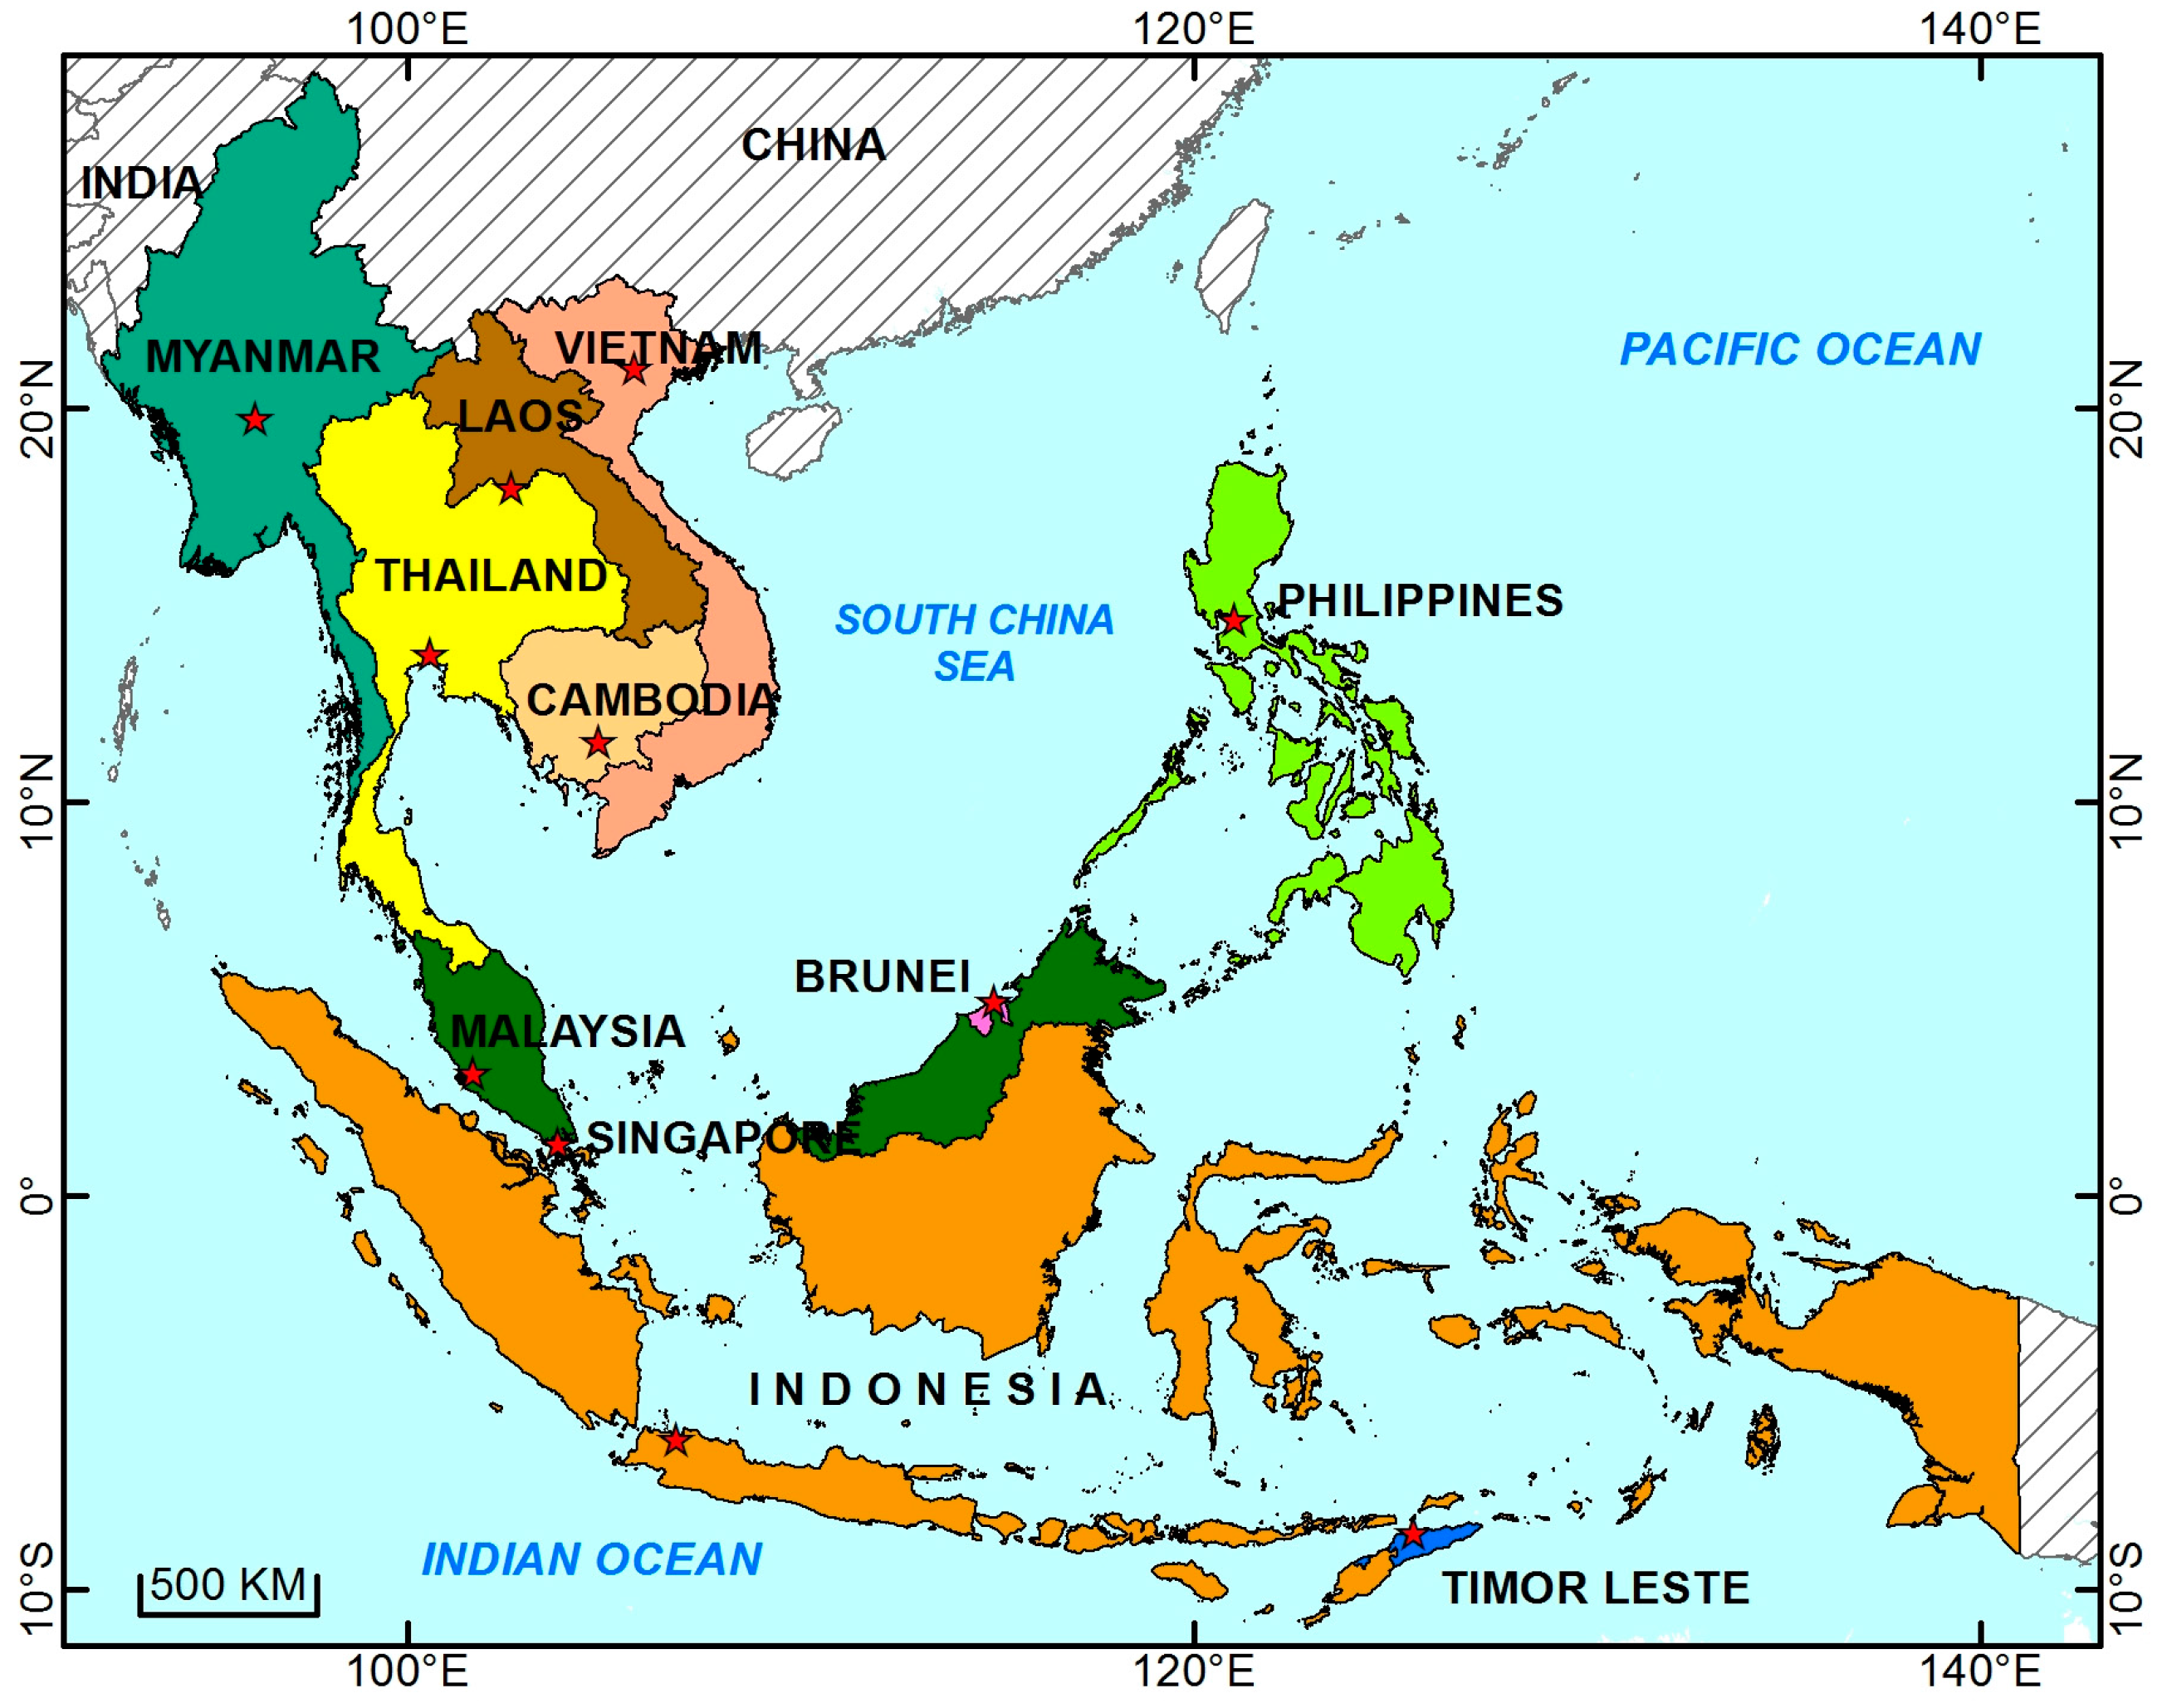
Southeast Asian countries have experienced a rapid urbanization period since 1960, although the region’s overall urbanization rate is still below the world average, the gap has been gradually narrowed [
29]. Meanwhile, in the urbanization progress, huge differences exist among Southeast Asian countries, as well as among their megacities and towns [
26]. A comprehensive understanding of the spatiotemporal characteristics of urbanization dynamics for Southeast Asia is essential for planning prosperous and sustainable development of the Southeast Asian region.
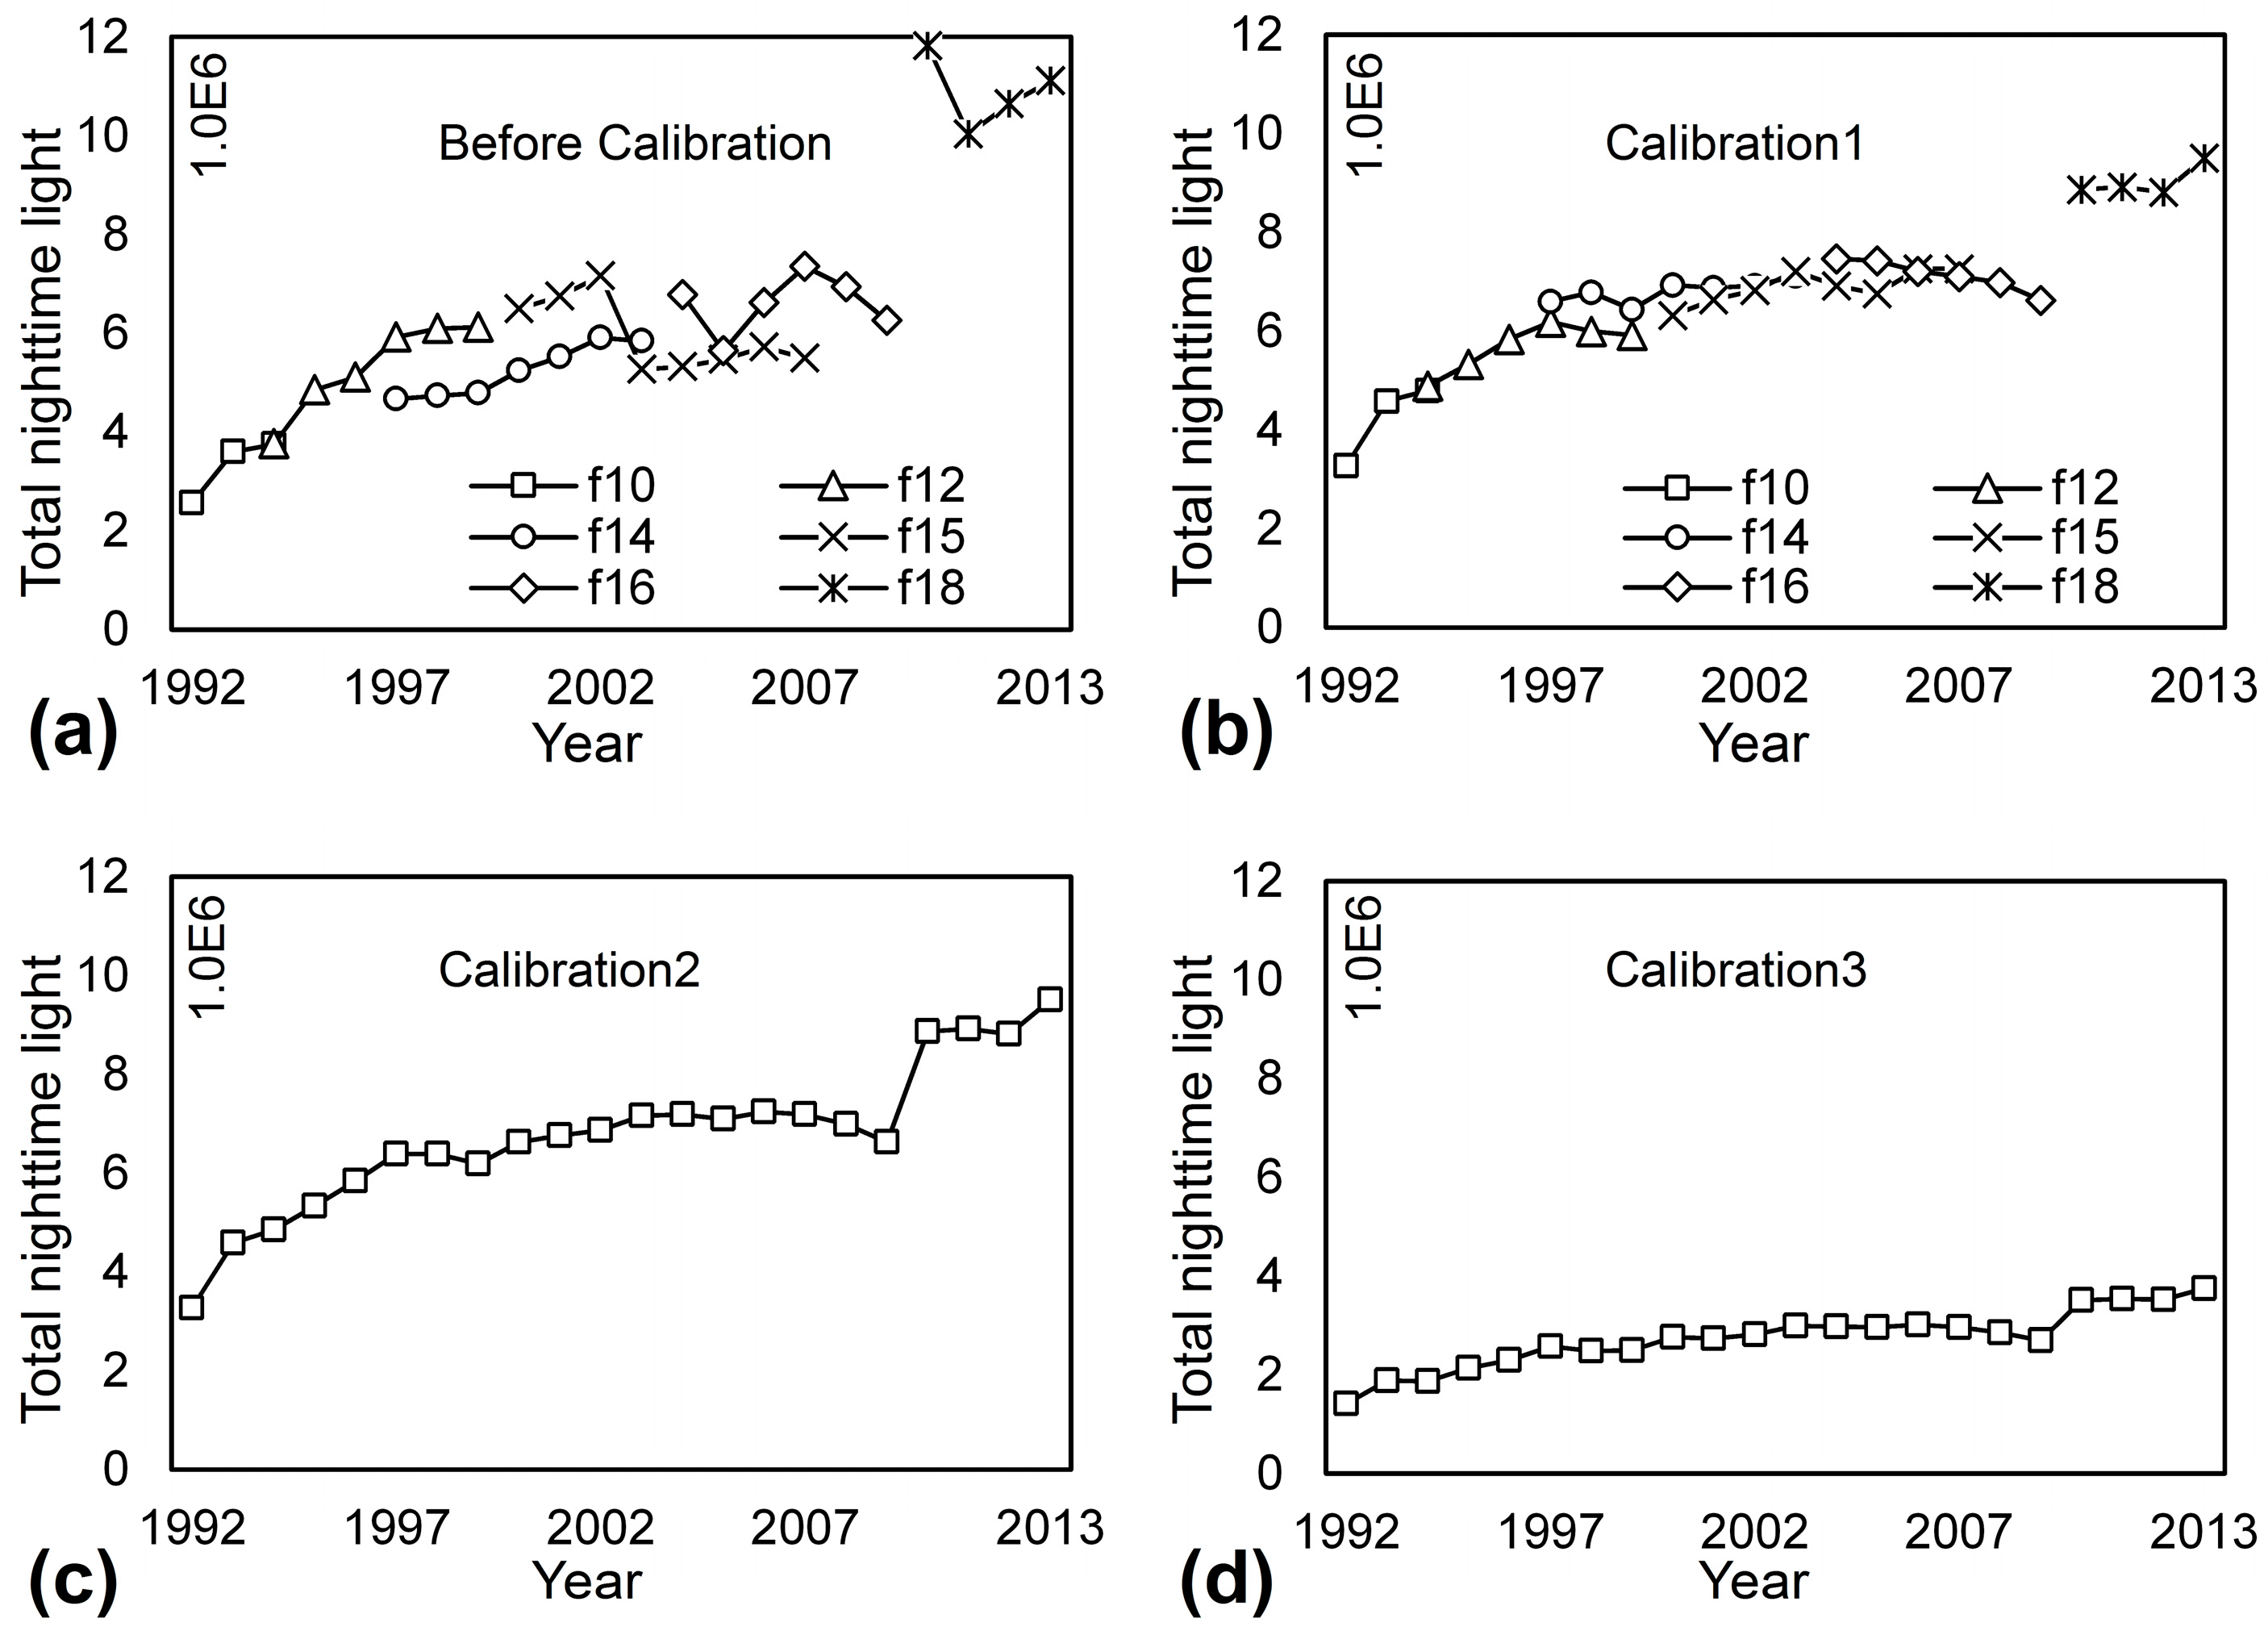
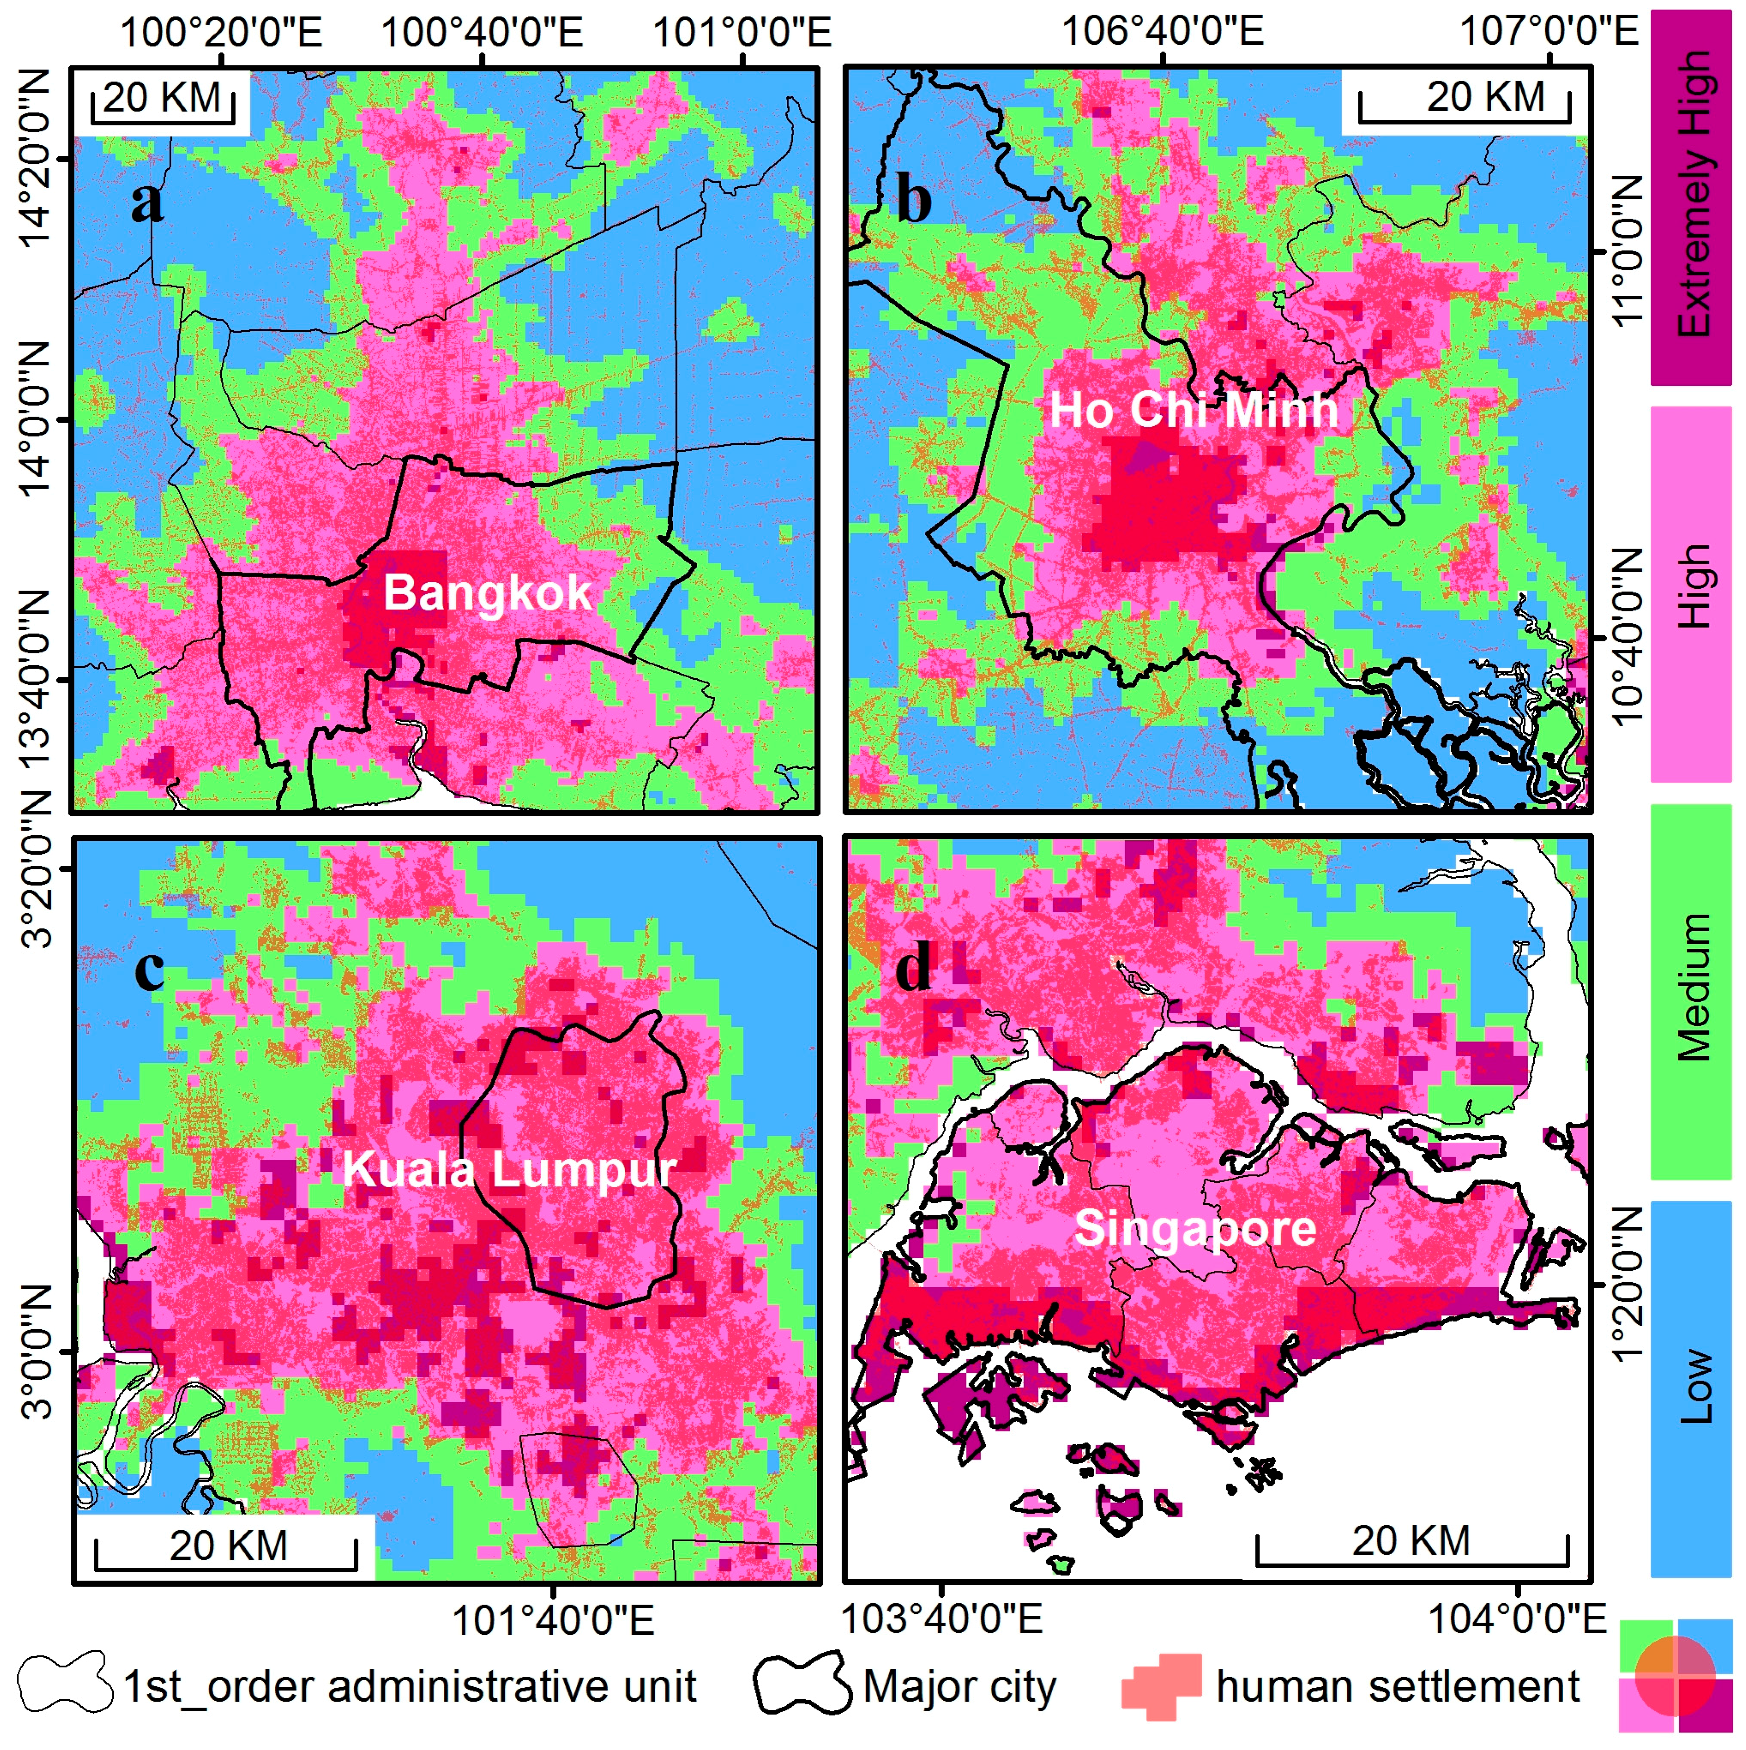
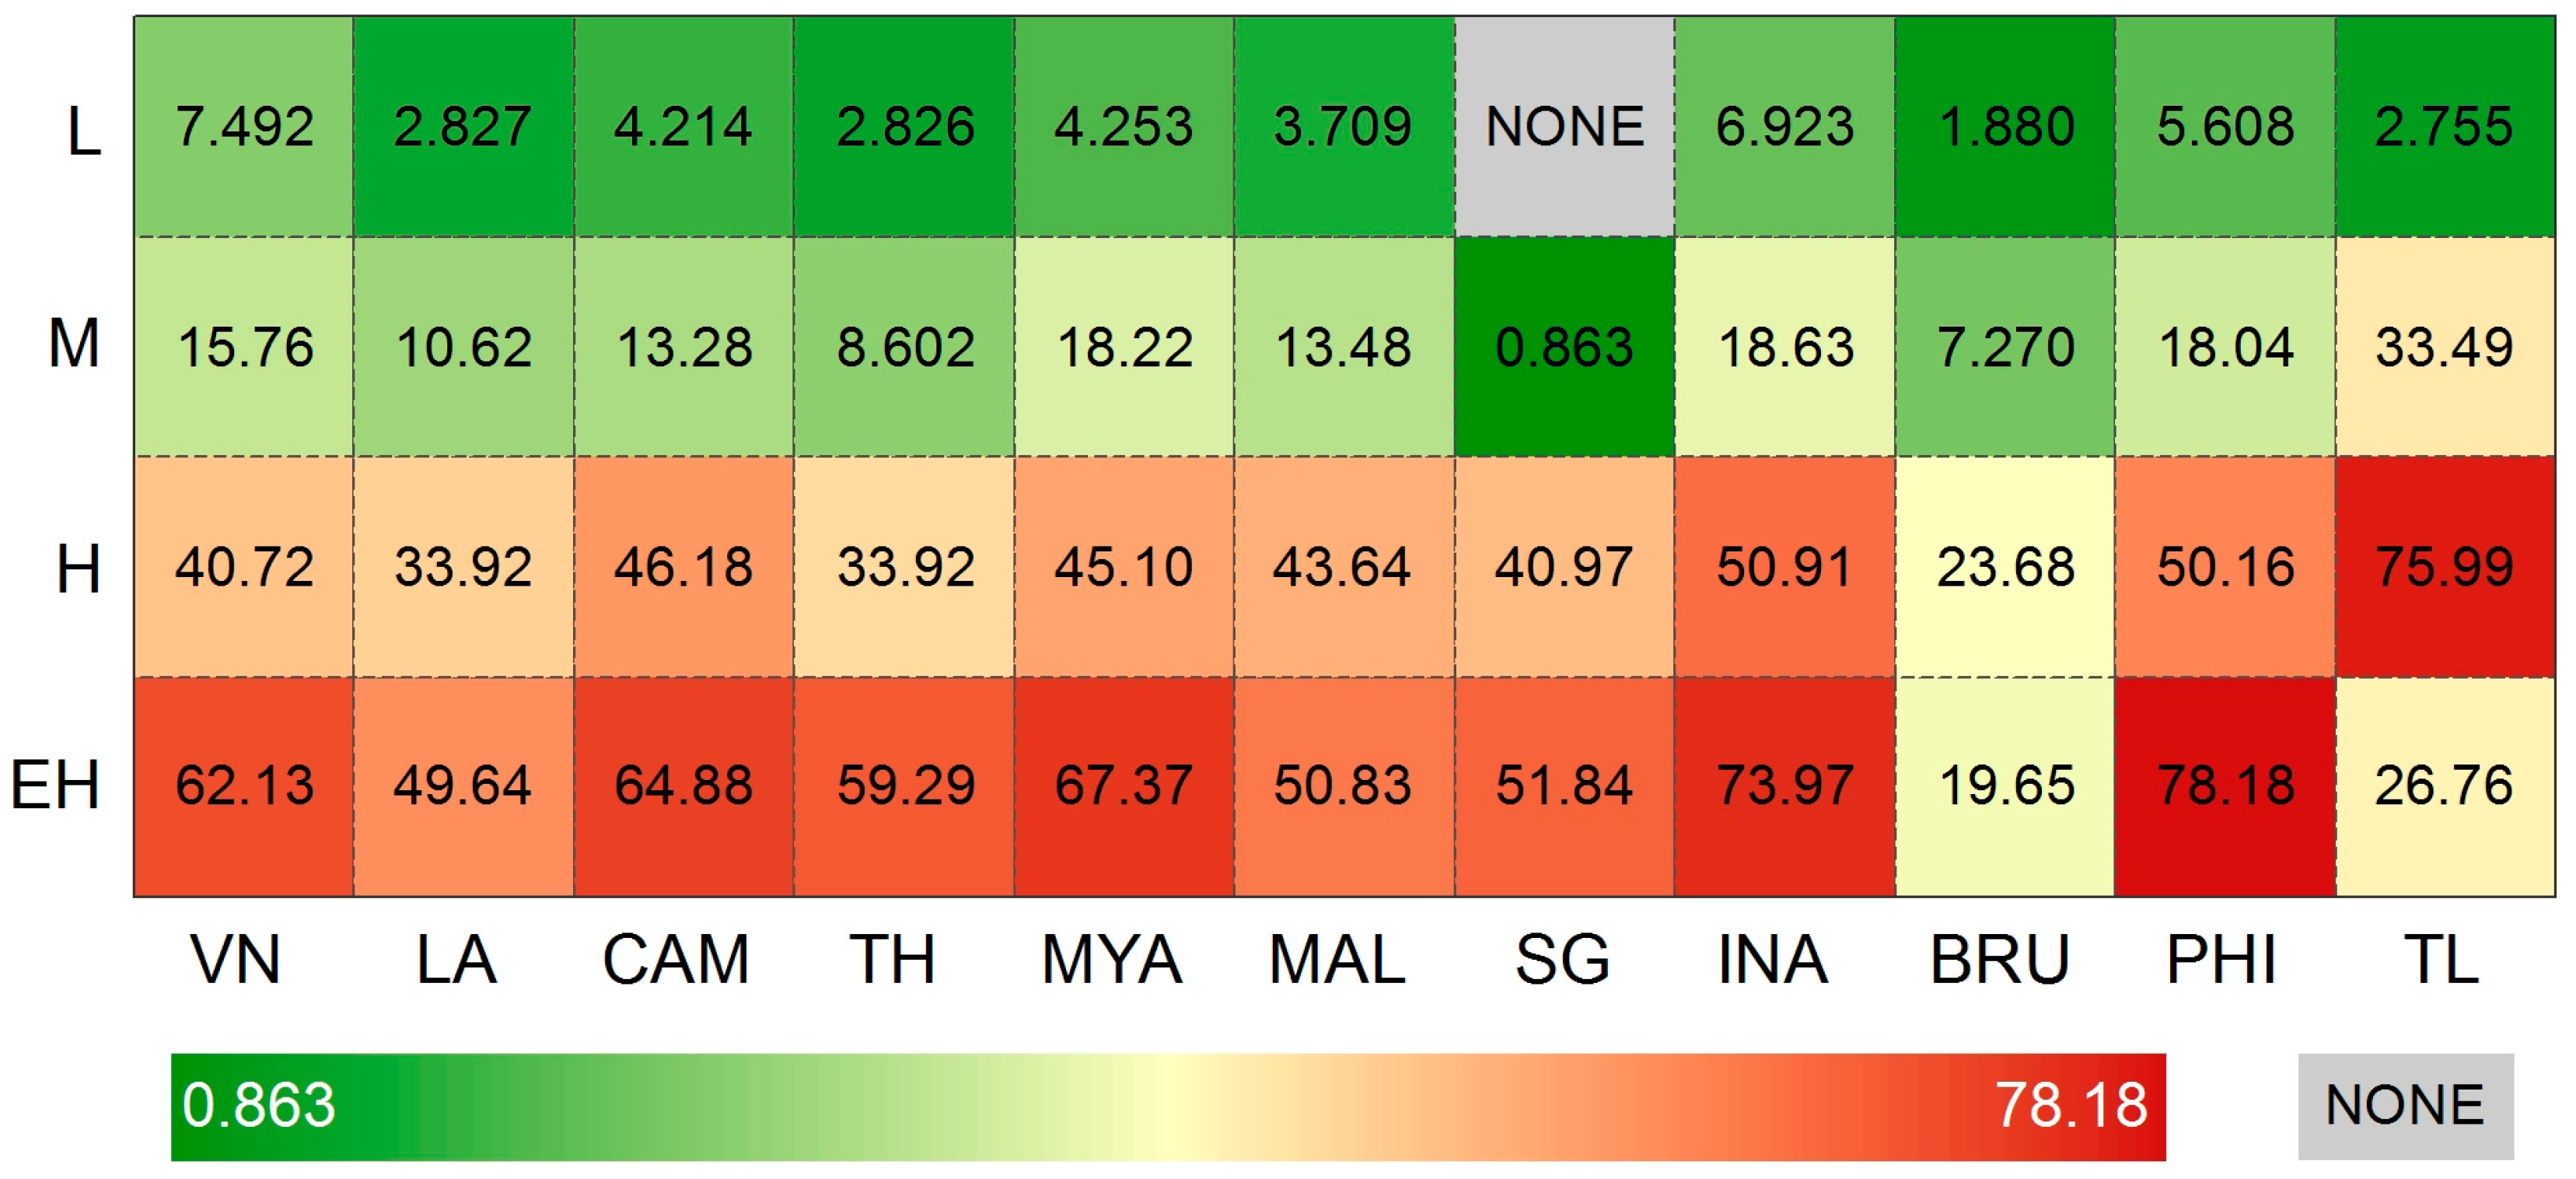
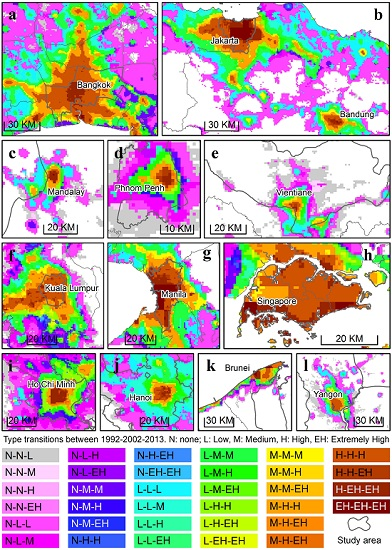
The primary objective of this study is to assess the spatiotemporal characteristics of urbanization dynamics from 1992 to 2013 in Southeast Asia by analyzing the spatial changes in nighttime light brightness over time across the entire region of Southeast Asia. Firstly, the 1992–2013 DMSP/OLS nighttime light data across Southeast Asia are calibrated through intercalibration, intra-annual composition, and the enhancement of variability to obtain the more reliable time series data of DMSP/OLS nighttime light imagery for the follow-up analysis. Secondly, the pixel-level brightness gradient across the region of Southeast Asia is calculated and the annual quadratic relationships for Southeast Asia between the pixel-level nighttime light radiance and corresponding brightness gradient are established. Thirdly, based upon the fitted quadratic polynomials for each year, proper split points of the quadratic curves are set to identify the nighttime lighting areas of Southeast Asian region into four different sub-regions with various degrees of human activity, and thereby generate the long-term nighttime lighting types of Southeast Asia spanning 1992–2013. Finally, analyses on spatiotemporal characteristics of urban development from 1992 to 2013 in Southeast Asia are carried out and the responses of nighttime lighting types to high-precision human settlements are discussed.
6. Conclusions
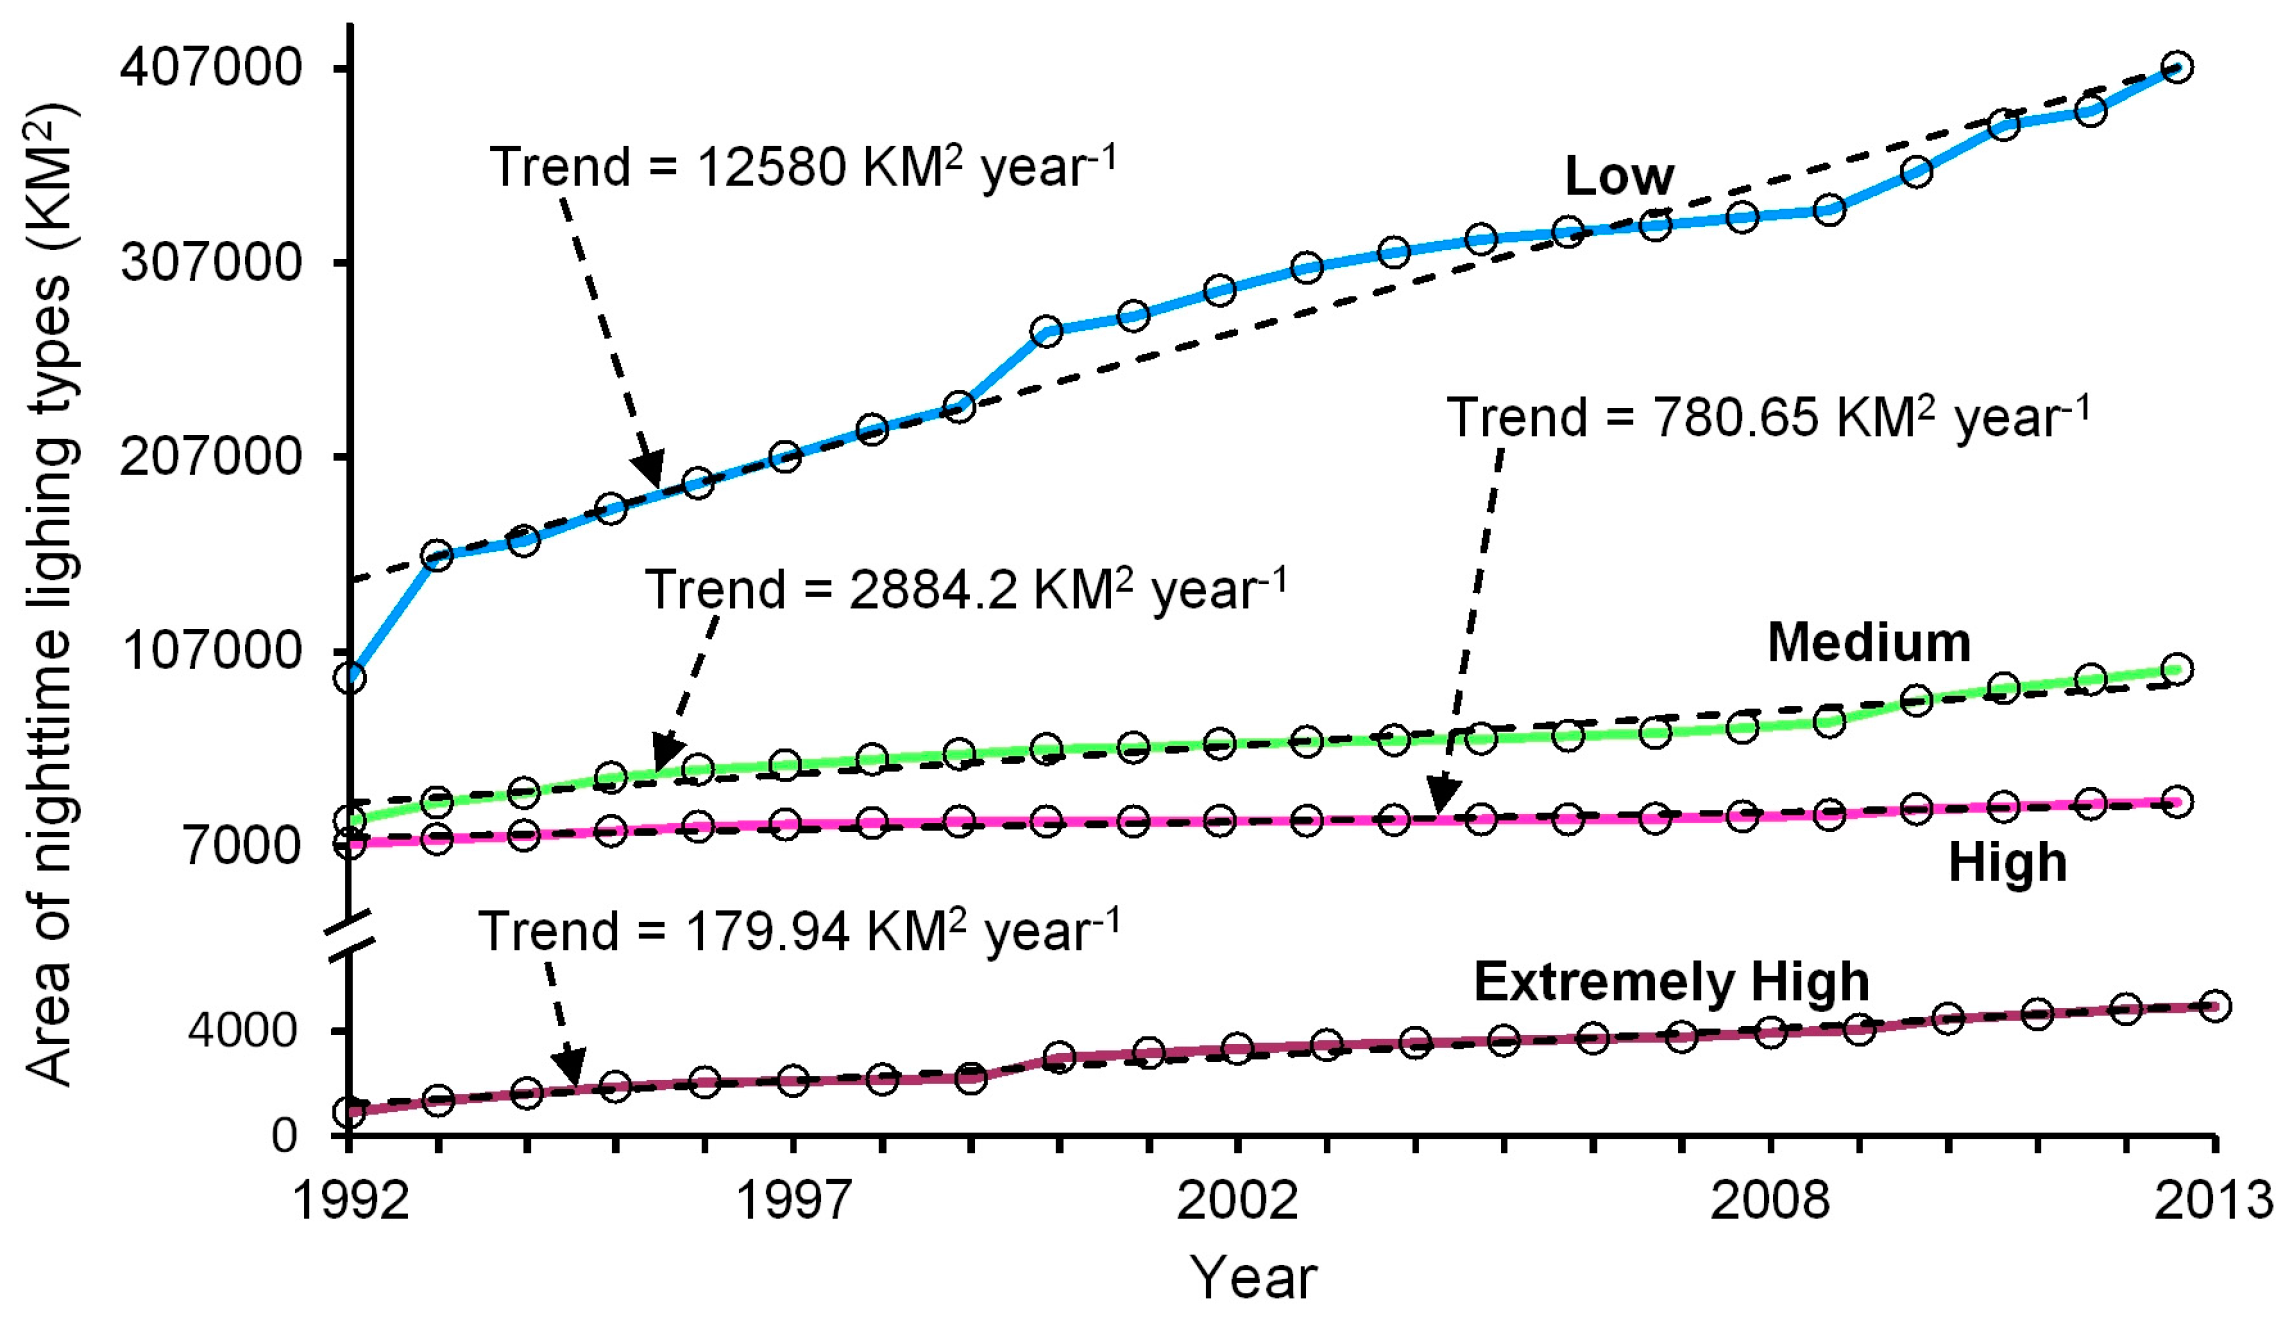
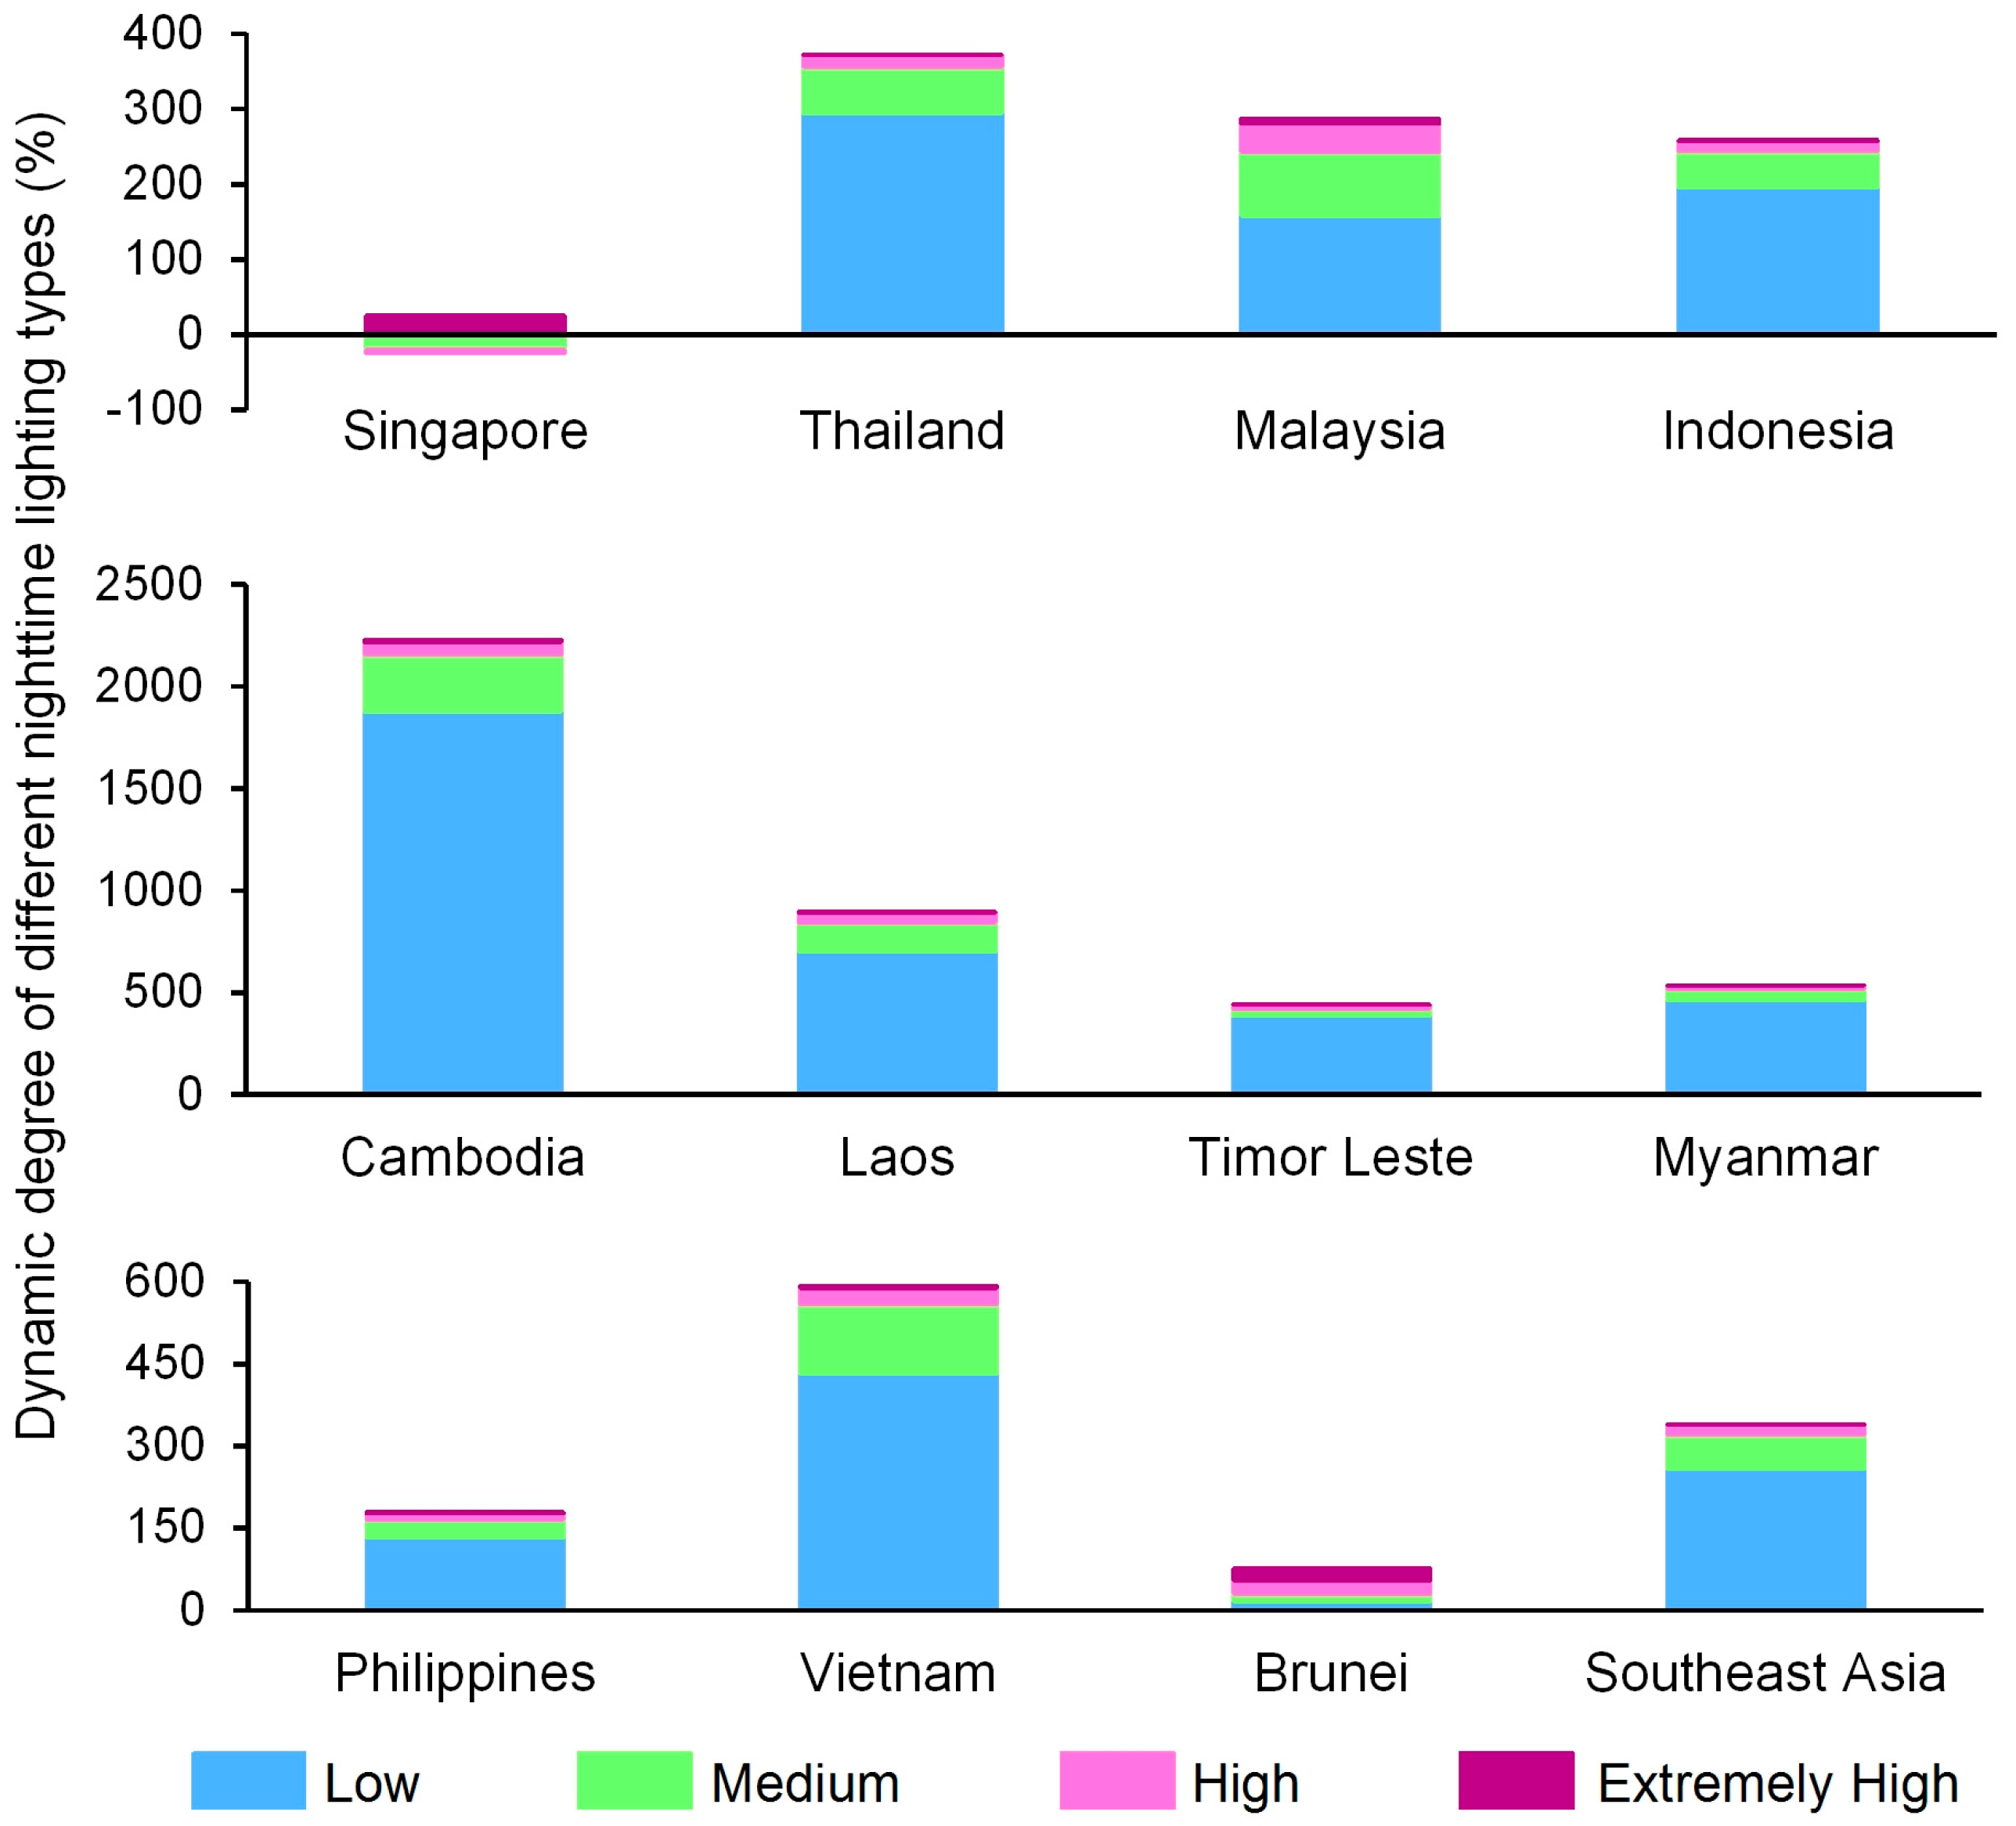
Time series variations of DMSP/OLS stable nighttime light signals, which are closely correlated with demographic and socioeconomic dynamics, provide an efficient way to track the spatiotemporal characteristics of urbanization. However, the raw data from version 4 DMSP/OLS stable nighttime lights time series dataset cannot be used directly for temporal analysis due to the absence of on-board calibration and intercalibration, as well as the saturation effects that exist in the urban central areas. To improve the comparability and continuity, and to enhance urban variability of the nighttime light signals, we calibrated the nighttime light images by three steps, including intercalibration, intra-annual composition, and enhancement of variability to systematically generate calibrated time series nighttime light data for assessing dynamics of regional development across Southeast Asia during the period of 1992–2013. In order to make full advantage of the spatial variations of nighttime light signals and to assess the spatiotemporal dynamics of urbanization across the entire Southeast Asia using a unified standard, we calculated the pixel-level brightness gradient of Southeast Asia that was proposed by previous studies and established the yearly quadratic relationships between the pixel-level nighttime light radiance and corresponding brightness gradient at the scale of the entire region. Based on comprehensive consideration, appropriate split points were set to quantitatively partition the yearly DMSP/OLS imagery across Southeast Asia into four sub-regions: low, medium, high, and extremely high nighttime lighting areas, which were potentially associated with various degrees of demographic and socioeconomic activity. Through analyses on spatiotemporal trends and transitions of different types of nighttime lighting areas, as well as the responses of different nighttime lighting types to human settlements, the spatiotemporal characteristics of urbanization dynamics across Southeast Asia from 1992 to 2013 were finally captured.
Generally, Southeast Asia has experienced a rapid and diverse urbanization process, spanning the years 1992–2013. When compared to high and extremely high nighttime lighting areas with intense anthropogenic activity, low nighttime lighting areas seem to exhibit a more obvious spatial expansion. Spatiotemporal transitions between different nighttime lighting types potentially depict the urbanization trajectory, which indicates conspicuous trends of gradually intensified anthropogenic activity from central areas to periphery areas, and from megacities to small cities. In addition, responses of nighttime lighting types to human settlements further delineate the dynamics of regional development. The satellite derived nighttime lighting areas are in good agreement with the radar derived human settlements with a spatial correspondence of extremely high and high lighting areas with dense human settlements, as well as a spatial correspondence of low nighttime lighting areas with sparse human settlements.

 ,
, 

