1. Introduction
In recent decades, the contribution of livestock farming to greenhouse gas (GHG) emissions as well as the deterioration of animal welfare, where violations result in ethical problems and threaten food safety [
1], have become increasingly important. In light of these factors, this study performs an investigation into responsible livestock farming. This paper introduces and describes a conceptual model for evaluating the economic, environmental, and animal welfare performance of livestock farms through the results of this study.
The agricultural sector is the fourth largest source of GHG emissions and is responsible for 10% of the overall emissions generated in the European Union (EU). About 40% of the emissions are generated by agricultural activities and can be attributed to cattle farming [
2,
3]. Furthermore, the emissions generated by agricultural activities will continue to increase due to the growth in world population and the simultaneous general improvement in lifestyle [
4,
5]. For these reasons, on both an international and European Community level, measurement and monitoring strategies have been introduced to quantify the amount of emissions generated by production activities and to create strategies to reduce impacts.
Globally, according to the targets set by the Kyoto Protocol (1997), the member states of the EU-15 are committed to reducing their emissions by 8%. In 2009, at the European level, this commitment was supported by the implementation of a common measure called the “Climate-Energy Package” [
6]. This measure lies within the context of the Europe 2020 Strategy [
7], and the most recent communications from the European Commission state the intent to reduce national emissions of greenhouse gases by at least 40% by 2030, compared to 1990 levels [
8]. In particular, the goal of the agricultural sector is to reduce its current emissions by 30% [
3].
To achieve this goal, measures need to be taken to reduce emissions associated with enteric fermentation, which includes feed reduction and the use of better quality forage, the disposal of wastewater, the fertilization of soils, and other cultivation practices. For the measurement and monitoring of GHG emissions, the European Community has recently introduced common regulations for taking inventory of emissions and sinks for all cultivated lands, including agricultural land, pasture meadows, and forests [
9]. However, the regulations do not provide obligations for making improvements. In addition to the Community regulations, there are private voluntary environmental certifications. There is an integrated product policy within the EU [
10] that is aimed at reducing the information asymmetry between suppliers and buyers; it is based on the analysis of the life cycle of the product, called the product carbon footprint, or of the entire company, called the corporate carbon footprint, according to the Life Cycle Assessment (LCA) methodology.
An interest in animal welfare in Europe has been growing since the Brambell Report [
11], which led to the approval of both horizontal legislation [
12] for the protection of animals on farms and the Council Regulation for the protection of animals during transport and transport-related operations, as well as specific rules for the various categories of livestock, including calves, chickens, and pigs [
13]. The EU has also recognized the close relationship between animal health and food quality and safety through regulation [
14] of the official controls used to ensure the verification of compliance with feed and food law, animal health, and animal welfare rules.
To address this, the New Strategy for Animal Welfare (2007–2013) of the EU states, “the concept of the health of an animal includes also the critical relationship between the health of animals and their welfare, and is a cornerstone of EU policy on public health and food safety” [
15]. Through the aforementioned regulations, the EU has provided minimum requirements in law, as well as incentives for safeguarding animal welfare.
Animal welfare minimum requirements were introduced into the Mandatory Management Criteria (MMC), which are essential for obtaining Common Agricultural Policy (CAP) subsidies. In addition, several private systems have been developed to determine animal welfare indicators; at the European level, the Welfare Quality
® Project [
16] and the AWIN project were funded specifically to identify and/or develop scientific indicators of animal welfare for the various categories of livestock. The TGI35L (Tier-Gerechtheits-Index) in Austria [
17] and the welfare assessment method in France [
18] are some of the systems developed to implement valid, repeatable, and applicable systems for animal welfare assessment in consumer assurance certification systems.
However, as cited in the literature [
19] and in European legislation [
20], to date there is no specific regulation for dairy and beef cattle farms, despite the various problems reported by scientists and by the European Food Safety Authority (EFSA). As a result, each member country has adopted independent criteria for establishing animal welfare thresholds with which farmers must comply. Denmark and Germany have adopted the most stringent animal welfare standards, certifying their products in order to gain consumer approval [
21]. Increasing consumer awareness of animal welfare issues has brought about the introduction of private standards, creating new opportunities for product differentiation [
22].
Studies on the European market have shown a need to directly provide consumers with guarantees on the ethics and sustainability of the product by developing systems of certification and labeling, defining standards for livestock farming, and guaranteeing traceability. Consumers do not consider the method of livestock farming to be of secondary importance in determining the quality of the purchased product [
23]. So, the need for environmental commitment is creating new opportunities to enhance farmers’ competitiveness including, according to stakeholder theory [
24], the creation of relationships within the social context that improves the farm’s reputation.
To meet growing consumer needs, voluntary certifications have been introduced both in the environmental [
25] and animal welfare sectors, such as the RSPCA Freedom Food scheme. Market mechanisms, legal restrictions, and economic incentives therefore play a pivotal role in influencing producers to adopt sustainable production methods. Besides affecting animal welfare and the environment, these mechanisms contribute to the sustainability of a production process and costs. Different studies on a European-wide scale have shown the lack of adequate incentives to improve reducing emissions, and both animal welfare and technical efficiency [
26,
27]. This is because both animal welfare and emissions are intangible attributes, and cannot be directly experienced by consumers, as they are the consequences of the practices adopted and are not necessarily correlated to the quality of the products. In addition, the concept of sustainability is complex and sometimes controversial, especially when considered together with issues of sustainability [
28].
The concept of sustainability, in fact, is a broad concept that spans from the recovery of production costs to social acceptability to respect for the ecosystem [
26]. The concept of sustainability for livestock farms has been divided into four dimensions [
29]: economic sustainability (profitability), internal social sustainability (working conditions), external social sustainability (animal welfare, landscape quality, etc.), and ecological and environmental sustainability (GHG emissions, eutrophication, groundwater pollution, etc.). Sustainability, therefore, takes into account many factors, as listed above, that are difficult to quantify [
30].
Nonetheless, in recent decades, numerous methodological approaches have been proposed to investigate the relationship between economic aspects, standard animal welfare, and the environmental impacts of farming. In general, these studies aimed to give producers guidance on the use of simulation models [
31]. Despite the wide variety of simulation models proposed in the literature, the common goal shared by all the models is to simplify real situations, such as farm efficiency, to predict the effect of changes in factors and variables on the outcome considered by the model. Most of the simulation models are based on math programming techniques which allow optimizing a result, which is an objective function within a particular context, such as maximizing income or minimizing cost, subject to constraints compared to the resources available in the system considered.
With respect to animal welfare, simulation modeling at the farm level was used to evaluate the economic effects associated with the introduction of higher standards of animal welfare in dairy cattle breeds [
32,
33], sheep [
34], and comparing intensive breeding systems in different species [
35]. In addition, Langford and Stott [
36] modeled different animal welfare scenarios, including high and low rates of infertility, mastitis, and lameness, and estimated the effects on long-term economic performance of animal welfare improvements. Den Ouden et al. [
37] developed a simulation model to identify optimal levels of some animal welfare attributes in different pig breeding stages, including farrowing, fattening, transportation, and slaughter, that minimize costs and ensure some level of animal well-being. Kingwell [
38] applied a simulation model to analyze the effects of different management scenarios on animal welfare and sheep farming incomes in low rainfall areas.
With respect to GHG emissions, numerous simulation models have been developed under a whole farm approach, focusing on the reduction of GHG emissions and investigating reciprocal relationships between the different dimensions of sustainability [
39]. This model included various aspects of the simulations, from barn management to the environmental dimension and financial outcomes.
The combined effect of GHG emissions and animal welfare has been analyzed by Schils et al. [
40], Del Prado and Scholefield [
41], and Del Prado et al. [
42]. Specifically, they developed a system model incorporating existing sub-models that consider the main factors affecting business sustainability, to define a more ethical breeding system. In addition, Van Calker et al. [
43,
44] integrated linear programming and the Multiple Attribute Utility Model to develop an overall sustainability function, involving economic, social, and ecological sustainability aspects, to rank different Dutch farming systems and estimate the related trade-off maximizing each sustainability aspect. More recently, Oudshoorn et al. [
28] analyzed the trade-offs between different aspects of farm sustainability aimed at optimizing farm profitability, animal welfare, and GHG emissions in Danish organic dairy farms. Thus, based on the abovementioned studies, only limited research using the same models simultaneously considered the three aspects of traditional sustainability, focusing solely on dairy farms.
The present study addresses only some aspects of the environmental, economic, and social sustainability of livestock farms, integrating carbon footprint (CF) indicators with profitability and animal welfare indicators in a Multi-Attribute Decision-Making (MADM) approach.
The objectives of this study are to assess the current levels of economic and environmental sustainability and animal welfare on eight farms, and to develop a method for quantifying the adaptation costs needed to meet environmental and/or animal welfare requirements.
The evaluation method described in this paper is a useful tool for helping farmers, producer associations, union members, and policy makers to make decisions. In particular, this method allows farmers to assess the possible economic consequences of adapting their production method to animal welfare and/or greenhouse gas emissions goals, producer associations, and unions to establish best practices guidelines, and public policy makers to apply policies to support producer improvements.
The paper is organized as follows: theoretical framework, which presents the scientific findings that motivate the identification of specific production steps for livestock farms; materials and methods, which define the analytical method used to evaluate the cost to livestock farms to enact the defined requirements for animal welfare and emissions; a case study, in which the evaluation method is applied to eight Italian cattle and dairy farms; results and discussion, which illustrate the results obtained and the possible implications in terms of policy; and conclusions, in which the limitations of the methodology are identified and possible research development is outlined.
Theoretical Framework
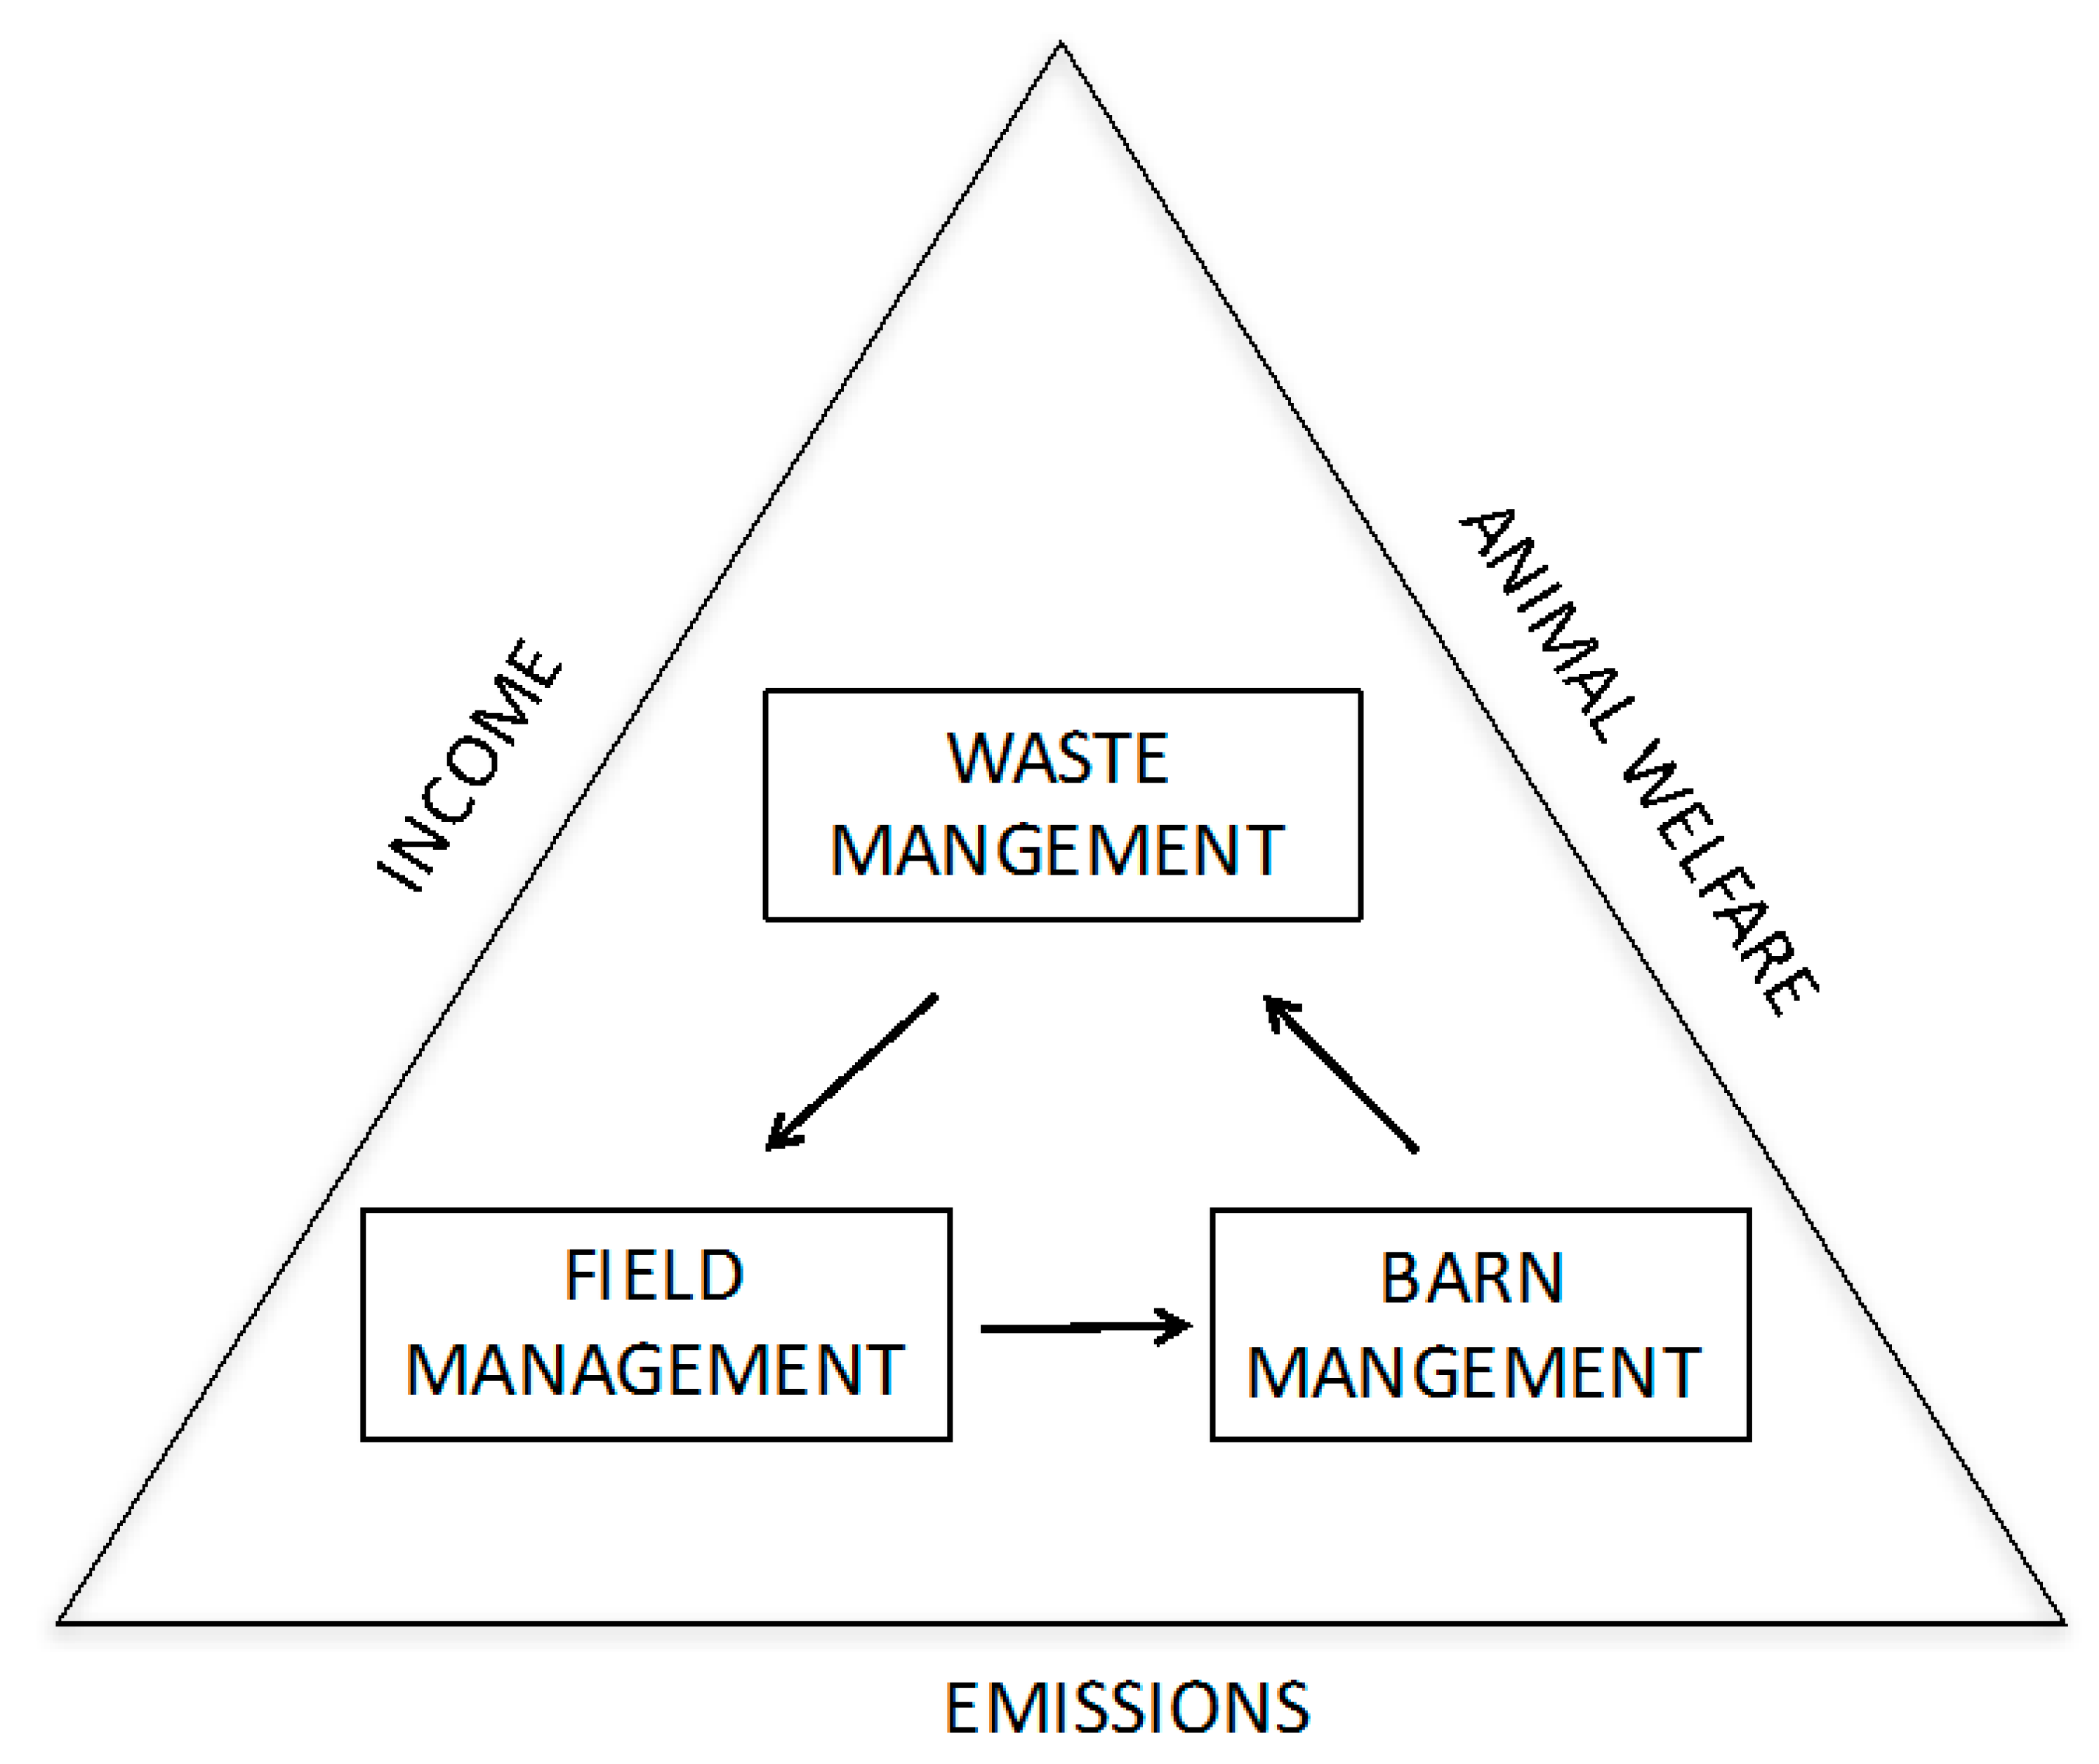
This study evaluates the production process (PP) of livestock farms. The process is divided into three main phases: the field phase involving the practices adopted to cultivate the feeding crops, the barn phase involving the practices adopted to raise livestock, and manure management, which involves all the practices adopted to manage the waste produced. The three phases are interconnected; the management criteria adopted in each phase influences the performance of the other two phases in terms of profitability, animal welfare, and emissions (
Figure 1). The practices adopted to cultivate the feeding crops influence both production costs per feed unit and the required energy consumption. The practices adopted to raise livestock influence animal welfare, GHG emissions, the cost per unit of product (i.e., kg of carcass weight, liter of milk equivalent), and the quantity of manure produced. Finally, the practices adopted to manage the manure influence the recovery of energy through the substitution of the fertilizer used in the field phase and/or the direct fertilizer costs, and the cost of waste disposal. The three production phases are assumed to be part of the same farming system.
To increase profitability, the farm could implement the following two strategies: minimize production costs to equal revenue by reducing unnecessary costs involved in the production process, and maximize revenues to equal costs by increasing the volume of sales, the selling prices, or both.
The first strategy could involve the intensification of production processes that will reduce the production costs, both directly and indirectly, per unit of product within certain limits.
The second strategy could be implemented by increasing the volume of sales, the selling prices, or both, due to specific improvements in product quality measures, such as the adoption of voluntary certification schemes. Moreover, the intensification processes tend to encourage greater use of concentrates in the animal diet, which has been shown to be positively correlated with increased yields [
45].
However, the higher the stock density, the higher the risk of disease [
41,
45], with negative effects on production quality and quantity. As a consequence, production process intensification results in a decreasing marginal rate of return. In any case, the stocking density must not exceed certain thresholds imposed by the EU.
The economic indicator most commonly used for beef cattle herds is the ratio between the production costs and kilograms of meat produced, while for dairy farms, it is the relationship between the production costs and liters of milk equivalents [
46,
47]. In addition to production costs, the literature also considers different farm income indicators that include intangible elements associated with the value of the product sold, such as product quality, normalcy, and production methods.
For emissions, livestock farming is mainly responsible for the production of GHG, in particular carbon dioxide (CO
2), methane (CH
4), and nitrous oxide (NO
2). Carbon dioxide is mainly released by fossil fuels, methane is released mainly through enteric fermentation and stored manure, and nitric oxide is released through microbial transformation in the soil and in manure through the use of fertilizers [
48].
Literature on GHG emissions from farms recommends implementing a series of actions for the three phases of field, barn, and manure management. In particular, the field phase is considered the largest contributor of emissions on livestock farms [
49].
Mitigating actions reported in the literature for this phase include: minimum or no tillage to replace traditional practices of preparing the land for specific crops [
50,
51], crop rotation between legumes and cereals [
52], localized fertilization [
4,
53], seed selection [
54], and conversion of arable land into pasture [
55].
For the barn phase, actions to mitigate enteric fermentation include: replacing forage silage with corn silage, increasing the concentrates-to-forage ratio, and improving forage quality [
56]. These actions, while reducing enteric fermentation, could lead to a net increase in the amount of GHG emitted, due to the increase in emissions with the production and transport of additional quantities of concentrates [
57,
58].
Manure management is a critical stage in the production process, particularly due to emissions of methane and nitrogen. The levels of these emissions are influenced by whether or not straw bedding is used in the barn and the frequency of manure removal from the barn and storage facilities [
59], the frequency and duration of grazing [
60], whether or not manure is used instead of fertilizer, the presence or absence of anaerobic digestion plants that reduce emissions during storage, and the substitution of fossil fuels with organic fuels.
Similar to what has been described in relation to economic efficiency, the indicator most commonly used to assess the energy efficiency of raising livestock is the relationship between emissions and the output produced. The literature, however, shows that the use of this indicator to estimate emission reductions is quite controversial. In particular, the literature shows that in order to significantly reduce emissions, production must be increased [
4,
61]. The ambiguity of this indicator increases when the energy efficiencies of both extensive and intensive farms are compared, which involves farms with different animal housing conditions. An analysis of energy efficiency is significant when the effects of alternative actions for a given farming system are analyzed [
62] or when the reference unit is not the animal raised but the agro-ecosystem [
63].
For animal welfare, reference is only made to the barn phase in which indirect and direct indicators are considered. The indirect indicators analyze the type of housing and management, while the direct indicators examine how the animals adapt to the rearing system. The indirect group of indicators analyzes the causes that could affect animal welfare, while the direct indicators analyze the effects. Some authors use direct indicators related to metabolism, the endocrine system, and the immune system [
64] because of the arbitrariness in evaluating other indicators [
18,
64,
65].
These evaluations would be expensive if carried out on a representative sample of a herd. They are good for experimental research, but are difficult to replicate on an operational level. Indirect indicators fall into two main categories: the conditions and management of the barn, and nutrition. The indicators related to barn management and conditions mainly describe aspects such as available space, the characteristics of the feeding and drinking systems, bedding quality, access to pasture, the adequacy of the milking parlor, and the ventilation system. Indirect indicators pertaining to nutrition refer in particular to the quality of forage and silage, and the percentage of forage in the overall diet.
The direct indicators fall into three main categories: behavior, physiology, and health. Some examples of such parameters are: levels of hormones related to stress, fear, and abnormal behavior, symptoms of diseases, and mortality. It is commonly accepted that a robust assessment of animal welfare is achieved when direct and indirect parameters are combined [
66]. Recent animal welfare evaluation criteria also take into account the bio-safety factor [
67].
Increasing the ratio of concentrate to forage in the animal diet is considered a good practice for reducing enteric fermentation emissions; however, this practice is not recommended with respect to animal welfare. In fact, reducing forage is positively correlated to the incidence of rumen acidosis and lameness, which has a negative impact on animal welfare [
60]. In addition, malnutrition is associated with increased incidence of stereotypical behaviors, which are rarely observed in well-fed animals [
64].
Table 1 shows possible improvement measures that could have different implications in terms of emissions, animal welfare, and profitability.
These considerations highlight the need to adopt logical criteria that can identify a mix of sustainable economic, social, and environmental actions that can be used to delineate possible compromises between some actions that improve a given dimension of sustainability while worsening another dimension. Following is a description of the conceptual model designed for this purpose.
2. Materials and Methods
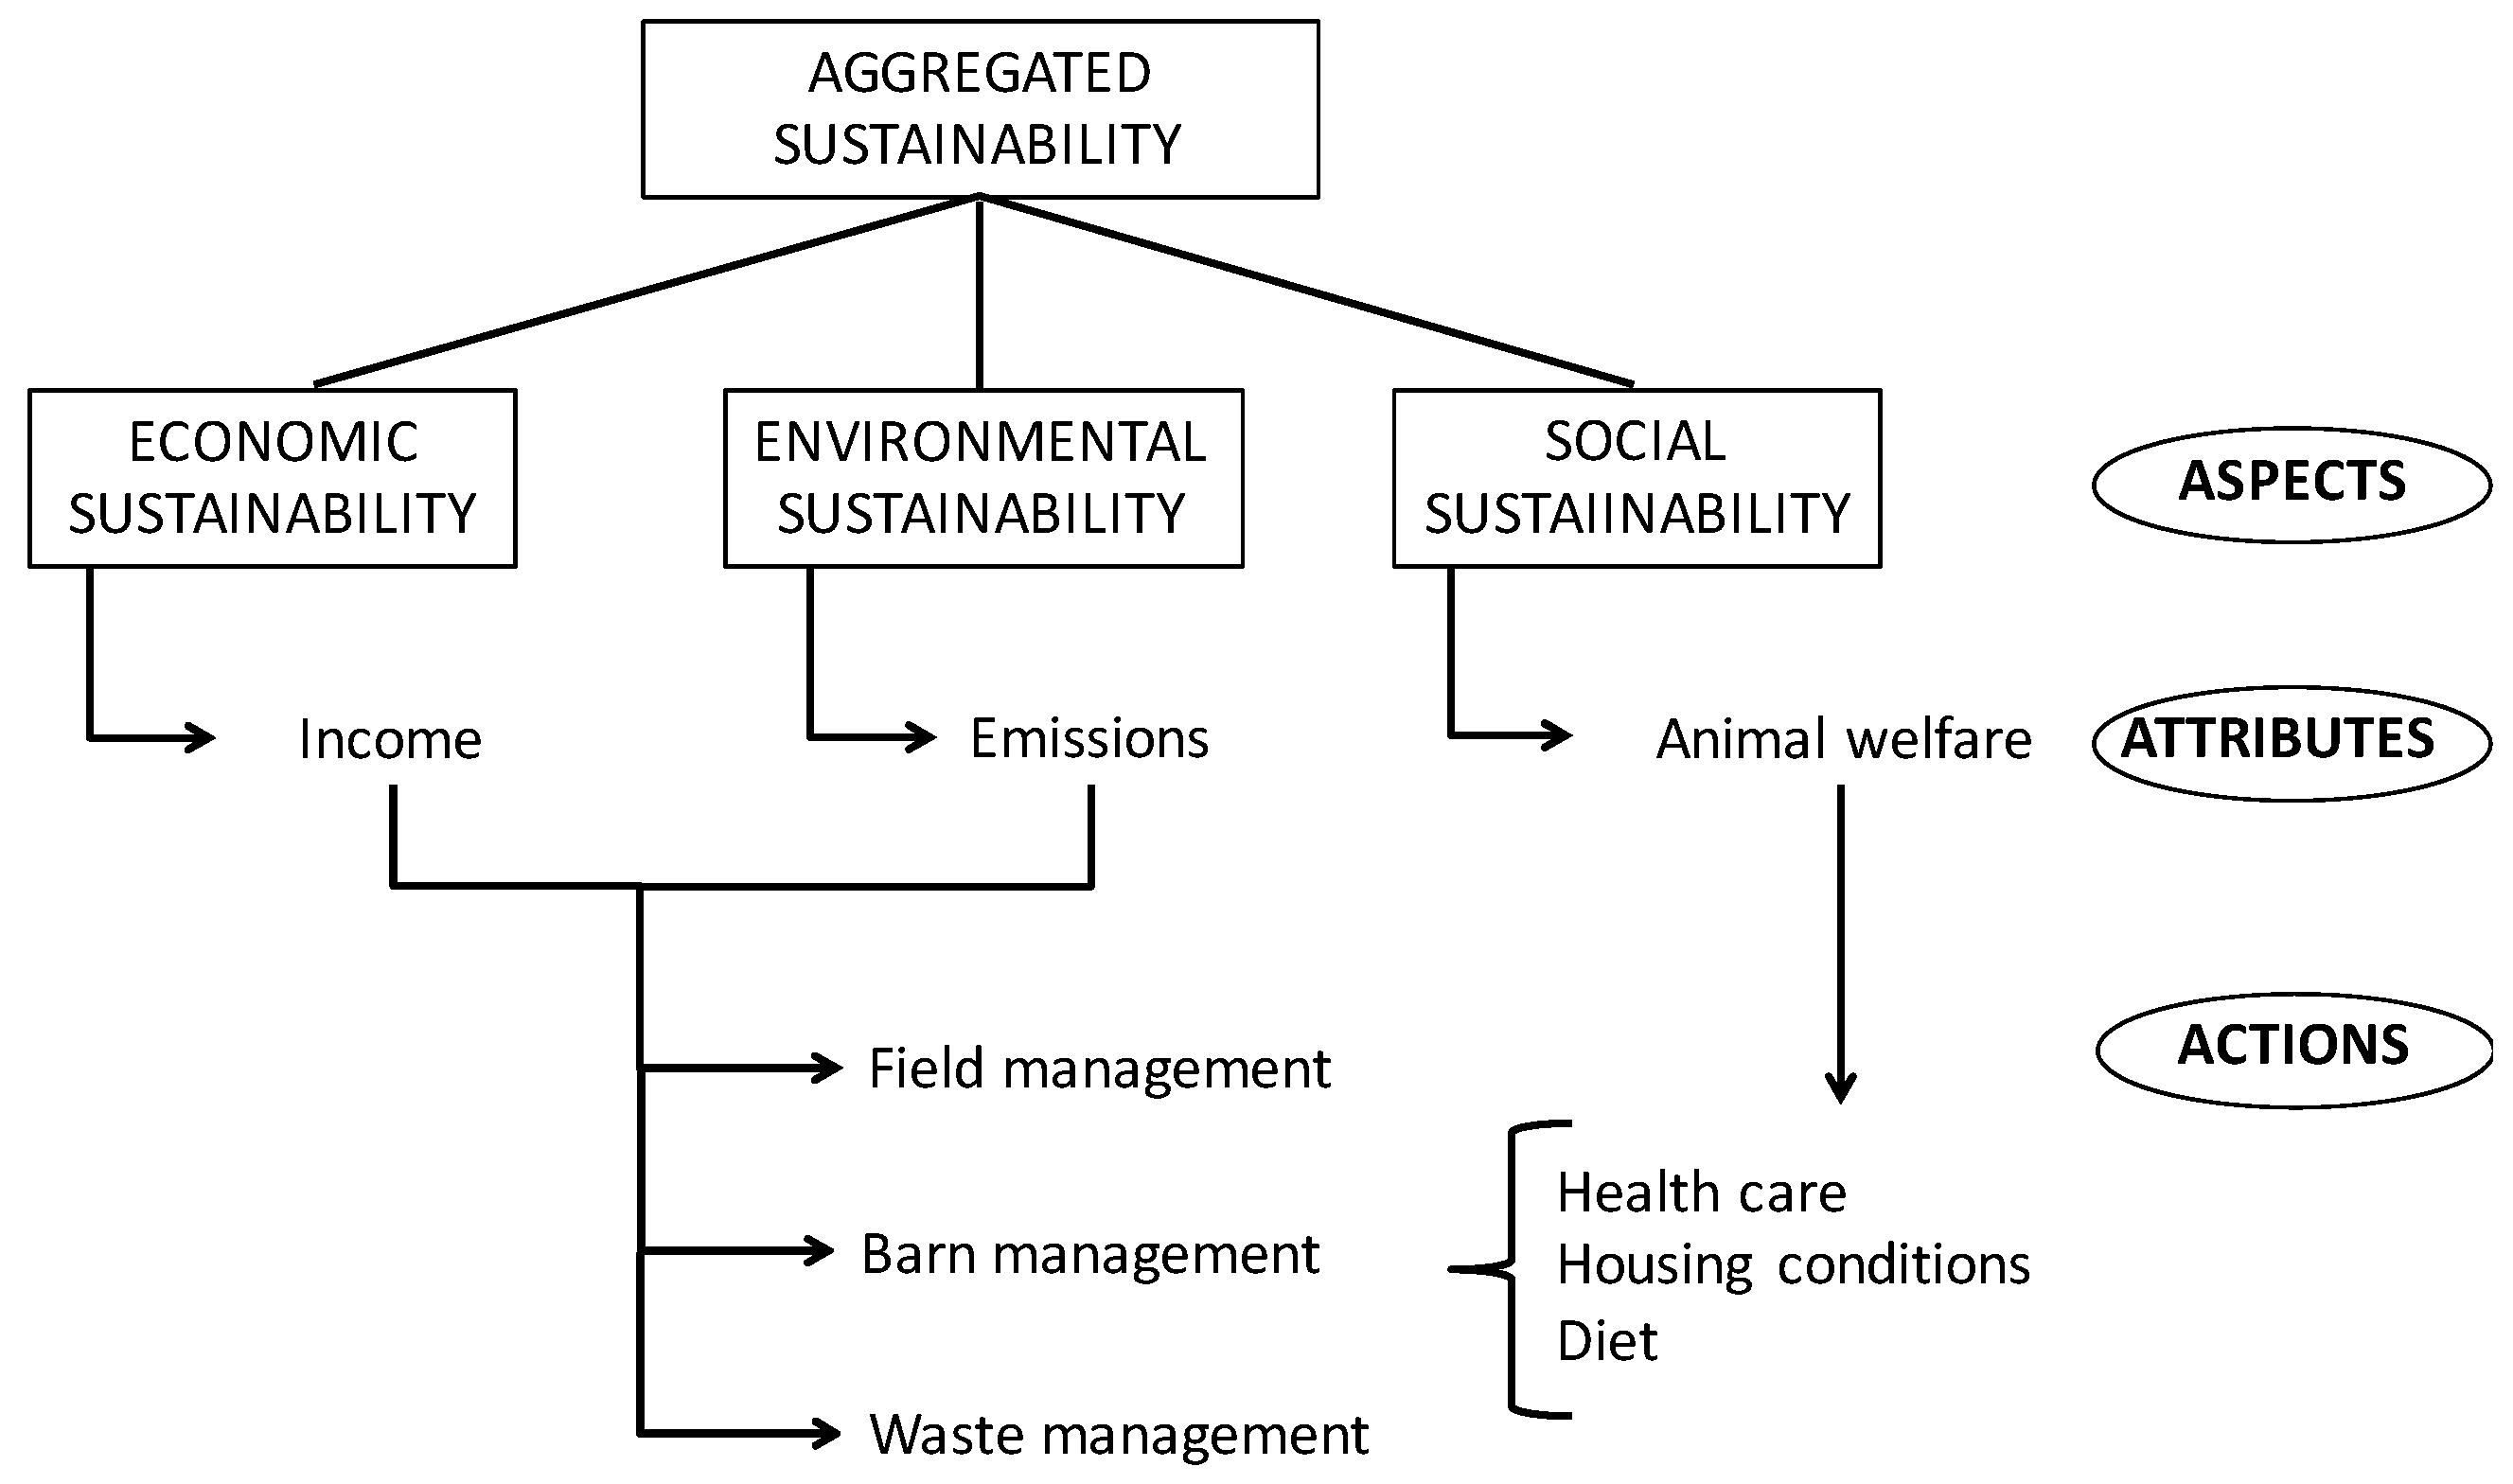
In this study, a Multiple Attribute Decision-Making (MADM) approach is used involving two evaluation steps: (1) a sustainability diagnosis; and (2) an adaptation assessment. The first step aims to assess the current levels of economic, environmental, and animal welfare sustainability at the eight selected farms. The second step aims to identify and assess the least expensive actions needed to take any corrective actions to improve the overall level of sustainability. In the first step, the sustainability diagnosis was carried out by developing a hierarchical evaluation model including a single aggregated sustainability index (S), which breaks down into the disaggregated aspects and attributes (
Figure 2). In order to integrate the individual aspects of sustainability into a single function, it is necessary to define the respective indices with the same range of variation from 0, being the absence of sustainability, to 1, being full sustainability. These indices are based on the comparison between quantified actual values and reference values.
Actual values were obtained by calculating costs, GHG emissions, and animal welfare scores on the basis of the practices currently used by farmers (rearing methods) and the characteristics of the input used (materials used, quantities, etc.). Reference values were then calculated by considering different sources of information for each aspect of sustainability.
Reference values are key parameters needed to calculate relative sustainability scores, ranging from 0 to 1. This scaling procedure implies the need to identify upper and lower reference values for each aspect of sustainability. For economic sustainability, the relative sustainability score was obtained by identifying a mark-up lower bound, r
e = 0, when mark-up ≤ 0, and a mark-up upper bound, r
e = 1, when mark-up ≥ r
e, obtained by means of technical publications addressing the economic performance of local cattle [
55] and dairy farms [
56] under ideal rearing conditions. For environmental sustainability, the relative sustainability score was obtained by using both Intergovernmental Panel on Climate Change (IPCC) conversion factors and official welfare quality protocols to identify upper bound practices, that is, practices that maximize GHG emissions per LU, such that r
h = 0 when GHG emissions ≥ r
h, and lower bound practices, that is, practices that maximize GHG emissions per kg of carcass weight/liter of milk equivalent, such that r
h = 1 when GHG emissions ≤ r
h. Similarly, upper and lower bound practices were identified to calculate animal welfare relative scores using the reference values reported in official protocols. More specifically, the ratio between the quantity of straw per Livestock Unit (LU) used for bedding and the respective ideal quantity established in the official Welfare Quality
® protocols, the ratio between the percentage of forage in the feed ration and the respective ideal percentage established in the official protocols, and the ratio of the space available for each animal and the ideal space established in the official protocols were determined.
To measure the degree of sustainability of each of the aspects considered in the proposed evaluation model, the following multi-attribute function was used:
where
f is the aggregation function adopted to integrate the various attributes of sustainability into a single indicator of synthesis. Hence, the geometric mean was adopted to limit the compensation effect of the arithmetic mean, commonly adopted in an effort to build aggregate indicators of sustainability [
25].
j is the number of aspects of sustainability considered in this study (profitability, animal welfare, emissions);
i is the number of attributes for each aspect of sustainability;
n is the number of actions that affect the current levels of sustainability for each attribute;
sj is the multi-attribute function of aspect
j;
ri,j is the level of sustainability associated with the
ith attribute of aspect
j;
wi,j is the weight associated with the
ith attribute; and
xn is the degree of activation of the
nth action, a decisional variable that will depend on the degree of sustainability associated with the
ith attribute of aspect
j.
The function for aggregated sustainability is:
This function is analogous to Equation (1) with the difference that Wj is the weight associated with the jth aspect of sustainability, whose level is influenced by the manner and the conditions in which the production process is carried out. This two-stage model allows two weight levels to be attributed, a horizontal level represented by weights and a vertical level represented by the number of stages.
The structure of the hierarchical model determines the level of importance associated with the different aspects of sustainability. This method is better than non-hierarchical models because it limits the risk of distortion in the allocation of weights through splitting the weighting. In non-hierarchical models, such distortions occur when an evaluator implicitly increases the weight of an aspect by dividing it into more than one attribute [
68,
69].
This method provides a clear view of the current level of sustainability associated with a specific production process. However, it is necessary to go another step to quantify, in economic terms, the costs required to adapt farming practices to more sustainable processes from environmental and social points of view.
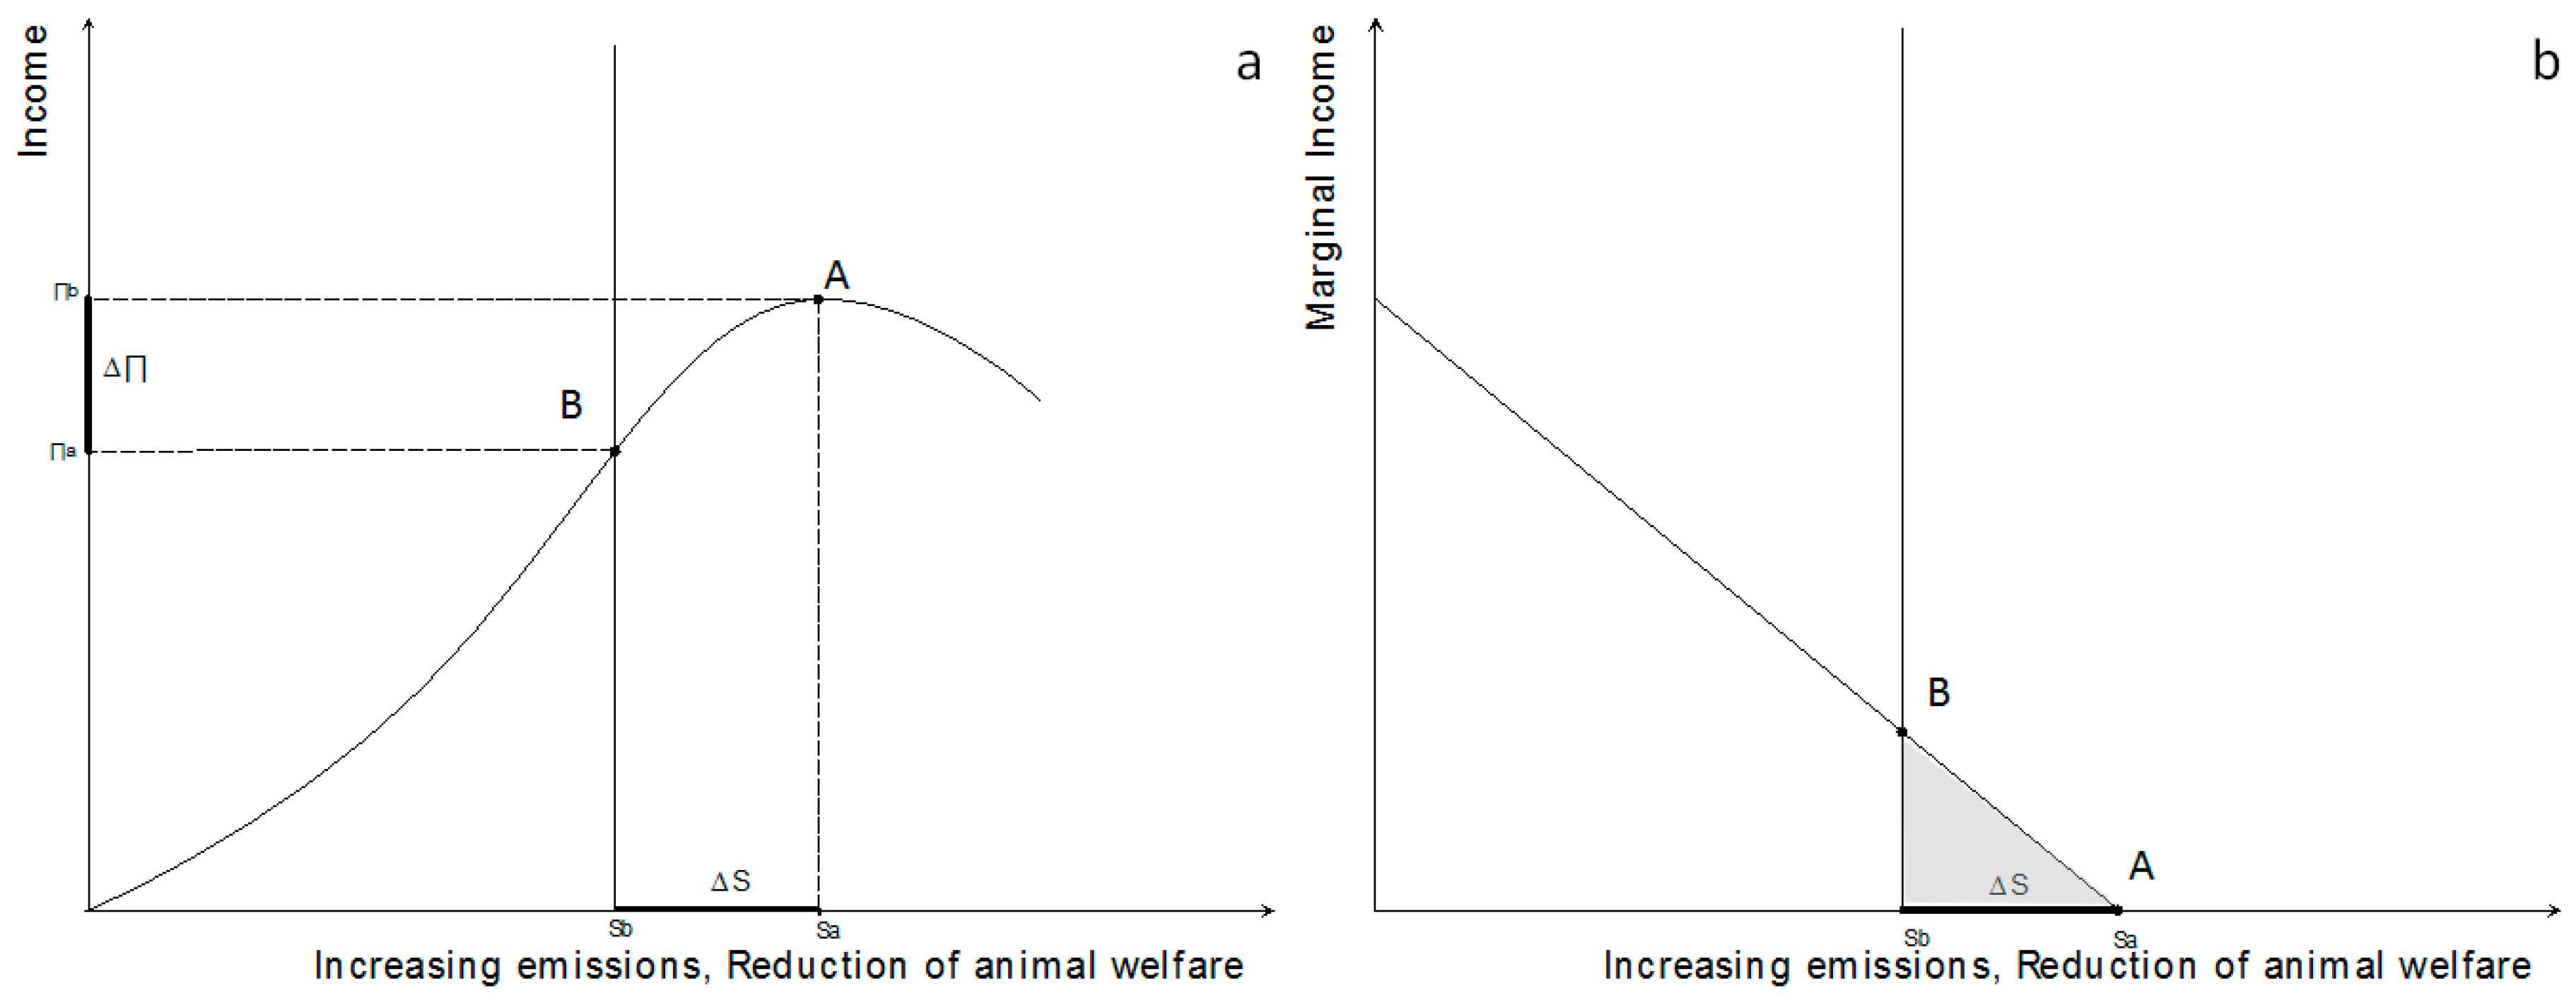
Figure 3a shows the theoretical trend of the possible relationship between profitability, the level of emissions, and animal welfare. In alignment with the literature cited above, profitability tends to increase with increasing emissions per head of cattle raised, and with the reduction of animal welfare until point A, above which the profitability trend reverses. The figure shows the production frontier that associates the highest obtainable added value with the impact value, i.e., the level of animal welfare or emissions per head of cattle raised.
Moving from point A to point B causes a reduction in farm profitability, ΔΠ, in favor of an improved state in animal welfare on a given farm, or a reduction in emissions, ΔS. The vertical line shown in the figure could represent the limit of the level of sustainability imposed by a public decision-maker or by a certification body.
Figure 3b highlights the marginal profitability trend for additional units of animal welfare and energy consumption. The area of the shaded portion in
Figure 3b is equivalent to ΔΠ in
Figure 3a.
To guide farmers’ investment decisions through more sustainable farming practices, local farming associations and policy makers must provide adequate incentives to compensate for the economic loss incurred by implementing the adaptation process.
In analytical terms, the cost of adapting a farm is obtained by taking the difference between the current income, π, and the highest income achievable for a given limit of sustainability, πa *: Δπ = π − πa *, where π ≥ πa *.
| (a) Current income | (b) Income with sustainability limits |
| max π = f(xn) | max πa* = f(xn) |
| s.t. | s.t. |
| ri,j(xn) = ai,j∀ i ∈ I, j ∈ J | ri,j(xn) ≥ ai,j∀ i ∈ I, j ∈ J |
Both functions are subject to a constraint where the level of sustainability of each attribute of a given aspect of sustainability must be greater than or equal to a defined threshold. In (a) the threshold corresponds to the current levels of sustainability, ai,j, in (b) the threshold corresponds to the upper levels of sustainability, ai,j with ai,j ≥ ai,j. In both cases, the problem of optimization identifies the best combination of actions necessary to maximize the profit for a fixed level of sustainability.
The optimization problem described above is the basic reference for assessing the effects of different policy strategies on farm choices, including taxation on animal welfare and emissions, imposition of legal limits for animal welfare and emissions, subsidies or compensation payments for those who adhere to certain good practice criteria with respect to animal welfare and emissions, and premium prices for anyone who meets certain good practice criteria with respect to animal welfare and emissions targets.
2.1. Case Studies
The study analyzed eight cattle farms in the Umbria region of Italy. Five farms specialized in raising Friesian dairy cattle and three farms specialized in raising Chianina beef were selected based on the following criteria: (1) representativeness of the farms in terms of physical size (number of animals raised and acreage used) and revenue, line of production (milk or meat), and rearing method (conventional or organic); and (2) the existence of an accounting and management system to provide reliable data at the primary level.
Table 2 shows the main structural features that give a general overview of the case studies and provides reasons for their selection.
The process of data collection, carried out in 2014, took place in two ways: consultation of management software and access to the various farm accounting records, and direct interviews and compilation of a questionnaire divided into three sections aimed at acquiring data concerning the three disaggregated dimensions considered (environmental, economic, and animal welfare).
The collection and subsequent processing of the basic data and the technical farm information, useful for implementing the model described above, were based on official international protocols, in order to ensure many possibilities for comparison. National protocols [
67] and international protocols [
16] were used to assess animal welfare, while the Guidelines for National Greenhouse Gas Inventories Intergovernmental Panel on Climate Change [
70] were adopted to assess environmental impacts. Finally, technical and economic data collection was performed using the questionnaire adopted by the European Farm Accountancy Data Network (FADN) (
http://ec.europa.eu/agriculture/rica/).
Primary data were collected directly from farmers through face-to-face interviews, mainly used to calculate economic performance, and auditing, mainly used to evaluate performance in terms of animal welfare and gas emissions, at three levels of detail, namely: farm, production (milk, meat, and plant products), and individual operation levels. In addition, secondary and tertiary data for the environmental dimension were obtained from international databases [
70].
2.2. Identification and Assessment of the Improvement Measures
Table 3 shows a description of the procedure used to calculate the adaptation costs needed to improve the environmental (emissions) and social (animal welfare) sustainability levels of the farms. This procedure is not unique and might vary considerably as farming conditions change.
In the field phase, emissions are the critical aspect of sustainability. In particular, soil preparation is considered to be the most important practice in terms of energy. The practice of minimum tillage and no tillage can cause reductions in yield to the point of being unfavorable to their adoption. The risk of causing reductions in yield compared to conventional tillage increases if this practice is used with heavy soils and with monoculture. In any case, the literature reports reduced yields with respect to conventional tillage practices, with 5% less for minimum tillage and 10% less for no tillage [
71,
72].
The practice of minimum tillage or seeding with no tillage is commonly suggested after a leguminous crop, with a slight anticipation of the sowing period compared to conventional soil preparation. Minimum tillage and/or no tillage may also have a positive economic impact. In the present study, according to the relevant literature, the economic impact is obtained by calculating the differences between the costs faced by the farmer for soil preparation and the cost savings that the farmer is supposed to have by applying minimum tillage and no tillage practices, a positive impact, plus the expected loss in revenue caused by any differences in the yield, which is a negative impact.
The conversion of arable land into pasture has negative effects on farm income but positive effects on both emissions and animal welfare. The economic impact is then calculated based on the difference between the income generated by the farm cultivating marketed crops and the income generated by the farm directly cultivating the fodder needed to feed the animals.
In the barn phase, animal welfare plays a predominant role. The planned actions are all improvement measures with respect to this aspect of sustainability and do not necessarily affect the other aspects.
Changing the diet of the animals is the action that could have the greatest economic consequences. In particular, animal welfare increases as the proportion of concentrates in the animal diet decreases. Such changes could cause a decrease in production performance and a variation in feed costs. The change in feed cost is calculated by considering the reduction in the cost faced by the farmer purchasing concentrates and the increase in the costs faced by the farmer in producing forage, plus the variation of the opportunity costs caused by any land use variation from marketed crops to forage crops. This generally also has appreciable effects in terms of energy. The ratio between concentrates and forage could affect the livestock production performance, but in turn, it is linked to an increased incidence of certain diseases that have the opposite effect. For this reason, it is not possible to establish a direct relationship between the composition of the animal’s diet and production performance.
Increasing the size of the habitable area for the animals, or reducing the farming intensification, is another critical factor. This factor is related to the physical condition of the animals, which is difficult to quantify and not always noticeable. The cost of improvement actions to satisfy animal welfare requirements in terms of living space is estimated considering the possible increase in capital costs per LU.
Another aspect considered in the present study, and related to animal welfare, is the cleaning of the barns in terms of cleaning frequency and the quantity of bedding used. The bedding used reaches a maximum of 2.5 kg/day/head depending on the characteristics of the shelter area [
64]. The cost estimates for improving bedding management is impacted by the frequency of intervention and the quantity of straw used per raised head. The economic impact is then obtained by the differences between the actual costs faced by the farmer and the expected costs for ideal bedding management.
Finally, weighting is the last issue that affects the level of sustainability of the farming systems analyzed in the present study. Weighting is the subjective component of the assessment criterion developed in
Section 2, and affects both the relevance associated with different attributes of each aspect of sustainability and the relevance associated with each aspect of sustainability. Weighting is relevant because it affects the level of sustainability attained by the farming system and drives the actions needed to improve it. This assessment component makes it possible to adapt the designed assessment instruments to answer different needs. For instance, it is plausible that different stakeholders, including farmers, producers’ associations and unions, policy makers, etc., attach different weight to each of the aspects of sustainability analyzed in the present paper. In this study, as observant neutral actors, we assumed the same weight for animal welfare, income, and emissions.
3. Results
In the following, we first analyze the summary indicators that briefly describe the level of sustainability achieved in each case study according to the above-described aggregation criteria. Then, we analyze the effects of any economic, environmental, and/or social changes in the production system. Finally, we discuss the effects of possible policy actions that favor or hinder the adoption of sustainable practices by the type of livestock farms described with the present study.
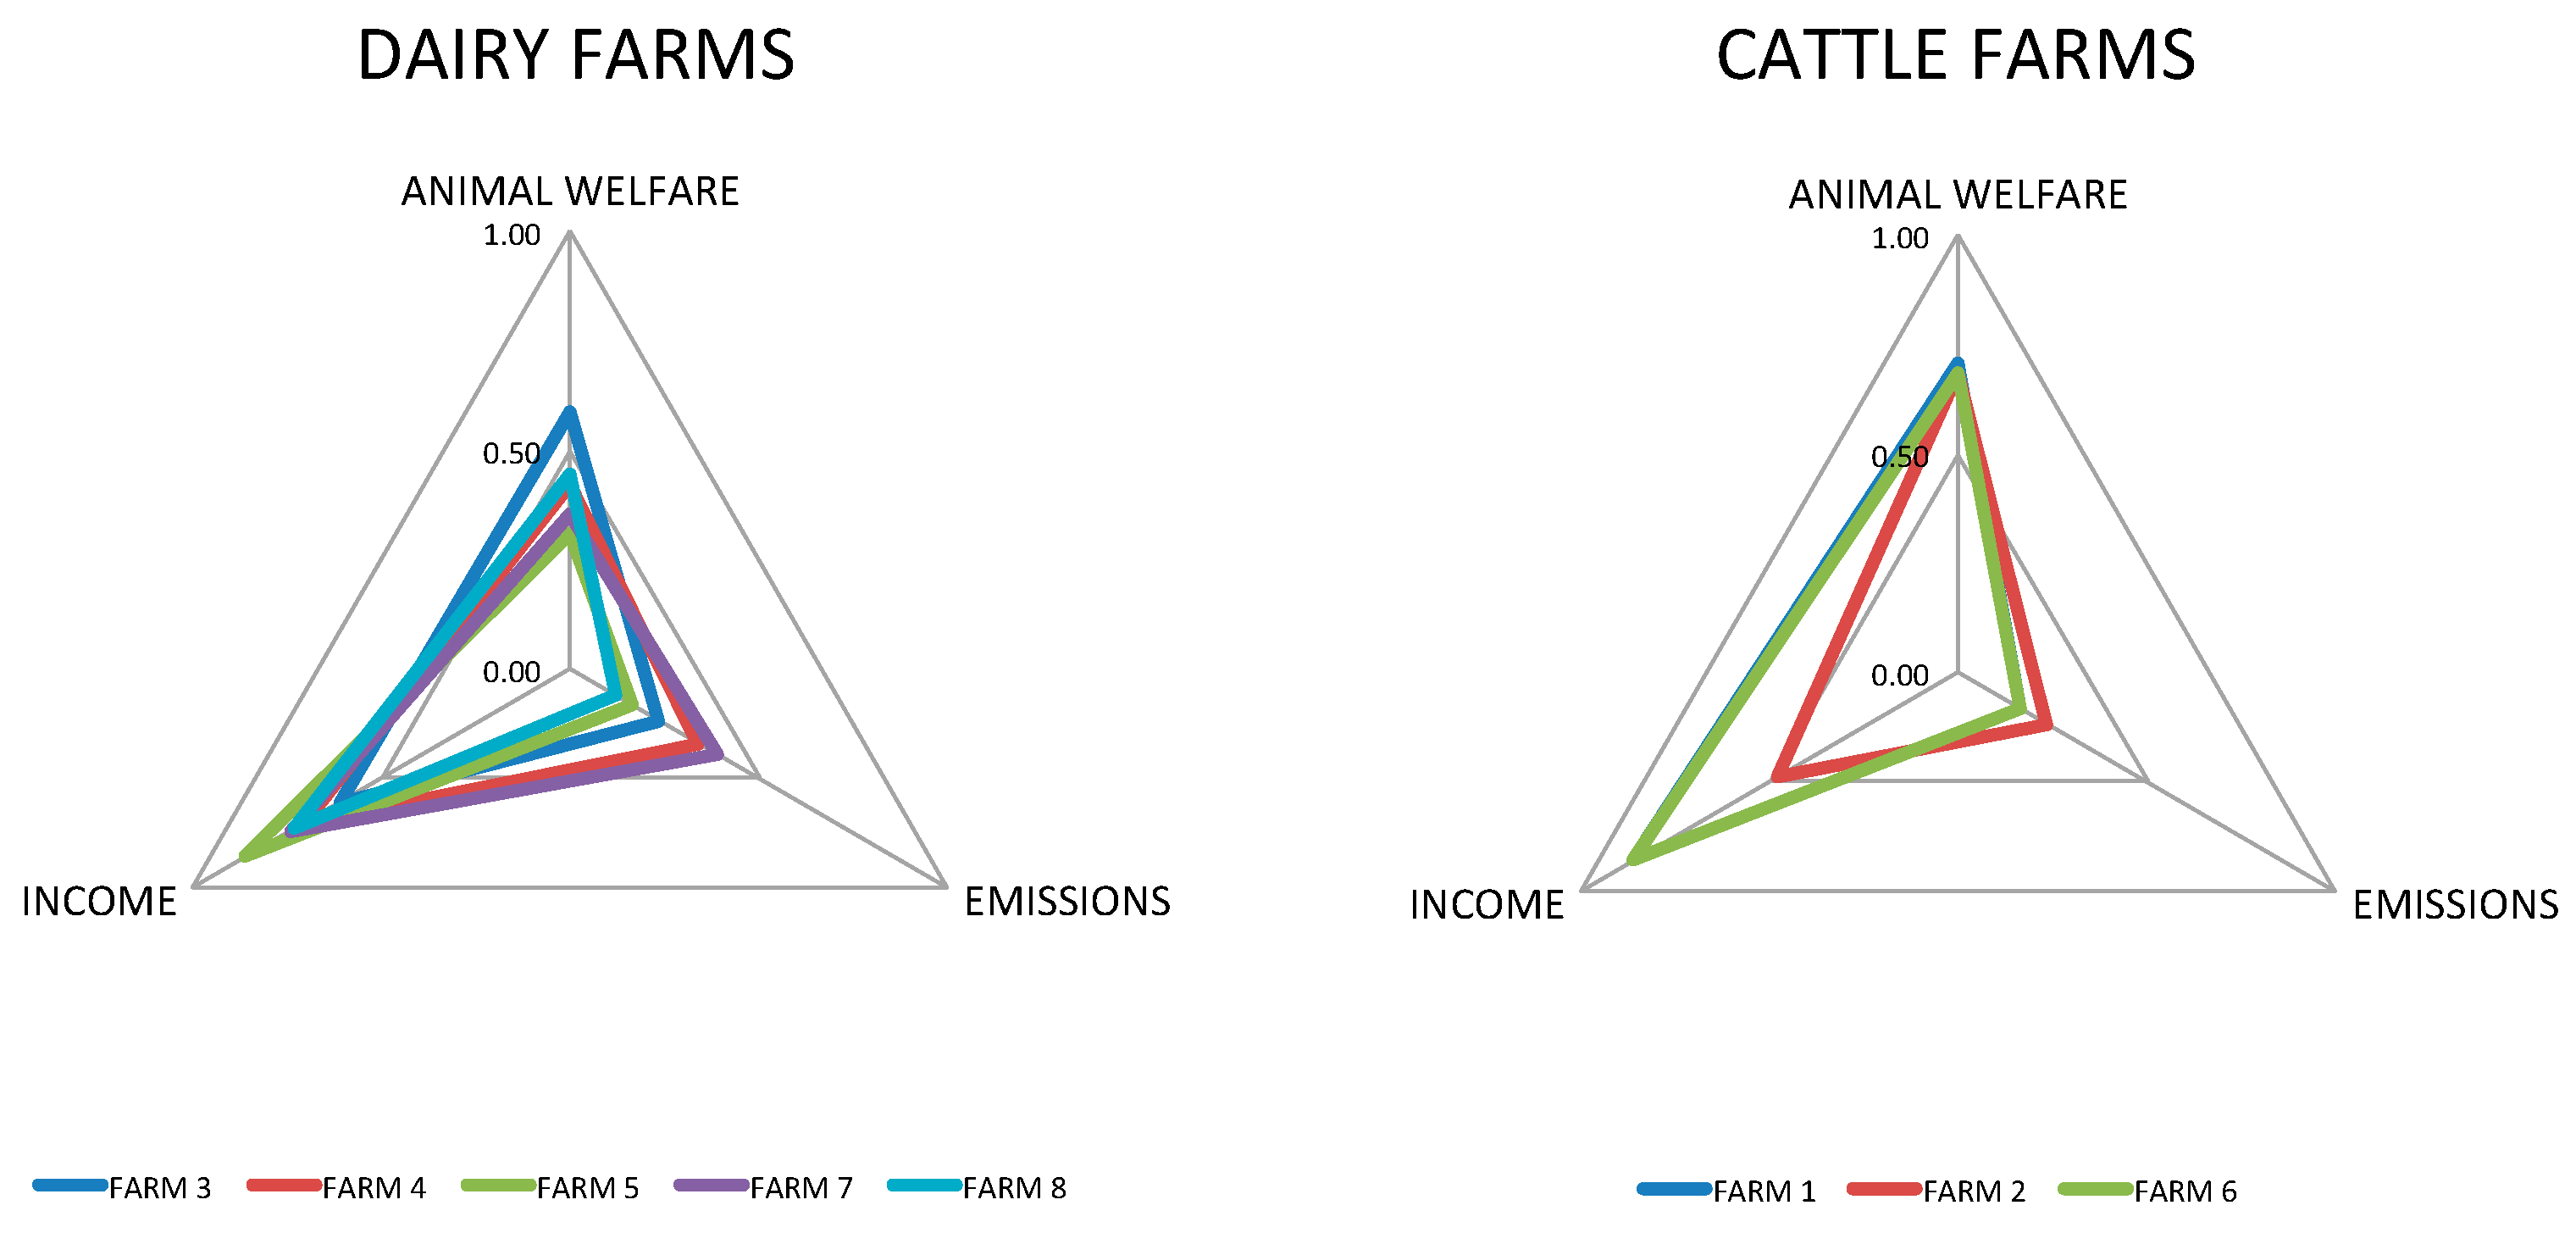
Table 4 and
Figure 4 show the actual and reference values calculated to assess the three aspects of sustainability characterizing the different farming systems analyzed in the present study.
The indicators range from 0, not sustainable, to 1, fully sustainable. Regarding the dairy farms, the indicator for the aggregated sustainability shows intermediate values for all the farms with the exception of case three, for which the values are above average. This is predominantly due to the high levels of economic sustainability (high gross margins per unit of product) and the high levels of environmental sustainability (low emission levels), while low values were recorded for animal welfare, which adversely affect the total value of the aggregated sustainability. However, overall there is a negative relationship between environmental sustainability and animal welfare, and between animal welfare and income.
Table 5 shows the effects of a change in the rearing status on income, emissions, and animal welfare. The meaning of the term “change” refers to a variation in the practices used and/or changes in the rearing conditions.
In particular, for the field phase we examined the effects of introducing minimum tillage and no tillage as alternatives to pre-existing techniques for soil preparation. According to the literature, the introduction of such practices may lead to a 5–10% reduction in yields [
50], with possible negative impacts on farm income. In the case studies, farm five is already practicing the above-described practices and therefore shows no variation in the levels of emissions and production costs with respect to actual levels (
Figure 4).
Farm two had an increase in production costs, apart from yield increase, without noticeable changes in emissions. In the other cases, the production costs tended to decrease with appreciable reductions in emissions. Therefore, the aforementioned soil preparation practices can be both economically and environmentally beneficial in some cases and less in others, depending on the type of crops planted, the relative market value, and the cultivation practices used.
For the barn phase, a change of available space per rearing head was considered, as well as changing the dietary intake and the level of cleanliness in the barn. In the first case, we evaluated the effects related to a 1-m2 increase in available space per LU. As expected, animal welfare improves considerably, while the production costs and level of emissions per head increase significantly.
Among the various actions analyzed, this action had a greater impact on animal welfare, while with respect to production costs per unit of product, widely different values were obtained depending on the type of barn and on the state of the infrastructure in each individual case.
For dietary intake, we considered a 5% increase in fiber in the feed. Contrary to what was expected, the change in the ratio between fiber and concentrates did not cause an improvement in emissions, while the effect was noticeably variable in terms of animal welfare and associated costs. In general, such a change in diet causes improvement in animal welfare with a slight increase in costs. In all the cases, there was no effect on emissions because the increase in energy emitted due to the consumption of an additional unit of feed was offset by the energy saved by consuming one unit less of concentrate, plus the reduction in energy emissions related to enteric fermentation.
Finally, with respect to the level of cleanliness in the barn, there was no appreciable change in the emission profile by increasing the frequency of cleaning. However, there was a slight increase in production costs and an increase in the level of animal welfare.
Table 6 reports for each case study the combined effect of the above-listed measures, respectively, to reduce the emissions of a ton of CO
2-eq. per LU and to increase the level of animal welfare by 10% per LU at the lowest cost. Different measures, sometimes contrasting, are required to reduce emissions or to improve animal welfare conditions (
Table 3). This implies that the combined measures undertaken to improve animal welfare at the lowest cost do not necessarily guarantee reductions in emissions. On the contrary, improvement in animal welfare might cause higher levels of emissions. In general, the cost of emission reduction tends to decrease as the size and degree of intensification of the rearing increases. The cost of increasing the level of animal welfare depends on both actual rearing and animal welfare conditions. In general, the costs of an improvement of one unit of animal welfare condition per rearing head tend to decrease with increasing initial animal welfare conditions.
4. Policy Implications and Perspectives
As stated in the introduction, the evaluation method described in this paper is a useful tool for helping farmers, producer associations, union members, and policy makers to make decisions. In the previous section, we described how the method works to analyze the impact of different actions on farm performance. In the present section, the scope of the assessment methodology is enlarged to include both union members’ and policy makers’ perspectives. These stakeholders, rather than being interested in the performance of single farms, need a general overview of the condition of the sector. Assuming that such an assessment methodology is perfectly enforceable and available, union members and producers’ associations might use it to create best practices guidelines to drive farm decisions and to verify the possibility of implementing a product differentiation strategy, by offering producers the ability to adhere to more restricted standards, if available. On the other hand, policy makers might use the discussed approach to identify a cost-effective policy to support improvements on the part of producers.
In this respect,
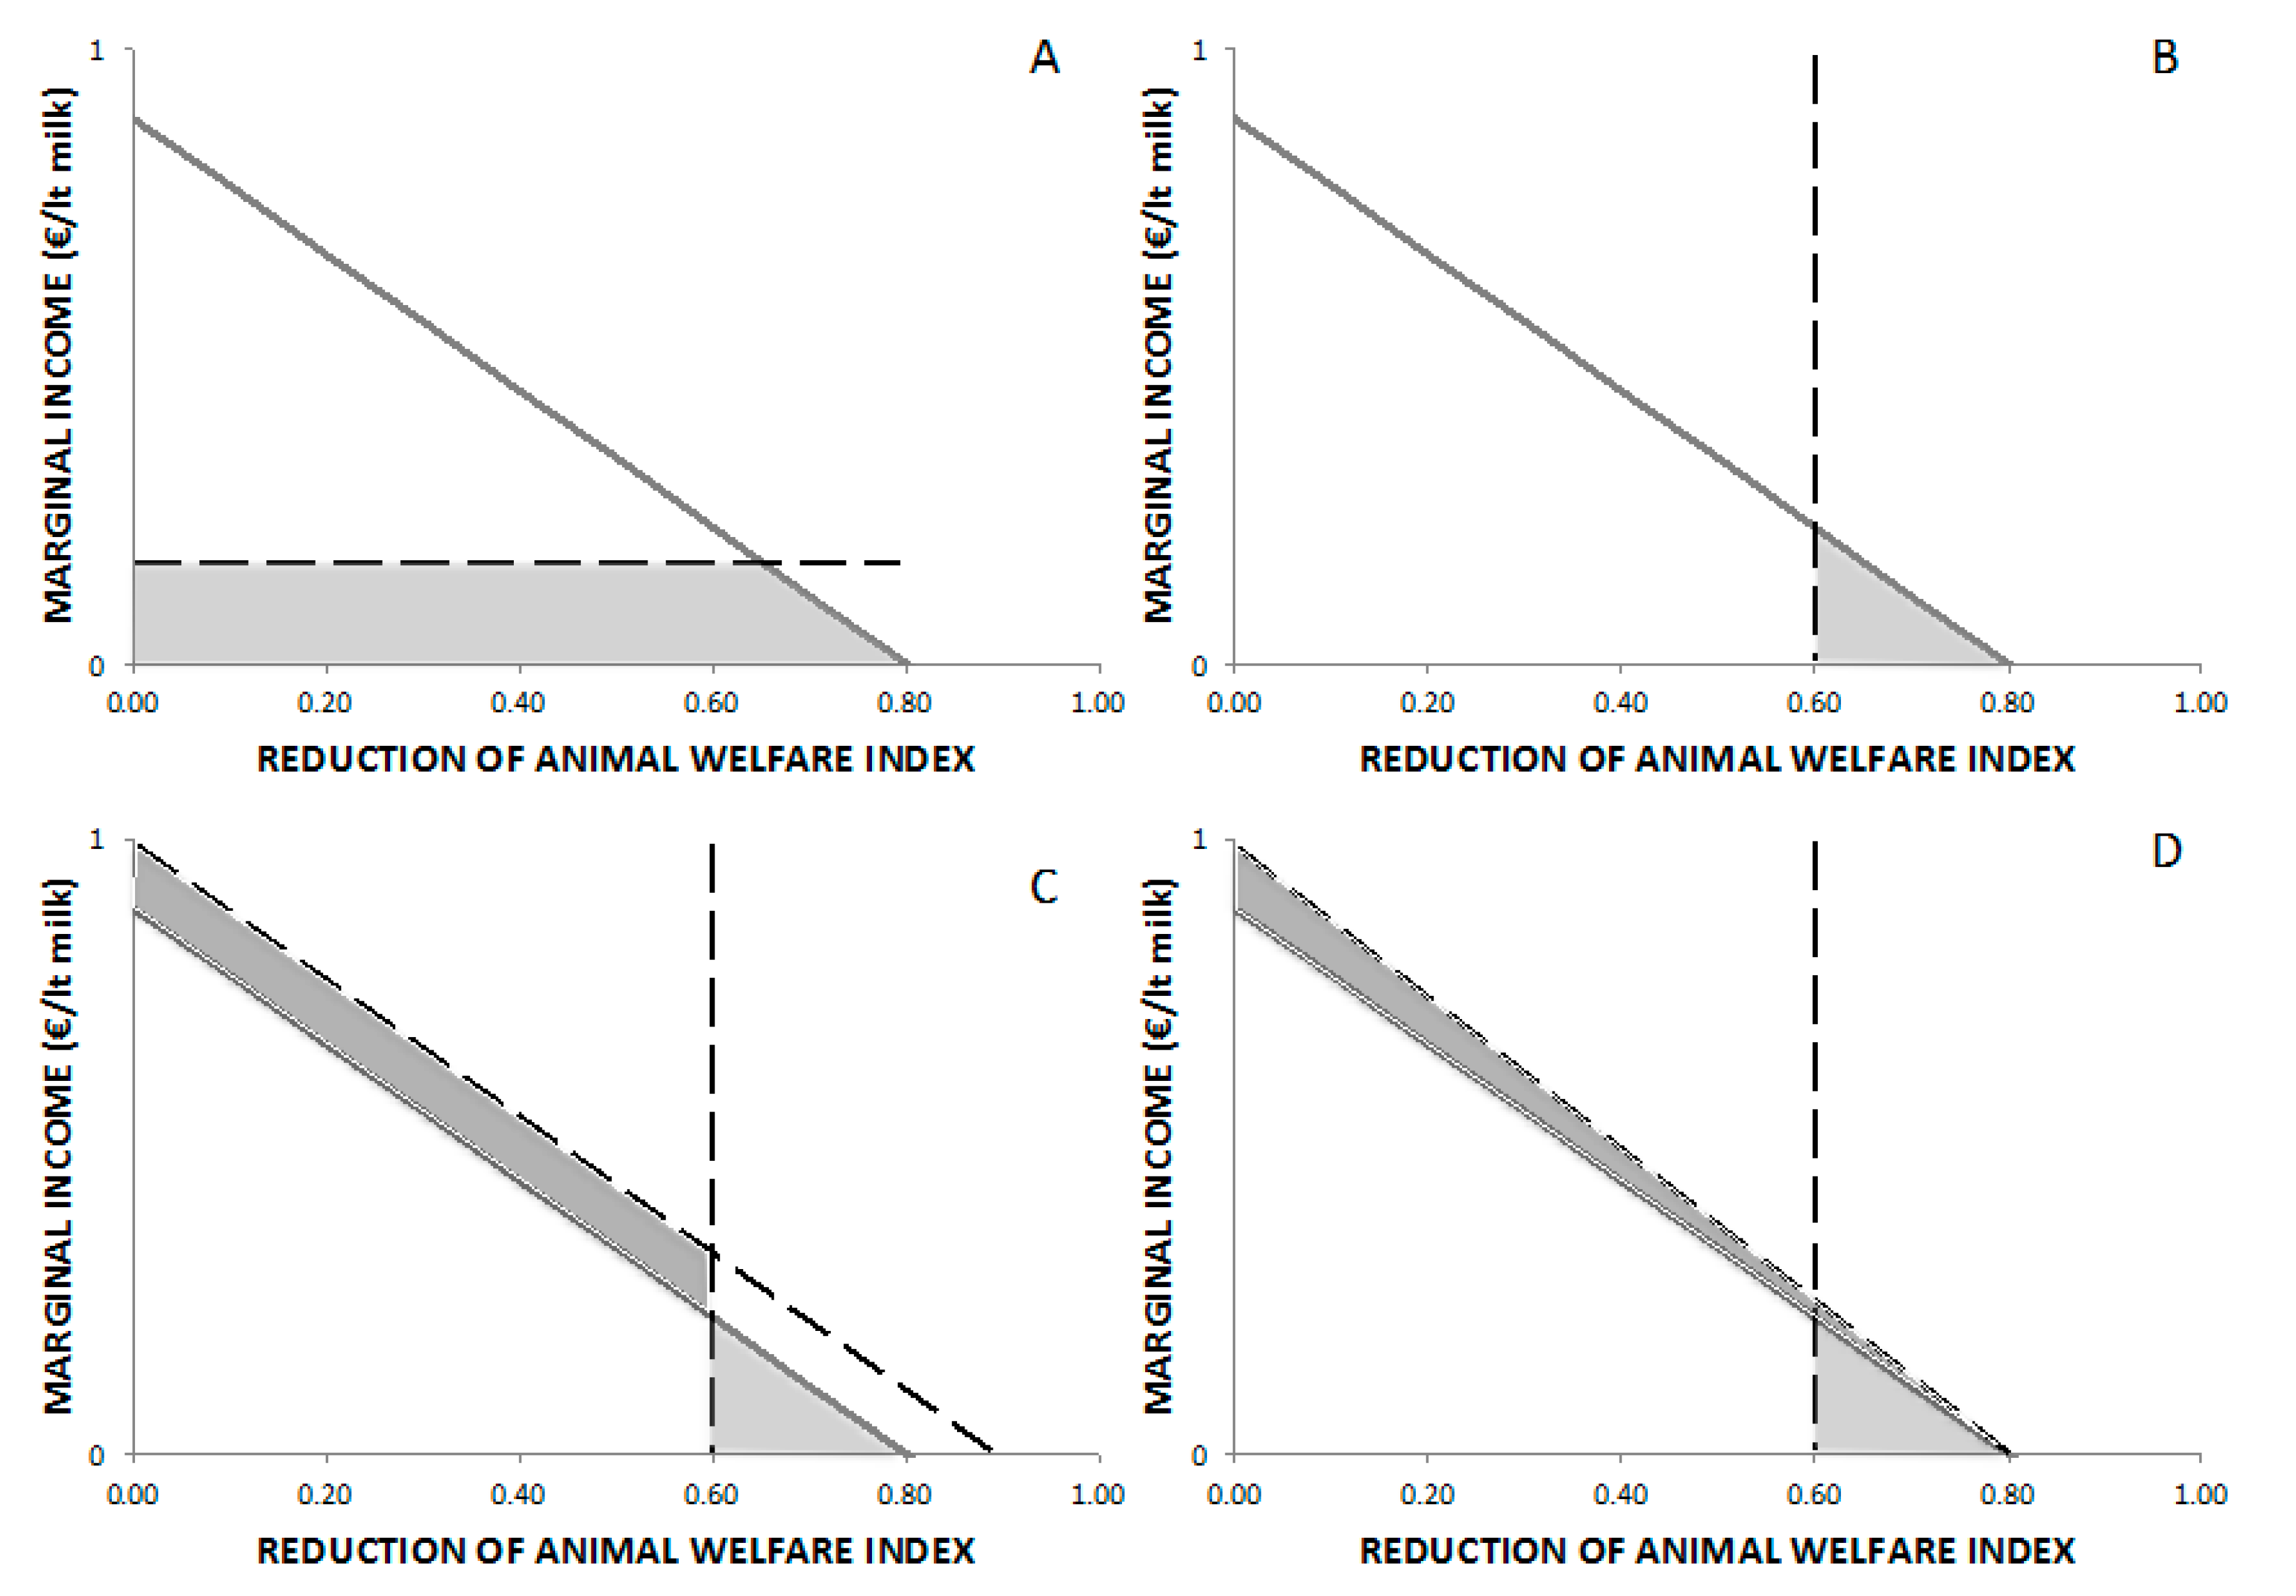
Figure 5 illustrates the effects of various policy instruments and market mechanisms on net income and animal welfare. Farm one is used as the reference case. In particular, the figure shows a sensitivity analysis reporting the impacts of animal welfare improvements on farm income caused by: (1) a tax inversely proportional to animal welfare, (2) a legal or disciplinary limit, (3) a premium price that rewards those who adopt production practices capable of guaranteeing defined animal welfare standards, and (4) a subsidy for farmers who adopt defined production regulations.
For all the graphs in
Figure 5, the gray curve with a negative slope is the trend of marginal income with the increase in consumption of animal welfare. The same consideration can be made for emission production.
Figure 5A is considered the ideal application of a tax proportional to the consumption of animal welfare, represented by the horizontal dotted line. It is assumed that the tax is reduced following the activation of improvement actions by the farm and that the extent of this reduction is proportional to the increase in animal welfare generated by a given action. The height of the horizontal line is the value of the tax per unit of animal welfare consumed. The gray area is the loss of income. The distance between the projection of the intersection point, between the curves on the horizontal axis and the point of intersection between the axis of the abscissas of the demand curve, is the increase in the level of animal welfare, following the application of the tax, or the improvement in the animal welfare conditions that the farm is willing to guarantee in order to avoid paying additional taxes.
Figure 5B presents the imposition of a legal/disciplinary limit, shown by the vertical dotted line. The gray area is the loss of income. The distance between the point of intersection between the vertical line and the x-axis, and the demand curve and the x-axis, is the improvement in the level of animal welfare imposed by the legal limit.
Figure 5C presents the combined effect of a legal/disciplinary limit for animal welfare, the vertical dashed line, and the contribution for those who respect these limits, shown by the oblique dashed line. The dark gray area is the increase in income generated by the contribution, and the light gray area is the loss of income generated by the limit imposed on animal welfare. The distance between the intersection point of the vertical line with the x-axis, and the demand curve with the x-axis, is the improvement in the level of animal welfare brought about by the imposition of the legal limit.
Figure 5D presents the combined effect of a legal/disciplinary limit for animal welfare and a premium on the related price with respect to this limit. The dark gray area is the increase in income caused by the price premium, and the light gray area is the loss of income caused by the restriction.
In general, the simplest and least costly action for public authorities is the application of a “green” tax in an effort to discourage certain production practices [
73]. However, this is socially unacceptable because the costs are borne totally by the producers. In addition, these are not always effective, because farms prefer to pay rather than adapt. The opposite is true for the imposition of limits on sustainability. This action is expensive for public authorities, but effective because the farms are forced to adapt. Providing subsidies to those who adopt sustainable practices is generally considered burdensome for public authorities and is not overly effective, because the under-performing farms do not consider the subsidies sufficient to cover the costs of adaptation [
26]. The ideal is the use of market mechanisms, if available, to compensate for the costs incurred to meet certain good practice specifications with a premium on prices. One effect that cannot be evaluated through the use of this model is the application of a tax on consumption. It is an effective tool but is considered socially unacceptable because there is a risk of harming the poorer segments of the population [
74].
Most of the instruments analyzed in the present section are already part of the common European Energy and Animal Welfare Strategies. Indeed, the European states began to implement common measures for the reduction in emissions and for the safeguard of animal welfare when the commitment was globally made by the states in the Kyoto Protocol (1997) and with the publication of the Brambell report [
11]. The climate–energy package of the European 2020 strategy and the Last European New Strategy for animal welfare (2007–2013) brought about the inclusion of new measures in the last CAP reform (2014–2020) to limit the production of emissions in agriculture and to improve animal welfare conditions. These measures mainly include subsidies for conservative agriculture (minimum and no tillage practices) to reduce emissions and the imposition of minimum condition requirements for animal welfare.
However, the lack of enforcement of EU legislation by the member states is still common in a number of areas, distorting competition among EU agricultural regions, especially where there are differences in condition requirements.
Because of the food safety crisis of the mid-1990s due to public intervention, some retailers, such as Carrefour in France and Sainsbury and Marks and Spencer in the UK, started to apply a product differentiation strategy by introducing voluntary certification systems with restricted animal welfare and environmental requirements. However, because consumers generally lack the appropriate information and are poorly informed on animal welfare and environmental aspects—especially in terms of the methods of production and their impact on the welfare of animals and the environment—consumer decisions are ultimately driven mainly by price and directly verifiable characteristics of food products.
To face such issues, there is a need to simplify and develop clear principles for animal welfare and an information campaign on both animal welfare and greenhouse gas emissions in agriculture, as the market itself is not capable of optimally absorbing changes in commodity prices, causing losses in income and welfare. This claim is particularly urgent in view of the post-2020 CAP reform, which aims to interfere less with the agricultural markets due to the consequence of increasing farmers’ dependency on market signals.
5. Discussion and Conclusions
The search for a conceptual model to evaluate the aggregate sustainability of livestock farms, and to estimate the costs necessary to improve the current level of sustainability, is supported by the need to guide local and European agriculture toward production systems that are environmentally friendly and socially acceptable. The multi-attribute assessment procedure developed in the present paper attempted to investigate controversial aspects of sustainability, such as emissions and animal welfare, with the aim of driving decision-makers toward the selection of appropriate instruments to enhance sustainability.
Specifically, the discussed assessment procedure allows the current state of economic performance, the level of animal welfare, and the amount of emissions on livestock farms to be described in detail. Contextually, the proposed model identifies the status of some critical process factors, which partly depend on the score associated with the three elements of sustainability analyzed in this study. Finally, the model estimates the impact associated with any changes in the status of these factors on income, degree of animal welfare, and emissions levels. This procedure allows the estimation of the economic loss incurred by the individual farmer when improving the degree of animal welfare and reducing the level of emissions. In this way, it is possible to satisfy the needs of different stakeholders, by analyzing the effects of farmers’ strategic choices, assessing the feasibility of new process certification systems, and evaluating how policy actions can be effectively implemented. This is possible thanks to the indexing procedure used in the discussed assessment approach. Specifically, the use of weighting creates an adaptive indexing procedure, integrating objective measures with subjective weights, and consequently enabling sustainability scores to change with the priorities addressed by stakeholders. This does not mean that stakeholders can freely choose the importance of each aspect. The assessment approach discussed in this paper was studied to detect anomalies in the end-user perspective. An essential drawback concerns the number of indicators used in the proposed indexing procedure. This procedure might provide too simple a message, especially when used to illustrate complex and sometimes elusive issues in a wide-ranging field, as we did in our study. As a consequence, there is the potential risk of obtaining misleading messages if the indexing procedure is poorly constructed. To overcome this drawback, in this study we built a hierarchical model and used an aggregation procedure based on the geometric mean to improve the reporting of anomalies from different sustainability perspectives. In any case, the involvement of an expert advisory service would help identify key parameters that should be monitored to limit complexity and improve the reporting of anomalies.
Some critical issues must also be addressed in the empirical cases analyzed in this study, including the changes proposed to improve the level of animal welfare and reduce the emissions, as well as to estimate the costs associated with these changes. Two critical factors regarding the proposed changes, ventilation of the barns and manure management, were not taken into account due to the lack of available information. With respect to the costs associated with the proposed changes, certain assumptions were made that must be proven empirically. In particular, the proposed alternatives for soil preparation compared to current practices are based on data from the literature, and do not take into account the effects of soil type and weather conditions on production.
While it is recognized that there is an effect of livestock diet on production performance when there is a change in the ratio between concentrates and forage, there is no information in the literature that reports a correlation between these factors. For this reason, in this study it was assumed that the current status of the animal diet is optimal for all the case studies in terms of productive performance, and changes in the diet lead to a progressive reduction in productive performance. These problems can be solved by increasing the number of farms used to test the model and by providing the model itself with endogenous criteria for identifying the thresholds of sustainability and the estimated costs associated with the changes in status. Finally, the proposed model has some limits of applicability that depend on the level of transparency of the supply chains, and on whether it is possible to find information, and the costs incurred, to obtain it. Indeed, the proposed investigation procedure requires completing at least one audit per farm by an experienced advisor. This might be a significant limit threatening the practicability of this assessment approach, unless this approach is used by existing advisory services.
Nevertheless, our results are consistent with those of Oudshoorn et al. [
28]. In fact, their findings show that improving animal welfare conditions entail trade-offs between farm profitability and global environmental issues. Animal welfare-oriented scenarios had a significantly lower net income than business and environmental scenarios, with an increase in GHG emissions and energy use. This is particularly evident when assessing the cost effectiveness of the adoption of improved measures on feed and cleaning management [
32]. Since consumers will not pay a premium price for this, farmers will not easily change their practices, despite these changes improving environmental sustainability [
41].
On the contrary, results from Bruijnis et al. [
32] showed that, even with a wide range of costs for implementing these measures, those measures improving dairy cow foot health were found to be cost effective. This shows that improvement in animal welfare is not necessarily correlated with a reduction in economic performance.
Finally, the present study integrates different production phases, not necessarily implemented by single farms. A further improvement of the presented assessment approach might be to extend the analysis to more complex farming systems involving farmers’ networks and value chains, suggesting solutions to carry out mutually supportive objectives that take into account the interrelation between people, resources, environment, and development.

 ,
, 


