Modeling the Impact of Short-Term and Long-Term Determinants of European Health Systems’ Performance: A Panel Data Approach


Abstract
:1. Introduction and Background
- How do we stand?
- What is important in the short-run?
- What is important in the long-run?
2. Assessing the Performance of Healthcare Systems from the Patient Point of View
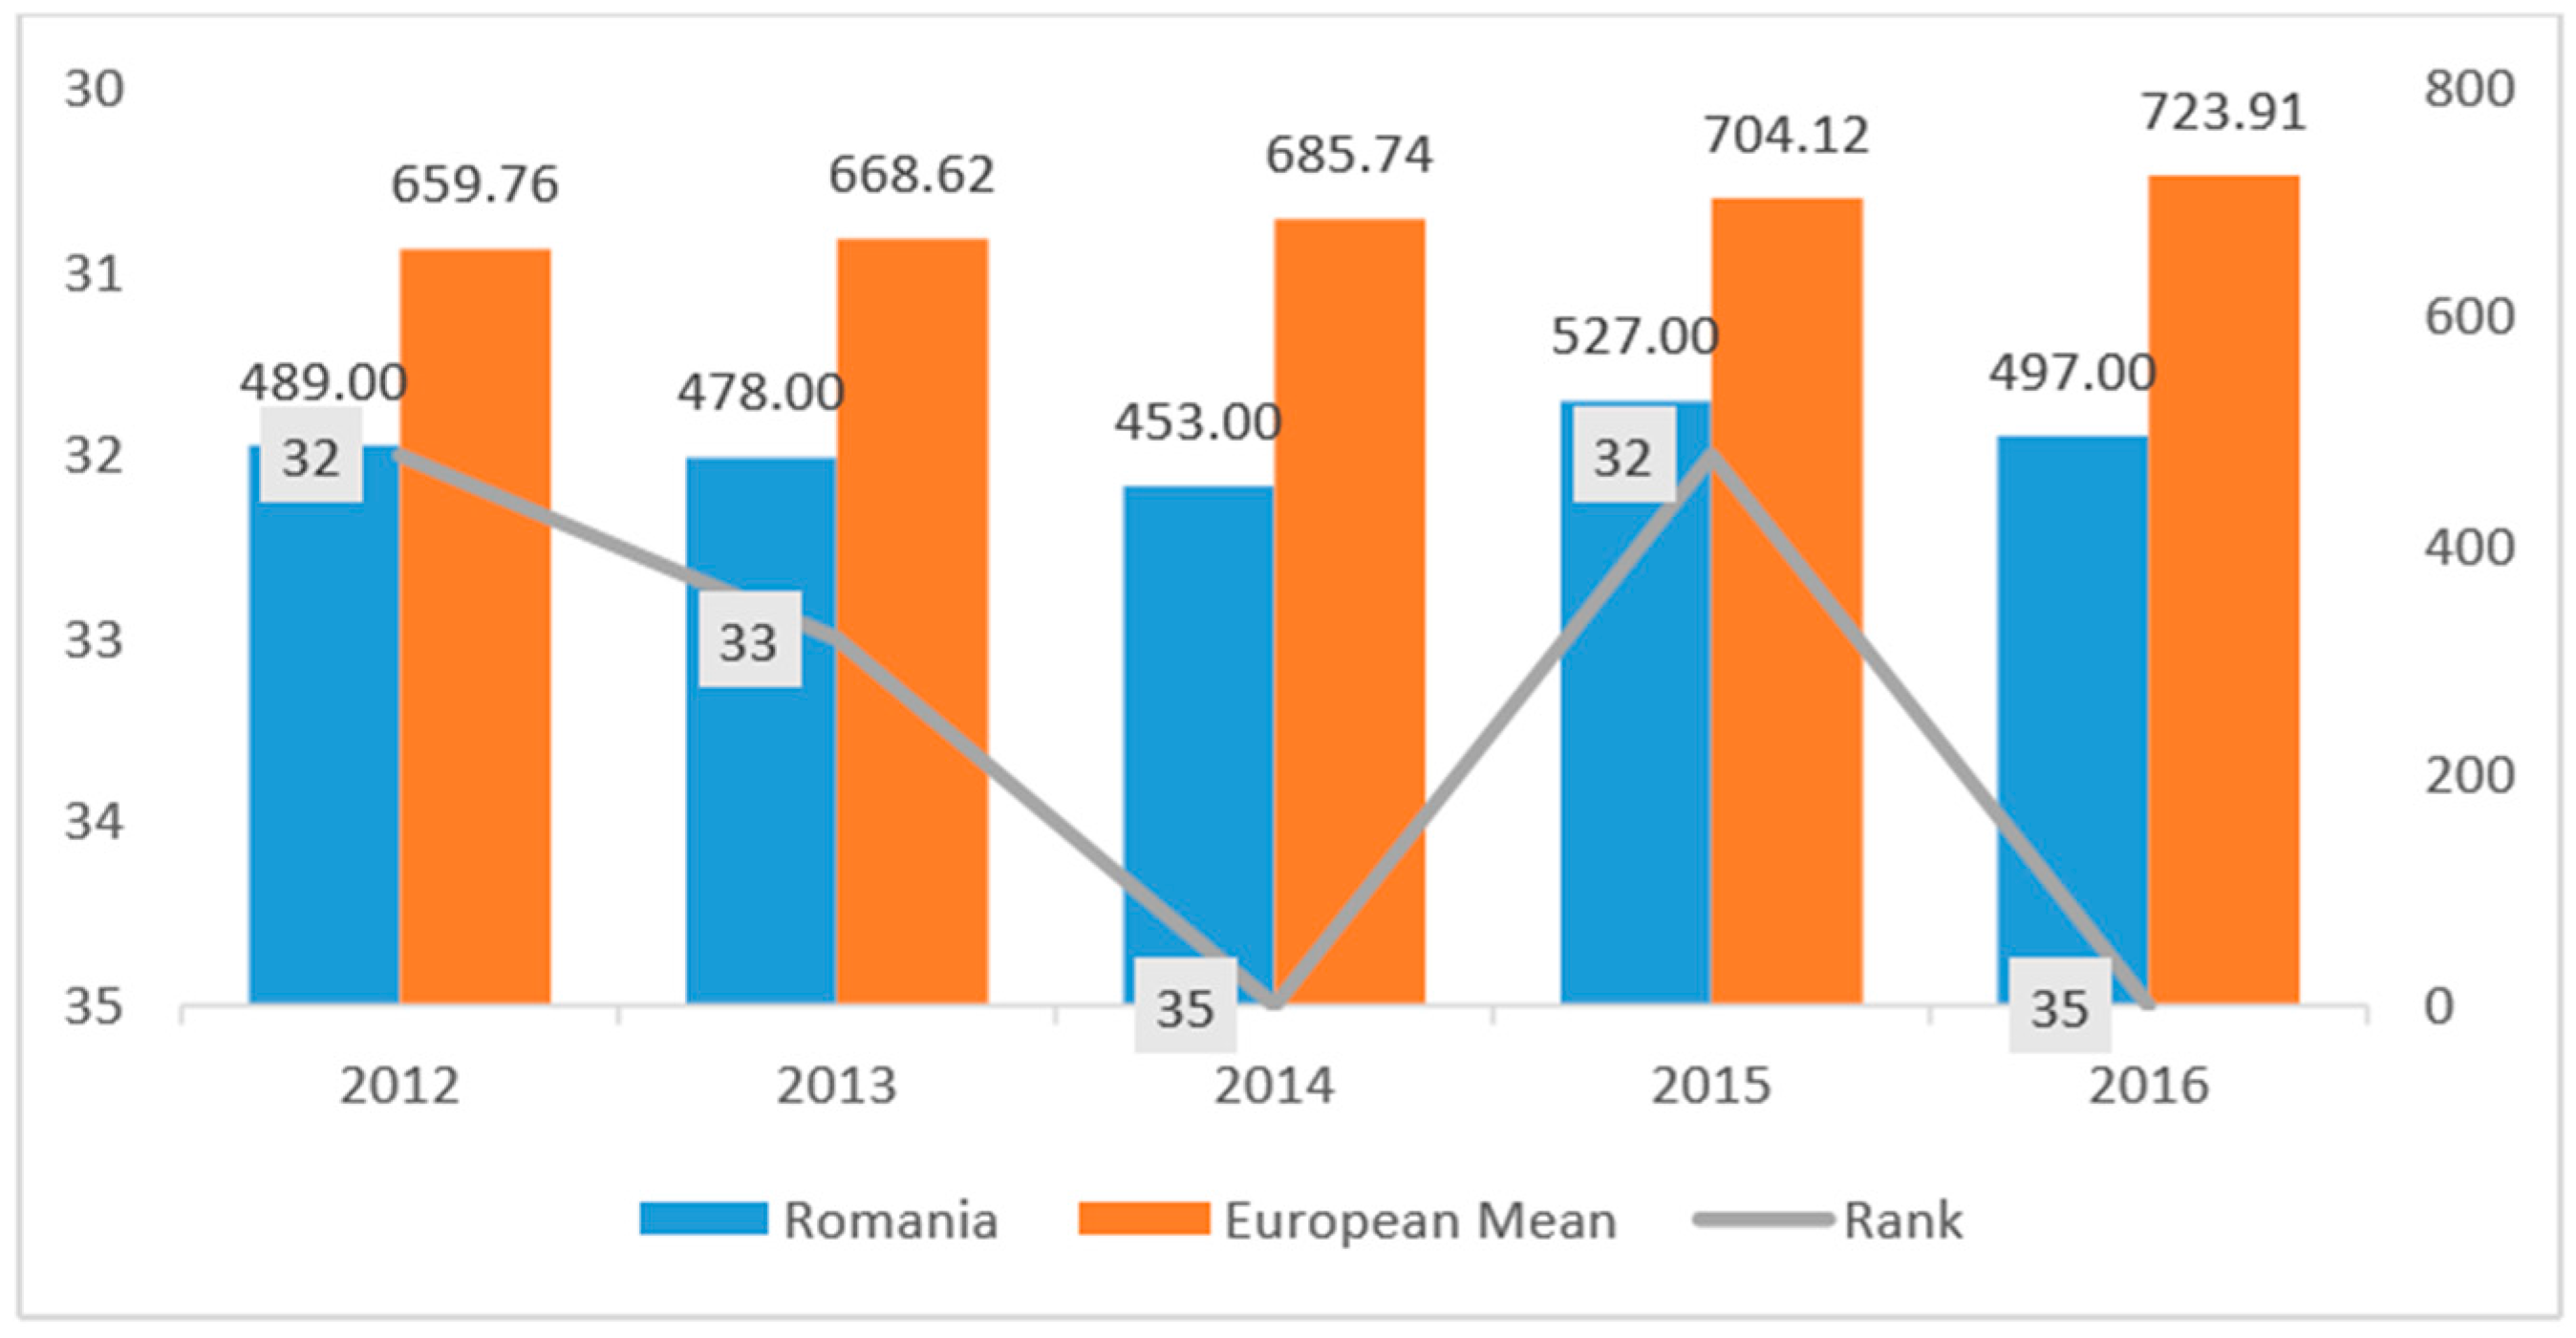
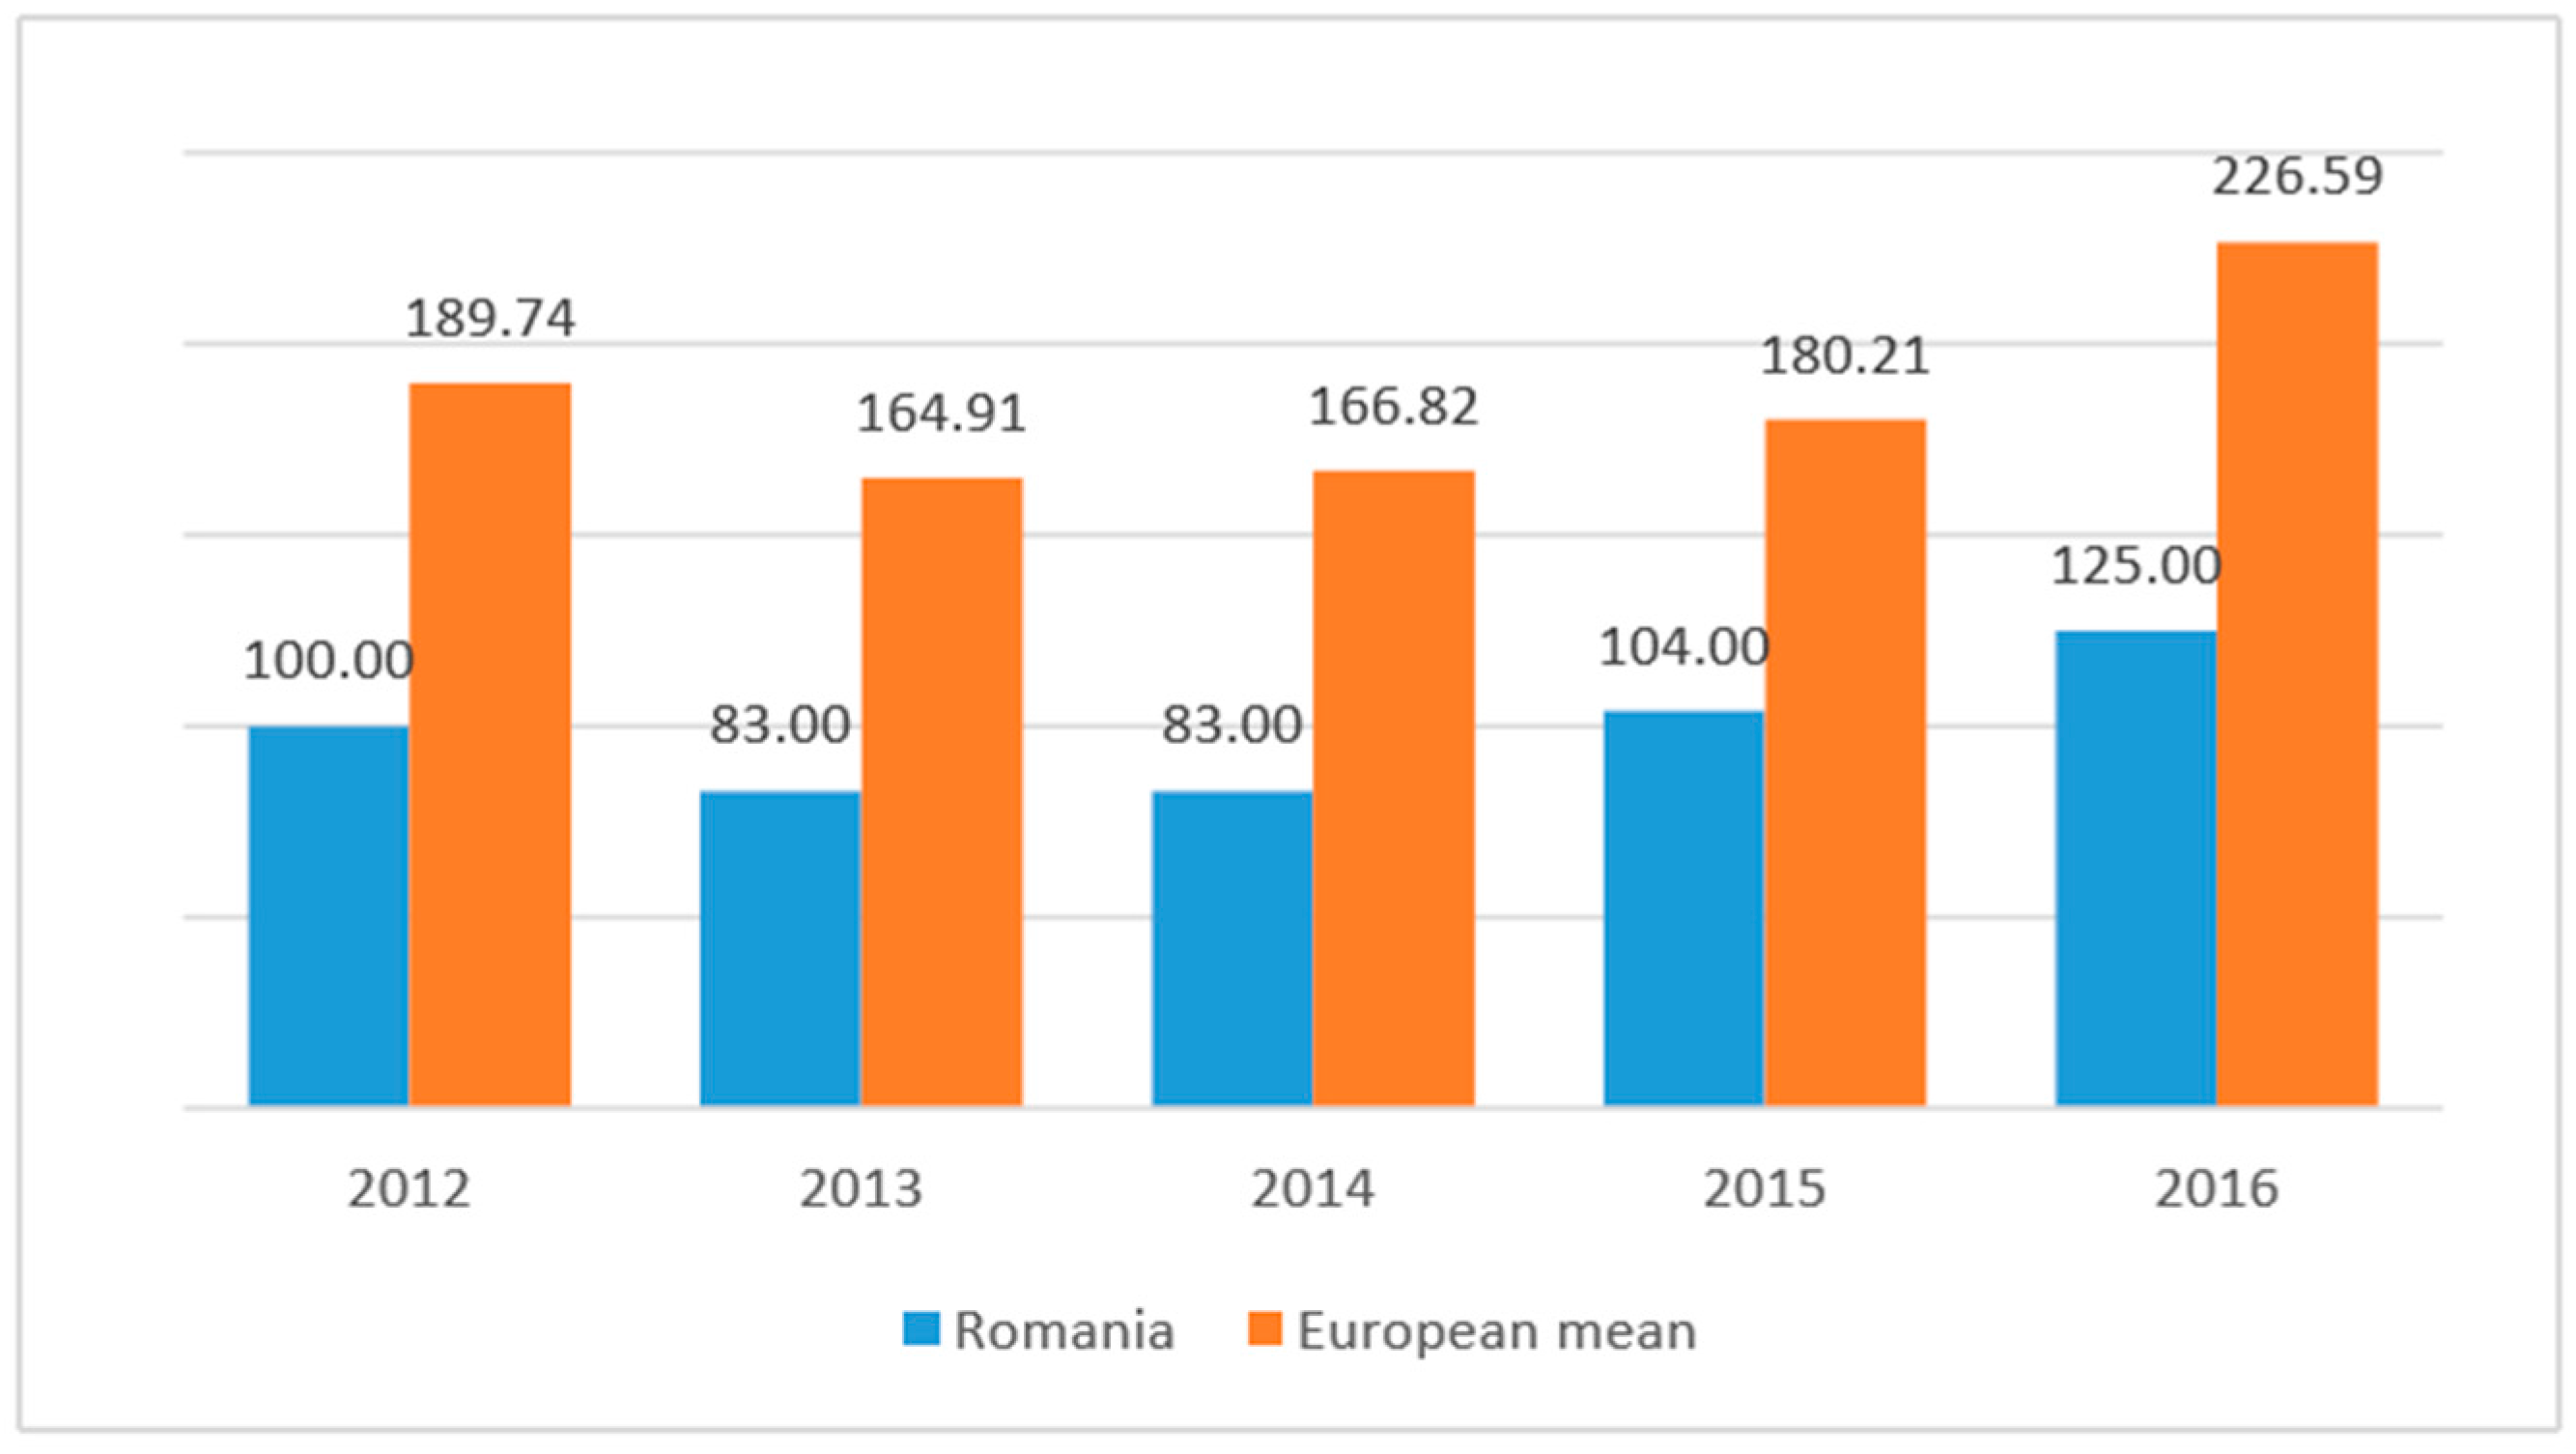
3. How Do We Stand?
4. Data and Methods
- To examine the possible influences of each of the five subscales on the outcomes, we adopted two approaches: the short-run approach and the long-run approach. In the short-run, stepwise regressions were performed for each of the analyzed years.
- To account for the time factor, we had to deal with panel data (both time series and cross-section data) the Pool Object was used [20]. Panel data perform better in detecting and measuring the effects which in pure cross-sectional or time series data could not be observed [21]. This approach allowed us to capture the influences not only in each point of time, but in a time span of five years (2012–2016) [20].
- We were also interested to see if there were any differences among countries/groups of countries with respect to the influence of different determinants on the healthcare system outcomes. Therefore, we first divided the 34 European countries into more homogenous groups by means of Cluster Analysis. Subsequently, for each group of countries, separate panel data regressions were performed, which more accurately captured the specific influences of dependent variables on health outcomes.
5. Results and Discussion
5.1. What Is Important in the Short-Run?
5.2. What Is Important in the Long-Run?
5.3. Are There Any Differences among Countries/Groups of Countries?
6. Discussion and Conclusions
Author Contributions
Conflicts of Interest
References
- European Commission. Investing in Health—Commission Staff Working Document. European Commission, 2013. Available online: https://ec.europa.eu/health/sites/health/files/strategy/docs/swd_investing_in_health.pdf (accessed on 5 April 2017).
- European Commission. Health Care. Available online: http://ec.europa.eu/social/main.jsp?langId=en&catId=754 (accessed on 5 April 2017).
- Murray, C.J.; Frenk, J. A Framework for Assessing the Performance; No. 78; World Health Organization: Geneva, Switzerland, 2000. [Google Scholar]
- Iacobuță, A.O. Patients’ evaluation of access and quality of healthcare in EU countries. A comparative analysis. Procedia 2012, 62, 896–900. [Google Scholar] [CrossRef]
- Calu, D.A.; Ștefănescu, A.; Dobrin, C.; Șerban, R. Empirical research on the public-private partnership into the public hospitals from Romania. Afr. J. Bus. Manag. 2011, 5, 12996–13014. [Google Scholar]
- Kruk, M.E.; Freedman, L.P. Assessing health system performance in developing countries: A review of the literature. Health Policy 2008, 85, 263–276. [Google Scholar] [CrossRef] [PubMed]
- Jankauskiene, D.; Jankauskaite, I. Access and quality of health care system by opinion of patients in ten european countries. Manag. Health 2011, 15, 31–39. [Google Scholar]
- Schoen, C.; Osborn, R.; Huynh, P.T.; Doly, M.; Zapert, W.; Peugh, J.; Davis, K. Taking the pulse of health care systems: Experiences of patients with health problems in six countries. Health Aff. 2005, 10, W5-509–W5-525. [Google Scholar] [CrossRef] [PubMed]
- Björnberg, A. Euro Health Consumer Index 2016 Report. Available online: http://www.healthpowerhouse.com/wp-content/uploads/2017/01/EHCI_2016_report.pdf (accessed on 16 March 2017).
- Euro Health Consumer Powerhouse. Available online: http://www.healthpowerhouse.com/en/about-us/ (accessed on 16 March 2017).
- Gonçalves, F. A cross country explanation of performance of heath care systems The consumer point of view using the Euro Health Consumer Index. Econom. Model. 2011, 28, 196–200. [Google Scholar] [CrossRef]
- Popa, I.; Ștefan, S.C. A cluster analysis of the quality of health services at European level. In Proceedings of the 25th IBIMA Conference on Innovation Vision 2020: From Regional Development Sustainability to Global Economic Growth, Amsterdam, The Netherlands, 7–8 May 2015; pp. 104–116. [Google Scholar]
- United Nations Development Programme. Human Development Report 2014. Available online: http://hdr.undp.org/en/content/table-1-human-development-index-and-its-components (accessed on 5 January 2015).
- World Economic Forum. The Europe 2020 Competitiveness Report. Available online: http://www3.weforum.org/docs/WEF_Europe2020_CompetitivenessReport_2014.pdf (accessed on 25 January 2015).
- Transparency International. Corruption Perceptions Index 2013. Available online: http://www.transparency.org/cpi2013/results (accessed on 5 January 2015).
- Björnberg, A. Euro Health Consumer Index 2012 Report. Available online: http://www.healthpowerhouse.com/files/Report-EHCI-2012.pdf (accessed on 16 March 2017).
- Björnberg, A. Euro Health Consumer Index 2013—Report. Available online: http://www.healthpowerhouse.com/files/ehci-2013/ehci-2013-report.pdf (accessed on 4 January 2015).
- Björnberg, A. Euro Health Consumer Index 2014—Report. Available online: http://www.healthpowerhouse.com/wp-content/uploads/2015/01/EHCI_2014_report.pdf (accessed on 16 March 2017).
- Björnberg, A. Euro Health Consumer Index 2015—Report. Available online: http://www.healthpowerhouse.com/wp-content/uploads/2016/01/EHCI_2015_report.pdf (accessed on 16 March 2017).
- Popa, I.; Cicea, C.; Dobrin, C.; Marinescu, C.; Botez, D. Modeling energy’s contribution to the agriculture field: Evidence for European countries. Econom. Comput. Econom. Cybern. Stud. Res. 2013, 47, 61–74. [Google Scholar]
- Gujarati, D. Econometrics by Example; Palgrave Macmillan: Basingstoke, UK, 2011. [Google Scholar]
- Olaru, O.; Marinescu, C. A regression analysis of the effect of important determinants of wine production. In Proceedings of the 13th International Multidisciplinary Scientific Geoconference SGEM 2013, Sofia, Bulgaria, 16–22 June 2013. [Google Scholar]
- Ștefan, S.C.; Giurgiu, A.; Abrudan, M.M.; Miricescu, D.; Vlăsceanu, C. Why T&C companies need to develop global strategies? Ind. Text. 2016, 67, 428–433. [Google Scholar]


| Independent Variables | Single Year Stepwise Multiple Regressions | ||||
|---|---|---|---|---|---|
| 2012 | 2013 | 2014 | 2015 | 2016 | |
| C (intercept) | - | −52.571 * (−1.99) | - | - | - |
| RRS—Range and reach of services | 1.515 **,a (5.96) b | 0.737 ** (3.60) | - | 0.556 * (2.24) | 0.833 ** (2.85) |
| PRE—Prevention | - | 0.869 * (2.47) | - | - | - |
| PHA—Pharmaceuticals | - | 1.109 ** (3.00) | 2.669 ** (6.92) | 1.532 ** (3.11) | 1.787 ** (3.92) |
| R-squared | 0.526 | 0.778 | 0.599 | 0.652 | 0.705 |
| Adjusted R-squared | 0.512 | 0.756 | 0.587 | 0.629 | 0.686 |
| F-statistic | 35.568 ** | 35.128 ** | 41.864 ** | 29.005 ** | 37.095 ** |
| Independent Variable | Panel Data Regressions | ||||
|---|---|---|---|---|---|
| Cluster I | Cluster 2 | Cluster 3 | Cluster 4 | Combined | |
| C (intercept) | 127.944 **,a (6.030) b | 212.973 ** (3.842) | 336.465 ** (13.859) | 236.098 ** (3.077) | 225.531 ** (9.89) |
| PRI—Patient right and information | - | - | −1.071 ** (−3.405) | - | - |
| ACC—Accessibility/waiting time for treatment | 0.231 ** (2.816) | 0.464 * (2.221) | - | 1.212 ** (3.177) | 0.291 ** (4.996) |
| RRS—Range and reach of services | −1.273 ** (−4.753) | −1.851 ** (−4.510) | −1.030 * (−2.821) | −2.194 ** (−7.463) | −1.657 ** (11.829) |
| PRE—Prevention | 0.890 ** (3.586) | 1.057 ** (4.581) | 1.414 ** (9.684) | - | 0.903 ** (9.771) |
| PHA—Pharmaceuticals | - | - | - | - | - |
| R-squared | 0.753 | 0.696 | 0.916 | 0.744 | 0.927 |
| Adjusted R-squared | 0.677 | 0.587 | 0.886 | 0.668 | 0.908 |
| F-statistic | 9.837 ** | 6.383 ** | 30.640 ** | 9.721 ** | 47.583 ** |
| Variables | Clusters | Combined | Romania | |||
|---|---|---|---|---|---|---|
| 1 | 2 | 3 | 4 | |||
| Cluster Size | 35.3% (12) | 23.5% (8) | 20.6% (7) | 20.6% (7) | ||
| OUT_mean | 136.366 | 188.285 | 240.914 | 208.925 | 185.652 | 99.000 |
| PRI_mean | 92.983 | 111.485 | 133.542 | 109.600 | 109.052 | 87.800 |
| ACC_mean | 145.016 | 152.800 | 146.200 | 181.925 | 155.547 | 138.400 |
| RRS_mean | 75.150 | 100.600 | 135.885 | 112.850 | 101.764 | 65.800 |
| PRE_mean | 79.166 | 85.600 | 111.342 | 101.250 | 92.311 | 70.200 |
| PHA_mean | 50.450 | 64.114 | 77.085 | 77.275 | 65.058 | 45.800 |
© 2017 by the authors. Licensee MDPI, Basel, Switzerland. This article is an open access article distributed under the terms and conditions of the Creative Commons Attribution (CC BY) license (http://creativecommons.org/licenses/by/4.0/).
Share and Cite
Popa, I.; Ștefan, S.C. Modeling the Impact of Short-Term and Long-Term Determinants of European Health Systems’ Performance: A Panel Data Approach. Sustainability 2017, 9, 1595. https://doi.org/10.3390/su9091595
Popa I, Ștefan SC. Modeling the Impact of Short-Term and Long-Term Determinants of European Health Systems’ Performance: A Panel Data Approach. Sustainability. 2017; 9(9):1595. https://doi.org/10.3390/su9091595
Chicago/Turabian StylePopa, Ion, and Simona Cătălina Ștefan. 2017. "Modeling the Impact of Short-Term and Long-Term Determinants of European Health Systems’ Performance: A Panel Data Approach" Sustainability 9, no. 9: 1595. https://doi.org/10.3390/su9091595