A Decomposition Analysis of Embodied Energy Consumption in China’s Construction Industry

Abstract
:1. Introduction
2. Methodology and Data
2.1. Input–Output Analysis
2.2. Direct and Indirect Energy Use
2.3. Decomposition of Embodied Energy Consumption
2.4. Estimating Embodied Energy Use
2.5. Data Source and Processing
3. Results
3.1. Direct and Embodied Energy Consumption of Construction Industry
3.2. Decomposition Analysis of Embodied Energy Consumption
3.3. Differences between Embodied Energy of Inputs and Outputs
3.4. Projections
4. Conclusions and Recommendations
- (1)
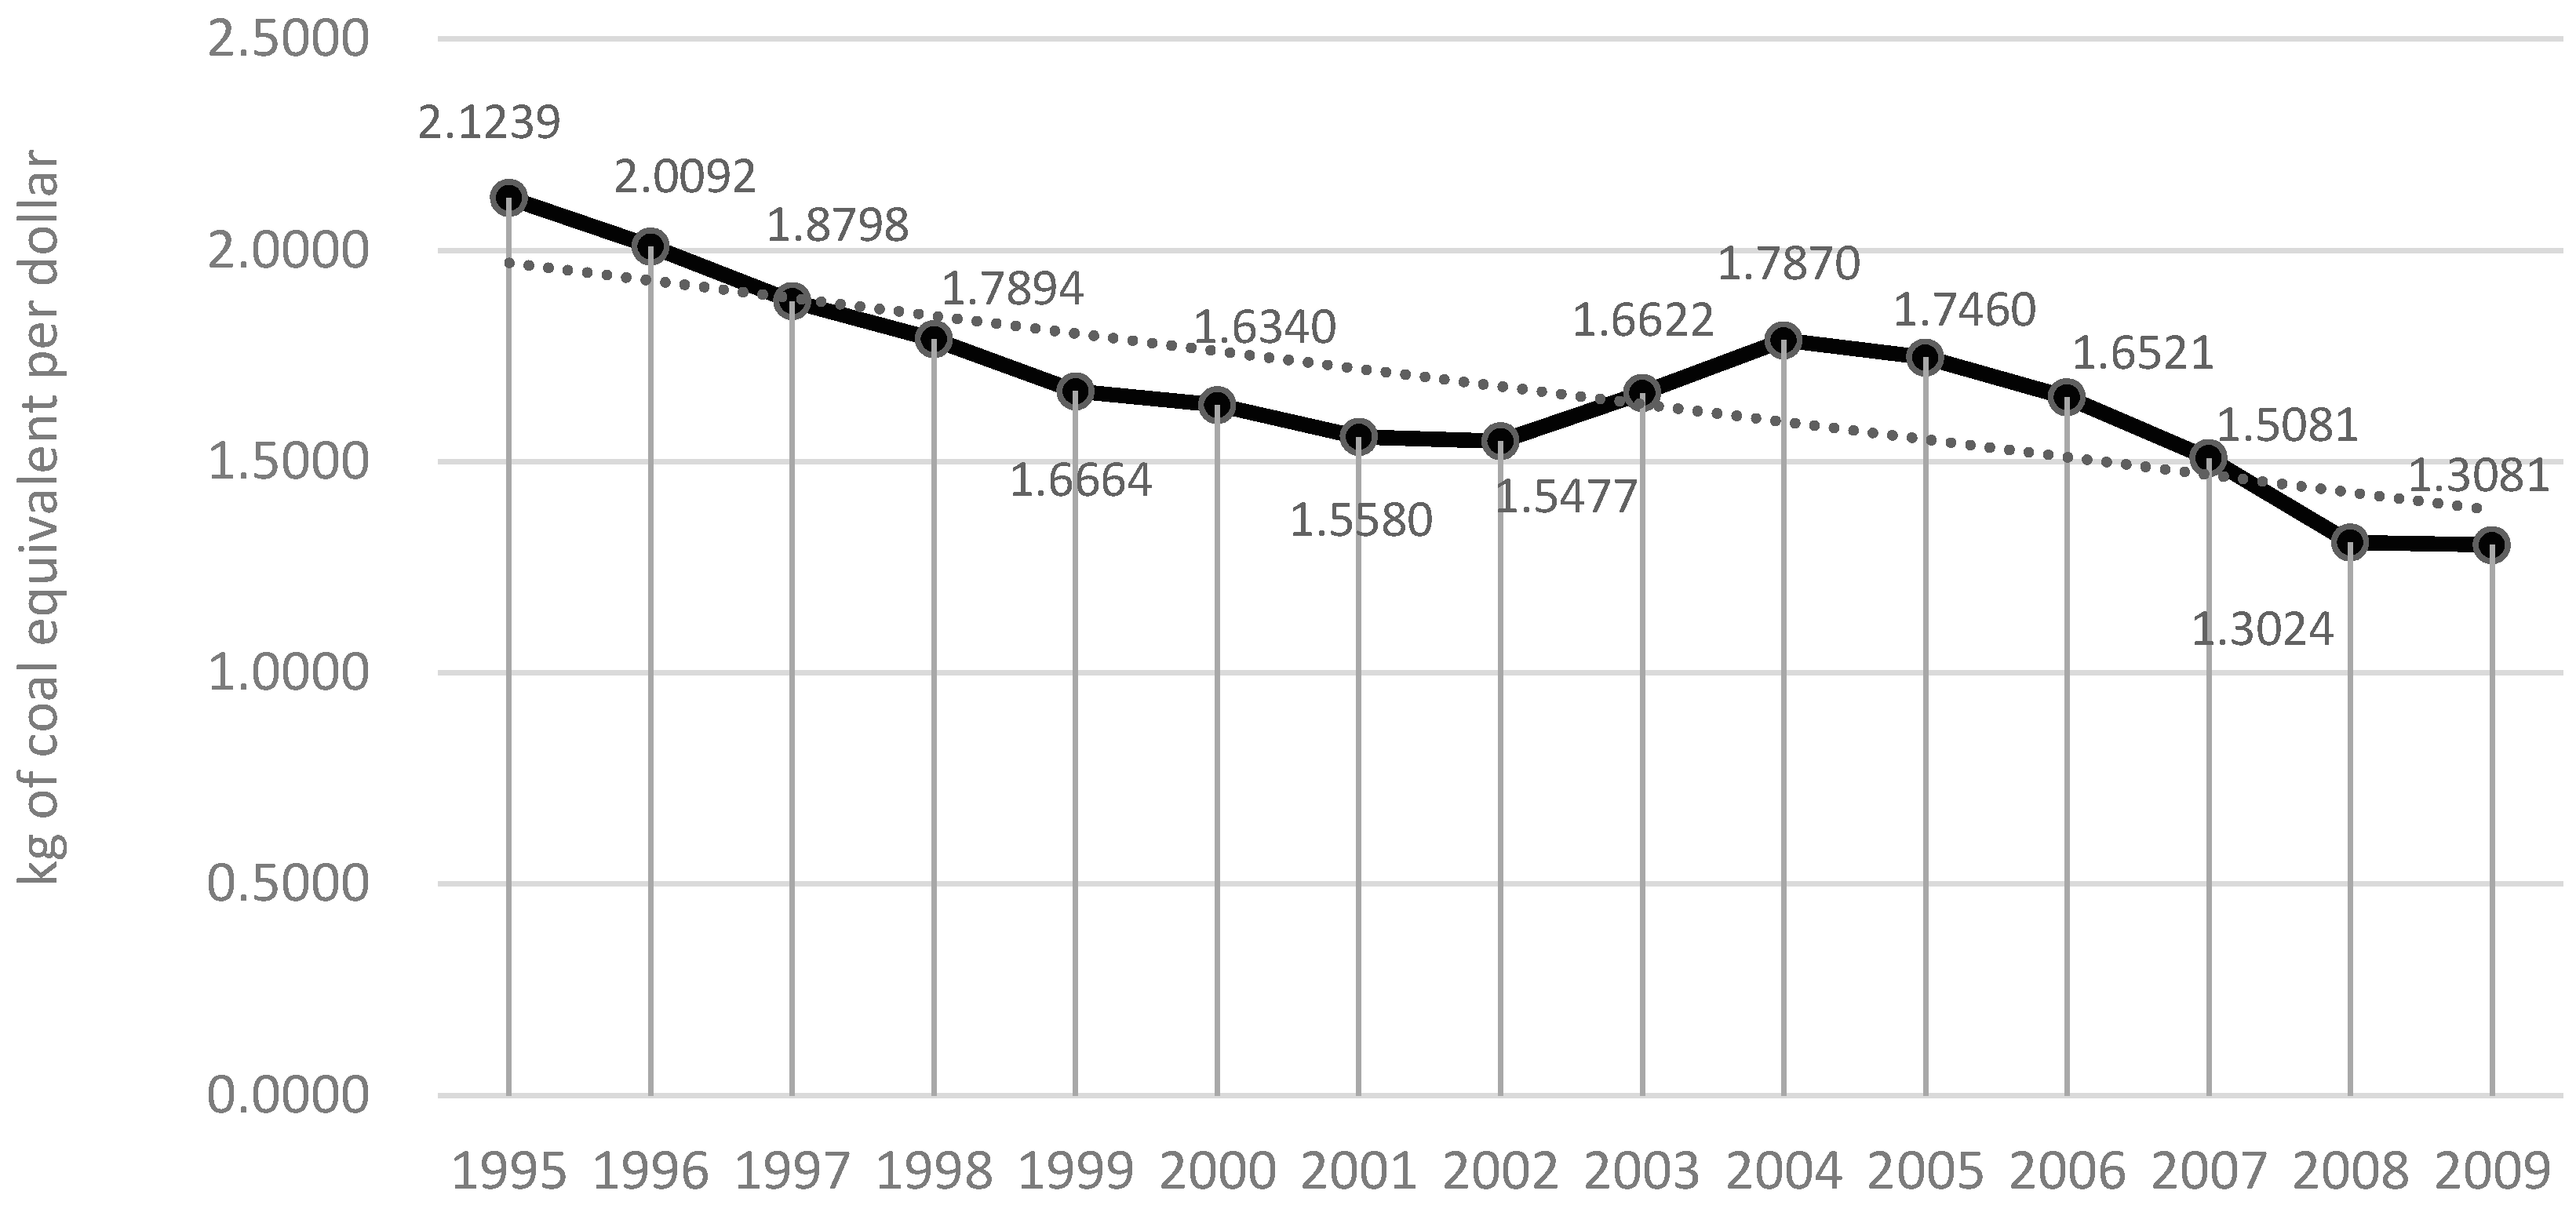
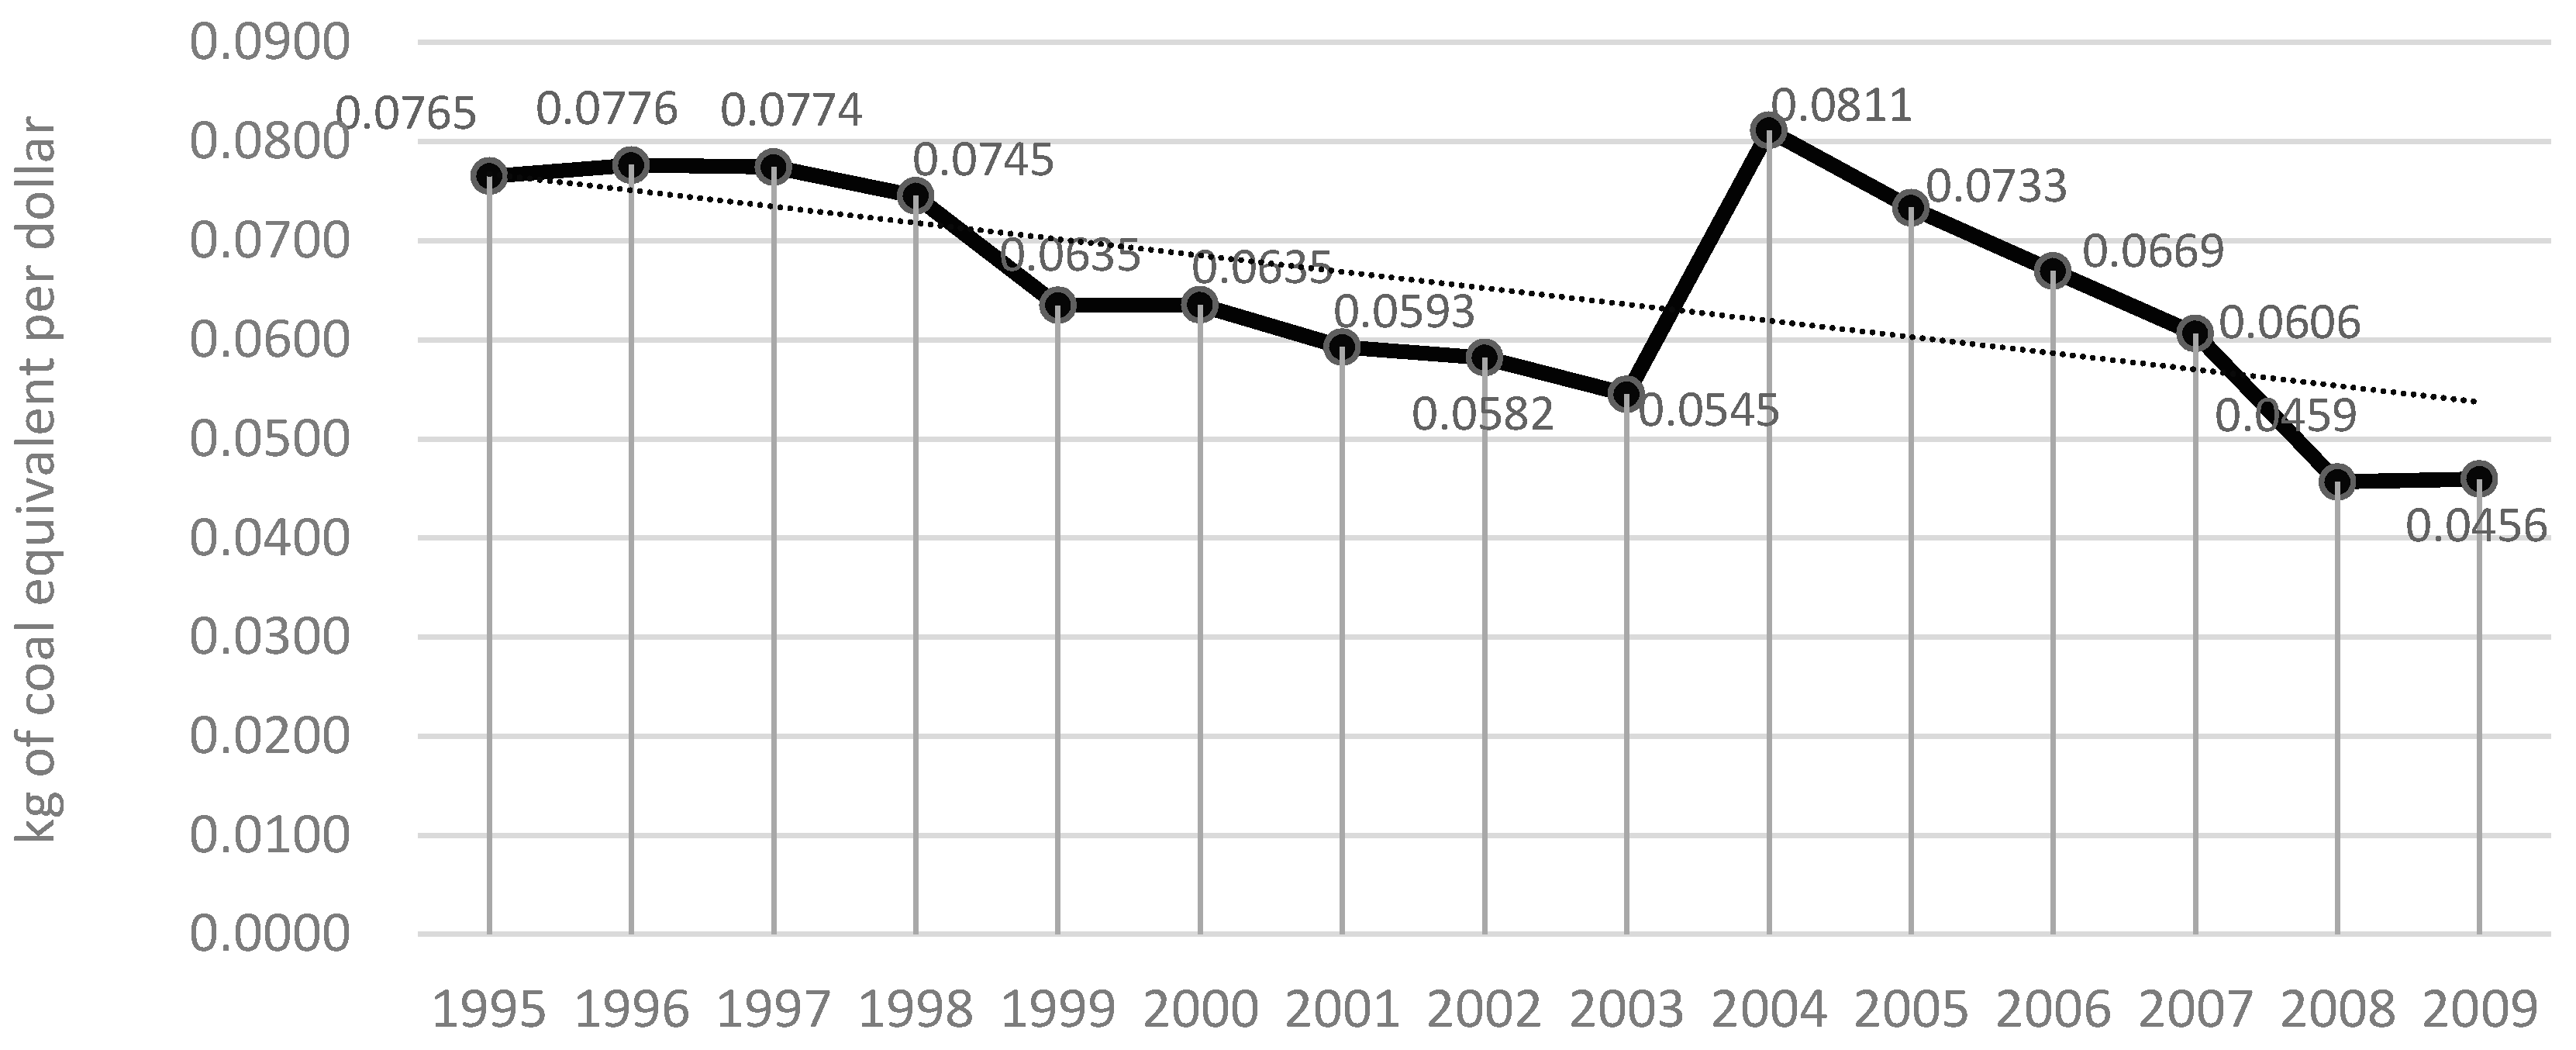
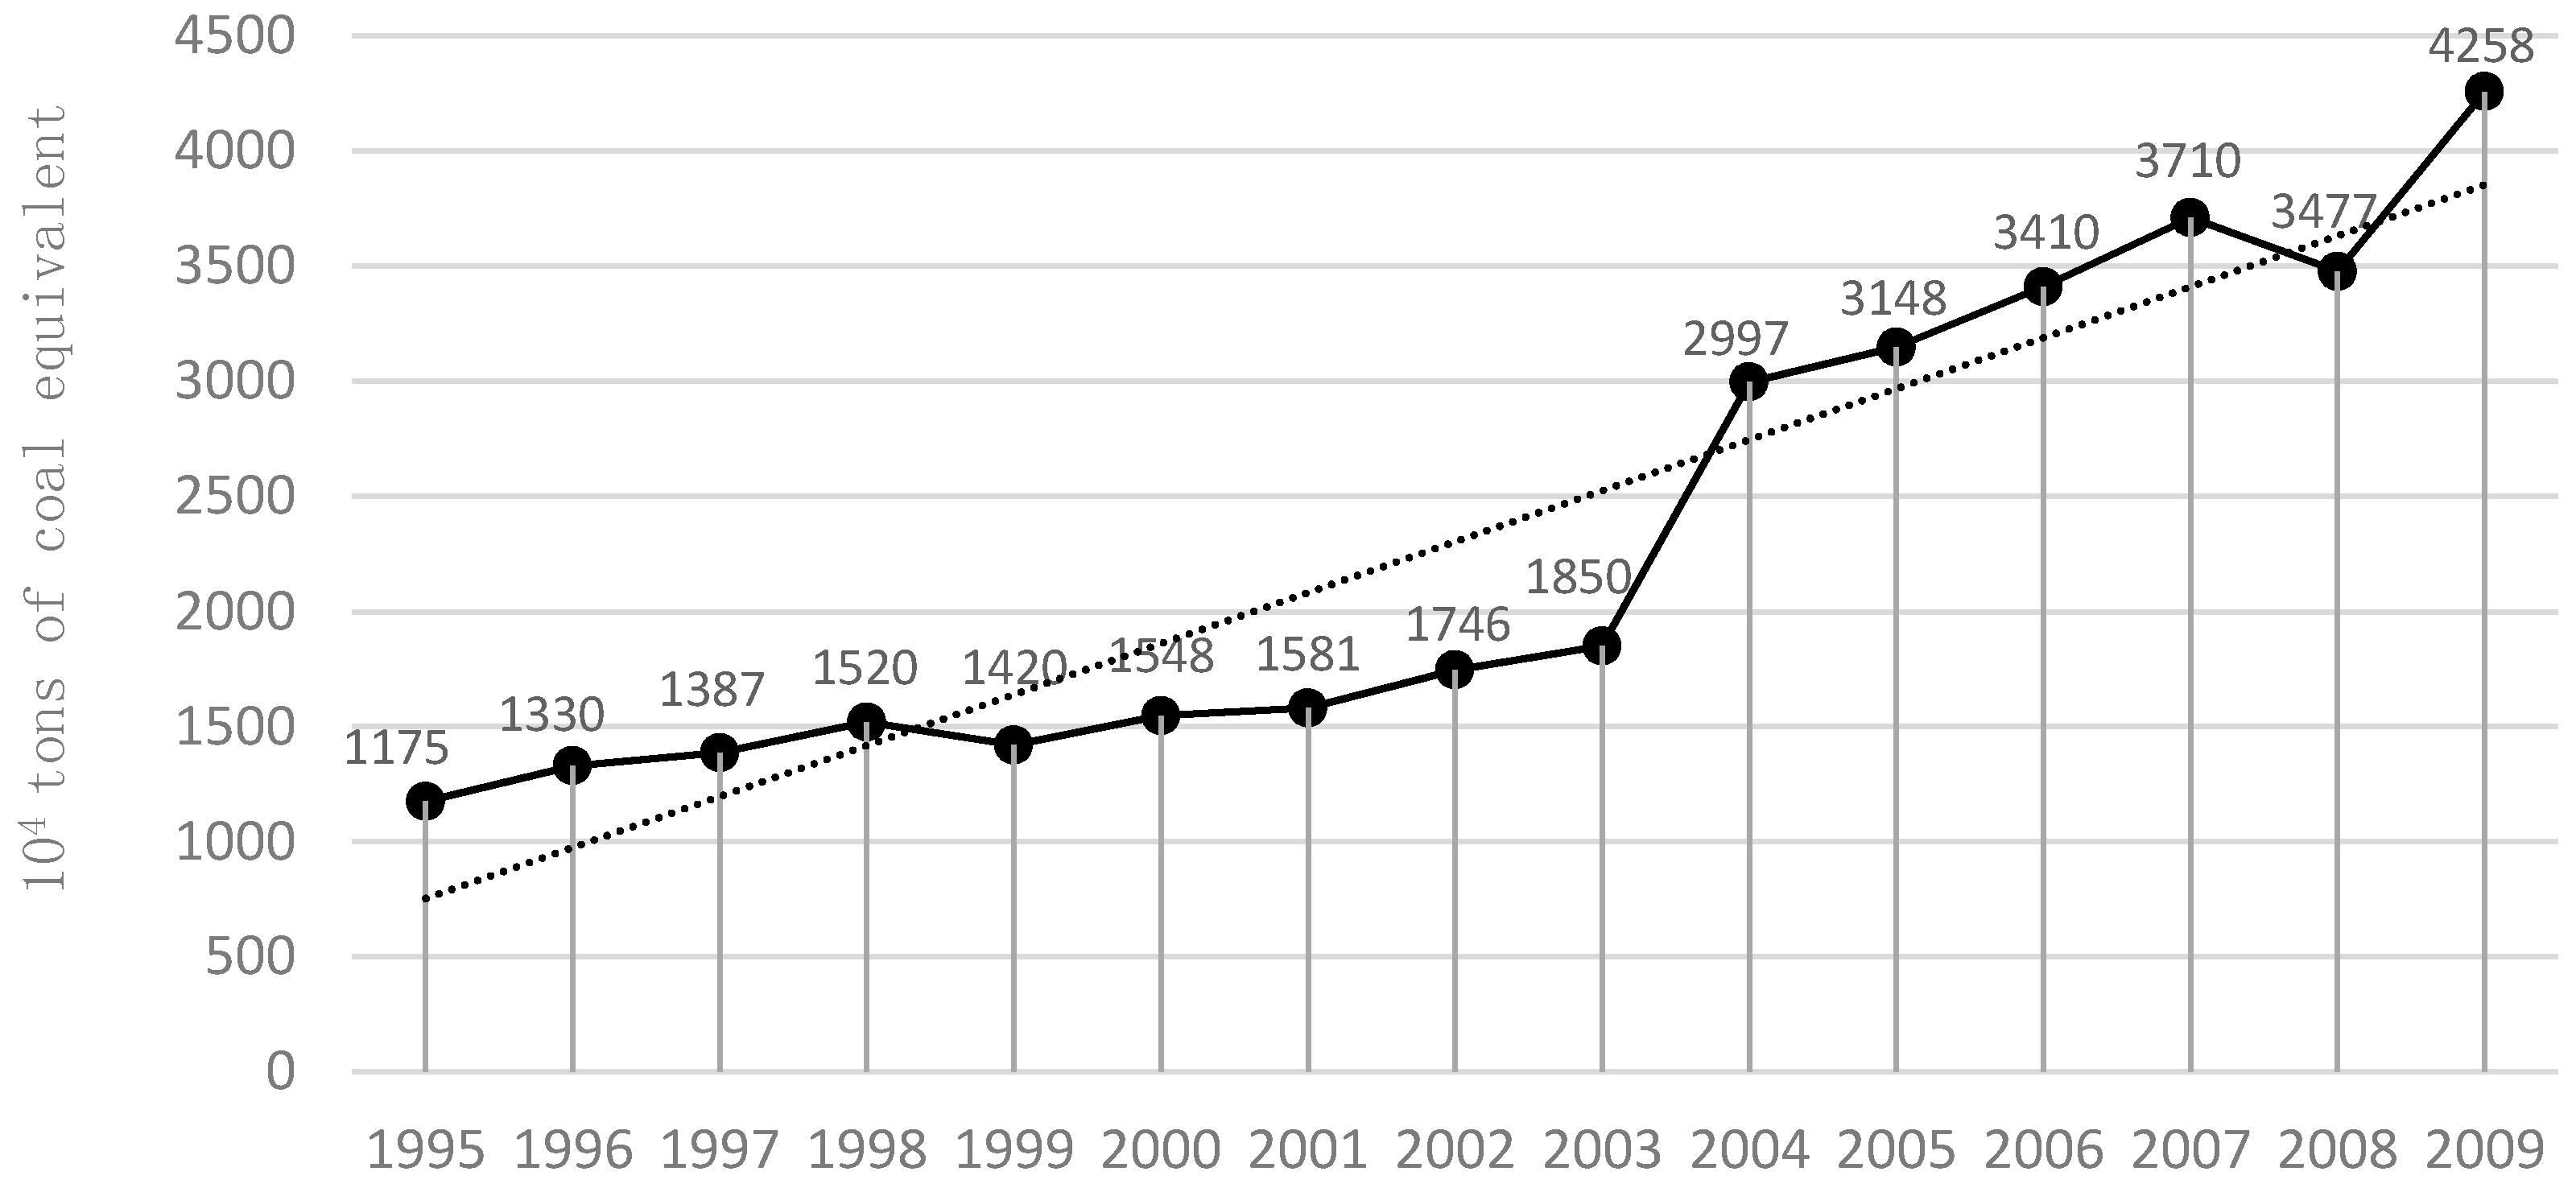
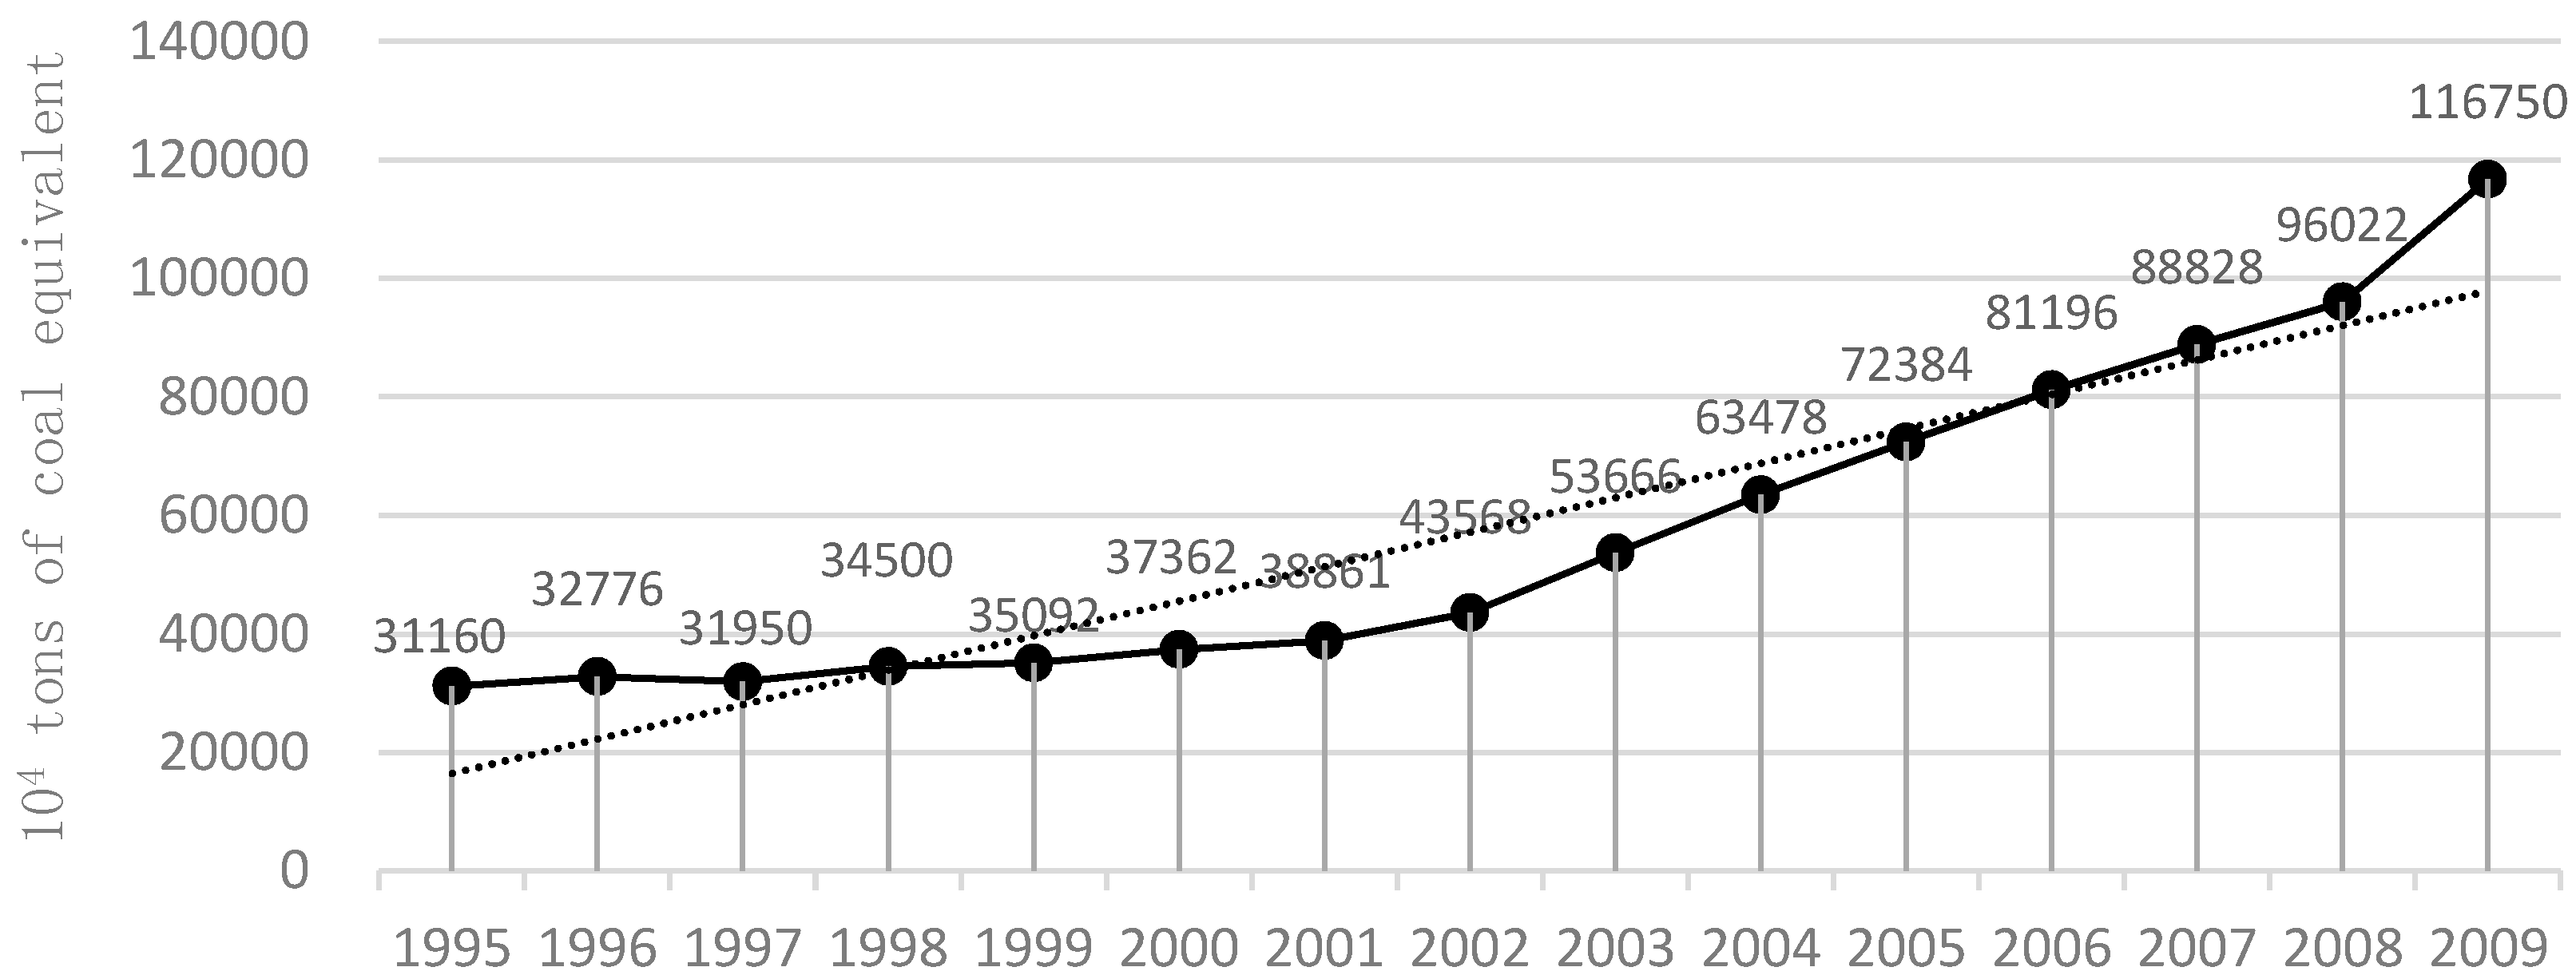
- The size of construction industry has been continuously expanding from 1995 to 2009 by five times. The construction industry is a typical demand-driven sector, embodied energy consumption of which is about 25 times compared with direct energy consumption. Direct and embodied energy use both were increasing rapidly in study period while direct energy consumption coefficient and embodied energy consumption coefficient appeared to have a downward trend, dropping by 40% and 38.68% respectively. The above results show that the development of construction industry has a significant driving effect on other sectors. Meanwhile, it brings about a growing demand for energy consumption, resulting in immense pressure on the environment.
- (2)
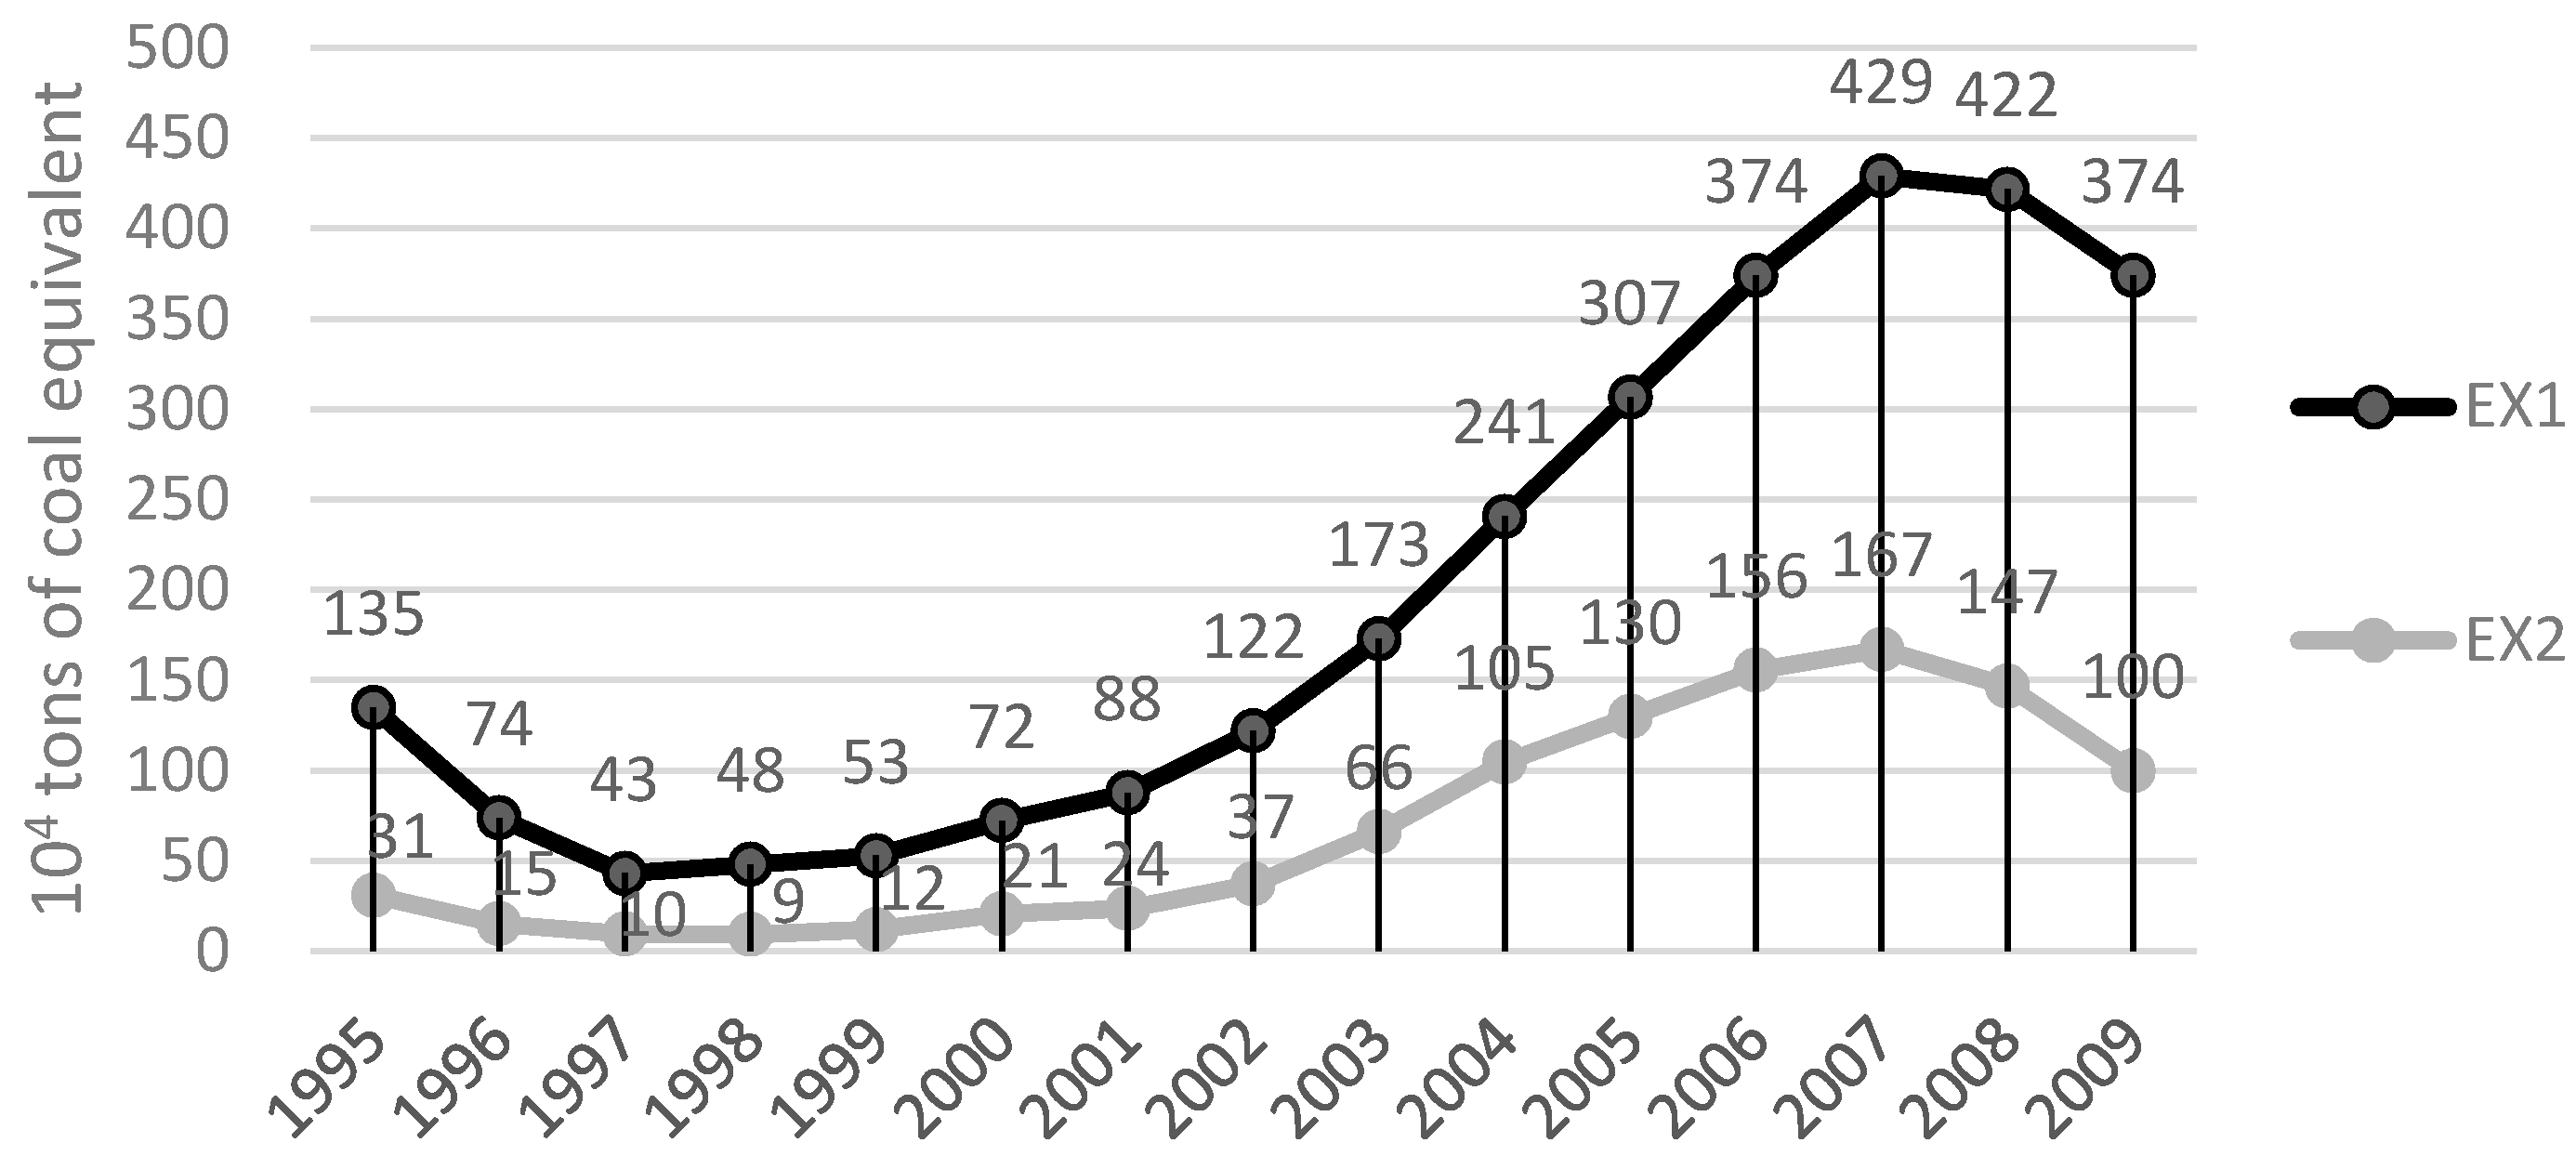
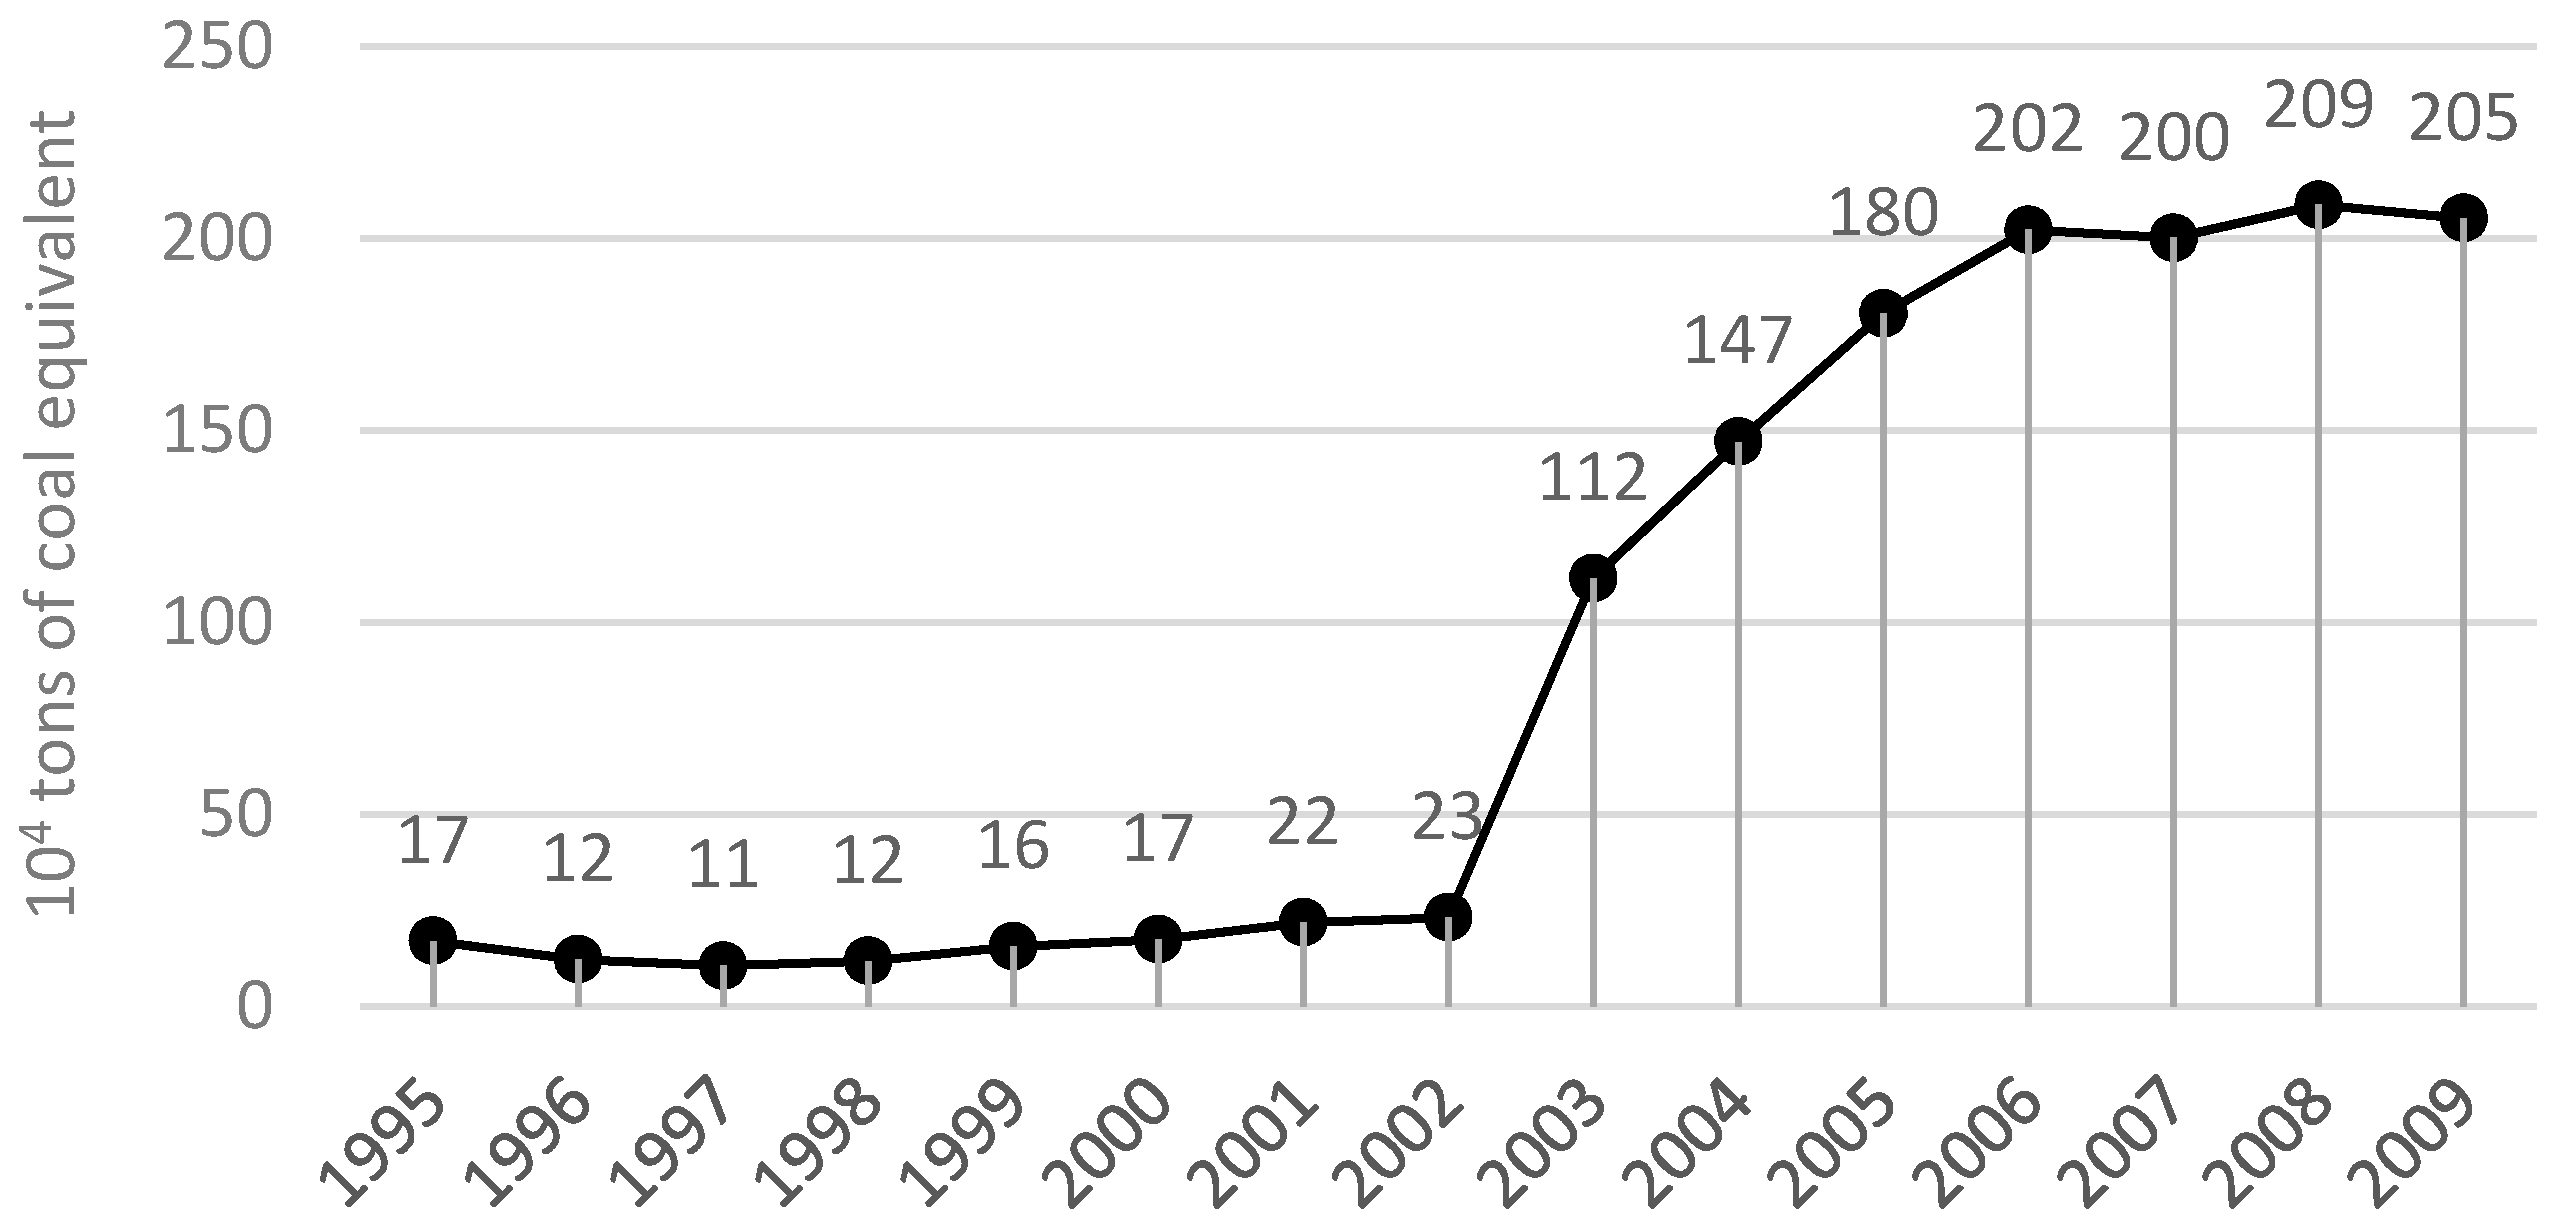
- Construction industry is always a “self-sufficiency” industry because its products are difficult for decomposing and moving. The domestic part accounts for most part of embodied energy, while the proportion of imports and exports is relatively small. We find that the value of energy embodied in both imported intermediates and final products has remarkably increased after China’s entry into WTO in 2001. Increasing imported intermediates and final goods of construction industry is helpful to reduce energy consumption from other sectors in China, which has a positive effect on achieving the energy conservation and emission reduction goal. However, exported products which are produced domestically take account most part of total exports. It implies that China’s construction industry is gradually involved into the global system of division and offers more and more “energy service” to foreign countries with deepening openness.
- (3)
- According to BAU analysis method and Grey Forecasting Model GM(1,1), with the deepening urbanization, total output and final demand of China’s construction industry in 2020 will be 3800 billion and 3200 billion dollars respectively, driving for 170 million tons of coal equivalent direct energy consumption and 4.84 billion tons of coal equivalent of embodied energy. In addition, the value of total imports of construction industry will reach 5.217 billion dollars and total outputs will be 12.197 billion dollars, driving for 6.79 million tons of coal equivalent and 15.89 million embodied primary energy respectively. These results suggest that construction industry, as an important industry of national economy, has significant energy pulling effect for other sectors upstream and downstream. Therefore, it is necessary to balance the rapid growth of construction industry and energy consumption.
- (1)
- Although the improvement of energy-saving technology plays a role in relieving stress of energy use, it is not enough for such a huge energy consumption industry. However, it is very difficult to independently improve energy efficiency by technology innovation as a developing country. Therefore Shui B and Harriss R C [23] suggested the export of developed countries like US technologies and expertise related to clean production and energy efficiency to China would decrease the current trade imbalance, reduce pollution loading and related negative environment impacts in China and improve energy efficiency of the world.
- (2)
- To avoid sacrificing domestic energy resources and being manufacturing factories of developed countries, Chinese government should coordinate imports and exports of construction industry and define responsibility of consumers. But China should not do it blindly because exports remain an important driver of China’s economic growth and play a significant role in expanding political and economic influence now and in the future [24].
- (3)
- Since 2014, China has been actively improving the interconnection with countries of “the Belt and Road (“The Belt and Road” refers to the Silk Road Economic Belt and 21st Century Maritime Silk Road, a significant development strategy launched by the Chinese government with the intention of promoting economic co-operation among countries along the proposed Belt and Road routes. The Initiative was designed to enhance the orderly free-flow of economic factors and the efficient allocation of resources. It is also intended to further market integration and create a regional economic co-operation framework of benefit to all.)”. Construction industry, as the material foundation for cooperation, became the most prior investment area of “the Belt and Road”. The government should especially seize the opportunity of “the Belt and Road” by enhancing cooperation and communication with countries along the road and promoting vigorous “going out” of construction products to drive growth of national economy. On the other hand, it is essential to improve energy saving and emission reducing technologies in construction materials, processes etc. It plays a necessary role in relieving environmental pressure and improving the whole energy efficiency of countries along the road.
Acknowledgments
Author Contributions
Conflicts of Interest
References
- Chen, S.; Zhang, S. Large-scale land use for construction and energy consumption after the new millennium with their impact on total-factor efficiency change in China’s regional economy. Energies 2014, 7, 1986–2003. [Google Scholar] [CrossRef]
- Chang, Y.; Ries, R.J.; Man, Q.; Wang, Y. Disaggregated IO LCA model for building product chain energy quantification: A case from China. Energy Build. 2014, 72, 212–221. [Google Scholar] [CrossRef]
- Hong, J.; Shen, G.Q.; Guo, S.; Xue, F.; Zheng, W. Energy use embodied in China’s construction industry. Amulti-regional input-output analysis. Renew. Sustain. Energy Rev. 2016, 53, 1303–1312. [Google Scholar]
- Pan, J.; Chen, Y. Carbon budget proposal: A framework for an equitable and sustainable international climate regime. Soc. Sci. China 2009, 5, 83–98. [Google Scholar]
- Guan, J.; Zhang, Z.; Chu, C. Quantification of building embodied energy in China using an input–output-based hybrid LCA model. Energy Build. 2016, 110, 443–452. [Google Scholar] [CrossRef]
- Fridley, D.G. Estimating Total Energy Consumption and Emissions of China’s Commercial and Office Buildings; Lawrence Berkeley National Laboratory: Berkeley, CA, USA, 2008.
- Lin, B.; Sun, C. Evaluating carbon dioxide emissions in international trade of China. Energy Policy 2010, 38, 613–621. [Google Scholar] [CrossRef]
- Li, J.S.; Xia, X.H.; Chen, G.Q.; Alsaedi, A.; Hayat, T. Optimal embodied energy abatement strategy for Beijing economy: Based on a three-scale input-output analysis. Renew. Sustain. Energy Rev. 2016, 53, 1602–1610. [Google Scholar] [CrossRef]
- Guo, S.; Shen, G.; Yang, J.; Sun, B.; Xue, F. Embodied energy of service trading in Hong Kong. Smart Sustain. Built Environ. 2015, 4, 234–248. [Google Scholar] [CrossRef] [Green Version]
- Li, Z.; Pan, L.; Fu, F.; Liu, P.; Ma, L.; Amorelli, A. China’s regional disparities in energy consumption: An input–output analysis. Energy 2014, 78, 426–438. [Google Scholar] [CrossRef]
- Lindner, S.; Guan, D. A Hybrid-Unit Energy Input-Output Model to Evaluate Embodied Energy and Life Cycle Emissions for China’s Economy. J. Ind. Ecol. 2014, 18, 201–211. [Google Scholar] [CrossRef]
- Ying, C.; Jiahua, P.; Laihui, X. Energy Embodied in Goods of International Trade in China: Calculation and Policy Implications. Econ. Res. J. 2008, 7, 3. [Google Scholar] [CrossRef]
- Weber, C.L.; Peters, G.P.; Guan, D.; Hubacek, K. The contribution of Chinese exports to climate change. Energy Policy 2008, 36, 3572–3577. [Google Scholar] [CrossRef]
- Sánchez-Chóliz, J.; Duarte, R. CO2 Emissions Embodied in International Trade: Evidence for Spain. Energy Policy 2004, 32, 1999–2005. [Google Scholar] [CrossRef]
- Huang, B.; Zhao, J.; Geng, Y.; Tian, Y.; Jiang, P. Energy-related GHG emissions of the textile industry in China. Resour. Conserv. Recycl. 2017, 119, 69–77. [Google Scholar] [CrossRef]
- Hsiao, F.S.; Hsiao, M.C.W. FDI, exports and GDP in east and southeast Asia-panel data versus time series causality analyses. J. Asian Econ. 2006, 17, 1082–1106. [Google Scholar] [CrossRef]
- Mallah, S.; Bansal, N.K. Allocation of energy resources for power generation in India: Business as usual and energy efficiency. Energy Policy 2010, 38, 1059–1066. [Google Scholar] [CrossRef]
- Lin, Q.G.; Huang, G.H. A dynamic inexact energy systems planning model for supporting greenhouse-gas emission management and sustainable renewable energy development under uncertainty—A case study for the City of Waterloo, Canada. Renew. Sustain. Energy Rev. 2009, 13, 1836–1853. [Google Scholar] [CrossRef]
- Jun, S.; Lee, S.; Park, J.W.; Jeong, S.J.; Shin, H.C. The assessment of renewable energy planning on CO2, abatement in South Korea. Renew. Energy 2010, 35, 471–477. [Google Scholar] [CrossRef]
- Lin, C.S.; Liou, F.M.; Huang, C.P. Grey forecasting model for CO emissions: A Taiwan study. Appl. Energy 2011, 88, 3816–3820. [Google Scholar] [CrossRef]
- Bao, G.L.; Hui, H.Q. Grey Forecasting Model for CO2 Emissions. Adv. Mater. Res. 2012, 518–523, 1664–1668. [Google Scholar] [CrossRef]
- Xie, N.M.; Yuan, C.Q.; Yang, Y.J. Forecasting China’s energy demand and self-sufficiency rate by grey forecasting model and Markov model. Int. J. Electr. Power Energy Syst. 2015, 66, 1–8. [Google Scholar] [CrossRef]
- Shui, B.; Harriss, R.C. The role of CO2 embodiment in US–China trade. Energy Policy 2006, 34, 4063–4068. [Google Scholar] [CrossRef]
- Zhang, Y. Carbon Contents of the Chinese Trade and Their Determinants: An Analysis Based on Non-competitive (Import) Input-Output Tables. China Econ. Q. 2010, 9, 1287–1310. [Google Scholar]


| embodied energy in products which are produced and consumed domestically | ||
| embodied energy in products which are imported and consumed domestically | ||
| embodied energy in exported products which are manufactured domestically | ||
| embodied energy in imported products which are not for domestic consumption | ||
| embodied energy in imported products which are for direct consumption | ||
| embodied energy in imported products which are consumed after domestic processing | ||
| embodied energy in imported products which are processed for re-exporting |
| 1995 | 1997 | 1999 | 2001 | 2003 | 2005 | 2007 | 2009 | |
|---|---|---|---|---|---|---|---|---|
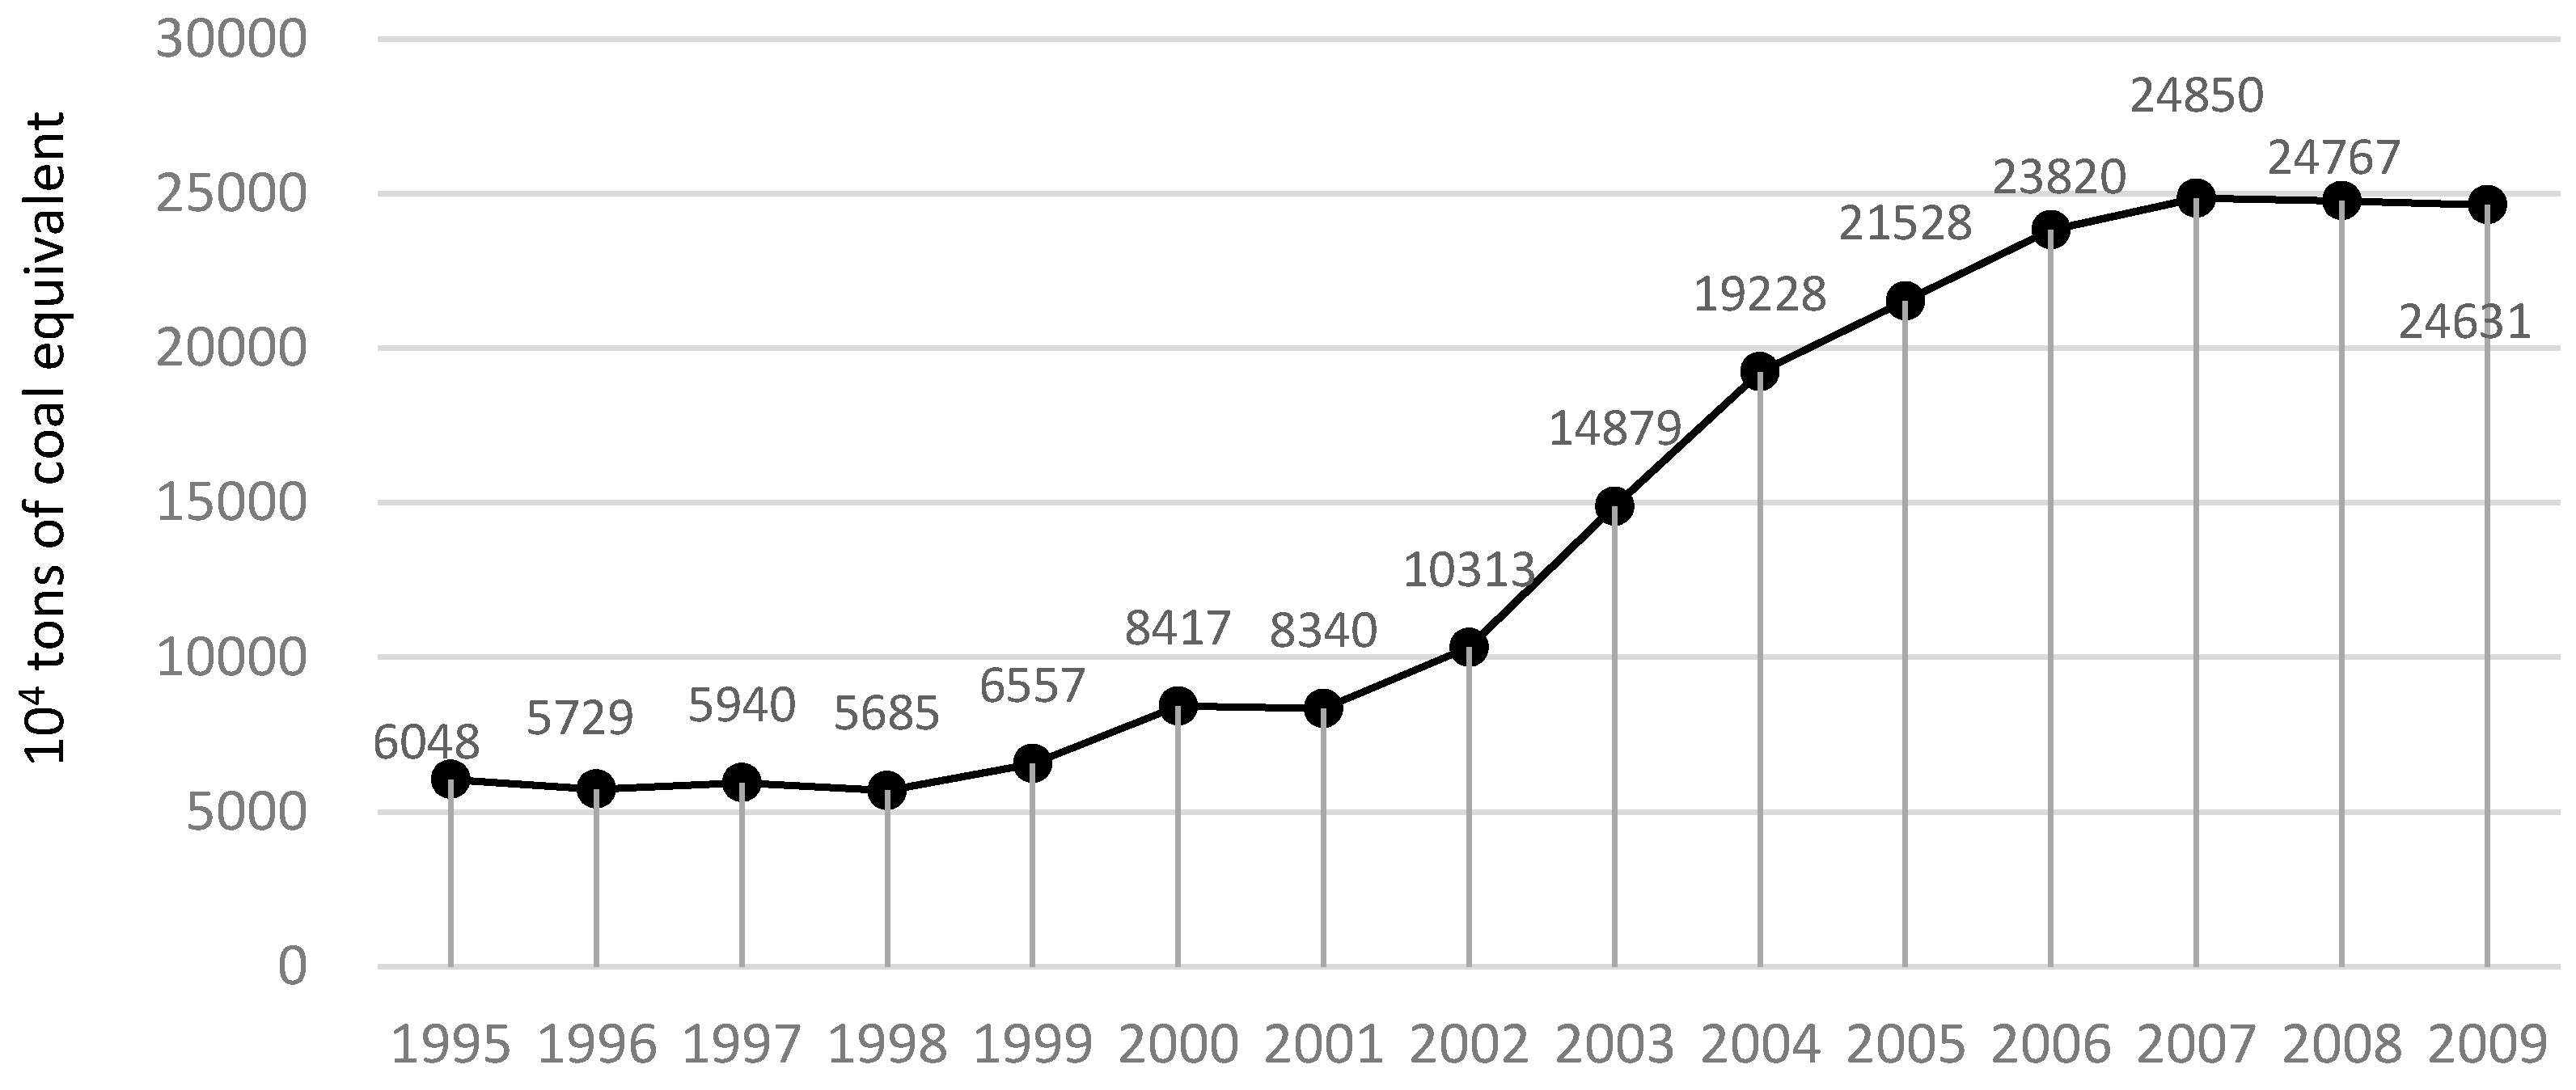
| D2 (104 tons of coal equivalent) | 6048 | 5940 | 6557 | 8340 | 14,879 | 21,528 | 24,850 | 24,631 |
| IM1 + IM2 (104 tons of coal equivalent) | 266 | 107 | 117 | 137 | 184 | 292 | 315 | 329 |
| D2/(IM1 + IM2) | 22.71 | 55.44 | 55.95 | 60.71 | 80.66 | 73.78 | 78.79 | 74.91 |
| 1995 | 1997 | 1999 | 2001 | 2003 | 2005 | 2007 | 2009 | |
|---|---|---|---|---|---|---|---|---|
| EX2 (104 tons of coal equivalent) | 31 | 10 | 12 | 24 | 66 | 130 | 167 | 100 |
| IM3 (104 tons of coal equivalent) | 4 | 2 | 4 | 8 | 29 | 53 | 57 | 37 |
| EX2/IM3 | 7.38 | 3.95 | 3.04 | 3.11 | 2.25 | 2.47 | 2.93 | 2.73 |
| 1995 | 2009 | 2020 | |
|---|---|---|---|
| (kg of coal equivalent per dollar) | 0.077 | 0.046 | 0.046 |
| (kg of coal equivalent per dollar) | 2.124 | 1.302 | 1.302 |
| (kg of coal equivalent per dollar) | 0.397 | 0.275 | 0.275 |
| (billions of dollars) | 153.567 | 926.822 | 3805.416 |
| (billions of dollars) | 146.716 | 896.431 | 3716.370 |
| (billions of dollars) | 1.274 | 2.805 | 5.217 |
| (billions of dollars) | 0.780 | 3.639 | 12.197 |
| (billions of dollars) | 1.174 | 0.948 | 0.801 |
| (104 tons of coal equivalent) | 1175 | 4258 | 17483 |
| (104 tons of coal equivalent) | 31,160 | 116,750 | 484,014 |
| (104 tons of coal equivalent) | 31,026 | 116,376 | 482,760 |
| (104 tons of coal equivalent) | 6048 | 24,631 | 101,787 |
| (104 tons of coal equivalent) | 135 | 374 | 1254 |
| (104 tons of coal equivalent) | 31 | 100 | 335 |
| (104 tons of coal equivalent) | 249 | 123 | 104 |
| (104 tons of coal equivalent) | 17 | 205 | 688 |
| (104 tons of coal equivalent) | 4 | 37 | −113 |
© 2017 by the authors. Licensee MDPI, Basel, Switzerland. This article is an open access article distributed under the terms and conditions of the Creative Commons Attribution (CC BY) license (http://creativecommons.org/licenses/by/4.0/).
Share and Cite
Lin, L.; Fan, Y.; Xu, M.; Sun, C. A Decomposition Analysis of Embodied Energy Consumption in China’s Construction Industry. Sustainability 2017, 9, 1583. https://doi.org/10.3390/su9091583
Lin L, Fan Y, Xu M, Sun C. A Decomposition Analysis of Embodied Energy Consumption in China’s Construction Industry. Sustainability. 2017; 9(9):1583. https://doi.org/10.3390/su9091583
Chicago/Turabian StyleLin, Luhang, Yinzi Fan, Meilian Xu, and Chuanwang Sun. 2017. "A Decomposition Analysis of Embodied Energy Consumption in China’s Construction Industry" Sustainability 9, no. 9: 1583. https://doi.org/10.3390/su9091583