Influence of Income Level and Seasons on Quantity and Composition of Municipal Solid Waste: A Case Study of the Capital City of Pakistan

Abstract
:1. Introduction
2. Methodology
- (1)
- Categorizing the population in socio-economic group
- (2)
- Sample Collection
- (3)
- Classifying and quantifying the fractions
- (4)
- Data Analysis.
2.1. Categorizing the Population in Socio-Economic Groups
2.2. Sample Collection
- (1)
- Survey of households
- (2)
- Collection of samples
- (3)
- Transportation of samples
- (4)
- Segregation of samples
- (5)
- Quantification of components of waste.
2.3. Classifying and Quantifying the Fractions
2.4. Data Analysis
3. Results
4. Discussion
4.1. Socio-Economic Influence on the Composition and Generation Rate of Waste
4.2. Socioeconomic Influence on the Composition and Generation Rate of Waste
5. Conclusions
Acknowledgments
Author Contributions
Conflicts of Interest
References
- Statistics Division of the Government of Pakistan (Statistics Department). Population and Housing Census, Islamabad City Report; Government of Pakistan: Islamabad, Pakistan, 1998.
- CERES Associate Gulf UAE. Improvement of Environment by Solid Waste Management in Islamabad, Pakistan. 2006, pp. 3–6. Available online: http://projectpi.pk/services/solid-waste-management/ (accessed on 3 September 2017).
- Ali, S.M.; Pervaiz, A.; Afzal, B.; Hamid, N.; Yasmin, A. Open dumping of municipal solid waste and its hazardous impacts on soil and vegetation diversity at waste dumping sites of Islamabad city. J. King Saud Univ. Sci. 2014, 26, 59–65. [Google Scholar] [CrossRef]
- Gomez, G.; Meneses, M.; Ballinas, L.; Castells, F. Characterization of urban solid waste in Chihuahua, Mexico. Waste Manag. 2008, 28, 2465–2471. [Google Scholar] [CrossRef] [PubMed]
- Al-Khatib, I.A.; Kontogianni, S.; Abu Nabaa, H.; Alshami, N.M.; Al-Sari’, M.I. Public perception of hazardousness caused by current trends of municipal solid waste management. Waste Manag. 2015, 36, 323–330. [Google Scholar] [CrossRef] [PubMed]
- World Bank. What a Waste: Solid Waste Management in Asia Urban Waste Management; World Bank: Washington, DC, USA, 1999. [Google Scholar]
- Misra, V.; Pandey, S.D. Hazardous waste, impact on health and environment for development of better waste management strategies in future in India. Environ. Int. 2005, 31, 417–431. [Google Scholar] [CrossRef] [PubMed]
- Ripa, M.; Fiorentino, G.; Vacca, V.; Ulgiati, S. The relevance of site-specific data in life cycle assessment (lca). The case of the municipal solid waste management in the metropolitan city of Naples (Italy). J. Clean. Prod. 2017, 142 Pt 1, 445–460. [Google Scholar] [CrossRef]
- Yıldız-Geyhan, E.; Yılan-Çiftçi, G.; Altun-Çiftçioğlu, G.A.; Neşet Kadırgan, M.A. Environmental analysis of different packaging waste collection systems for Istanbul—Turkey case study. Resour. Conserv. Recycl. 2016, 107, 27–37. [Google Scholar] [CrossRef]
- Aparcana, S. Approaches to formalization of the informal waste sector into municipal solid waste management systems in low- and middle-income countries: Review of barriers and success factors. Waste Manag. 2017, 61, 593–607. [Google Scholar] [CrossRef] [PubMed]
- McDougall, F.; White, P.; Franke, M.; Hindle, P. Integrated Solid Waste Management: A Life Cycle Inventory, 2nd ed.; Blackwell Science Ltd.: Hoboken, NJ, USA, 2001. [Google Scholar]
- Nabavi-Pelesaraei, A.; Bayat, R.; Hosseinzadeh-Bandbafha, H.; Afrasyabi, H.; Chau, K.-W. Modeling of energy consumption and environmental life cycle assessment for incineration and landfill systems of municipal solid waste management—A case study in Tehran metropolis of Iran. J. Clean. Prod. 2017, 148, 427–440. [Google Scholar] [CrossRef]
- Chifari, R.; Lo Piano, S.; Bukkens, S.G.F.; Giampietro, M. A holistic framework for the integrated assessment of urban waste management systems. Ecol. Indic. 2016. [Google Scholar] [CrossRef]
- Marshall, R.E.; Farahbakhsh, K. Systems approaches to integrated solid waste management in developing countries. Waste Manag. 2013, 33. [Google Scholar] [CrossRef] [PubMed]
- Othman, S.N.; Zainon Noor, Z.; Abba, A.H.; Yusuf, R.O.; Abu Hassan, M.A. Review on life cycle assessment of integrated solid waste management in some asian countries. J. Clean. Prod. 2013, 41, 251–262. [Google Scholar] [CrossRef]
- Batool, S.A.; Ch, M.N. Municipal solid waste management in Lahore city district, Pakistan. Waste Manag. 2009, 29, 1971–1981. [Google Scholar] [CrossRef] [PubMed]
- Hu, D.; Wang, R.; Yan, J.; Xu, C.; Wang, Y. A pilot ecological engineering project for municipal solid waste reduction, disinfection, regeneration and industrialization in Guanghan City, China. Ecol. Eng. 1998, 11, 129–138. [Google Scholar] [CrossRef]
- Zhao, W.; Huppes, G.; van der Voet, E. Eco-efficiency for greenhouse gas emissions mitigation of municipal solid waste management: A case study of Tianjin, China. Waste Manag. 2011, 31, 1407–1415. [Google Scholar] [CrossRef] [PubMed]
- Jadoon, A.Z.; Batool, S.A.; Chaudhry, M.N. Assessment of factors affecting household solid waste generation and its composition in Gulberg town, Lahore, Pakistan. Mater. Cycles Waste Manag. 2013, 16, 73–81. [Google Scholar] [CrossRef]
- Guerrero, L.A.; Maas, G.; Hogland, W. Solid waste management challenges for cities in developing countries. Waste Manag. 2013, 33, 220–232. [Google Scholar] [CrossRef] [PubMed]
- Bing, X.; Bloemhof, J.M.; Ramos, T.R.P.; Barbosa-Povoa, A.P.; Wong, C.Y.; van der Vorst, J.G.A.J. Research challenges in municipal solid waste logistics management. Waste Manag. 2016, 48, 584–592. [Google Scholar] [CrossRef] [PubMed]
- United States Environmental Protection Agency. Solid Waste and Emergency Response; United States Environmental Protection Agency: Washington, DC, USA, 2002.
- Qi, C.; Ma, X.; Wang, M.; Ye, L.; Yang, Y.; Hong, J. A case study on the life cycle assessment of recycling industrial mercury-containing waste. J. Clean. Prod. 2017, 161, 382–389. [Google Scholar] [CrossRef]
- Erses Yay, A.S. Application of life cycle assessment (lca) for municipal solid waste management: A case study of sakarya. J. Clean. Prod. 2015, 94, 284–293. [Google Scholar] [CrossRef]
- Ayodele, T.R.; Ogunjuyigbe, A.S.O.; Alao, M.A. Life cycle assessment of waste-to-energy (wte) technologies for electricity generation using municipal solid waste in nigeria. Appl. Energy 2017, 201, 200–218. [Google Scholar] [CrossRef]
- De Felice, F.; Campagiorni, F.; Petrillo, A. Economic and environmental evaluation via an integrated method based on lca and mcda. Procedia Soc. Behav. Sci. 2013, 99, 1–10. [Google Scholar] [CrossRef]
- Parizeau, K.; Maclaren, V.; Chanthy, L. Waste characterization as an element of waste management planning: Lessons learned from a study in Siem Reap, Cambodia. Resour. Conserv. Recycl. 2006, 49, 110–128. [Google Scholar] [CrossRef]
- Ojeda, B.; Amp, X.; Tez, S.; Beraud-Lozano, J.L. The municipal solid waste cycle in Mexico: Final disposal. Resour. Conserv. Recycl. 2003, 39, 239–250. [Google Scholar]
- Escarimosa, L.F.G.; Castaneda, G.; Quintal, C.A. Household Waste Management in the City of Tuxtla Gutierre Chiapas; Plaza y Valdez Editores Mexico: Mexico City, Mexico, 2001. [Google Scholar]
- Buenrostro, O.; Bocco, G. Solid waste management in municipalities in Mexico: Goals and perspectives. Resour. Conserv. Recycl. 2003, 39, 251–263. [Google Scholar] [CrossRef]
- Bernache-Perez, G.; Sánchez-Colón, S.; Garmendia, A.M.; Dávila-Villarreal, A.; Sánchez-Salazar, M.E. Solid waste characterization study in the Guadalajara Metropolitan zone, Mexico. Waste Manag. Res. 2001, 19, 413–424. [Google Scholar] [CrossRef] [PubMed]
- Zsigraiová, Z.; Tavares, G.; Semiao, V.; Carvalho, M.D.G. Integrated waste-to-energy conversion and waste transportation within island communities. Energy 2009, 34, 623–635. [Google Scholar] [CrossRef]
- Von Schoenberg, A. Waste disposal in east Germany—An overview. Waemer Bull. 1990, 19, 4–5. [Google Scholar]
- Denison, R.A. Environmental life-cycle comparisons of recycling, land filling and incineration. A review of recent studies. Annu. Rev. Energy Environ. 1996, 21, 191–237. [Google Scholar] [CrossRef]
- Qu, X.-Y.; Li, Z.-S.; Xie, X.-Y.; Sui, Y.-M.; Yang, L.; Chen, Y. Survey of composition and generation rate of household wastes in Beijing, China. Waste Manag. 2009, 29, 2618–2624. [Google Scholar] [CrossRef] [PubMed]
- Denafas, G.; Ruzgas, T.; Martuzevičius, D.; Shmarin, S.; Hoffmann, M.; Mykhaylenko, V.; Ogorodnik, S.; Romanov, M.; Neguliaeva, E.; Chusov, A.; et al. Seasonal variation of municipal solid waste generation and composition in four east European cities. Resour. Conserv. Recycl. 2014, 89, 22–30. [Google Scholar] [CrossRef]
- Feng, T.-T.; Yang, Y.-S.; Xie, S.-Y.; Dong, J.; Ding, L. Economic drivers of greenhouse gas emissions in China. Renew. Sustain. Energy Rev. 2017, 78, 996–1006. [Google Scholar] [CrossRef]
- Feniel Phillip, A.C. Household solid waste generation and characteristics in cape Haitian city, Republic of Haiti. Resour. Conserv. Recycl. 2009, 54, 73–78. [Google Scholar] [CrossRef]
- Gómez, G.; Meneses, M.; Ballinas, L.; Castells, F. Seasonal characterization of urban solid waste in Chihuahua, Mexico. Waste Manag. 2009, 29, 2018–2024. [Google Scholar] [CrossRef] [PubMed]
- Kamran, A.; Chaudhry, M.N.; Batool, S.A. Effects of socio-economic status and seasonal variation on municipal solid waste composition: A baseline study for future planning and development. Environ. Sci. Eur. 2015, 27. [Google Scholar] [CrossRef]
- Al-Jarallah, R.; Aleisa, E. A baseline study characterizing the municipal solid waste in the state of Kuwait. Waste Manag. 2014, 34, 952–960. [Google Scholar] [CrossRef] [PubMed]
- Bandara, N.J.; Hettiaratchi, J.P.; Wirasinghe, S.C.; Pilapiiya, S. Relation to waste generation and composition to socio-economic factors: A case study. Environ. Monit. Assess. 2007, 135, 31–39. [Google Scholar] [CrossRef] [PubMed]
- ASTM International. Standards Test Method for Determination of the Composition of Unprocessed Municipal Solid Waste; ASTM D5231-92; ASTM International: West Conshohocken, PA, USA, 2016. [Google Scholar]
- Ontario Waste Diversion Organization (OWDO). Residential Curbside Waste Audit Guide, Ontario Waste Diversion Organizational Behavior and Human Decision Processes; Ontario Waste Diversion Organization: North York, ON, Canada, 2002; p. 9. [Google Scholar]
- Tchobanoglous, G.; Kreith, F. Handbook of Solid Waste Management, 2nd ed.; McGraw-Hill Book Company: New York, NY, USA, 2002. [Google Scholar]
- World Health Organization (WHO). Procedure for Solid Waste Generation Survey; World Health Organization: Geneva, Switzerland, 1996. [Google Scholar]
- California Integrated Waste Management Board (CIWMB); Centre for Integrated Water and Basin Management. Conducting a Diversion Study: A Guide for Local Jurisdictions; California Department of Resources Recycling and Recovery: Sacramento, CA, USA, 1998.
- Riber, C.; Petersen, C.; Christensen, T.H. Chemical composition of material fractions in danish household waste. Waste Manag. 2009, 29, 1251–1257. [Google Scholar] [CrossRef] [PubMed]
- Qdais, H.A.A.; Hamoda, M.F.; Newham, J. Analysis of residential solid waste at generation sites. Waste Manag. Res. 1997, 15, 395–406. [Google Scholar] [CrossRef]
- Zeng, Y.; Trauth, K.M.; Peyton, R.L.; Banerji, S. Characterization of solid waste disposed at Columbia sanitary landfill in Missouri. Waste Manag. Res. 2005, 23, 62–71. [Google Scholar] [CrossRef] [PubMed]
- Sadef, Y.; Nizami, A.; Batool, S.; Chaudary, M.; Ouda, O.; Asam, Z.; Habib, K.; Rehan, M.; Demirbas, A. Waste-to-energy and recycling value for developing integrated solid waste management plan in Lahore. Energy Sources Part B Econ. Plan. Policy 2016, 11, 569–579. [Google Scholar] [CrossRef]
- Organization for Economic Cooperation and Development (OECD). Environmental Data Compendium; Organization for Economic Cooperation and Development: Paris, France, 1997. [Google Scholar]
- Janssen, A.M.; Nijenhuis-de Vries, M.A.; Boer, E.P.J.; Kremer, S. Fresh, frozen, or ambient food equivalents and their impact on food waste generation in dutch households. Waste Manag. 2017, 67, 298–307. [Google Scholar] [CrossRef] [PubMed]
- Nabegu, A.B. An analysis of municipal solid waste in Kano Metropolis, Nigeria. J. Hum. Ecol. 2010, 31, 111–119. [Google Scholar]
- Majeed, A.; Batool, S.A.; Chaudhry, M.N. Informal waste management in the developing world: Economic contribution through integration with the formal sector. Waste Biomass Valoriz. 2017, 8, 679–694. [Google Scholar] [CrossRef]
- Hussain, F.; Chaudhry, M.N.; Batool, S.A. Assessment of key parameters in municipal solid waste management: A prerequisite for sustainability. Int. J. Sustain. Dev. World Ecol. 2014, 21, 519–525. [Google Scholar] [CrossRef]
- Seng, B.; Hirayama, K.; Katayama-Hirayama, K.; Ochiai, S.; Kaneko, H. Scenario analysis of the benefit of municipal organic-waste composting over landfill, Cambodia. J. Environ. Manag. 2013, 114, 216–224. [Google Scholar] [CrossRef] [PubMed]
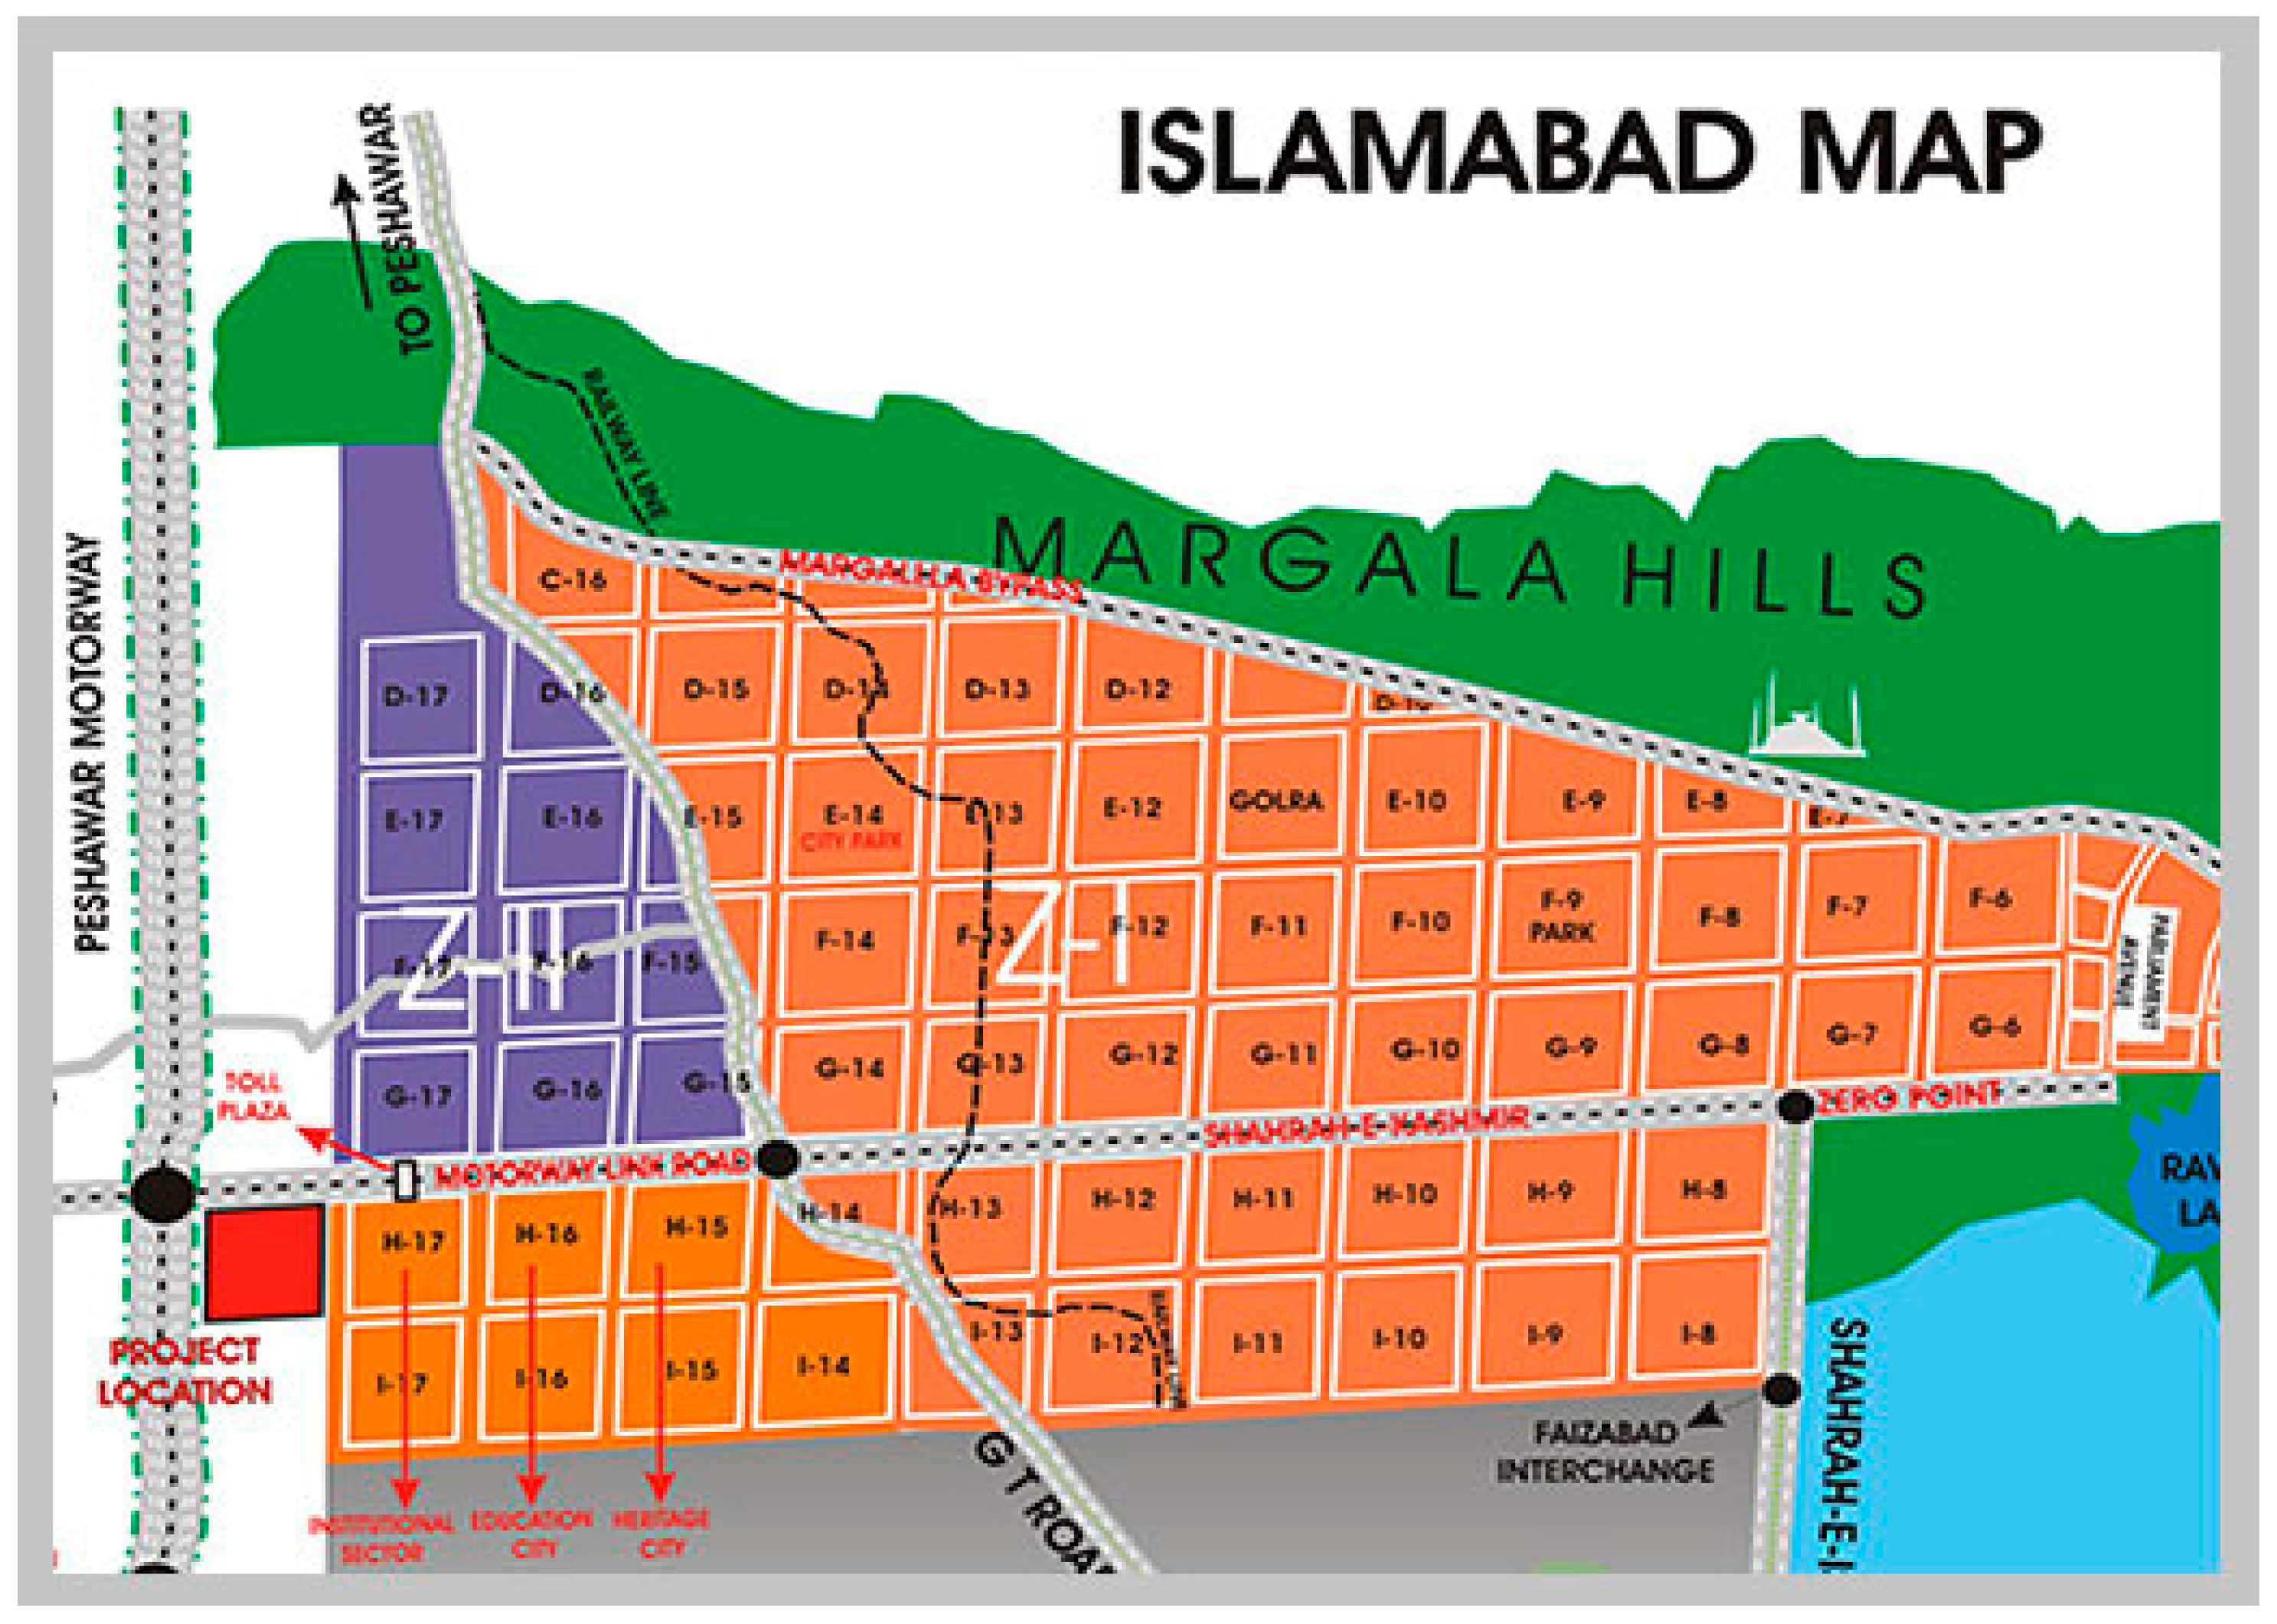
- Manahil Estate. Lay Out Map of Islamabad; Manahil Estate: Islamabad, Pakistan, 2017. Available online: https://i1.wp.com/manahilestate.com/wp-content/uploads/2014/02/islamabad_sectors.jpg (accessed on 3 September 2017).


| Sr. No | Socioeconomic Group | Sectors in Each Group | Population | Households Studied |
|---|---|---|---|---|
| 1 | High Income Group | E-7, 8, 9 | 121,527 | 15 |
| F5, 6, 7, 8, 10, 11, 12 and I-8 | ||||
| 2 | Middle Income Group | G-7, 8, 9, 10,11 | 172,093 | 15 |
| 3 | Low Income Group | I-10 and I-9 | 62,983 | 15 |
| Total | 18 sectors | 356,603 | 45 |
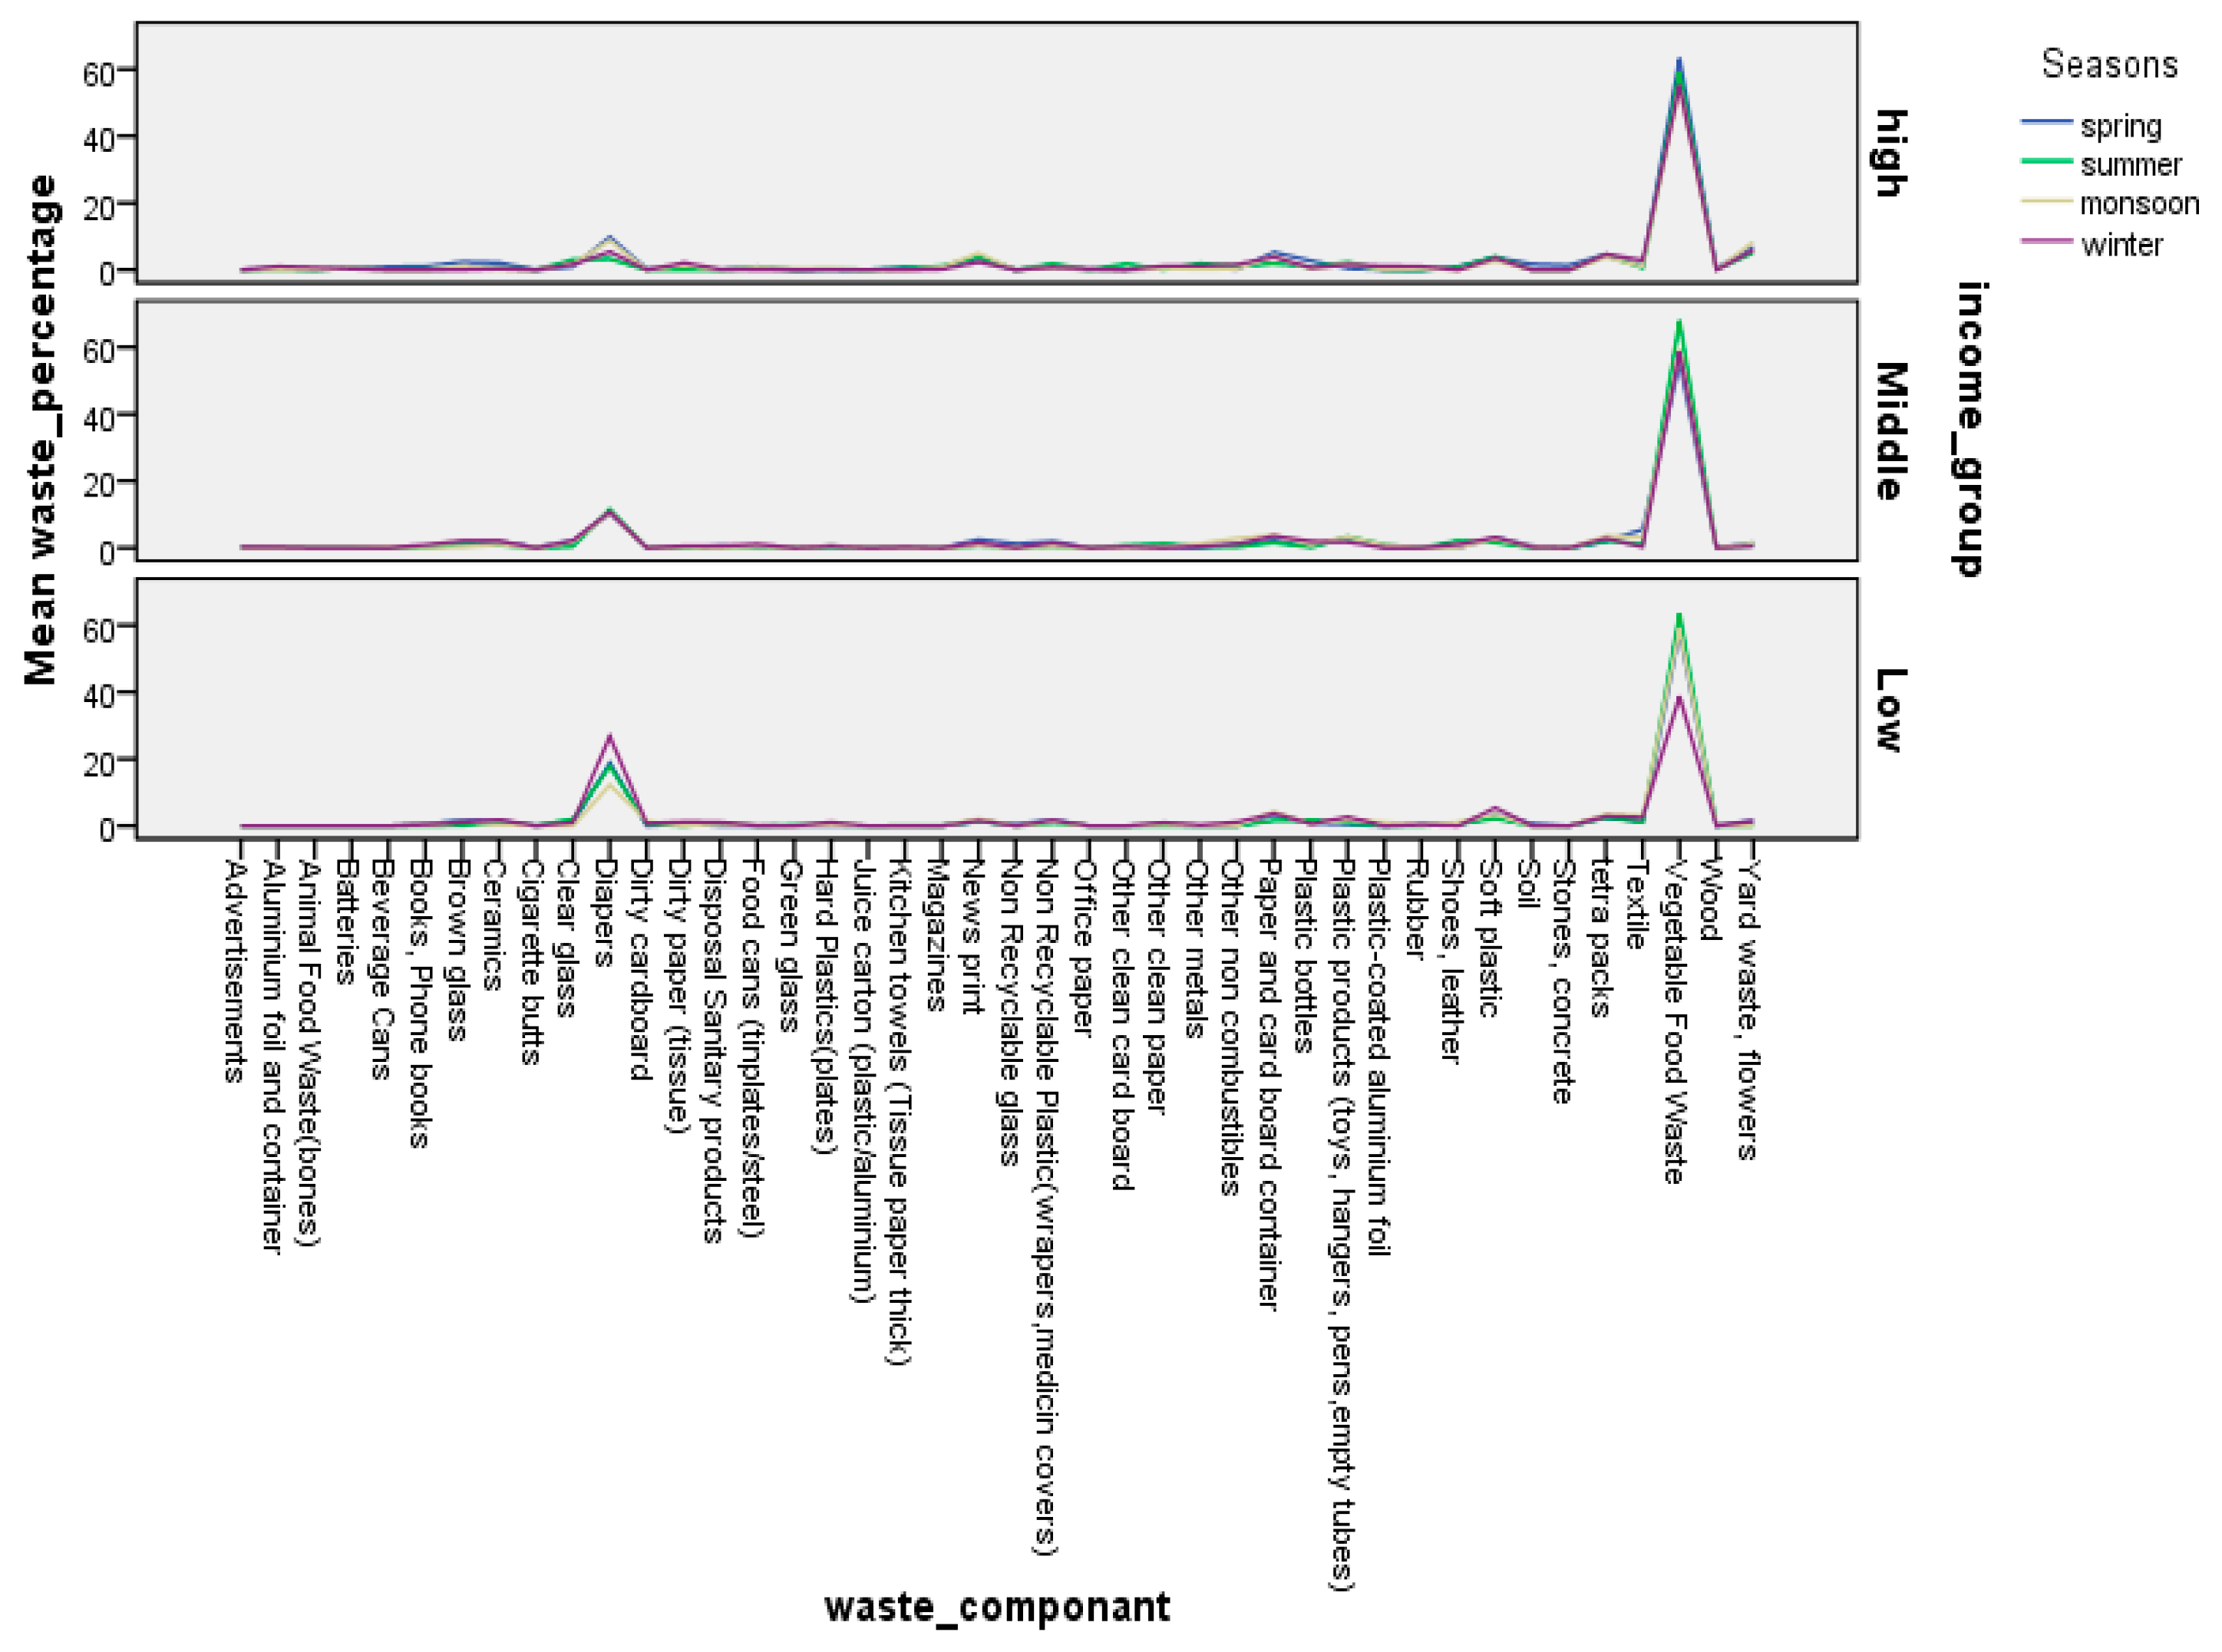
| Waste Components | High Income Group | Middle Income Group | Low Income Group | |||||||||||||
|---|---|---|---|---|---|---|---|---|---|---|---|---|---|---|---|---|
| Spring | Summer | Monson | Winter | Weighted | Spring | Summer | Monson | Winter | Weighted | Spring | Summer | Monson | Winter | Weighted | ||
| Organic Waste | Vegetable Food Waste | 0.845 | 0.459 | 0.260 | 0.524 | 0.495 | 0.311 | 0.374 | 0.338 | 0.429 | 0.376 | 0.192 | 0.197 | 0.183 | 0.163 | 0.183 |
| Yard Waste, Flowers | 0.093 | 0.040 | 0.040 | 0.056 | 0.052 | 0.009 | 0.004 | 0.008 | 0.003 | 0.005 | 0.005 | 0.000 | 0.000 | 0.006 | 0.003 | |
| Animal Food Waste(bones) | 0.000 | 0.000 | 0.000 | 0.007 | 0.002 | 0.000 | 0.000 | 0.000 | 0.000 | 0.000 | 0.000 | 0.000 | 0.000 | 0.000 | 0.000 | |
| News print | 0.047 | 0.030 | 0.024 | 0.022 | 0.029 | 0.014 | 0.003 | 0.004 | 0.011 | 0.007 | 0.005 | 0.005 | 0.007 | 0.007 | 0.006 | |
| Magazines | 0.009 | 0.009 | 0.004 | 0.002 | 0.006 | 0.000 | 0.000 | 0.000 | 0.000 | 0.000 | 0.000 | 0.000 | 0.000 | 0.000 | 0.000 | |
| Advertisements | 0.000 | 0.000 | 0.000 | 0.000 | 0.000 | 0.003 | 0.000 | 0.000 | 0.002 | 0.001 | 0.000 | 0.000 | 0.000 | 0.000 | 0.000 | |
| Books, Phone Books | 0.014 | 0.001 | 0.000 | 0.000 | 0.002 | 0.002 | 0.000 | 0.000 | 0.007 | 0.002 | 0.002 | 0.000 | 0.001 | 0.002 | 0.001 | |
| Office paper | 0.000 | 0.000 | 0.000 | 0.003 | 0.001 | 0.000 | 0.000 | 0.000 | 0.000 | 0.000 | 0.000 | 0.000 | 0.000 | 0.000 | 0.000 | |
| Paper | Other Clean Paper | 0.008 | 0.001 | 0.002 | 0.011 | 0.005 | 0.001 | 0.006 | 0.000 | 0.000 | 0.002 | 0.001 | 0.000 | 0.002 | 0.004 | 0.002 |
| Paper And Card Board | 0.070 | 0.015 | 0.019 | 0.037 | 0.030 | 0.012 | 0.009 | 0.022 | 0.026 | 0.017 | 0.011 | 0.005 | 0.013 | 0.016 | 0.011 | |
| Kitchen Towels | 0.010 | 0.004 | 0.000 | 0.000 | 0.003 | 0.000 | 0.000 | 0.000 | 0.002 | 0.001 | 0.000 | 0.000 | 0.000 | 0.000 | 0.000 | |
| Dirty Paper (Tissue) | 0.015 | 0.000 | 0.006 | 0.020 | 0.010 | 0.001 | 0.000 | 0.001 | 0.004 | 0.002 | 0.002 | 0.000 | 0.000 | 0.005 | 0.002 | |
| Dirty Cardboard | 0.004 | 0.000 | 0.000 | 0.000 | 0.001 | 0.000 | 0.000 | 0.000 | 0.000 | 0.000 | 0.000 | 0.002 | 0.004 | 0.003 | 0.002 | |
| Cigarette Butts | 0.000 | 0.000 | 0.000 | 0.000 | 0.000 | 0.002 | 0.000 | 0.000 | 0.000 | 0.000 | 0.000 | 0.000 | 0.000 | 0.000 | 0.000 | |
| Other Clean Card Board | 0.000 | 0.014 | 0.000 | 0.000 | 0.005 | 0.000 | 0.004 | 0.000 | 0.003 | 0.002 | 0.000 | 0.000 | 0.000 | 0.000 | 0.000 | |
| Tetra pack | Tetra Packs | 0.062 | 0.034 | 0.018 | 0.044 | 0.038 | 0.011 | 0.012 | 0.020 | 0.020 | 0.016 | 0.009 | 0.008 | 0.011 | 0.012 | 0.010 |
| Juice Carton (Carton/Plastic/Aluminum) | 0.000 | 0.000 | 0.000 | 0.001 | 0.000 | 0.000 | 0.000 | 0.000 | 0.000 | 0.000 | 0.000 | 0.000 | 0.000 | 0.000 | 0.000 | |
| Soft Plastic (Polythene. Gloves, Disposable Plates) | 0.050 | 0.031 | 0.013 | 0.033 | 0.031 | 0.017 | 0.009 | 0.015 | 0.023 | 0.016 | 0.011 | 0.007 | 0.010 | 0.023 | 0.013 | |
| Plastic Bottles | 0.037 | 0.007 | 0.002 | 0.006 | 0.010 | 0.004 | 0.001 | 0.006 | 0.014 | 0.007 | 0.003 | 0.005 | 0.002 | 0.003 | 0.004 | |
| Plastic | Hard Plastics (Plates) | 0.001 | 0.001 | 0.002 | 0.001 | 0.001 | 0.003 | 0.001 | 0.004 | 0.003 | 0.003 | 0.000 | 0.001 | 0.001 | 0.004 | 0.002 |
| Non Recyclable Plastic | 0.011 | 0.014 | 0.003 | 0.008 | 0.009 | 0.011 | 0.002 | 0.002 | 0.011 | 0.006 | 0.006 | 0.002 | 0.004 | 0.007 | 0.005 | |
| Plastic Products (Toys, Hangers, Pens, Empty Tubes) | 0.006 | 0.017 | 0.008 | 0.015 | 0.013 | 0.016 | 0.018 | 0.019 | 0.012 | 0.016 | 0.001 | 0.003 | 0.005 | 0.011 | 0.006 | |
| Diapers | Diapers | 0.131 | 0.026 | 0.042 | 0.051 | 0.052 | 0.058 | 0.064 | 0.060 | 0.078 | 0.067 | 0.062 | 0.055 | 0.038 | 0.112 | 0.071 |
| Textile | Textile | 0.015 | 0.005 | 0.005 | 0.027 | 0.013 | 0.031 | 0.006 | 0.018 | 0.002 | 0.010 | 0.004 | 0.003 | 0.010 | 0.011 | 0.007 |
| Disposal Sanitary Clothes | 0.000 | 0.000 | 0.000 | 0.002 | 0.001 | 0.003 | 0.001 | 0.000 | 0.004 | 0.002 | 0.000 | 0.003 | 0.002 | 0.005 | 0.003 | |
| Others | Wood | 0.007 | 0.002 | 0.000 | 0.000 | 0.002 | 0.000 | 0.000 | 0.000 | 0.000 | 0.000 | 0.000 | 0.000 | 0.001 | 0.000 | 0.000 |
| Shoes, Leather | 0.013 | 0.006 | 0.000 | 0.000 | 0.004 | 0.000 | 0.012 | 0.000 | 0.008 | 0.007 | 0.001 | 0.002 | 0.003 | 0.000 | 0.001 | |
| Rubber | 0.000 | 0.000 | 0.002 | 0.010 | 0.004 | 0.000 | 0.000 | 0.000 | 0.000 | 0.000 | 0.001 | 0.000 | 0.001 | 0.001 | 0.001 | |
| Glass | Clear Glass | 0.013 | 0.023 | 0.008 | 0.016 | 0.017 | 0.012 | 0.002 | 0.010 | 0.016 | 0.010 | 0.003 | 0.006 | 0.000 | 0.004 | 0.004 |
| Green Glass | 0.000 | 0.000 | 0.002 | 0.000 | 0.000 | 0.000 | 0.000 | 0.000 | 0.000 | 0.000 | 0.000 | 0.001 | 0.000 | 0.000 | 0.000 | |
| Brown Glass | 0.031 | 0.003 | 0.006 | 0.000 | 0.007 | 0.009 | 0.006 | 0.001 | 0.016 | 0.008 | 0.006 | 0.001 | 0.004 | 0.004 | 0.003 | |
| Non-Recyclable Glass | 0.000 | 0.000 | 0.000 | 0.000 | 0.000 | 0.007 | 0.001 | 0.000 | 0.000 | 0.001 | 0.001 | 0.000 | 0.000 | 0.000 | 0.000 | |
| Metals | Beverage Cans | 0.013 | 0.000 | 0.000 | 0.000 | 0.002 | 0.000 | 0.000 | 0.002 | 0.000 | 0.000 | 0.000 | 0.000 | 0.000 | 0.000 | 0.000 |
| Aluminum Foil And Container | 0.007 | 0.000 | 0.000 | 0.010 | 0.004 | 0.000 | 0.000 | 0.000 | 0.002 | 0.001 | 0.000 | 0.000 | 0.000 | 0.000 | 0.000 | |
| Food Cans (Tinplates/Steel) | 0.015 | 0.004 | 0.004 | 0.000 | 0.004 | 0.000 | 0.002 | 0.002 | 0.008 | 0.003 | 0.000 | 0.000 | 0.000 | 0.000 | 0.000 | |
| Plastic-Coated Aluminum Foil | 0.000 | 0.000 | 0.001 | 0.011 | 0.003 | 0.002 | 0.005 | 0.004 | 0.000 | 0.003 | 0.000 | 0.000 | 0.003 | 0.000 | 0.001 | |
| Other Metals | 0.007 | 0.015 | 0.001 | 0.011 | 0.010 | 0.000 | 0.002 | 0.007 | 0.004 | 0.003 | 0.000 | 0.000 | 0.000 | 0.001 | 0.000 | |
| Other Non-Combustibles | Soil | 0.023 | 0.000 | 0.000 | 0.000 | 0.003 | 0.003 | 0.000 | 0.002 | 0.002 | 0.001 | 0.002 | 0.000 | 0.000 | 0.000 | 0.000 |
| Stones, Concrete | 0.018 | 0.000 | 0.000 | 0.000 | 0.003 | 0.000 | 0.000 | 0.000 | 0.000 | 0.000 | 0.000 | 0.000 | 0.000 | 0.000 | 0.000 | |
| Ash, Coal | 0.000 | 0.000 | 0.000 | 0.000 | 0.000 | 0.000 | 0.000 | 0.000 | 0.000 | 0.000 | 0.000 | 0.000 | 0.000 | 0.000 | 0.000 | |
| Ceramics | 0.029 | 0.004 | 0.000 | 0.003 | 0.006 | 0.010 | 0.004 | 0.006 | 0.015 | 0.009 | 0.005 | 0.003 | 0.001 | 0.007 | 0.004 | |
| Batteries | 0.007 | 0.004 | 0.002 | 0.003 | 0.004 | 0.000 | 0.000 | 0.000 | 0.000 | 0.000 | 0.000 | 0.000 | 0.000 | 0.000 | 0.000 | |
| Other Non-Combustibles | 0.003 | 0.009 | 0.001 | 0.015 | 0.008 | 0.007 | 0.002 | 0.016 | 0.009 | 0.007 | 0.000 | 0.000 | 0.000 | 0.005 | 0.002 | |
| Total | Total | 1.608 | 0.776 | 0.475 | 0.949 | 0.890 | 0.556 | 0.550 | 0.568 | 0.733 | 0.612 | 0.335 | 0.310 | 0.306 | 0.416 | 0.346 |
| Seasons of the Year | Moisture Content Percentage | ||
|---|---|---|---|
| High Income Group | Middle Income Group | Low Income Group | |
| Spring | 72.3 | 72.4 | 71.63 |
| Summer | 90.59 | 89.09 | 90.77 |
| Rainy season | 88 | 88 | 88.8 |
| Winter | 92.95 | 78.5 | 74.99 |
| Average | 85.96 | 81.9975 | 81.5475 |
| Sum of Squares | df | Mean Square | F (Value) | Sig. | |
|---|---|---|---|---|---|
| Income | 0.054 | 2 | 0.027 | 59.658 | 0 |
| Components | 4.474 | 41 | 0.109 | 242.092 | 0 |
| Income * Components | 0.679 | 82 | 0.008 | 18.383 | 0 |
| Total | 6.173 | 1512 |
| (I) Income of the Socio-Economic Groups | (J) Income of the Socio-Economic Groups | Mean Difference (I-J) | Std. Error | Sig. | 95% Confidence Interval | |
|---|---|---|---|---|---|---|
| Lower Bound | Upper Bound | |||||
| High | Middle | 0.00833850 * | 0.00134 | 0 | 0.0052 | 0.01148 |
| Low | 0.01455692 * | 0.00134 | 0 | 0.01142 | 0.01769 | |
| Middle | High | −0.00833850 * | 0.00134 | 0 | −0.0115 | −0.0052 |
| Low | 0.00621842 * | 0.00134 | 0 | 0.00308 | 0.00936 | |
| Low | High | −0.01455692 * | 0.00134 | 0 | −0.0177 | −0.0114 |
| Middle | −0.00621842 * | 0.00134 | 0 | −0.0094 | −0.0031 | |
| Dependent Variable: Weight of the Components | |||||
|---|---|---|---|---|---|
| Sum of Squares | df | Mean Square | F | Sig. | |
| Season | 0.018 | 3 | 0.006 | 7.070 | 0.000 |
| Components | 4.474 | 41 | 0.109 | 125.542 | 0.000 |
| Season * Components | 0.171 | 123 | 0.001 | 1.602 | 0.000 |
| Total | 6.173 | 1512 | |||
| (I) Season of the Year | (J) Season of the Year | Mean Difference (I-J) | Std. Error | Sig. | 95% Confidence Interval | |
|---|---|---|---|---|---|---|
| Lower Bound | Upper Bound | |||||
| Spring | Summer | 0.00687789 * | 0.0021444 | 0.007 | 0.0013618 | 0.0123939 |
| Monsoon | 0.00913399 * | 0.0021444 | 0 | 0.0036179 | 0.01465 | |
| Winter | 0.0031782 | 0.0021444 | 0.449 | −0.002338 | 0.0086943 | |
| Summer | Spring | −0.00687789 * | 0.0021444 | 0.007 | −0.012394 | −0.001362 |
| Monsoon | 0.0022561 | 0.0021444 | 0.719 | -0.00326 | 0.0077722 | |
| Winter | −0.0037 | 0.0021444 | 0.311 | −0.009216 | 0.0018164 | |
| Monsoon | Spring | −0.00913399 * | 0.0021444 | 0 | −0.01465 | −0.003618 |
| Summer | −0.002256 | 0.0021444 | 0.719 | −0.007772 | 0.00326 | |
| Winter | −0.00595574 * | 0.0021444 | 0.028 | −0.011472 | −0.00044 | |
| Winter | Spring | -0.003178 | 0.0021444 | 0.449 | −0.008694 | 0.0023378 |
| Summer | 0.0036997 | 0.0021444 | 0.311 | −0.001816 | 0.0092157 | |
| Monsoon | 0.00595574 * | 0.0021444 | 0.028 | 0.0004397 | 0.0114718 | |
| Sr. No | Waste Fractions | Islamabad City | Gulberg Town (Lahore) [56] | Aziz Bhatti Town (Lahore) [57] | DGB Town (Lahore) [16] |
|---|---|---|---|---|---|
| % | % | % | % | ||
| 1 | Paper | 7.26 | 4.13 | 6.38 | 5.04 |
| 2 | Glass | 2.79 | 4.1 | 2.3 | 2.19 |
| 3 | Ferrous Metals | 0.64 | - | 0.7 | 0.02 |
| 4 | Nonferrous Metals | 1.04 | 0.4 | 0.4 | 0.47 |
| 5 | Rigid Plastic | 3.11 | 4.11 | 1.9 | 5.55 |
| 6 | Film Plastic | 4.38 | 4.22 | 5 | 12.94 |
| 7 | Organic | 59.95 | 68.07 | 63.8 | 67.02 |
| 8 | Textile | 1.81 | 4.19 | 0.4 | 1 |
| 9 | Others | 19.2 | 10.78 | 19.12 | 5.77 |
| 10 | Total | 100.18 | 100 | 100 | 100 |
© 2017 by the authors. Licensee MDPI, Basel, Switzerland. This article is an open access article distributed under the terms and conditions of the Creative Commons Attribution (CC BY) license (http://creativecommons.org/licenses/by/4.0/).
Share and Cite
Zia, A.; Batool, S.A.; Chauhdry, M.N.; Munir, S. Influence of Income Level and Seasons on Quantity and Composition of Municipal Solid Waste: A Case Study of the Capital City of Pakistan. Sustainability 2017, 9, 1568. https://doi.org/10.3390/su9091568
Zia A, Batool SA, Chauhdry MN, Munir S. Influence of Income Level and Seasons on Quantity and Composition of Municipal Solid Waste: A Case Study of the Capital City of Pakistan. Sustainability. 2017; 9(9):1568. https://doi.org/10.3390/su9091568
Chicago/Turabian StyleZia, Amina, Syeda Adila Batool, Muhammad Nawaz Chauhdry, and Soniya Munir. 2017. "Influence of Income Level and Seasons on Quantity and Composition of Municipal Solid Waste: A Case Study of the Capital City of Pakistan" Sustainability 9, no. 9: 1568. https://doi.org/10.3390/su9091568