Diverse Effects of Consumer Credit on Household Carbon Emissions at Quantiles: Evidence from Urban China


1
School of Finance, Capital University of Economics and Business, Zhangjialukou 121, Fengtai Distinct, Beijing 100070, China
2
School of Economics and Management, Beihang University, Xueyuan Road, Haidian Distinct, Beijing 100191, China
*
Authors to whom correspondence should be addressed.
Sustainability 2017, 9(9), 1563; https://doi.org/10.3390/su9091563
Submission received: 27 June 2017
/
Revised: 27 August 2017
/
Accepted: 30 August 2017
/
Published: 2 September 2017
Abstract
:This paper surveys the diverse effects of consumer credit on household carbon emissions (HCEs) based on consumption patterns revealed by urban Chinese survey data. Based on the foundation of existing literature, consumption patterns and influential factors are carefully chosen to build empirical models that apply Heteroscedasticity-consistent covariance matrix estimation and quantile regression. The study finds that short-term consumer credit and credit card limits (representing daily consumption) have effects on HCEs at all quantiles, but mortgages (representing long-term consumer credit) only have effects at high quantiles. Consumption categories have distinct effects on HCEs at different quantiles. The effects of mortgages on HCEs occur mainly through the consumption of housing and facilities as well as through the consumption of medical care and transportation, while the effects of short-term consumer credit and credit card limits on HCEs occur through almost all consumption categories. These findings contribute to knowledge of the determinants of HCEs and provide a theoretical basis for consumer financial mechanisms to cut HCEs.
1. Introduction
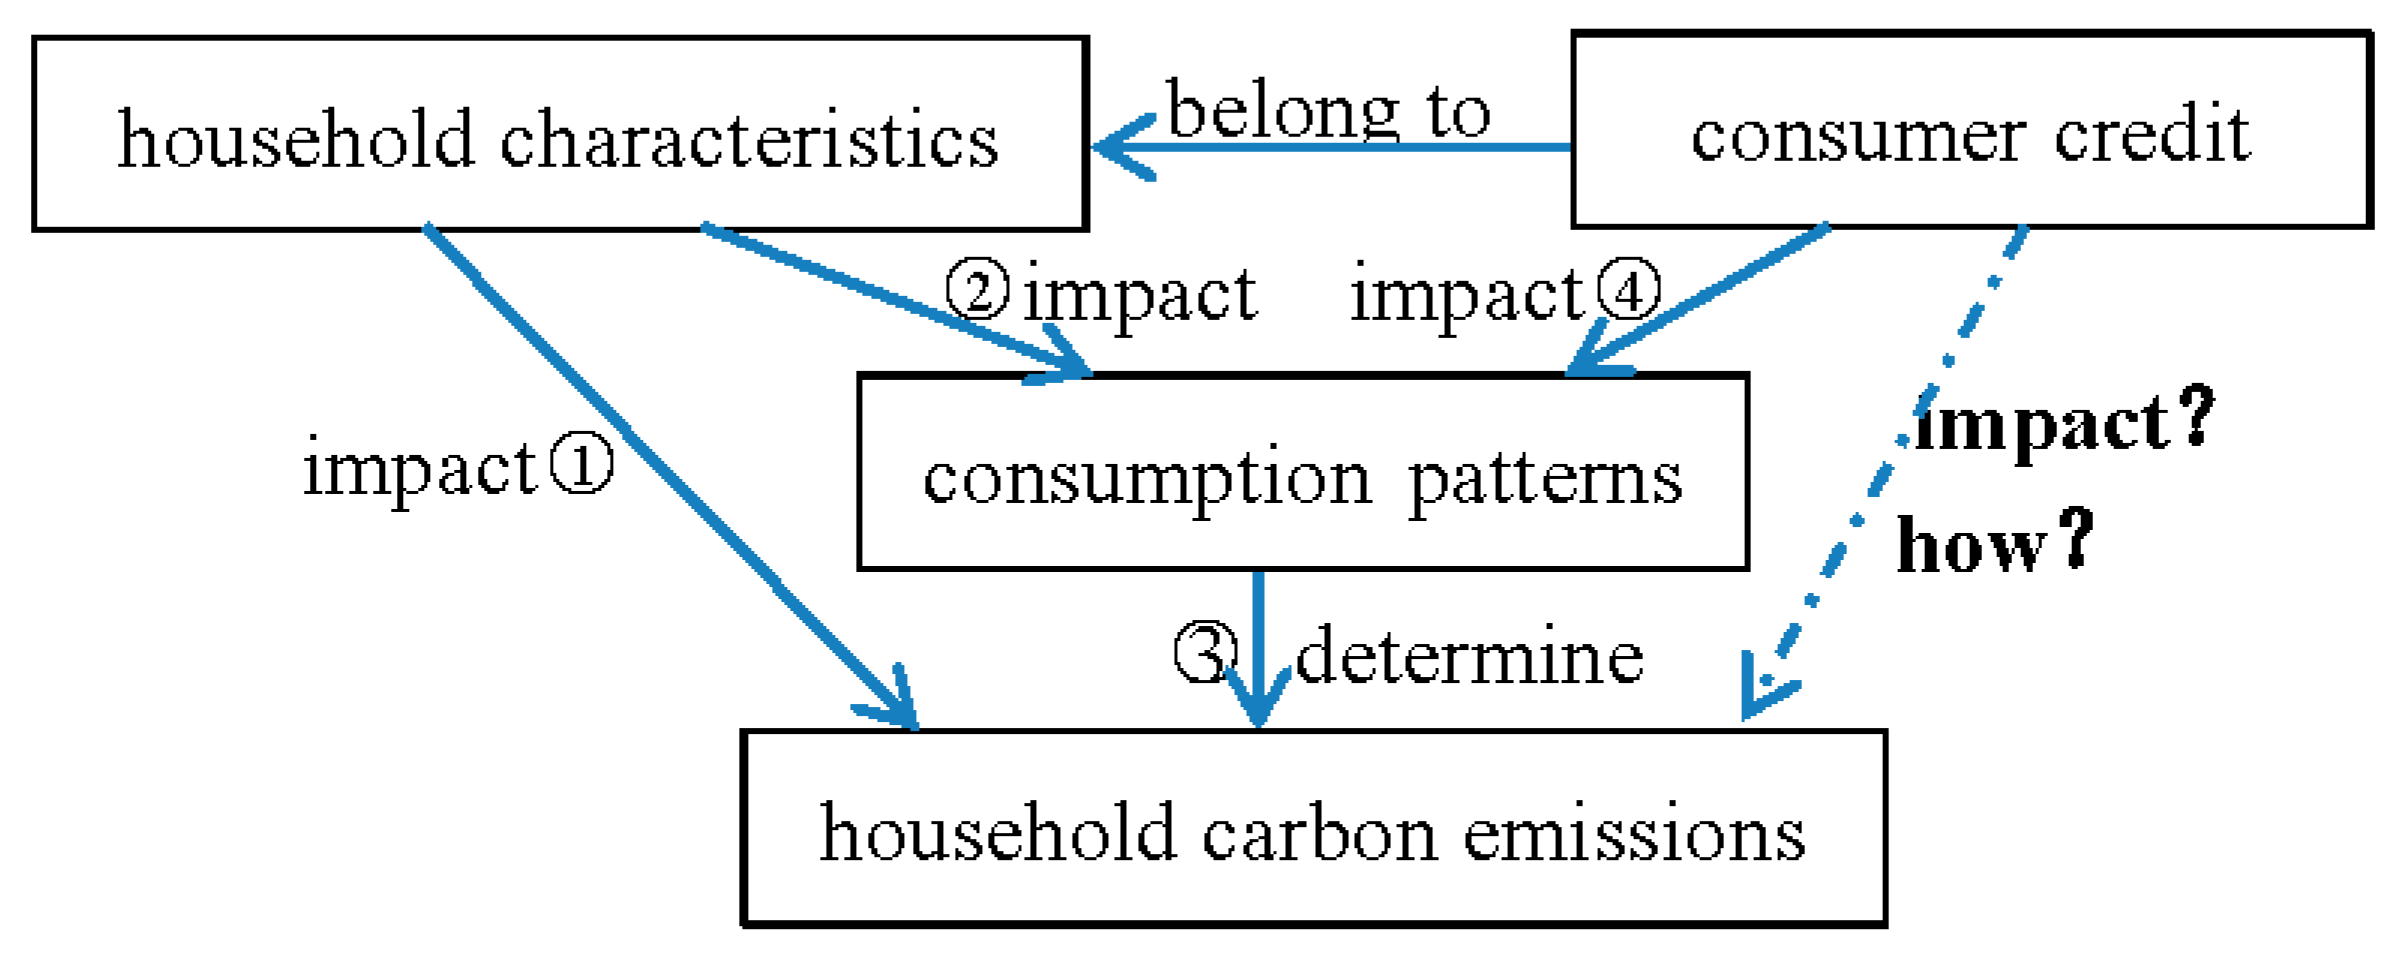
As carbon emissions sourced by the household sector are clearly important to climate change, many scholars have studied the features and determinants of household carbon emissions (HCEs) and proposed mitigation policies accordingly. Scholars, such as Zha et al. [1], Han et al. [2] and Perobelli et al. [3], have shown that household economic and demographic characteristics have impacts on HCEs. These characteristics are household income, size, location, age, employment, etc., among which income is found to be the key factor. The logical relation of household characteristics and HCEs is shown by the first arrow in Figure 1. The above studies suggest that targeted policies of energy conservation and emissions reduction should be applied to households with different characteristics.
How do household economic and demographic characteristics affect HCEs? To answer this question, Bin and Dowlatabadi [4] have introduced the Consumer Lifestyle Approach, which implies that external factors affect HCEs by way of distinct lifestyles. Jackson and Papathanasopoulou [5] have tracked the fossil resource requirements attributable to eight high-level functional purposes and found that recreation and entertainment, and commuting and business travel cause the bulk of the increase in fossil resource requirements. Furthermore, Weber and Matthews [6] have studied the growing importance of the variation between households of different income levels and demographics on household carbon footprint. Longhi [7] and Xu et al. [8] have studied how consumption patterns determine HCEs. It suggests that households should be incentivized to change their high-consumption behaviors into low-carbon behaviors as part of the process of social and economic development.
Moreover, Rosas et al. [9] have evaluated commercial energy using and related CO2 emissions of Mexican households by income deciles and found the significant differences in amount and structure of HCEs for households with different income levels. Brännlund and Ghalwash [10], Duarte et al. [11], Dai et al. [12], Zhu et al. [13] and Liang et al. [14] have noticed the correlations between income, consumption patterns and HCEs. Furthermore, Minx et al. [15], Rausch et al. [16], Shigetomi et al. [17], Estiri [18] and Belaïd [19] have studied the effects of other factors, such as aging, urbanization and household size, on HCEs by way of consumption patterns. The logical relations of household characteristics, consumption patterns and HCEs are shown by the second and third arrows in Figure 1. These studies further suggest that it should induce households to change their consumption and carbon emission behaviors by different ways according to their economic or social characteristics.
As financing impacts on household economic and social behaviors by many means, we consider whether financing impacts on HCEs by consumption behaviors. The relation between consumer credit and household consumption has been widely noticed by many scholars. Magri et al. [20], for example, have pointed that household uses credit to increase their welfare by consumption smoothing according to life cycle theory, and households with different social or economic characteristics have different demands in consumer credit. The logical relation of consumer credit and household consumption is shown by the fourth arrow in Figure 1. As the relation between consumption patterns and HCEs has been discussed in the literature, shown by the third arrow in Figure 1, it speculates whether consumer credit has impacts on HCEs by consumption patterns. Knowing this will be helpful to rouse households to change consumption patterns by means of consumer finance. However, because of the current lack of empirical data and authoritative conceptual models concerning the relationship between consumer credit and sustainable consumption [21], only a few papers have been devoted to this topic.
This paper studies the effects of consumer credit on HCEs. Moreover, it supposes the effects of consumer credit on HCEs are diverse according to the terms of consumer credit and realized by way of consumption patterns. Brady [22] has found increases in consumer credit have made consumption increase in some periods when the increase speed of consumption is less than that of income. Weng et al. [23] have discussed why young consumers are overspending through the use of credit cards. Gu et al. [24] has found that securitization of mortgage loans, which adds the mortgage amount, has a positive effect on personal consumption smoothing. These studies have indicated the distinct effects of consumer credit with different terms on consumption. This is the reason to suppose that consumer credit with different terms has different impacts on HCEs. Further, Rahman [25] has found that using household goods borrowed by consumer credit helps people satisfy their desired interest in different consumption categories. Thus, we also suppose consumer credit affects HCEs by both the amount and the structure of consumption, i.e., by consumption patterns.
This paper first theoretically discusses the correlation between consumer credit and consumption patterns, which determines HCEs. In the empirical analysis, it builds econometric models to study their effects on household consumption patterns and CO2 emissions. As consumer credits with different terms have distinct relations to household consumption, it chooses short-term consumer credit, mortgage debt (representing long-term consumer credit) and credit card limits (representing daily consumption) as the independent variables. Then, it uses micro household data from urban China and the methods of heteroskedasticity-consistent covariance matrix estimator and quantile regression to examine these econometric models. Moreover, it uses consumption amount as the mediation variable to study the function of consumption as related to the effect of consumer credit on HCEs. This paper contributes to knowledge of the determinants of CO2 emissions and provides a theoretical basis for formulating distinct household mitigation policies using the tool of consumer finance.
This paper is structured as follows: Section 2 proposes the theoretical effects of consumer credit on HCEs based on consumption patterns and details the econometric methods used to examine this hypothesis. Section 3 introduces the survey data and the variables used in this paper. Section 4 first reports the effects of consumer credit on HCEs using the results of the OLS regression and then analyzes the diverse effects of consumer credit on HCEs at different quantiles. Section 5 empirically discusses the intermediary role of consumption patterns in the diverse effects of consumer credit on HCEs. Section 6 concludes.
2. Empirical Specification
2.1. Impact Factor Consideration
A household has distinct utilities from different consumption contents. According to Kaplan and Violante [26], which sets a utility function with two consumption categories based on the Epstein–Zin–Weil utility function, a household’s utility function with more than one consumption categories can be set as follows:
where is the household ’s utility at the time of , is the household ’s expenditure of consumption category at the time of , is the portion of consumption category in the household ’s total consumption expenditure, is the household ’s discount rate of the future consumption’s utility expectation, is the probability that the household believes it will continue to exist at time , is the relative risk aversion coefficient of the household , and is the household ’s inter-temporal elasticity of substitution. As households have different economic and demographic characteristics [4], both their consumption amounts, represented by , and their distributions in each consumption category, represented by , are distinct.
Suppose a household has the probability to get limited financing for different consumption categories. According to Brady [22], there can be the new budget constraint for the household utility function with more than one consumption categories:
where is the loan amount of household for the consumption category at the time of , and is the other factors for household excepting of income and loan. This budget constraint suggests that consumer credit as well income and wealth change will have impacts on household total consumptions and each consumption category.
Consumer credit reduces households’ financing constraints and improves the ability to regulate consumption across present and future periods [27,28]. As there is dispute about the endogeneity in the relation of consumer credit and consumption, we emphasize the correlation between consumer credit and household consumption. Different forms of consumer credit, including mortgages, auto loans, education loans and medical loans, have different repayment terms. Based on their terms and uses, this paper classifies forms of consumer credit into long-term, short-term and daily credit, each of which exerts different financial constraints to households. Some scholars, such as Chen and Liao [29], have suggested that credit constraints have different effects on households’ consumption of durables or non-durables; thus, we propose that each type of consumer credit has a distinct relation with categories of household consumption. This can be illustrated by Model (1) and Model (2). Model (1) suggests that household chooses each consumption category to maximize its utility, while Model (2) suggests that the expenditure of each consumption category is limited by consumer credit the household can get. Consider
where is household ’s expenditure in consumption category at the time of , is the determining function of the household consumption category , is the factor of consumer credit at the time of , and is the other factor determining household consumption category .
HCEs come from or are embedded in all consumption activities, such as food, personal transport, communications, education, recreation, health and hygiene [30]. According to differences in consumption amounts and structures, households have distinct distributions of consumption categories with different carbon intensities [31]. This indicates that per unit household expenditure will induce different CO2 emissions due to the different carbon intensities of different types of consumption [32,33]. The CO2 emissions from each consumption category are equal to the amount spent multiplied by the carbon intensity [34]. Consider
where is household ’s CO2 emissions consumption embedded in consumption category at the time of , is the carbon intensity of consumption category , and is the household expenditure in consumption category at the time of . Then, household ’s total CO2 emissions at the time of can be calculated as follows:
Model (5) suggests that the level of HCEs is determined by household consumption patterns and by the carbon intensities of the consumption categories.
According to Models (3) and (4),
From the perspective of consumption, the carbon intensity of each consumption category remains consistent in the short term, thus supposing that is constant. As a result, household ’s CO2 emissions embedded in consumption category are determined by the factor of consumer credit () and the other factors (). Consider
where is the determining function of household ’s CO2 emissions embedded in consumption category . Model (7) directly suggests that consumer credit has diverse effects on HCEs embedded in the consumption categories.
According to Models (3)–(5),
As is supposed to be constant, Model (8) suggests that the HCEs are determined by the factor of consumer credit () and the other factors (). Consider
where is the determining function of household ’s total CO2 emissions. Model (9) directly suggests that consumer credit has effects on total household CO2 emissions.
2.2. Empirical Methods
According to the relationships among consumer credit, consumption patterns and HCEs as shown in Figure 1, how consumer credit relates to consumption patterns and how consumption patterns affect HCEs also deserve attention when studying the effect of consumer credit on HCEs. We first use detailed mortgage data representing households’ long-term consumer credit, as well as short-term consumer credit and credit card limits referring to daily consumption as the independent variables to analyze the determination of HCEs. Model (1) shows that household maximizes its utility by choosing each consumption category, which is determined by different types of consumer credit, as illustrated in Model (2). This relation of consumption categories and consumer credit types is illustrated by Model (3). As Model (4) suggests consumption categories determine HCEs, we eventually deduce Model (9) to suggest the impact of consumer credit on HCEs. Empirically, we suppose there is a logarithmic–linear relationship between consumer credit and HCEs and build Model (10):
where is the per capita carbon emissions of household is the vector of the variables concerning household consumer credit, and is the vector of the control variables. Whether a control variable is in the logarithmic form in this formulation is determined by its value characteristics. Model (10) is used to study the effect of consumer credit on HCEs.
Further, to study the relation of consumer credit and household consumption patterns, we use household per capita expenditure as the dependent variable to build Model (11):
This model allows us to study the relations of long-term, short-term and daily consumer credit and households’ total expenditures. We also use household per capita expenditure in each consumption category as the dependent variable to build models to study the relations of consumer credit and household expenditure in each consumption category. For example, to study the relation of consumer credit and household expenditure on food (), we build Model (12):
where is the per capita expenditure on food of household .
Then, we analyze the effect of consumption patterns on HCEs. We build Model (13):
where is the per capita carbon emissions of household , and . is household per capita expenditures in the consumption categories. Model (13) will suggest how each consumption category determines HCEs; this will imply how consumption patterns impacts on HCEs.
We use heteroskedasticity-consistent covariance matrix estimator and the Quantile regression to examine these econometric models. Heteroskedasticity-consistent covariance matrix estimator, introduced by White [35], is consistent in the presence of heteroskedasticity, but does not rely on a specific formal model of the structure of the heteroskedasticity. Thus, even when heteroskedasticity cannot be completely eliminated, proper inferences can be drawn. Quantile regression, introduced by Koenker and Bassett [36], estimates a range of marginal impacts for different quantiles of the distribution for the dependent or “response” variable. Compared with OLS, quantile regression provides a significantly more complete picture of the true impact of the explanatory variable [37].
We also use the models of mediation [38] to suggest the mediation of consumption amount in the impact of consumer credit on household carbon emissions. Based on Model (9), it first estimates the values of household per capita consumption according to the variables of household social and economic characteristics. Then, using the estimated values of household per capita consumption, it builds Model (12):
At last, it estimates Model (14) and compares this empirical result and the empirical result of Model (10). According to the significance and change of the coefficients estimated based on Models (14) and (10), it can evaluate the mediation effect of consumption amount as related to the effect of consumer credit on HCEs.
After knowing the mediation of consumption amount, the role of each consumption structure in the relation of consumer credit and HCEs is noticed. When modeling HCEs based on Models (10)–(14), we further include a vector of control variables for the percentage that each consumption category contributes to total household consumption. The vector is expressed as (in a factored form for simplicity),
where is the vector of the percentage that consumption category contributes to total consumption for household at the time of , is the vector of the consumption category for household at the time of , and is the total consumption for household at the time of . This will control for a fact that households choose to allocate their money differently, i.e., the structure of household consumption, which would lead to different levels of carbon emissions. We chose to use percentage points rather than Yuan levels (or log of Yuan levels): (1) to limit the extent of collinearity between vector 𝑪 and other important independent variables; and (2) because the actual amount of expenditure is not of concern but rather how household allocates its income.
3. Data and Variables
3.1. Data Sources
The survey data we use in this paper come from the Consumer Finance Survey performed in 2011 by the China Center for Financial Research (CCFR), Tsinghua University. The 5746 samples selected cover representative households in urban China from 24 cities all around the country. The sample households’ local distribution and their statistical characteristics of per capita income and expenditures are shown in Table A1 in Appendix A. The diverse local distribution of the sample sources shown in Table A1 in Appendix A makes this article have common meanings, especially in urban China.
3.2. Variables
Household per capita CO2 emissions are the main dependent variable of this study. We first calculate household per capita CO2 emissions embedded in each consumption category according to Model (4) in Section 2.1 and then add up them according to Model (5) in Section 2.1 to get household per capita CO2 emissions embedded in all consumption categories. Household per capita CO2 emissions embedded in each consumption category are equal to household per capita expenditure on each consumption category multiplied by the carbon intensities of the relevant consumption category. The carbon intensities of consumption categories can be determined according to Liu et al. [39], who have calculated the expenditures and carbon emissions of all consumption categories in China (shown in Table 1). Then, we calculate HCEs according to Model (5) and the expenditures of household consumption categories; their definitions and summary statistics are shown in Table A2 in Appendix A.
Moreover, household per capita expenditures and their distributions in each consumption category are the dependent variables when analyzing the effects of household characteristics on household consumer patterns, while they are independent variables when analyzing the effects of household consumer patterns on HCEs. We also use household per capita expenditures as the mediation variable to study the mediation effect of consumption as related to the effect of consumer credit on HCEs.
Household mortgage, short-term consumer loan and credit card limit are the independent variables, which are used to examine the effects of long-term, short-term and daily consumer credit on HCEs, correspondingly. Choosing household mortgage as the independent variable is done according to Gu et al. [24], who refer to the relation of mortgage amount and personal consumption. Choosing short-term consumer loan is done according to Brady [22] and Rahman [25], who found the relation of short-term consumer credit and consumption, and Weng et al. [23], who refer to the effect of credit cards on consumers. To test the robustness of this relation, we also choose household monthly loan payments and monthly payments for short-term consumer loans as the substitution variables for mortgage and short-term consumer credit. The definitions of the independent and substitution variables are shown in Table 2, and their descriptive statistical analyses are shown in Table A3 in Appendix A.
The control variables are household (per capita) income, income expectation, size, marriage status, gender of head of household, education, house ownership and car ownership. The definitions of these variables are also shown in Table 2. Income, income expectation, house ownership and car ownership are the economic factors affecting HCEs. The effect of income on HCEs is noticed widely, such as Duarte et al. [40], Büchs and Schnepf [41], Han et al. [2] and so on. They generally have found that income has a positive but usually un-linear impact on HCEs. As a result, we also use square of income to analyze if the knee point exists for income to impact on HCEs. We further use income expectation as one of the control variables because income expectation may have relations to consumption and then on HCEs according to the permanent income hypothesis. The effects of house ownership and car ownership on HCEs have been discussed by Han et al. [2] and Xu et al. [8].
The social factors affecting HCEs are household size, marriage, gender of head of household and education. Household size is another importance factor affecting HCEs; the study includes Jones and Kammen [42], Qu et al. [43], Han et al. [2], Xu et al. [8] and so on and they have found the negative effect of household size on HCEs. The effect of marriage on HCEs has been discussed by Han et al. [2] and Xu et al. [8]. The effect of gender on HCEs has been discussed by Streimikiene and Volochovic [44], Büchs and Schnepf [41], Andreaus [45] and Murray and Mills [46], but they have different conclusions. The effect of education on HCEs has been discussed by Dai et al. [12], Liu et al. [47], and Lee and Lee [48].
As shown in Table A4 in Appendix A, the Variance Inflation Factor (VIF) of the independent and control variables have an average value of 3.31. Meanwhile, all the variables’ VIFs are below 10. The empirical experiences suggest that no significantly multicollinearity between the independent and control variables exists, and they can be cooperatively used in an empirical model.
4. Empirical Results and Analysis
We use heteroscedasticity-consistent covariance matrix estimator [35] to estimate Model (10). Heteroscedasticity-consistent covariance matrix estimator is developed from OLS regression and has the advantage of overcoming the heteroscedasticity of regression analyses of large samples. The results shown in Column (1) of Table 3 illustrate that the three variables we choose to represent long-term, short-term and daily consumer credit (mortgage, short-term consumer credit and credit card limit, respectively) all have positive effects on HCEs.
Moreover, to confirm the confidence of this result, we replace or reduce some independent variables of Model (10). The estimated results are also shown in Table 3. Columns (2) and (3) in Table 3 confirm that household mortgage has positive effects on HCEs. Columns (2) and (4) in Table 3 confirm that short-term consumer credit has a positive effect on HCEs. Column (5) in Table 3 confirms that credit card limit has positive effects on HCEs. Column (6) of Table 3 shows that household monthly loan payment has positive effect on HCEs, and Column (7) of Table 3 shows that monthly payments for short-term consumer credit have positive effects on HCEs. The two results again confirm that household mortgage and short-term consumer credit have positive effects on HCEs. Consequently, consumer credit, represented by mortgage, short-term consumer credit and credit card in this paper, has impacts HCEs. HCEs will be reduced if green finance policy is applied to consumer finance.
Further, Table 3 shows the distinct coefficients of the effect of consumer credit on HCEs. We need to explain them according to the data feathers. We use the interval data to reflect the level of household mortgage and short-term consumer credit, as shown in Table 2. When household short-term consumer credit rises by one level, household per capita carbon emissions will rise 5.25% according to Column (4) in Table 3. This result should be noticed enough in mitigation policies. When household mortgage rises by one level, household per capita carbon emissions will have a non-negligible 0.89% rise according to Column (3) in Table 3. According to Column (4) in Table 3, and the formal of the variable of credit card limit, it suggests that a 1% rise of credit card limit will cause a 0.012% rise of household per capita carbon emissions. Credit card, however, are usually yes or no selections for a household. On this condition, the change of credit card limit will be nearly boundless, which will cause household per capita carbon emissions to change greatly. Accordingly, the effects of all the three kind consumer credit, mortgage, short-term consumer credit and credit card usage, should not be neglected.
Table 3 also shows the effects of the other social and economic factors on HCEs. In the economic factors, household per capita income has positive impacts on HCEs. This result is consistent to the conclusions of most scholars such as Zha et al. [1], Golley and Meng [34] and Perobelli et al. [3]. We further analyze the effects of income expectation and square of income and the result is shown in Table A5 in Appendix A. Table A5 shows that the square of household per capita income has significant impact on household per capita carbon emissions. Using the coefficients from the first column of Table A5, it appears that household per capita income reaches its max relationship to HCEs at 226,984 Yuan. According to the 2011 survey data we use, household per capita income is less than 70,000 Yuan in urban China, as shown in Table A1, which means that the knee point for income to have a negative impact on HCEs will not appear soon in urban China. However, using a purchasing power parity exchange rate for 2011 from the OECD of 0.2852 USD per Yuan, this would translate to $64,736, which is an interesting result for the US. Meanwhile, Table A5 shows that income expectation has no significant impacts on HCEs. Car ownership has a positive effect on HCEs, but housing ownership has a negative one, as shown in Table 3. The reason for this result is that household owning car or cars will emit more on the direct carbon emissions as the household members use their cars for travel, while the expenditure in housing ownership squeezes out that in household other consumption and then reduce HCEs.
In the social factors, Table 3 shows that household size has negative effect on HCEs. This is because as the size of a household increases, the HCEs are spread out amongst more people and a household uses its resources more efficiently. Marriage also has negative effects on HCEs, because two or more people together in a household use their resources more efficiently than the separate ones. Gender of head of household has a positive effect on HCEs, which implies that men are less thrifty than women. Education has positive effect on HCEs, because persons with a high degree of education do not have enough low-carbon intuitions at nowadays. Adversely, education adds the amount and content of people’s consumption, and then increases the carbon emissions of households [2].
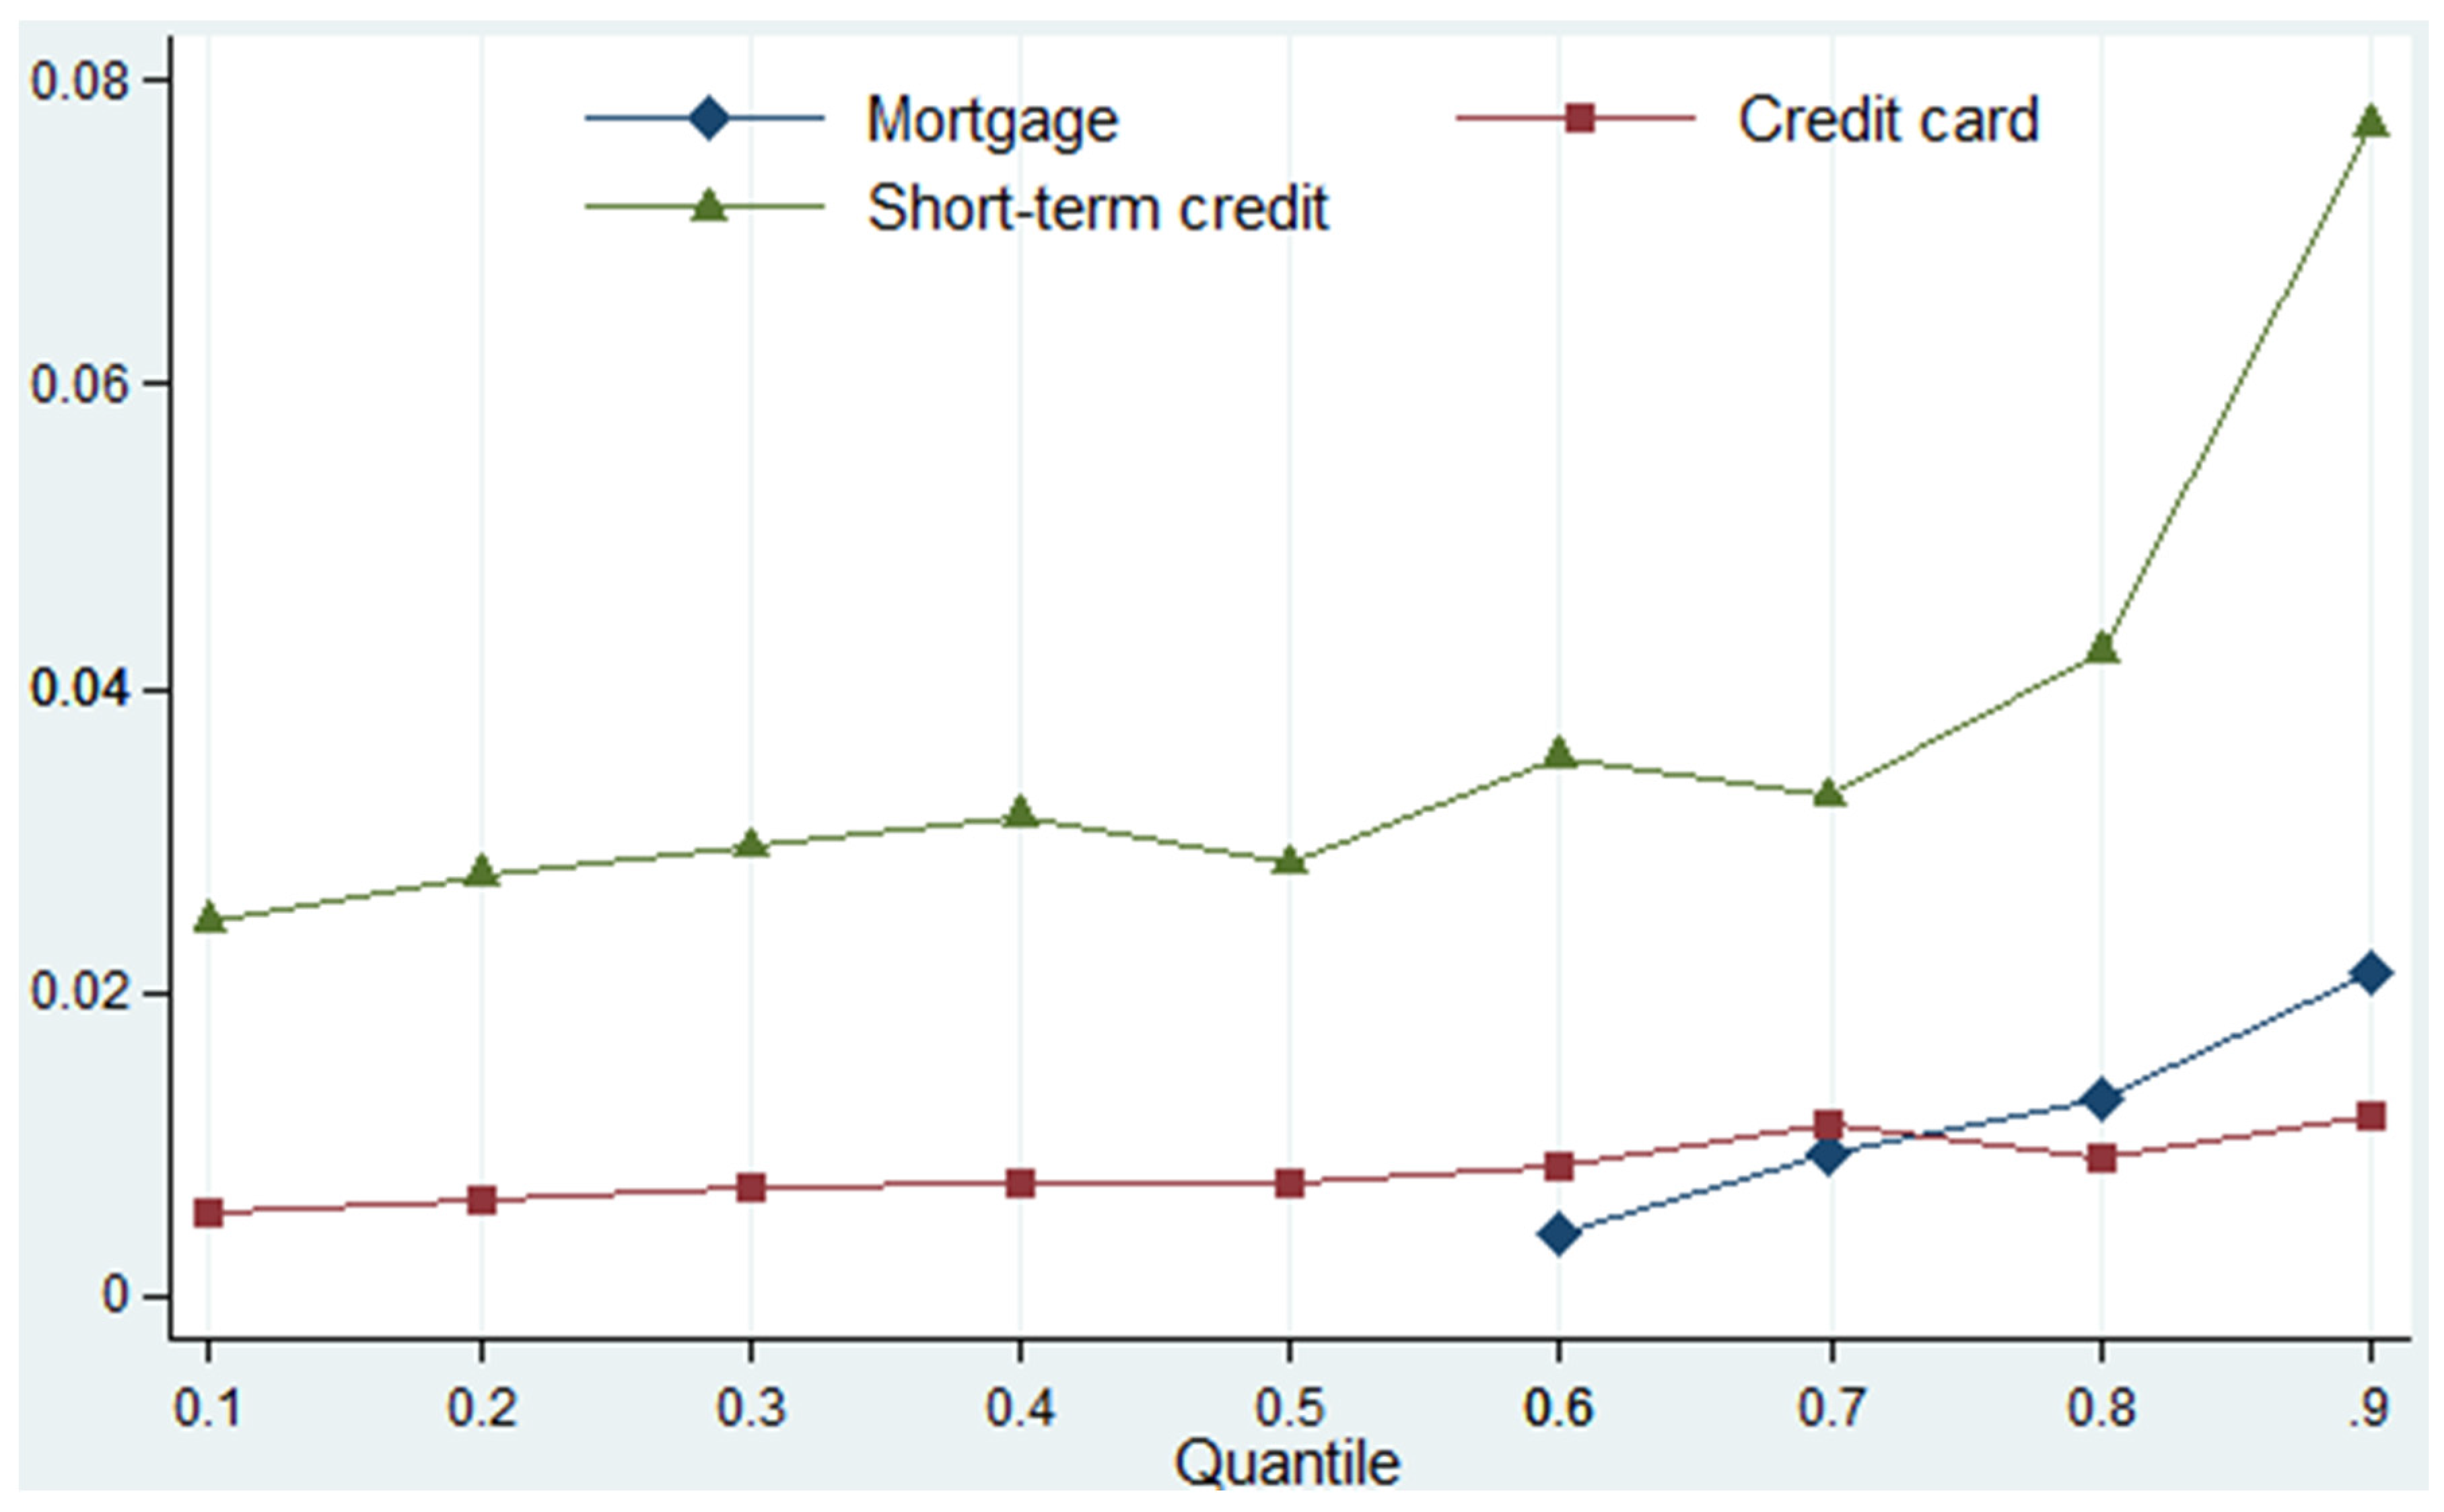
To reveal the extreme impact at different percentiles, we then use the quantile regression method [36] to estimate the diverse effects of household mortgage, short-term consumer credit and credit card limit on household per capita carbon emissions at different quantiles based on Model (10). The results are shown in Table 4, and Figure 2 illustrates this result more vividly. Figure 2 shows that household mortgage has no significant effects on household per capita carbon emissions at quantiles below 0.5, while it has significant effects on household per capita carbon emissions at quantiles above 0.5, and the affecting coefficients increase when quantile increases. Short-term consumer credit and credit card limit both have significant effects on household per capita carbon emissions at all the quantiles, and their affecting coefficients increase when quantile increases. Especially, the affecting coefficients of the three consumer credit factors at the 0.9 quantiles are much higher than those at the other quantiles. These results suggest that consumer credit has distinct impacts on HCEs at quantiles. As a result, diverse mitigation policies should be adopted when reducing HCEs by mean of consumer finance.
5. Discussion
Section 4 showed the suggested effects of long-term, short-term and daily consumer credit on HCEs, represented by mortgages, short-term consumer credit and credit card limits. This section further discusses the workings of these effects. As in Section 2, we have proposed that the effects of consumer credit on household carbon emissions occur through consumption patterns. This section studies, empirically, the relations of consumer credit on consumption patterns as well as the effects of consumption patterns on household carbon missions.
5.1. Relations of Consumer Credit and Consumption Patterns
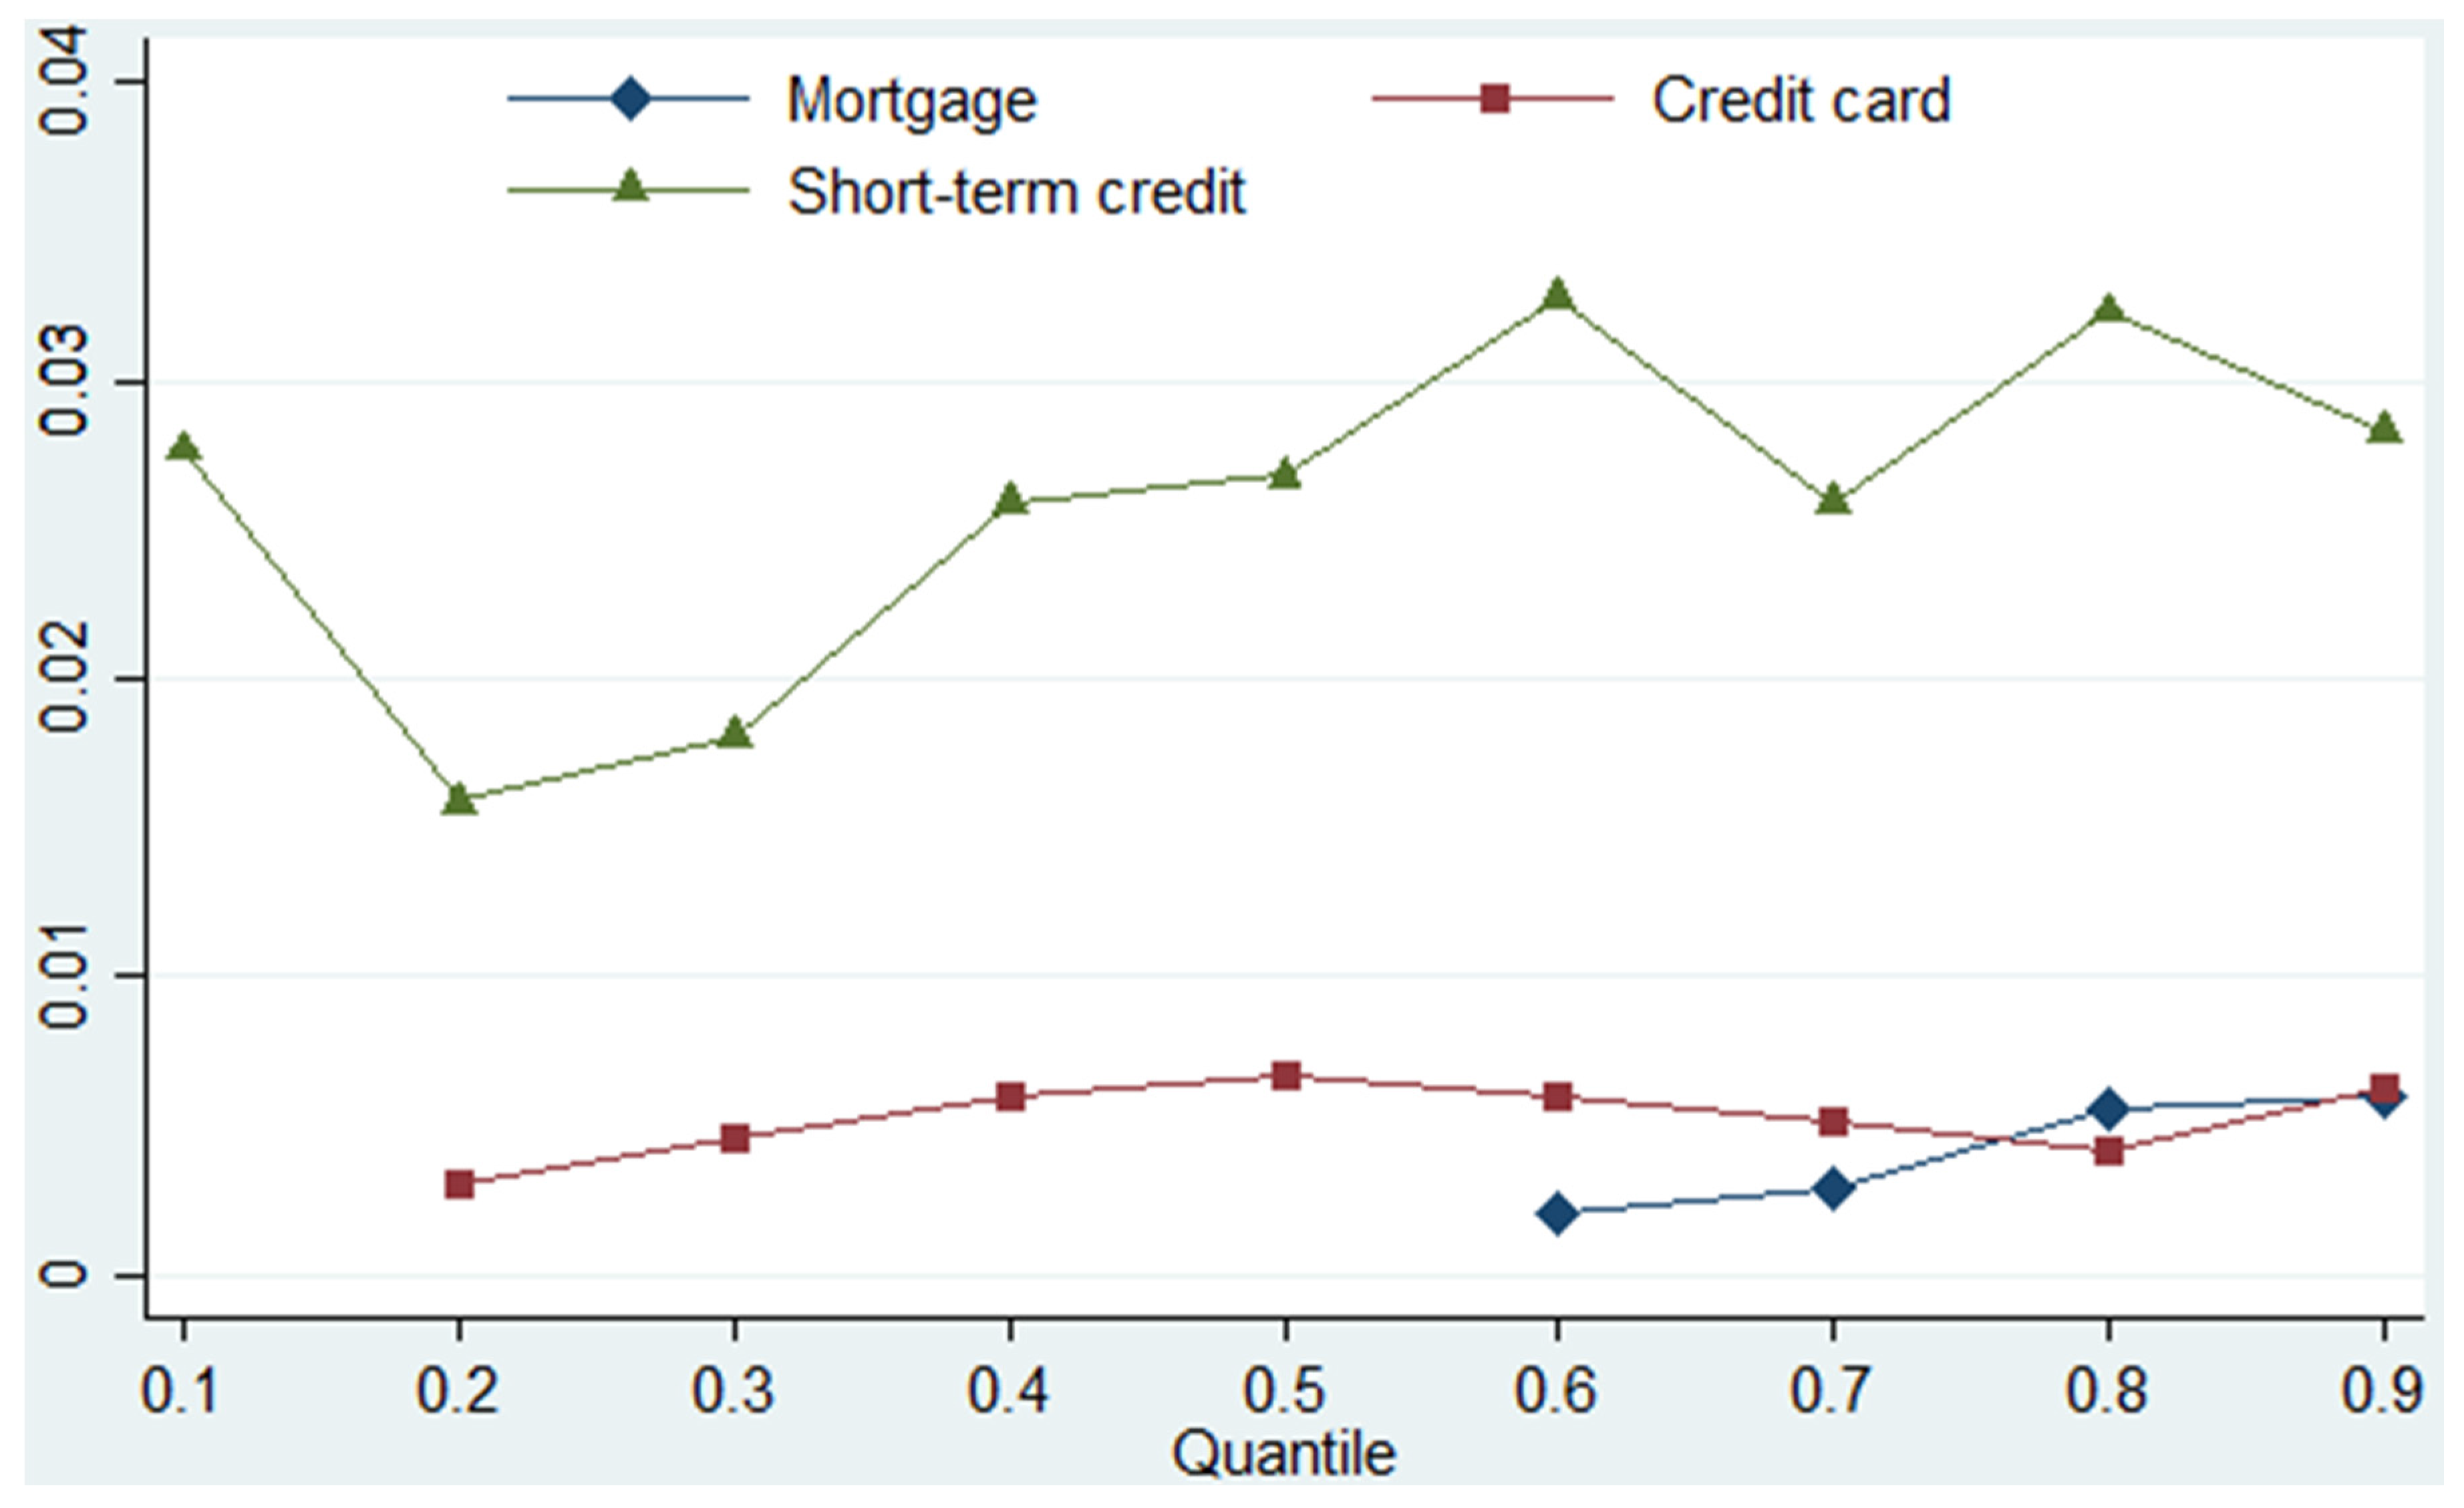
Based on Model (11), we use the quantile regression method [36] to analyze the relations of the three consumer credit variables, household mortgages, short-term consumer credit and credit card limits, and household per capita expenditures at different quantiles. This is to suggest the relations of consumer credit and consumption amounts. The results are shown in Table 5 and Figure 3. Mortgage has significant and positive relations with household per capita expenditure at the quantiles above 0.5, and the coefficient increases as the quantile rises, but there is no significant relation at the quantiles below 0.5. The relation of mortgages and household expenditure is similar to that on HCEs. Short-term consumer credit has significant and positive correlation with household per capita expenditures at all the quantiles. However, there is no obvious trend as the quantiles rise. This is different from the relation of short-term consumer credit and household per capita carbon emissions, which has an upward trend as the quantiles rise. Though credit card limits have effects on HCEs at the 0.1 quantile, they have no significant correlation on household per capita expenditures at the 0.1 quantile. At quantiles above 0.2, the correlation between credit card limit and household per capita expenditure is significant and generally upward, though the coefficients decline from the 0.5 quantile to the 0.8 quantile. The trend of the relation between credit card limits and household per capita expenditure is quite different from that on household per capita carbon emissions. As a summary, household consumption amounts and HCEs have different change trends with consumer credit at quantiles. It implies that consumption amount is the main way consumer credit impacts on HCEs, but not the only one.
Based on Model (12), we use heteroscedasticity-consistent covariance matrix estimator [35] to empirically analyze the relation of consumer credit and household each consumption category. This is to suggest the relation of consumer credit and consumption categories, and the results are shown in Table 6. Short-term consumer credit has significant and positive correlations with all household consumption categories. Mortgages have significant and positive correlations with household residence consumption as well as household facilities, medical care and transportation consumption, but they do not have significant correlations with the other consumption categories. Credit card limits have significant and positive correlations with most household consumption categories, including clothing, facilities, housing, medical care, transport, communication, education, culture and recreation but not household food and medicine consumption. These results suggest that consumer credit has correlations with household consumption patterns. As consumption amount is not the way consumer credit impacts on HCEs, we suppose that consumer credit affects HCEs via both the amount and the structure of consumption, i.e., consumption patterns.
5.2. Determination of Consumption Patterns on Household Carbon Emissions
Based on Model (13), we use the quantile regression method [36] to analyze the effects of household per capita consumption categories on per capita carbon emissions at different quantiles. The results, shown in Table 7, imply that the effects of household consumption categories on HCEs are all significant and positive at the different quantiles, but their coefficients are distinct. As the quantile rises, the effect of household food or communication expenditures on HCEs increases. The effect of household clothing expenditures on HCEs first increases and then declines as the quantile rises. The effect of household clothing expenditures on HCEs has the largest coefficients at the middle quantiles. The effect of household facility expenditures on HCEs generally declines as the quantile rises. The effect of household medical and health expenditures on HCEs declines as the quantile rises from 0.1 to 0.6 and diminishes when the quantile is above 0.6. The effect of household transportation expenditures on HCEs generally decreases as the quantile rises, but increases at high quantiles, while the effect of household expenditures on education, culture and recreation generally shows the opposite trend. The distinct effects of household consumption categories confirm the effects of consumption patterns on HCEs.
Similar to the relations of consumer credit on household consumption categories suggested in Section 5.1, the effects of consumer credit on HCEs illustrated in this section imply that consumer credit impacts on HCEs by all consumption categories, i.e., consumption patterns.
5.3. Mediation of Consumption Amount in the Effect of Consumer Credit on HCEs
We further use the models of mediation [38] to examine first the correlations between consumer credit and consumption patterns, and then the effect of changing consumption patterns on HCEs. According to the method of mediation analysis in Section 2.2, and using the data and variables illustrated in Section 3, we can analyze the mediation effect of consumption amount on the impact of consumer credit on HCEs (Table 8).
Column (1) in Table 8 suggests all three kinds of consumer credit, mortgage, short-term consumer credit and consumer credit card, as well as the control variables, have relations to household consumption amount. This result can be illustrated by the first arrow in Figure 4. Column (2) in Table 8 suggests that consumption amount as well as some of the consumer credit variables and the control variables have impacts on HCEs. As the variable of household per capita consumption in Column (2) in Table 8 is determined by the consumer credit variables and the control variables, as shown in Column (1) in Table 8, the result of Column (2) in Table 8 can be illustrated by the second arrow in Figure 4. Column (3) in Table 8 is about how HCEs is affected by the consumer credit variables and the control variables, but not with the variable of consumption amount. The result of Column (3) in Table 8 is illustrated by the third arrow in Figure 4.
By comparing Column (2) and Column (3) in Table 8, it is found that the coefficients of the consumer credit variables and the control variables change insignificantly, or their absolute values decrease. Firstly, the coefficient of short-term consumer credit in Column (3) is significant, but it is not significant in Column (2). Secondly, the coefficients of mortgage and credit card limit in Column (3) and Column (2) are both significant, but their absolute values decrease in Column (2) compared to that in Column (3). Thirdly, all the coefficients of the control variables change insignificantly, or their absolute values decrease in Column (2) compared to that in Column (3). As a result, the effects of the consumer credit variables and the control variables on HCEs (shown by the third arrow in Figure 4) will weaken when considering the consumption amount (shown by the first and second arrows in Figure 4). According to Baron and Kenny [38], it suggests that consumption amount is the mediation in the effects of the consumer credit variables and the control variables on HCEs.
Further, the ways mortgage, short-term consumer credit and credit card impact on HCEs are distinct. As the significant coefficient of short-term consumer credit in Column (3) changes to insignificant in Column (2), it suggests that consumption amount is the main way for short-term consumer credit to impact on HCEs. However, the coefficients of mortgage and credit card limit in Column (2) in Table 8 are significant, although their absolute values are smaller than that in Column (3). This suggests that mortgage and credit card impact on HCEs partly by consumption amount as well as by other ways or directly to some extent. Similarly, the ways the control variables impact on HCEs are also distinct.
5.4. Effect of Consumption Structure in the Relation of Consumer Credit and HCEs
Model (2) in theory and Table 6 empirically suggest that household characteristics have correlations with consumption categories. Model (5) in theory and Table 7 empirically suggest that consumption categories distinctly impact HCEs. Section 5.3 reveals the mediation of consumption amount in the effect of consumer credit on HCEs. Based on these foundations, we further discuss the role of consumption structure in the relation of consumer credit and HCEs in this section.
In this section, we include the vector defined by Model (15), i.e., the percentages that each consumption category contribute to total household consumption when modeling HCEs according to Models (10)–(14). We use the data described in Section 3.1. The results are shown in Table 9, which illustrates the effect of consumption structure in the relation of consumer credit and HCEs.
Firstly, Columns (2)–(4) in Table 9 show that all of the percentages of consumption categories have impacts on HCEs. As the percentages of consumption categories have different coefficients, it suggests that consumption structure will have impacts on HCEs. Secondly, the coefficients of consumer credit and other variables in Column (3) change insignificantly or their absolute values decrease compared to that in Column (1). This suggests that consumption structure has mediation effect in the impacts of consumer credit on HCEs. Thirdly, the significant coefficient of mortgage in Column (1) changes to insignificant in Column (3). It suggests that consumption structure is the main way mortgage impacts on HCEs. However, the coefficients of short-term consumer credit and credit card limit in Column (3) in Table 9 are significant, although their absolute values are smaller than that in Column (1). This suggests that short-term consumer credit and credit card impact on HCEs partly by consumption structure as well as by other ways or directly to some extent. Fourthly, the coefficients of the consumer credit variables in Column (4) change insignificantly compared to that in Column (1). This suggests that, when controlling both the consumption amount and the percentages of consumption categories, the effects of consumer credit on HCEs is insignificant. As a result, consumption patterns, including both the amount and structure of consumption, are the main ways consumer credit impacts on HCEs.
According to Section 5.1, Section 5.2, Section 5.3 and Section 5.4, consumer credit, as represented by mortgages, short-term consumer credit and credit card, has relations to household consumption patterns, which determine HCEs. As Section 4 suggests, long-term, short-term and daily consumer credit have distinct impacts on HCEs at different quantiles. The results and discussion illustrate that consumer credit has diverse impacts on HCEs via household consumption patterns.
6. Conclusions and Implications
This paper reveals that three major factors—long-term consumer credit (as represented by mortgages), short-term consumer credit and credit card limits (representing daily consumption)—have diverse impacts on household carbon emissions (HCEs). Moreover, it suggests that the effects of consumer credit on HCEs occur via consumption patterns.
Concretely, short-term consumer credit and credit card limits have effects on HCEs at all quantiles, but mortgages only have effects at high quantiles. Consumption categories have distinct effects on HCEs at different quantiles. The effects of mortgages on HCEs occur mainly through housing consumption, as well as through the consumption of household facilities, medical care and transportation. The effects of short-term consumer credit on HCEs occur through almost all consumption categories. The effects of credit card limits on HCEs occur through most household consumption categories, including clothing, facilities, housing, medical care, transport, communication, education, culture and recreation.
These conclusions imply that consumer finance can reduce HCEs by encouraging low-carbon behaviors within the consumption process. On the one hand, this can reduce the carbon emissions of households with high consumption and emissions by inducing green and low-carbon consumption of housing and transportation. On the other hand, by introducing green and low-carbon consumption signals to short-term consumer credit and credit card limits, most consumption categories will be transformed into green and low-carbon types, and HCEs will eventually decrease.
Generally, there are two ways, by pricing and by quota, that consumer finance can reduce HCEs. Carbon pricing, as the consensus among economists, is thought to be the best tool to tackle the climate externality [49,50,51]. The use of carbon pricing to reduce HCEs in consumer finance goes through four steps. Firstly, the government should provide a method accepted by public to evaluate the amount of carbon emissions embedded in the goods on sale. Secondly, it needs a mechanism, Cap-and-Trade Systems or Emission-Reduction-Credit Systems for example, to make carbon emissions or its reductions exchanged in public markets and then there will be the market prices for carbon emissions or its reduction. Thirdly, banks give different interest rates to households or individuals according to their carbon values embedded in consumption, i.e., the carbon prices formed in public markets plus the amount of household or individual carbon emissions or its reduction in consumption. Fourthly, banks sell or buy carbon quotas in market according to the amount of carbon emissions or its reduction they have gained in their lending behavior.
Reducing HCEs by quota in consumer finance first requires knowing the carbon amount in household or individual consumption behaviors. Then, banks decide the credit line or lend quota to household or individual according to the carbon emission levels in consumption behaviors. To arouse banks to do this, government should provide some pollution control instruments [52]. The instruments should encourage banks to give more credit to the low-carbon behaviors or persons but give less credit to the high-carbon ones. This is in fact the application of green finance in consumer finance.
Limited by the data available to our study, we only discern the effects of consumer credit on HCEs by consumption categories, but we cannot discern the effects of consumer credit on household low-carbon or high-carbon behaviors for some of the seven consumption categories. Meanwhile, we cannot discern if endogeneity exists in the effect of consumer credit on consumption patterns. Based on the data we obtained, it is hard to know if higher credit leads to higher consumption, or if higher consumption leads to higher credit. This indicates the shortcomings of the current study as well as directions for future study.
Acknowledgments
This work has been financially supported by the National Natural Science Foundation of China (71603174, 71673020, 71501159, and 71373213) and the survey data are provided by China Center for Financial Research (CCFR), Tsinghua University. The authors are very grateful to have the paper manuscript reviewed by the journal editors and reviewers.
Author Contributions
Xinkuo Xu conceived, designed, and performed the experiments, analyzed the data, wrote the paper and revised the paper; Liyan Han designed the research, supervised the whole process and revised the paper. All authors have read and approved the final manuscript.
Conflicts of Interest
The authors declare no conflict of interest.
Appendix A

Table A1.
Sample households’ local distribution and their statistical characteristics of per capita income and expenditure.
Table A1.
Sample households’ local distribution and their statistical characteristics of per capita income and expenditure.
| Region | City | Popn. Share | Per capita Income (Yuan per Year) a | Per capita Expenditure (Yuan per Month) | ||||||
|---|---|---|---|---|---|---|---|---|---|---|
| Mean | Std. Dev. | Min | Max | Mean | Std. Dev. | Min | Max | |||
| North China | Baotou | 0.01888 | 26,565.75 | 19,940.32 | 1000.00 | 150,000 | 1025.72 | 752.29 | 23.33 | 6550 |
| Beijing | 0.07207 | 67,051.58 | 82,152.63 | 1071.43 | 666,667 | 3138.19 | 5939.59 | 157.14 | 61,638 | |
| Shuozhou | 0.01784 | 14,369.49 | 11,824.77 | 750.00 | 66,667 | 736.50 | 691.91 | 108.33 | 4825 | |
| North East | Luoyang | 0.08368 | 36,134.22 | 50,205.00 | 3333.33 | 600,000 | 1991.72 | 4738.48 | 180.00 | 71,667 |
| Jilin | 0.02200 | 17,145.34 | 11,585.27 | 5000.00 | 116,667 | 848.07 | 407.11 | 156.25 | 2200 | |
| Yinchun | 0.01940 | 15,109.96 | 8784.74 | 1904.76 | 60,000 | 669.15 | 332.69 | 98.00 | 2060 | |
| East China | Anqing | 0.01386 | 16,325.87 | 10,107.41 | 1666.67 | 66,667 | 614.17 | 324.19 | 104.00 | 1750 |
| Shanghai | 0.09425 | 47,217.01 | 46,788.33 | 5000.00 | 400,000 | 2318.43 | 4390.10 | 200.00 | 58,100 | |
| Nanchang | 0.03378 | 20,839.45 | 15,813.10 | 3500.00 | 150,000 | 873.94 | 457.02 | 130.00 | 2967 | |
| Xuzhou | 0.02131 | 25,429.81 | 24,350.74 | 5000.00 | 200,000 | 989.93 | 735.99 | 181.91 | 6470 | |
| Jinan | 0.06306 | 28,230.30 | 30,454.13 | 2500.00 | 266,667 | 1746.04 | 5244.71 | 98.80 | 61,429 | |
| South China | Guangzhou | 0.07918 | 42,939.01 | 41,446.94 | 1666.67 | 375,000 | 2544.66 | 7189.78 | 68.18 | 111,333 |
| Guilin | 0.02131 | 20,188.39 | 27,641.28 | 2500.00 | 250,000 | 902.06 | 862.99 | 105.71 | 7700 | |
| Haikou | 0.02789 | 19,058.40 | 21,580.56 | 2666.67 | 150,000 | 940.27 | 788.69 | 130.80 | 5575 | |
| Quanzhou | 0.01213 | 45,249.49 | 61,923.45 | 5000.00 | 416,667 | 1187.62 | 1013.21 | 302.50 | 5440 | |
| Central China | Luoyang | 0.02893 | 13,120.46 | 8559.61 | 3000.00 | 66,667 | 650.77 | 427.04 | 200.00 | 3925 |
| Wuhan | 0.08108 | 32,464.46 | 38,960.66 | 2000.00 | 666,667 | 1199.28 | 934.56 | 172.00 | 10,340 | |
| Zhuzhou | 0.02287 | 16,912.75 | 7064.03 | 2500.00 | 48,000 | 597.34 | 348.63 | 246.67 | 3400 | |
| North West | Baiyin | 0.01854 | 14,119.95 | 14,428.40 | 1666.67 | 110,000 | 777.31 | 1125.81 | 100.00 | 11,500 |
| Urumqi | 0.02529 | 30,477.31 | 34,086.90 | 6000.00 | 300,000 | 1123.80 | 748.31 | 220.00 | 4550 | |
| Xi’an | 0.06341 | 44,604.28 | 47,021.38 | 3333.33 | 500,000 | 2342.09 | 5070.07 | 216.67 | 62,500 | |
| South West | Chongqing | 0.10187 | 39,343.77 | 46,766.45 | 3333.33 | 500,000 | 1688.89 | 1537.78 | 216.67 | 11,375 |
| Kunming | 0.03448 | 37,471.34 | 36,496.78 | 7500.00 | 350,000 | 1335.01 | 892.11 | 290.00 | 5050 | |
| Panzhihua | 0.02287 | 17,241.54 | 11,194.16 | 3000.00 | 90,000 | 870.97 | 564.26 | 182.00 | 5120 | |
a The 0.1% sample of households with the highest per capita income is erased to weaken the deviation of the results in the summary statistics as a small portion of these households are overly sensitive to the statistical result. The selective dataset can be taken to represent households in urban China broadly. First, the survey stratifies cities above the prefecture level in Mainland China into three categories according to their size, economic development level, saving level and consumption conditions. Second, all 24 sample cities selected include the three categories in the seven regions of Mainland China (according to the economic development level and geographical features and adopted by some authorities). The weights of these cities refer to the proportion of the population in the Chinese City (Town) Life and Price Yearbook (2009). Thirdly, after the sample cities have been selected and the number of representative households in each sample city has been determined, these households are randomly sampled according to the community distribution and population distribution in each sample city.
Table A2.
Summary statistics of the expenditures of each household consumption category.
| Variable | Definition | Sample Number | Mean | Std. Dev. | Min | Max |
|---|---|---|---|---|---|---|
| Food | Food | 5746 | 570.99 | 1379.62 | 0 | 52,500 |
| Cloth | Clothing | 5746 | 231.48 | 684.59 | 0 | 16,666.67 |
| Facilities | Household facilities | 5746 | 161.15 | 877.47 | 0 | 33,333.33 |
| Housing | Housing | 5746 | 166.16 | 442.83 | 0 | 15,000 |
| Communication | Communication | 5746 | 82.36 | 163.03 | 0 | 5000 |
| Transport | Transport | 5746 | 124.30 | 390.56 | 0 | 15,000 |
| Medical care | Medical care | 5746 | 63.92 | 216.51 | 0 | 6666.67 |
| Recreation | Education, cultural and recreation services | 5746 | 170.98 | 734.53 | 0 | 30,000 |
The variables in this table are the logarithms of per capita expenditure of each consumption category.
Table A3.
Summary statistics of the factors affecting household per capita embedded carbon emissions.
Table A3.
Summary statistics of the factors affecting household per capita embedded carbon emissions.
| Variable | Obs | Mean | Std. Dev. | Min | Max |
|---|---|---|---|---|---|
| Mortgage | 5746 | 2.54 | 3.75 | 1 | 17 |
| Short-term credit | 5746 | 1.20 | 1.02 | 1 | 16 |
| Credit card | 5746 | 15,571.06 | 70,111.81 | 0 | 3,000,000 |
| Mortgage payment | 5746 | 643.31 | 10,020.80 | 0 | 500,000 |
| Short-term payment | 5746 | 7937.26 | 73,507.13 | 0 | 3,000,000 |
| Income | 5746 | 5,799,640 | 9.78 × 10⁷ | 5000 | 5.00 × 10⁹ |
| Income expectation | 5746 | 3.503829 | 0.833003 | 0 | 5 |
| Size | 5746 | 3.472329 | 1.433656 | 1 | 18 |
| Marriage | 5746 | 0.665681 | 0.471793 | 0 | 1 |
| Gender | 5746 | 0.474765 | 0.499406 | 0 | 1 |
| Education | 5746 | 2.512182 | 0.785159 | 1 | 5 |
| House ownership | 5746 | 6.718761 | 4.570110 | 1 | 17 |
| Car ownership | 5746 | 2.584058 | 3.168145 | 1 | 17 |
The variables of credit card limit, monthly mortgage payment and monthly repayment for short-term consumer loans are in the natural logarithmic form.
Table A4.
VIF of the independent and control variables.
| Variable | VIF | Variable | VIF |
|---|---|---|---|
| Mortgage | 1.93 | 7 | 2.95 |
| Short-term credit | 1.07 | 8 | 2.58 |
| Credit card | 4.79 | 9 | 5.27 |
| Mortgage payment | 4.82 | 10 | 3.45 |
| Short-term payment | 1.85 | 11 | 3.06 |
| Income | 1.44 | 12 | 3.36 |
| Income expectation | 1.08 | 13 | 2.63 |
| Size | 4.17 | 14 | 1.89 |
| Marriage | 1.45 | 15 | 7.37 |
| Gender | 1.06 | 16 | 6.61 |
| Education | 1.47 | 17 | 2.33 |
| House ownership | 1.74 | 18 | 2.79 |
| Car ownership | 1.44 | 19 | 6.43 |
| Citiy: 2 | 2.31 | 20 | 5.36 |
| 3 | 2.33 | 21 | 2.52 |
| 4 | 6.08 | 22 | 2.43 |
| 5 | 6.29 | 23 | 7.68 |
| 6 | 2.52 | 24 | 2.64 |
| Mean VIF | 3.31 |
In statistics, the variance inflation factor (VIF) quantifies the severity of multicollinearity in an OLS regression analysis. It provides an index that measures how much the variance (the square of the estimate’s standard deviation) of an estimated regression coefficient is increased because of collinearity. A rule of thumb is that, if 0 < VIF < 10, multicollinearity is low enough and is thought to be negligible in the empirical study.
Table A5.
Effects of household characteristics including square of income on household carbon emissions.
Table A5.
Effects of household characteristics including square of income on household carbon emissions.
| (1) | (2) | (3) | (4) | (5) | (6) | (7) | |
|---|---|---|---|---|---|---|---|
| Mortgage | 0.00472 * | 0.00549 ** | 0.00670 ** | ||||
| (0.00271) | (0.00280) | (0.00287) | |||||
| Short-term credit | 0.0400 *** | 0.0430 *** | 0.0455 *** | ||||
| (0.0107) | (0.0107) | (0.0106) | |||||
| Credit card | 0.00748 *** | 0.00895 *** | |||||
| (0.00202) | (0.00198) | ||||||
| Mortgage payment | 0.00498 | ||||||
| (0.00336) | |||||||
| Short-term payment | 0.0119 *** | ||||||
| (0.00286) | |||||||
| Income | 1.179 *** | 1.189 *** | 1.197 *** | 1.194 *** | 1.190 *** | 1.189 *** | 1.201 *** |
| (0.0630) | (0.0629) | (0.0631) | (0.0628) | (0.0630) | (0.0631) | (0.0631) | |
| Square of Income | −0.0478 *** | −0.0483 *** | −0.0486 *** | −0.0485 *** | −0.0483 *** | −0.0482 *** | −0.0487 *** |
| (0.00303) | (0.00303) | (0.00303) | (0.00302) | (0.00303) | (0.00303) | (0.00303) | |
| Income expectation | 0.0126 | 0.0150 | 0.0138 | 0.0158 | 0.0118 | 0.0116 | 0.0146 |
| (0.0105) | (0.0105) | (0.0105) | (0.0105) | (0.0105) | (0.0105) | (0.0105) | |
| Size | −0.129 *** | −0.128 *** | −0.126 *** | −0.127 *** | −0.127 *** | −0.127 *** | −0.126 *** |
| (0.00968) | (0.00968) | (0.00978) | (0.00966) | (0.00976) | (0.00974) | (0.00977) | |
| Marriage | −0.0832 *** | −0.0855 *** | −0.0893 *** | −0.0824 *** | −0.0832 *** | −0.0846 *** | −0.0880 *** |
| (0.0200) | (0.0201) | (0.0201) | (0.0200) | (0.0200) | (0.0200) | (0.0201) | |
| Gender | 0.0267 | 0.0271 * | 0.0292 * | 0.0276 * | 0.0291 * | 0.0292 * | 0.0290 * |
| (0.0163) | (0.0163) | (0.0164) | (0.0164) | (0.0163) | (0.0164) | (0.0164) | |
| Education | 0.00797 | 0.0184 | 0.0202 * | 0.0211 * | 0.0105 | 0.0109 | 0.0211 * |
| (0.0117) | (0.0115) | (0.0115) | (0.0114) | (0.0117) | (0.0116) | (0.0115) | |
| House ownership | −0.0243 *** | −0.0239 *** | −0.0240 *** | −0.0228 *** | −0.0233 *** | −0.0238 *** | −0.0232 *** |
| (0.00271) | (0.00271) | (0.00273) | (0.00268) | (0.00268) | (0.00270) | (0.00269) | |
| Car ownership | 0.0371 *** | 0.0376 *** | 0.0382 *** | 0.0375 *** | 0.0375 *** | 0.0379 *** | 0.0383 *** |
| (0.00362) | (0.00361) | (0.00362) | (0.00361) | (0.00363) | (0.00363) | (0.00363) | |
| City | -- | -- | -- | -- | -- | -- | -- |
| (--) | (--) | (--) | (--) | (--) | (--) | (--) | |
| Constant | −1.786 *** | −1.875 *** | −1.874 *** | −1.908 *** | −1.803 *** | −1.790 *** | −1.892 *** |
| (0.319) | (0.318) | (0.318) | (0.316) | (0.319) | (0.320) | (0.318) | |
| Observations | 5746 | 5746 | 5746 | 5746 | 5746 | 5746 | 5746 |
| R-squared | 0.507 | 0.506 | 0.503 | 0.505 | 0.504 | 0.504 | 0.503 |
The dependent variable is household per capita carbon emissions. The definitions of the independent and control variables are shown in Table 2. Robust standard errors in parentheses: *** p < 0.01, ** p < 0.05, * p < 0.1.
References
- Zha, D.; Zhou, D.; Peng, Z. Driving forces of residential CO2 emissions in urban and rural China: An index decomposition analysis. Energy Policy 2010, 38, 3377–3383. [Google Scholar]
- Han, L.; Xu, X.; Han, L. Applying quantile regression and Shapley decomposition to analyzing the determinants of household embedded carbon emissions: Evidence from urban China. J. Clean. Prod. 2015, 103, 219–230. [Google Scholar] [CrossRef]
- Perobelli, F.; Faria, W.; Vale, V. The increase in Brazilian household income and its impact on CO2 emissions: Evidence for 2003 and 2009 from input–output tables. Energy Econom. 2015, 52, 228–239. [Google Scholar] [CrossRef]
- Bin, S.; Dowlatabadi, H. Consumer lifestyle approach to US energy use and the related CO2 emissions. Energy Policy 2005, 33, 197–208. [Google Scholar] [CrossRef]
- Jackson, T.; Papathanasopoulou, E. Luxury or ‘lock-in’? An exploration of unsustainable consumption in the UK: 1968 to 2000. Ecol. Econom. 2008, 68, 80–95. [Google Scholar] [CrossRef]
- Weber, C.L.; Matthews, H.S. Quantifying the global and distributional aspects of American household carbon footprint. Ecol. Econom. 2008, 66, 379–391. [Google Scholar] [CrossRef]
- Longhi, S. Residential energy expenditures and the relevance of changes in household circumstances. Energy Econom. 2015, 49, 440–450. [Google Scholar] [CrossRef]
- Xu, X.; Han, L.; Lv, X. Household carbon inequality in urban China, its sources and determinants. Ecol. Econom. 2016, 128, 77–86. [Google Scholar] [CrossRef]
- Rosas, J.; Sheinbaum, C.; Morillon, D. The structure of household energy consumption and related CO2, emissions by income group in Mexico. Energy Sustain. Dev. 2010, 14, 127–133. [Google Scholar] [CrossRef]
- Brännlund, R.; Ghalwash, T. The income–pollution relationship and the role of income distribution: An analysis of Swedish household data. Resour. Energy Econom. 2008, 30, 369–387. [Google Scholar] [CrossRef]
- Duarte, R.; Mainar, A.; Sánchez-Chóliz, J. The impact of household consumption patterns on emissions in Spain. Energy Econom. 2010, 32, 176–185. [Google Scholar] [CrossRef]
- Dai, H.; Masui, T.; Matsuoka, Y.; Fujimori, S. The impacts of China’s household consumption expenditure patterns on energy demand and carbon emissions towards 2050. Energy Policy 2012, 50, 736–750. [Google Scholar] [CrossRef]
- Zhu, Q.; Peng, X.; Wu, K. Calculation and decomposition of indirect carbon emissions from residential consumption in China based on the input–output model. Energy Policy 2012, 48, 618–626. [Google Scholar] [CrossRef]
- Liang, L.; Wu, W.; Lal, R.; Guo, Y. Structural change and carbon emission of rural household energy consumption in Huantai, northern China. Renew. Sustain. Energy Rev. 2013, 28, 767–776. [Google Scholar] [CrossRef]
- Minx, C.; Giovanni, B.; Peters, P.; Weber, C.L.; Guan, D.; Hubacek, K. A “carbonizing dragon”: China’s fast growing CO2 emissions revisited. Environ. Sci. Technol. 2011, 45, 9144–9153. [Google Scholar] [CrossRef] [PubMed]
- Rausch, S.; Metcalf, G.E.; Reilly, J.M. Distributional impacts of carbon pricing: A general equilibrium approach with micro-data for households. Energy Econom. 2011, 33, S20–S33. [Google Scholar] [CrossRef]
- Shigetomi, Y.; Nansai, K.; Kagawa, S.; Tohno, S. Changes in the carbon footprint of Japanese households in an aging society. Environ. Sci. Technol. 2014, 48, 6069–6080. [Google Scholar] [CrossRef] [PubMed]
- Estiri, H. Building and household X-factors and energy consumption at the residential sector: A structural equation analysis of the effects of household and building characteristics on the annual energy consumption of US residential buildings. Energy Econom. 2014, 43, 178–184. [Google Scholar] [CrossRef]
- Belaïd, F.; Garcia, T. Understanding the spectrum of residential energy-saving behaviours: French evidence using disaggregated data. Energy Econom. 2016, 57, 204–214. [Google Scholar] [CrossRef]
- Magri, S.; Pico, R.; Rampazzi, C. Which households use consumer credit in Europe? SSRN Electron. J. Bank of Italy Occasional Paper No. 100. Available online: https://ssrn.com/abstract=1998749 or http://dx.doi.org/10.2139/ssrn.1998749 (accessed on 12 July 2011). [CrossRef]
- Cohen, M.J. Consumer credit, household financial management, and sustainable consumption. Int. J. Consum. Stud. 2010, 31, 57–65. [Google Scholar] [CrossRef]
- Brady, R.R. Structural breaks and consumer credit: Is consumption smoothing finally a reality? J. Macroeconom. 2008, 30, 1246–1268. [Google Scholar] [CrossRef]
- Weng, M.L.; Ng, W.K.; Jin, H.C.; Boo, W. Understanding young consumer perceptions on credit card usage: Implications for responsible consumption. Contemp. Manag. Res. 2014, 10, 287–302. [Google Scholar]
- Gu, J.; Hernandez, R.J.; Liu, P.; Shao, Y. Mortgage loan securitization and personal consumption smoothening. J. Econom. Financ. 2017, 41, 1–16. [Google Scholar] [CrossRef]
- Rahman, A. Consumer credit as lifestyle activities facilitators for consumers of Bangladesh. Int. J. Mark. Stud. 2009, 2, 50–60. [Google Scholar] [CrossRef]
- Kaplan, G.; Violante, G.L. A tale of two stimulus payments: 2001 versus 2008. Am. Econom. Rev. 2014, 104, 116–121. [Google Scholar] [CrossRef]
- Ekici, T.; Dunn, L. Credit card debt and consumption: Evidence from household-level data. Appl. Econom. 2010, 42, 455–462. [Google Scholar] [CrossRef]
- Fulford, S.L. How important is variability in consumer credit limits? J. Monet. Econom. 2014, 72, 42–63. [Google Scholar] [CrossRef]
- Chen, B.L.; Liao, S.Y. Capital, credit constraints and the comovement between consumer durables and nondurables. J. Econom. Dyn. Control 2014, 39, 127–139. [Google Scholar] [CrossRef]
- Druckman, A.; Jackson, T. The carbon footprint of UK households 1990–2004: A socio-economically disaggregated, quasi-multi-regional input–output model. Ecol. Econom. 2009, 68, 2066–2077. [Google Scholar] [CrossRef] [Green Version]
- Wei, Y.; Liu, L.; Fan, Y.; Wu, G. The impact of lifestyle on energy use and CO2 emission: An empirical analysis of China’s residents. Energy Policy 2007, 35, 247–257. [Google Scholar] [CrossRef]
- Feng, Z.H.; Zou, L.L.; Wei, Y.M. The impact of household consumption on energy use and CO2 emissions in China. Energy 2011, 36, 656–670. [Google Scholar] [CrossRef]
- Fan, J.; Guo, X.; Marinova, D.; Wu, Y.; Zhao, D. Embedded carbon footprint of Chinese urban households: Structure and changes. J. Clean. Prod. 2012, 33, 50–59. [Google Scholar] [CrossRef]
- Golley, J.; Meng, X. Income inequality and carbon dioxide emissions: The case of Chinese urban households. Energy Econom. 2012, 34, 1864–1872. [Google Scholar] [CrossRef]
- White, H. A heteroskedasticity-consistent covariance matrix estimator and a direct test for heteroskedasticity. Econometrica 1980, 48, 817–838. [Google Scholar] [CrossRef]
- Koenker, R.W.; Bassett, G. Regression quantile. Econometrica 1978, 46, 33–50. [Google Scholar] [CrossRef]
- Buchinsky, M. The dynamics of changes in the female wage distribution in the USA: A quantile regression approach. J. Appl. Econom. 1998, 13, 1–30. [Google Scholar] [CrossRef]
- Baron, R.M.; Kenny, D.A. The moderator-mediator variable distinction in social psychological research: Conceptual, strategic, and statistical considerations. J. Personal. Soc. Psychol. 1986, 51, 1173–1182. [Google Scholar] [CrossRef]
- Liu, C.; Wu, G.; Wang, J.N.; We, Y. China’s carbon emissions from urban and rural households during 1992–2007. J. Clean. Prod. 2011, 19, 1754–1762. [Google Scholar] [CrossRef]
- Duarte, R.; Mainar, A.; Sánchez-Chóliz, J. Social groups and CO2, emissions in Spanish households. Energy Policy 2012, 44, 441–450. [Google Scholar] [CrossRef]
- Büchs, M.; Schnepf, S.V. Who emits most? Associations between socio-economic factors and UK households’ home energy, transport, indirect and total CO2 emissions. Ecol. Econom. 2013, 90, 114–123. [Google Scholar] [CrossRef]
- Jones, C.; Kammen, D.M. Spatial distribution of U.S. household carbon footprints reveals suburbanization undermines greenhouse gas benefits of urban population density. Environ. Sci. Technol. 2014, 48, 895–902. [Google Scholar] [CrossRef] [PubMed]
- Qu, J.; Zeng, J.; Li, Y.; Wang, Q.; Marasenia, T.; Zhang, L.; Zhang, Z.; Clarke-Sathera, A. Household carbon dioxide emissions from peasants and herdsmen in northwestern arid-alpine regions, China. Energy Policy 2013, 57, 133–140. [Google Scholar] [CrossRef]
- Streimikiene, D.; Volochovic, A. The impact of household behavioral changes on GHG emission reduction in Lithuania. Renew. Sustain. Energy Rev. 2011, 15, 4118–4124. [Google Scholar] [CrossRef]
- Andreaus, M. Time, gender and carbon: A study of the carbon implications of British adults’ use of time. Ecol. Econom. 2012, 84, 153–163. [Google Scholar] [CrossRef]
- Murray, A.G.; Mills, B.F. Read the label! Energy Star appliance label awareness and uptake among U.S. consumers. Energy Econom. 2011, 33, 1103–1110. [Google Scholar] [CrossRef]
- Liu, W.; Spaargaren, G.; Heerink, N.; Mol, A.; Wang, C. Energy consumption practices of rural households in north China: Basic characteristics and potential for low carbon development. Energy Policy 2013, 55, 128–138. [Google Scholar] [CrossRef]
- Lee, S.; Lee, B. The influence of urban form on GHG emissions in the U.S. household sector. Energy Policy 2014, 68, 534–549. [Google Scholar] [CrossRef]
- Goulder, L.H.; Parry, I.W.H. Instrument choice in environmental policy. Rev. Environ. Econom. Policy 2008, 2, 152–174. [Google Scholar] [CrossRef]
- Aldy, J.E.; Stavins, R.N. The promise and problems of pricing carbon: Theory and experience. J. Environ. Dev. 2011, 21, 152–180. [Google Scholar] [CrossRef]
- Baranzini, A.; Jeroen, C.J.M.; van den Bergh, J.C.; Carattini, S.; Howarth, B.R.; Padilla, E.; Roca, J. Carbon pricing in climate policy: Seven reasons, complementary instruments, and political economy considerations. Clim. Chang. 2017, 8, e462. [Google Scholar] [CrossRef]
- Campiglio, E. Beyond carbon pricing: The role of banking and monetary policy in financing the transition to a low-carbon economy. Ecol. Econom. 2016, 121, 220–230. [Google Scholar] [CrossRef] [Green Version]
Figure 1.
Logical relation between the key variables concerned in this paper.

Figure 2.
Effect trends of consumer credit factors on household per capita carbon emissions at different quantiles.
Figure 2.
Effect trends of consumer credit factors on household per capita carbon emissions at different quantiles.

Figure 3.
Trends of the correlations between consumer credit and household per capita expenditure at quantiles.
Figure 3.
Trends of the correlations between consumer credit and household per capita expenditure at quantiles.

Figure 4.
Mediation of consumption amount in the impact of consumer credit on household carbon emissions.
Figure 4.
Mediation of consumption amount in the impact of consumer credit on household carbon emissions.
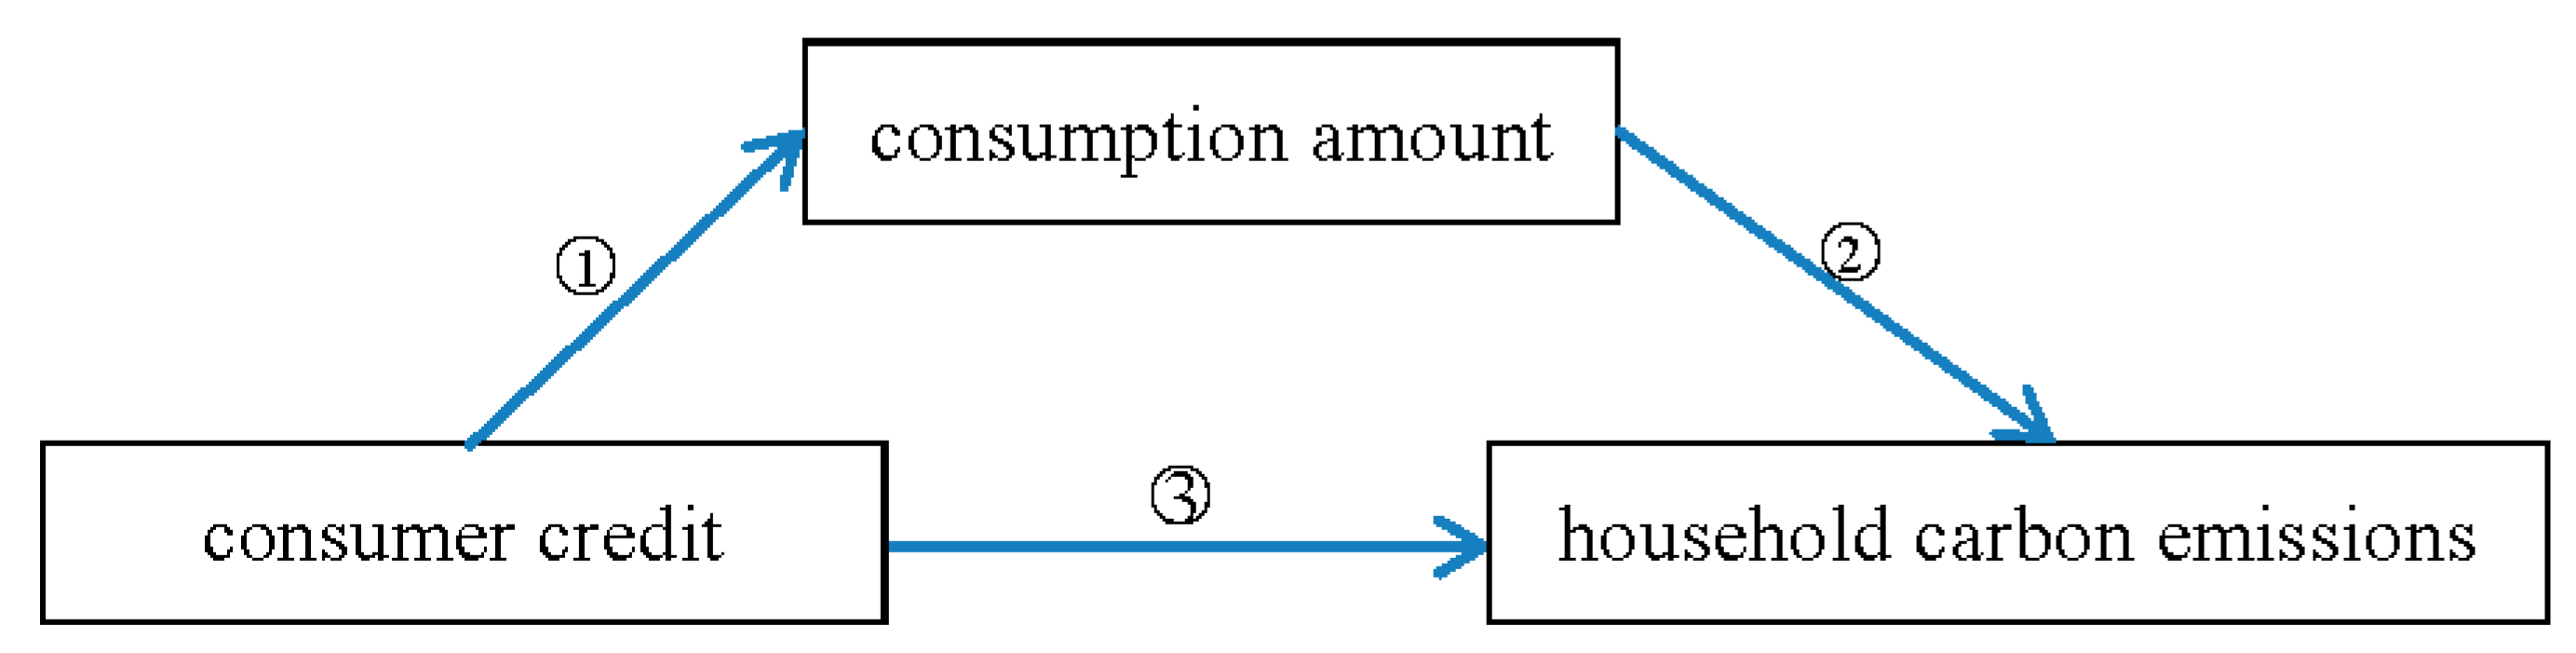
Table 1.
Intensities of the embedded carbon emissions of different consumption categories.
| Consumer Expenditure | Consumption (Billion Yuan) | Embedded Carbon Emissions (MtC) | Carbon Intensity (kg C/Yuan) |
|---|---|---|---|
| Food | 2133.81 | 71.9 | 0.033696 |
| Clothing, household facilities and medical care | 908.09 | 64.47 | 0.070995 |
| Housing | 262.07 | 74.08 | 0.282673 |
| Transport and communication services | 524.15 | 33.6 | 0.064104 |
| Education, cultural and recreation services | 336.24 | 13.26 | 0.039436 |
| Miscellaneous commodities and services | 3059.17 | 136.94 | 0.044764 |
| Total | 7223.54 | 394.24 | 0.054577 |
Data in Liu et al. [39] are used as reference because they are the best approximation available, although carbon intensities of consumption categories may change in a long time. Miscellaneous commodities and services are not included in our study, as they are difficult to measure in a survey.
Table 2.
Definitions of the independent and control variables affecting household carbon emissions.
| Variables | Definitions |
|---|---|
| Mortgage | The level of the household loan for housing, the value of which is between 1 and 17. |
| Short-term credit | The level of the household short-term (no more than one year) loan for consumption, the value of which is between 1 and 17. |
| Credit card | The logarithm of the credit card limit for a household (unit: Yuan). |
| Mortgage payment | The logarithm of the monthly mortgage payment of a household (unit: Yuan). |
| Short-term payment | The logarithm of the monthly repayment for the short-term consumer loans of a household (unit: Yuan). |
| Income | The logarithm of the per capita income of a household. |
| Square of income | The square of the logarithm of the per capita income of a household. |
| Income expectation | The income expectation of a household. |
| Size | The number of persons in a household. |
| Marriage | The married state of the surveyed (married = 1, or 0). |
| Gender | The gender of the surveyed (male = 1, or 0). |
| Education | The education level of the surveyed. |
| House ownership | The number of houses owned by a household. |
| Car ownership | The number of cars owned by a household. |
| City | The city a household lives in. |
Table 3.
Effects of consumer credit factors on household carbon emissions.
| (1) | (2) | (3) | (4) | (5) | (6) | (7) | |
|---|---|---|---|---|---|---|---|
| Mortgage | 0.00647 ** | 0.00755 ** | 0.00894 *** | ||||
| (0.00316) | (0.00330) | (0.00339) | |||||
| Short-term credit | 0.0448 *** | 0.0491 *** | 0.0525 *** | ||||
| (0.0111) | (0.0111) | (0.0110) | |||||
| Credit card | 0.0102 *** | 0.0120 *** | |||||
| (0.00212) | (0.00209) | ||||||
| Mortgage payment | 0.00873 ** | ||||||
| (0.00352) | |||||||
| Short-term payment | 0.0163 *** | ||||||
| (0.00298) | |||||||
| Income | 0.160 *** | 0.162 *** | 0.164 *** | 0.163 *** | 0.163 *** | 0.165 *** | 0.162 *** |
| (0.0187) | (0.0189) | (0.0191) | (0.0190) | (0.0190) | (0.0192) | (0.0190) | |
| Income expectation | 0.0384 *** | 0.0420 *** | 0.0408 *** | 0.0432 *** | 0.0379 *** | 0.0419 *** | 0.0376 *** |
| (0.0110) | (0.0110) | (0.0110) | (0.0110) | (0.0110) | (0.0110) | (0.0110) | |
| Size | −0.190 *** | −0.189 *** | −0.188 *** | −0.189 *** | −0.189 *** | −0.188 *** | −0.188 *** |
| (0.00990) | (0.00993) | (0.0100) | (0.00993) | (0.01000) | (0.0100) | (0.00997) | |
| Marriage | −0.0588 *** | −0.0616 *** | −0.0658 *** | −0.0572 *** | −0.0578 *** | −0.0650 *** | −0.0576 *** |
| (0.0210) | (0.0211) | (0.0212) | (0.0210) | (0.0210) | (0.0212) | (0.0210) | |
| Gender | 0.0421 ** | 0.0429 ** | 0.0453 *** | 0.0437 ** | 0.0451 *** | 0.0447 *** | 0.0461 *** |
| (0.0172) | (0.0173) | (0.0173) | (0.0173) | (0.0172) | (0.0173) | (0.0172) | |
| Education | 0.0469 *** | 0.0616 *** | 0.0640 *** | 0.0656 *** | 0.0506 *** | 0.0644 *** | 0.0530 *** |
| (0.0122) | (0.0119) | (0.0119) | (0.0119) | (0.0122) | (0.0120) | (0.0120) | |
| House ownership | −0.0161 *** | −0.0155 *** | −0.0155 *** | −0.0138 *** | −0.0146 *** | −0.0147 *** | −0.0147 *** |
| (0.00282) | (0.00283) | (0.00285) | (0.00278) | (0.00279) | (0.00280) | (0.00279) | |
| Car ownership | 0.0553 *** | 0.0562 *** | 0.0570 *** | 0.0562 *** | 0.0559 *** | 0.0573 *** | 0.0563 *** |
| (0.00386) | (0.00385) | (0.00387) | (0.00386) | (0.00388) | (0.00388) | (0.00388) | |
| City | -- | -- | -- | -- | -- | -- | -- |
| (--) | (--) | (--) | (--) | (--) | (--) | (--) | |
| Constant | 2.957 *** | 2.896 *** | 2.931 *** | 2.879 *** | 2.985 *** | 2.931 *** | 2.991 *** |
| (0.162) | (0.162) | (0.163) | (0.162) | (0.163) | (0.163) | (0.163) | |
| Observations | 5746 | 5746 | 5746 | 5746 | 5746 | 5746 | 5746 |
| R-squared | 0.451 | 0.448 | 0.445 | 0.447 | 0.447 | 0.444 | 0.447 |
The dependent variable is household per capita carbon emissions. The definitions of the independent and control variables are shown in Table 2. Robust standard errors in parentheses: *** p < 0.01, ** p < 0.05.
Table 4.
Diverse effects of consumer credit factors on household carbon emissions at quantiles.
| Quantile | (0.1) | (0.2) | (0.3) | (0.4) | (0.5) | (0.6) | (0.7) | (0.8) | (0.9) | |
|---|---|---|---|---|---|---|---|---|---|---|
| Variables | ||||||||||
| Mortgage | 0.00340 | 0.00274 | 0.00260 | 0.00219 | 0.00248 | 0.00417 * | 0.00935 *** | 0.0129 *** | 0.0213 *** | |
| (0.00296) | (0.00243) | (0.00236) | (0.00217) | (0.00194) | (0.00214) | (0.00226) | (0.00264) | (0.00429) | ||
| Short-term credit | 0.0247 ** | 0.0278 *** | 0.0296 *** | 0.0317 *** | 0.0285 *** | 0.0355 *** | 0.0329 *** | 0.0425 *** | 0.0770 *** | |
| (0.0118) | (0.00969) | (0.00944) | (0.00869) | (0.00774) | (0.00854) | (0.00903) | (0.0106) | (0.0172) | ||
| Credit card | 0.00540 * | 0.00649 *** | 0.00733 *** | 0.00738 *** | 0.00747 *** | 0.00868 *** | 0.0113 *** | 0.00916 *** | 0.0118 *** | |
| (0.00277) | (0.00227) | (0.00221) | (0.00203) | (0.00181) | (0.00200) | (0.00211) | (0.00247) | (0.00401) | ||
| Income | 0.0586 *** | 0.136 *** | 0.213 *** | 0.300 *** | 0.363 *** | 0.414 *** | 0.439 *** | 0.460 *** | 0.462 *** | |
| (0.0124) | (0.0101) | (0.00986) | (0.00908) | (0.00809) | (0.00892) | (0.00944) | (0.0110) | (0.0179) | ||
| Income expectation | 0.0488 *** | 0.0609 *** | 0.0456 *** | 0.0308 *** | 0.0289 *** | 0.0155 | 0.0260 ** | 0.0189 | 0.00401 | |
| (0.0147) | (0.0121) | (0.0118) | (0.0108) | (0.00964) | (0.0106) | (0.0112) | (0.0131) | (0.0214) | ||
| Size | −0.226 *** | −0.206 *** | −0.192 *** | −0.164 *** | −0.148 *** | −0.136 *** | −0.129 *** | −0.125 *** | −0.117 *** | |
| (0.00924) | (0.00757) | (0.00737) | (0.00679) | (0.00605) | (0.00667) | (0.00706) | (0.00825) | (0.0134) | ||
| Marriage | 0.119 *** | 0.0266 | −0.0361 | −0.0778 *** | −0.0853 *** | −0.121 *** | −0.133 *** | −0.114 *** | −0.118 *** | |
| (0.0278) | (0.0228) | (0.0222) | (0.0204) | (0.0182) | (0.0201) | (0.0212) | (0.0248) | (0.0403) | ||
| Gender | 0.0490 ** | 0.0478 ** | 0.0325 * | 0.0280 | 0.0154 | 0.00562 | 0.0143 | 0.0173 | 0.0290 | |
| (0.0243) | (0.0199) | (0.0194) | (0.0179) | (0.0159) | (0.0176) | (0.0186) | (0.0217) | (0.0353) | ||
| Education | 0.0746 *** | 0.0440 *** | 0.0398 *** | 0.0327 ** | 0.0314 *** | 0.0143 | 0.00409 | 0.0109 | 0.00219 | |
| (0.0176) | (0.0144) | (0.0140) | (0.0129) | (0.0115) | (0.0127) | (0.0134) | (0.0157) | (0.0255) | ||
| House ownership | 0.00298 | −0.00717 *** | −0.00782 *** | −0.0152 *** | −0.0213 *** | −0.0243 *** | −0.0289 *** | −0.0366 *** | −0.0353 *** | |
| (0.00333) | (0.00273) | (0.00266) | (0.00245) | (0.00218) | (0.00241) | (0.00255) | (0.00297) | (0.00483) | ||
| Car ownership | 0.0440 *** | 0.0473 *** | 0.0439 *** | 0.0420 *** | 0.0394 *** | 0.0366 *** | 0.0356 *** | 0.0400 *** | 0.0371 *** | |
| (0.00443) | (0.00363) | (0.00353) | (0.00325) | (0.00290) | (0.00320) | (0.00338) | (0.00395) | (0.00642) | ||
| City | -- | -- | -- | -- | -- | -- | -- | -- | -- | |
| (--) | (--) | (--) | (--) | (--) | (--) | (--) | (--) | (--) | ||
| Constant | 2.824 *** | 2.651 *** | 2.336 *** | 1.886 *** | 1.584 *** | 1.363 *** | 1.289 *** | 1.278 *** | 1.731 *** | |
| (0.200) | (0.137) | (0.113) | (0.0963) | (0.0925) | (0.0867) | (0.109) | (0.141) | (0.184) | ||
| Observations | 5746 | 5746 | 5746 | 5746 | 5746 | 5746 | 5746 | 5746 | 5746 | |
The dependent variable is household per capita carbon emissions. The definitions of the independent and control variables are shown in Table 2. Standard errors in parentheses: *** p < 0.01, ** p < 0.05, * p < 0.1.
Table 5.
Correlations of consumer credit factors and household per capita expenditure at different quantiles.
Table 5.
Correlations of consumer credit factors and household per capita expenditure at different quantiles.
| Quantile | (0.1) | (0.2) | (0.3) | (0.4) | (0.5) | (0.6) | (0.7) | (0.8) | (0.9) | |
|---|---|---|---|---|---|---|---|---|---|---|
| Variables | ||||||||||
| Mortgage | 0.00262 | 0.00350 | 0.000687 | −0.00101 | 0.00004 | 0.00204 * | 0.00294 * | 0.00553 *** | 0.00597 ** | |
| (0.00183) | (0.00246) | (0.00205) | (0.00123) | (0.00160) | (0.00120) | (0.00162) | (0.00189) | (0.00256) | ||
| Short-term credit | 0.0277 *** | 0.0159 ** | 0.0181 *** | 0.0259 *** | 0.0268 *** | 0.0328 *** | 0.0259 *** | 0.0323 *** | 0.0283 *** | |
| (0.00801) | (0.00716) | (0.00697) | (0.00570) | (0.00634) | (0.00493) | (0.00673) | (0.00826) | (0.0106) | ||
| Credit card | 0.00167 | 0.00306* | 0.00464 *** | 0.00597 *** | 0.00670 *** | 0.00600 *** | 0.00513 *** | 0.00415 ** | 0.00634 ** | |
| (0.00199) | (0.00171) | (0.00166) | (0.00134) | (0.00149) | (0.00117) | (0.00165) | (0.00199) | (0.00276) | ||
| Income | 0.0566 *** | 0.145 *** | 0.232 *** | 0.329 *** | 0.380 *** | 0.434 *** | 0.478 *** | 0.525 *** | 0.524 *** | |
| (0.0179) | (0.0130) | (0.0101) | (0.00687) | (0.00665) | (0.00463) | (0.00585) | (0.00657) | (0.00900) | ||
| Income expectation | 0.0249 ** | 0.0288 *** | 0.0302 *** | 0.0273 *** | 0.0198 ** | 0.0156 ** | 0.0171 * | 0.0189 * | 0.0124 | |
| (0.0106) | (0.00897) | (0.00864) | (0.00709) | (0.00791) | (0.00625) | (0.00887) | (0.0108) | (0.0150) | ||
| Size | −0.195 *** | −0.168 *** | −0.136 *** | −0.105 *** | −0.0935 *** | −0.0873 *** | −0.0745 *** | −0.0573 *** | −0.0543 *** | |
| (0.0127) | (0.0106) | (0.0102) | (0.00814) | (0.00902) | (0.00698) | (0.00973) | (0.0117) | (0.0172) | ||
| Marriage | 0.118 *** | 0.0739 *** | 0.0467 *** | 0.0116 | −0.00721 | −0.0402 *** | −0.0613 *** | −0.0911 *** | −0.119 *** | |
| (0.0219) | (0.0187) | (0.0179) | (0.0145) | (0.0161) | (0.0125) | (0.0175) | (0.0206) | (0.0279) | ||
| Gender | 0.0275 | 0.0188 | 0.0122 | 0.00915 | 0.00255 | −0.0102 | −0.0114 | −0.0117 | 0.00969 | |
| (0.0174) | (0.0150) | (0.0144) | (0.0117) | (0.0130) | (0.0102) | (0.0143) | (0.0170) | (0.0230) | ||
| Education | 0.0405 *** | 0.0302 *** | 0.0274 ** | 0.0198 ** | 0.0158 | 0.0145 * | 0.00811 | −0.00228 | −0.0117 | |
| (0.0128) | (0.0114) | (0.0108) | (0.00875) | (0.00972) | (0.00759) | (0.0107) | (0.0126) | (0.0170) | ||
| House ownership | 0.00922 *** | 0.00699 *** | 0.00397 ** | 0.00102 | 0.000267 | −0.000319 | −0.000681 | −0.00201 | 0.00155 | |
| (0.00237) | (0.00206) | (0.00199) | (0.00161) | (0.00181) | (0.00143) | (0.00205) | (0.00246) | (0.00342) | ||
| Car ownership | 0.0372 *** | 0.0355 *** | 0.0389 *** | 0.0335 *** | 0.0307 *** | 0.0313 *** | 0.0313 *** | 0.0327 *** | 0.0391 *** | |
| (0.00352) | (0.00286) | (0.00268) | (0.00216) | (0.00239) | (0.00186) | (0.00260) | (0.00315) | (0.00435) | ||
| City | -- | -- | -- | -- | -- | -- | -- | -- | -- | |
| (--) | (--) | (--) | (--) | (--) | (--) | (--) | (--) | (--) | ||
| Constant | 5.583 *** | 5.270 *** | 4.873 *** | 4.236 *** | 3.965 *** | 3.627 *** | 3.424 *** | 3.143 *** | 3.319 *** | |
| (0.158) | (0.121) | (0.104) | (0.0780) | (0.0830) | (0.0631) | (0.0868) | (0.104) | (0.143) | ||
| Observations | 5746 | 5746 | 5746 | 5746 | 5746 | 5746 | 5746 | 5746 | 5746 | |
The dependent variable is household per capita consumption. The definitions of the independent and control variables are shown in Table 2. Standard errors in parentheses: *** p < 0.01, ** p < 0.05, * p < 0.1.
Table 6.
Correlations between consumer credit and household consumption categories.
| Variables | (1) | (2) | (3) | (4) | (5) | (6) | (7) | (8) |
|---|---|---|---|---|---|---|---|---|
| Food | Cloth | Facilities | Housing | Communication | Transport | Medical Care | Recreation | |
| Mortgage | 0.00107 | 0.00402 | 0.0108 ** | 0.0125 ** | 0.00348 | 0.0109 *** | −0.00161 | 0.000140 |
| (0.00217) | (0.00385) | (0.00500) | (0.00506) | (0.00290) | (0.00408) | (0.00712) | (0.00526) | |
| Short-term credit | 0.0257 ** | 0.0411 *** | 0.0969 *** | 0.0504 ** | 0.0340 *** | 0.0394 ** | 0.0920 *** | 0.0745 *** |
| (0.0112) | (0.0141) | (0.0210) | (0.0201) | (0.0127) | (0.0180) | (0.0271) | (0.0212) | |
| Credit card | −0.00346 | 0.0138 *** | 0.0183 *** | 0.0112 ** | 0.00804 *** | 0.0245 *** | −0.00986 | 0.0271 *** |
| (0.00227) | (0.00330) | (0.00495) | (0.00475) | (0.00254) | (0.00365) | (0.00600) | (0.00574) | |
| Income | 0.125 *** | 0.150 *** | 0.146 *** | 0.157 *** | 0.121 *** | 0.136 *** | 0.175 *** | 0.251 *** |
| (0.0150) | (0.0319) | (0.0283) | (0.0212) | (0.0198) | (0.0298) | (0.0281) | (0.0383) | |
| Income expectation | 0.0202 * | 0.118 *** | 0.112 *** | 0.0440* | 0.0656 *** | 0.0828 *** | −0.00660 | 0.145 *** |
| (0.0116) | (0.0181) | (0.0266) | (0.0257) | (0.0130) | (0.0200) | (0.0305) | (0.0315) | |
| Size | −0.190 *** | −0.181 *** | −0.137 *** | −0.166 *** | −0.182 *** | −0.195 *** | −0.0847 ** | −0.194 *** |
| (0.0154) | (0.0229) | (0.0302) | (0.0283) | (0.0161) | (0.0235) | (0.0336) | (0.0338) | |
| Marriage | 0.0583 ** | −0.272 *** | 0.0676 | 0.0643 | −0.0246 | −0.0184 | 0.344 *** | −0.274 *** |
| (0.0251) | (0.0374) | (0.0537) | (0.0507) | (0.0274) | (0.0390) | (0.0639) | (0.0624) | |
| Gender | 0.0161 | −0.0474 * | 0.0350 | 0.1000 ** | 0.0322 | 0.0524 * | −0.0448 | 0.196 *** |
| (0.0182) | (0.0282) | (0.0411) | (0.0391) | (0.0207) | (0.0312) | (0.0498) | (0.0495) | |
| Education | −0.0280 ** | 0.261 *** | 0.142 *** | −0.0248 | 0.0680 *** | 0.223 *** | −0.154 *** | 0.272 *** |
| (0.0133) | (0.0227) | (0.0313) | (0.0288) | (0.0147) | (0.0243) | (0.0354) | (0.0386) | |
| House ownership | 0.00961 *** | 0.0214 *** | 0.0223 *** | −0.0645 *** | 0.00807 ** | 0.00877* | 0.0174 ** | 0.0244 *** |
| (0.00286) | (0.00405) | (0.00639) | (0.00621) | (0.00320) | (0.00457) | (0.00741) | (0.00725) | |
| Car ownership | 0.0218 *** | 0.0536 *** | 0.0488 *** | 0.0365 *** | 0.0377 *** | 0.106 *** | 0.0214 ** | 0.0854 *** |
| (0.00409) | (0.00588) | (0.00848) | (0.00797) | (0.00469) | (0.00679) | (0.0104) | (0.00972) | |
| City | -- | -- | -- | -- | -- | -- | -- | -- |
| (--) | (--) | (--) | (--) | (--) | (--) | (--) | (--) | |
| Constant | 4.807 *** | 2.115 *** | 1.132 *** | 2.941 *** | 2.697 *** | 1.292 *** | 1.293 *** | −0.329 |
| (0.178) | (0.283) | (0.298) | (0.274) | (0.175) | (0.278) | (0.325) | (0.362) | |
| Observations | 5746 | 5746 | 5746 | 5746 | 5746 | 5746 | 5746 | 5746 |
| R-squared | 0.307 | 0.338 | 0.173 | 0.145 | 0.293 | 0.364 | 0.088 | 0.246 |
The dependent variables are the logarithms of per capita expenditures of consumption categories; their definitions and summary statistics are shown in Table A2 in Appendix A. The definitions of the independent and control variables are shown in Table 2. Standard errors in parentheses: *** p < 0.01, ** p < 0.05, * p < 0.1.
Table 7.
Effects of consumption categories on household carbon emissions at quantiles.
| Quantile | (0.1) | (0.2) | (0.3) | (0.4) | (0.5) | (0.6) | (0.7) | (0.8) | (0.9) | |
|---|---|---|---|---|---|---|---|---|---|---|
| Variables | ||||||||||
| Food | 0.255 *** | 0.255 *** | 0.256 *** | 0.253 *** | 0.264 *** | 0.273 *** | 0.286 *** | 0.294 *** | 0.301 *** | |
| (0.00123) | (0.00216) | (0.00245) | (0.00347) | (0.00578) | (0.00732) | (0.0150) | (0.0219) | (0.0299) | ||
| Cloth | 0.165 *** | 0.169 *** | 0.176 *** | 0.176 *** | 0.176 *** | 0.179 *** | 0.172 *** | 0.157 *** | 0.155 *** | |
| (0.000768) | (0.00147) | (0.00174) | (0.00252) | (0.00425) | (0.00538) | (0.0110) | (0.0161) | (0.0206) | ||
| Facilities | 0.0550 *** | 0.0454 *** | 0.0373 *** | 0.0359 *** | 0.0329 *** | 0.0290 *** | 0.0301 *** | 0.0293 *** | 0.0316 ** | |
| (0.000479) | (0.000934) | (0.00117) | (0.00174) | (0.00291) | (0.00363) | (0.00726) | (0.0101) | (0.0125) | ||
| Housing | 0.361 *** | 0.362 *** | 0.357 *** | 0.347 *** | 0.323 *** | 0.291 *** | 0.238 *** | 0.218 *** | 0.207 *** | |
| (0.000400) | (0.000818) | (0.00103) | (0.00156) | (0.00278) | (0.00375) | (0.00823) | (0.0123) | (0.0159) | ||
| Communication | 0.0787 *** | 0.0851 *** | 0.0934 *** | 0.102 *** | 0.106 *** | 0.118 *** | 0.151 *** | 0.157 *** | 0.155 *** | |
| (0.00145) | (0.00244) | (0.00273) | (0.00379) | (0.00624) | (0.00780) | (0.0160) | (0.0235) | (0.0306) | ||
| Transport | 0.0676 *** | 0.0657 *** | 0.0630 *** | 0.0628 *** | 0.0630 *** | 0.0612 *** | 0.0590 *** | 0.0663 *** | 0.0601 *** | |
| (0.000714) | (0.00130) | (0.00152) | (0.00221) | (0.00374) | (0.00466) | (0.00906) | (0.0123) | (0.0145) | ||
| Medical care | 0.0165 *** | 0.0164 *** | 0.0143 *** | 0.0131 *** | 0.0120 *** | 0.0111 *** | 0.00545 | 0.00508 | 0.00683 | |
| (0.000586) | (0.000975) | (0.00105) | (0.00141) | (0.00221) | (0.00262) | (0.00506) | (0.00682) | (0.00802) | ||
| Recreation | 0.0169 *** | 0.0179 *** | 0.0188 *** | 0.0191 *** | 0.0220 *** | 0.0209 *** | 0.0227 *** | 0.0203 *** | 0.0190 ** | |
| (0.000554) | (0.000973) | (0.00108) | (0.00147) | (0.00233) | (0.00278) | (0.00537) | (0.00724) | (0.00875) | ||
| Constant | −0.686 *** | −0.652 *** | −0.625 *** | −0.553 *** | −0.481 *** | −0.357 *** | −0.176 ** | 0.0585 | 0.324 ** | |
| (0.00877) | (0.0136) | (0.0142) | (0.0190) | (0.0304) | (0.0373) | (0.0743) | (0.104) | (0.132) | ||
| Observations | 5746 | 5746 | 5746 | 5746 | 5746 | 5746 | 5746 | 5746 | 5746 | |
The dependent variable is household per capita carbon emissions. The independent variables are the logarithms of per capita expenditures of consumption categories; their definitions and summary statistics are shown in Table A2 in Appendix A. Standard errors in parentheses: *** p < 0.01, ** p < 0.05.
Table 8.
Mediation of consumption amount in the effect of consumer credit on household carbon emissions.
Table 8.
Mediation of consumption amount in the effect of consumer credit on household carbon emissions.
| (1) | (2) | (3) | |
|---|---|---|---|
| Variables | Logarithm of per Capita Consumption | Logarithm of per Capita Carbon Emissions | Logarithm of per Capita Carbon Emissions |
| Logarithm of per capita consumption | 1.004 *** | ||
| (0.00676) | |||
| Mortgage | 0.00326 * | 0.00255 ** | 0.00647 *** |
| (0.00188) | (0.000996) | (0.00208) | |
| Short-term credit | 0.0425 *** | 0.00327 | 0.0448 *** |
| (0.00752) | (0.00403) | (0.00833) | |
| Credit card | 0.00715 *** | 0.00503 *** | 0.0102 *** |
| (0.00176) | (0.000929) | (0.00195) | |
| Income | 0.162 *** | 0.00861 ** | 0.160 *** |
| (0.00786) | (0.00432) | (0.00870) | |
| Income expectation | 0.0354 *** | 0.00556 | 0.0384 *** |
| (0.00936) | (0.00495) | (0.0104) | |
| Size | −0.176 *** | −0.0117 *** | −0.190 *** |
| (0.00588) | (0.00327) | (0.00650) | |
| Marriage | 0.0315 * | −0.118 *** | −0.0588 *** |
| (0.0177) | (0.00916) | (0.0196) | |
| Gender | 0.0130 | 0.0210 *** | 0.0421 ** |
| (0.0155) | (0.00816) | (0.0171) | |
| Education | 0.0419 *** | 0.00987 * | 0.0469 *** |
| (0.0112) | (0.00579) | (0.0124) | |
| House ownership | 0.00486 ** | −0.0149 *** | −0.0161 *** |
| (0.00212) | (0.00104) | (0.00235) | |
| Car ownership | 0.0545 *** | −0.00166 | 0.0553 *** |
| (0.00282) | (0.00151) | (0.00312) | |
| City | -- | -- | -- |
| (--) | (--) | (--) | |
| Constant | 5.462 *** | −2.618 *** | 2.957 *** |
| (0.0981) | (0.0548) | (0.109) | |
| Observations | 5746 | 5746 | 5746 |
| R-squared | 0.466 | 0.871 | 0.451 |
The definitions of the independent and control variables are shown in Table 2. Standard errors in parentheses: *** p < 0.01, ** p < 0.05, * p < 0.1.
Table 9.
Effect of the percentages of consumption categories in the relation of consumer credit and HCEs.
Table 9.
Effect of the percentages of consumption categories in the relation of consumer credit and HCEs.
| Variables | (1) | (2) | (3) | (4) |
|---|---|---|---|---|
| Logarithm of per capita consumption | 0.979 *** | |||
| (0.00193) | ||||
| Mortgage | 0.00647 ** | 0.00297 | −0.000118 | |
| (0.00316) | (0.00217) | (0.000269) | ||
| Short-term credit | 0.0448 *** | 0.0329 *** | 0.000812 | |
| (0.0111) | (0.0103) | (0.00109) | ||
| Percentage of credit card | 0.0102 *** | 0.00407 ** | 0.000177 | |
| (0.00212) | (0.00186) | (0.000252) | ||
| Percentage of food | 0.00275 *** | −0.00180 ** | 0.00707 *** | |
| (0.000971) | (0.000916) | (0.000121) | ||
| Percentage of cloth | 0.0223 *** | 0.0127 *** | 0.0128 *** | |
| (0.00129) | (0.00131) | (0.000164) | ||
| Percentage of facilities | 0.0243 *** | 0.0166 *** | 0.0135 *** | |
| (0.00151) | (0.00152) | (0.000186) | ||
| Percentage of housing | −0.0336 *** | −0.0238 *** | 0.0117 *** | |
| (0.00276) | (0.00332) | (0.000342) | ||
| Percentage of communication | 0.0327 *** | 0.00719 *** | 0.0123 *** | |
| (0.00168) | (0.00168) | (0.000215) | ||
| Percentage of transport | 0.0103 *** | 0.00749 *** | 0.0134 *** | |
| (0.00177) | (0.00157) | (0.000213) | ||
| Percentage of medical care | 0.0320 *** | 0.0147 *** | 0.00850 *** | |
| (0.00140) | (0.00135) | (0.000179) | ||
| Percentage of recreation | 0.0384 *** | 0.0309 *** | 0.0364 *** | |
| (0.00118) | (0.00108) | (0.000151) | ||
| Income | 0.160 *** | 0.145 *** | 0.00193 * | |
| (0.0187) | (0.0166) | (0.00117) | ||
| Income expectation | 0.0384 *** | 0.0274 *** | 0.00178 | |
| (0.0110) | (0.00926) | (0.00134) | ||
| Size | −0.190 *** | −0.183 *** | −0.00293 *** | |
| (0.00990) | (0.00914) | (0.000893) | ||
| Marriage | −0.0588 *** | 0.0657 *** | 0.0176 *** | |
| (0.0210) | (0.0184) | (0.00261) | ||
| Gender | 0.0421 ** | 0.0174 | −0.000520 | |
| (0.0172) | (0.0148) | (0.00221) | ||
| Education | 0.0469 *** | 0.0127 | −0.00181 | |
| (0.0122) | (0.0102) | (0.00160) | ||
| House ownership | −0.0161 *** | 0.00346 | 0.000839 *** | |
| (0.00282) | (0.00260) | (0.000289) | ||
| Car ownership | 0.0553 *** | 0.0441 *** | −0.000406 | |
| (0.00386) | (0.00359) | (0.000421) | ||
| City | -- | -- | -- | |
| (--) | (--) | (--) | ||
| Constant | 2.957 *** | 3.001 *** | 2.491 *** | −3.766 *** |
| (0.162) | (0.0846) | (0.174) | (0.0194) | |
| Observations | 5746 | 5746 | 5746 | 5746 |
| R-squared | 0.451 | 0.341 | 0.608 | 0.991 |
The dependent variable is logarithm of per capita carbon emissions. The definitions of the percentages of each consumption category are according to Model (15). The definitions of the other independent and control variables are shown in Table 2. Standard errors in parentheses: *** p < 0.01, ** p < 0.05, * p < 0.1.
© 2017 by the authors. Licensee MDPI, Basel, Switzerland. This article is an open access article distributed under the terms and conditions of the Creative Commons Attribution (CC BY) license (http://creativecommons.org/licenses/by/4.0/).
Share and Cite
MDPI and ACS Style
Xu, X.; Han, L. Diverse Effects of Consumer Credit on Household Carbon Emissions at Quantiles: Evidence from Urban China. Sustainability 2017, 9, 1563. https://doi.org/10.3390/su9091563
AMA Style
Xu X, Han L. Diverse Effects of Consumer Credit on Household Carbon Emissions at Quantiles: Evidence from Urban China. Sustainability. 2017; 9(9):1563. https://doi.org/10.3390/su9091563
Chicago/Turabian StyleXu, Xinkuo, and Liyan Han. 2017. "Diverse Effects of Consumer Credit on Household Carbon Emissions at Quantiles: Evidence from Urban China" Sustainability 9, no. 9: 1563. https://doi.org/10.3390/su9091563
Note that from the first issue of 2016, this journal uses article numbers instead of page numbers. See further details here.