Analysis of Rainfall-Induced Landslide on Unsaturated Soil Slopes

1
Department of Civil and Environmental Engineering, Yonsei University, Seoul 03722, Korea
2
Civil and Environmental engineering, Nanyang Technological University, Singapore 639798, Singapore
*
Author to whom correspondence should be addressed.
Sustainability 2017, 9(7), 1280; https://doi.org/10.3390/su9071280
Submission received: 30 May 2017
/
Revised: 14 July 2017
/
Accepted: 20 July 2017
/
Published: 21 July 2017
Abstract
:This paper investigates rainfall-induced landslides on partially saturated soil slopes using the 2011 Umyeonsan landslides at the center of Seoul, Korea. An integrated analysis of rainfall-induced landslide was carried out through laboratory tests, field tests, and numerical analysis. The results of comprehensive investigations in the Umyeonsan region demonstrate that landslide activity is closely related primarily to rainfall and soil properties and slope geometry, and vegetation. Numerical analysis was also performed to confirm the effect of these factors on landslide occurrence. Special attention was given to rainfall penetration analysis to determine the wetting band depth for shallow and deep-seated slope failure in watershed-scale landslide. The simulated results agree closely with the investigation results, which indicates that the applied method is appropriate for use in the simulation of landslides in unsaturated soils.
1. Introduction
Landslides are common mass-movement processes in mountainous areas, particularly in areas covered by residual soils overlying extensively weathered granite [1,2]. Precipitation-triggered landslides represent a significant threat to lives, livelihoods, and infrastructure in most mountainous areas. For example, when South Korea experienced record rainfall in June and July 2011, some 150 landslides occurred in the Umyeonsan region, affecting 13 villages. These landslides significantly impacted society because the mountain is located in a central part of Seoul, South Korea.
The triggering mechanisms of natural slopes frequently comprise a complex interaction between hydrological and geotechnical processes, which in turn depends on irregular topography, hydro-geotechnical properties, boundary conditions such as permeability, and the initial state of the slope [3]. From a geotechnical perspective, the main reason for slope failure is the loss of matric suction and hence a loss of effective stress as water infiltrates the soil. Many researchers [2,4,5] have studied rainfall-induced landslides through laboratory and field tests, as well as through numerical analysis. They have presented a mechanism for rainfall-induced landslides that commonly occur when the wetting bands progress into the soil, resulting in a loss of suction and a reduction in effective stress [6,7]. According to related studies by Rahardjo et al. [8], Ng et al. [9,10] and Jeong et al. [2], landslides are commonly triggered by external stimuli, including modified slope stability conditions, increasing stress, or reductions in strength.
The susceptibility analysis of rainfall-induced landslides on a large scale is usually performed using deterministic methods such as the Limited Equilibrium Method (LEM) and Finite Element Method (FEM). They are significant in determining the cause and mechanism for slope failure, such as slope geometry, the mechanical properties, permeability, and equilibrium condition. Physically-based landslide analysis models such as TRIGRS [11,12], GEOtop [13], r.slope.stability [14], used for wide area landslide analysis. GEO-SLOPE [15], PLAXIS [16], and Soil Vision [17], which are based on FEM programs, are widely used [18,19,20,21] for simulating the seepage problem and slope stability. Where a major part of the slip surface is below the groundwater table, the shear strength contribution from negative pore-water pressures above the groundwater table is often ignored by setting their magnitudes to zero. However, in situations where the ground water table is deep or there is concern over the possibility of a shallow failure surface, negative pore water pressures can no longer be ignored [2,22,23].
This paper investigates a rainfall-induced landslide on partially saturated soil slopes using the 2011 Umyeonsan landslides at the center of Seoul, Korea. In addition, the result of the comprehensive investigation is presented to determine the cause of the activation of landslides in the Umyeonsan region. The specific objectives of this study are (1) the identification of geomorphological features and the spatial distribution of the landslides, (2) integrated analysis through laboratory tests, field tests, and numerical analyses, (3) the discussion on the results from the comprehensive investigation and the numerical analyses and (4) the discussion on the rigorous analytical method using the hydro-geotechnical coupled analysis to determine the wetting band depth for shallow and deep-seated slope failure in watershed-scale landslide.
2. Study Area
2.1. Regional Framework of the Study Area
The study area of Mt. Umyeonsan is located in the central part of Seoul, Korea (Figure 1). This site is positioned at latitude of 37°28′2′′ N and longitude of 127°0’25” E with an elevation of approximately 50 to 312.6 m above sea level. The study area is underlain by metamorphic Precambrian gneissic rocks that belong to the Gyeonggi massif. The bedrock mineralogy is primarily composed of plagioclase, quartz, biotite, feldspar, and amphibole. The fault system in the study area is oriented NE–SW and is related to the Chugaryeong Fault Zone. The bedrock is heavily fractured, intensely weathered, and covered by a layer of colluvium varying in thickness from a few centimeters to 13 m. The colluvial deposit consists of a poorly sorted mixture of sands and gravels in a silty matrix. The colluvium is directly associated with the origin and development of mass movement in this area. The Umyeonsan region is situated in the temperate monsoon zone, which is generally hot and humid with abundant rainfall in the summer. The annual average precipitation ranges between 1100 and 1500 mm, with 70% of the average rain falling in summer season. In this area, small landslides frequently occur during the rainy season. The most catastrophic recorded landslides and debris flows occurred on Mt. Umyeonsan on 27 July 2011. The rain intensity of this event was, 19.2 mm/h and cumulative 24-h rainfall were 425.5 mm, the higher intensity and longer duration of rainfall not only in the Umyeonsan region but also in the majority of the regions in Korea [23,24].
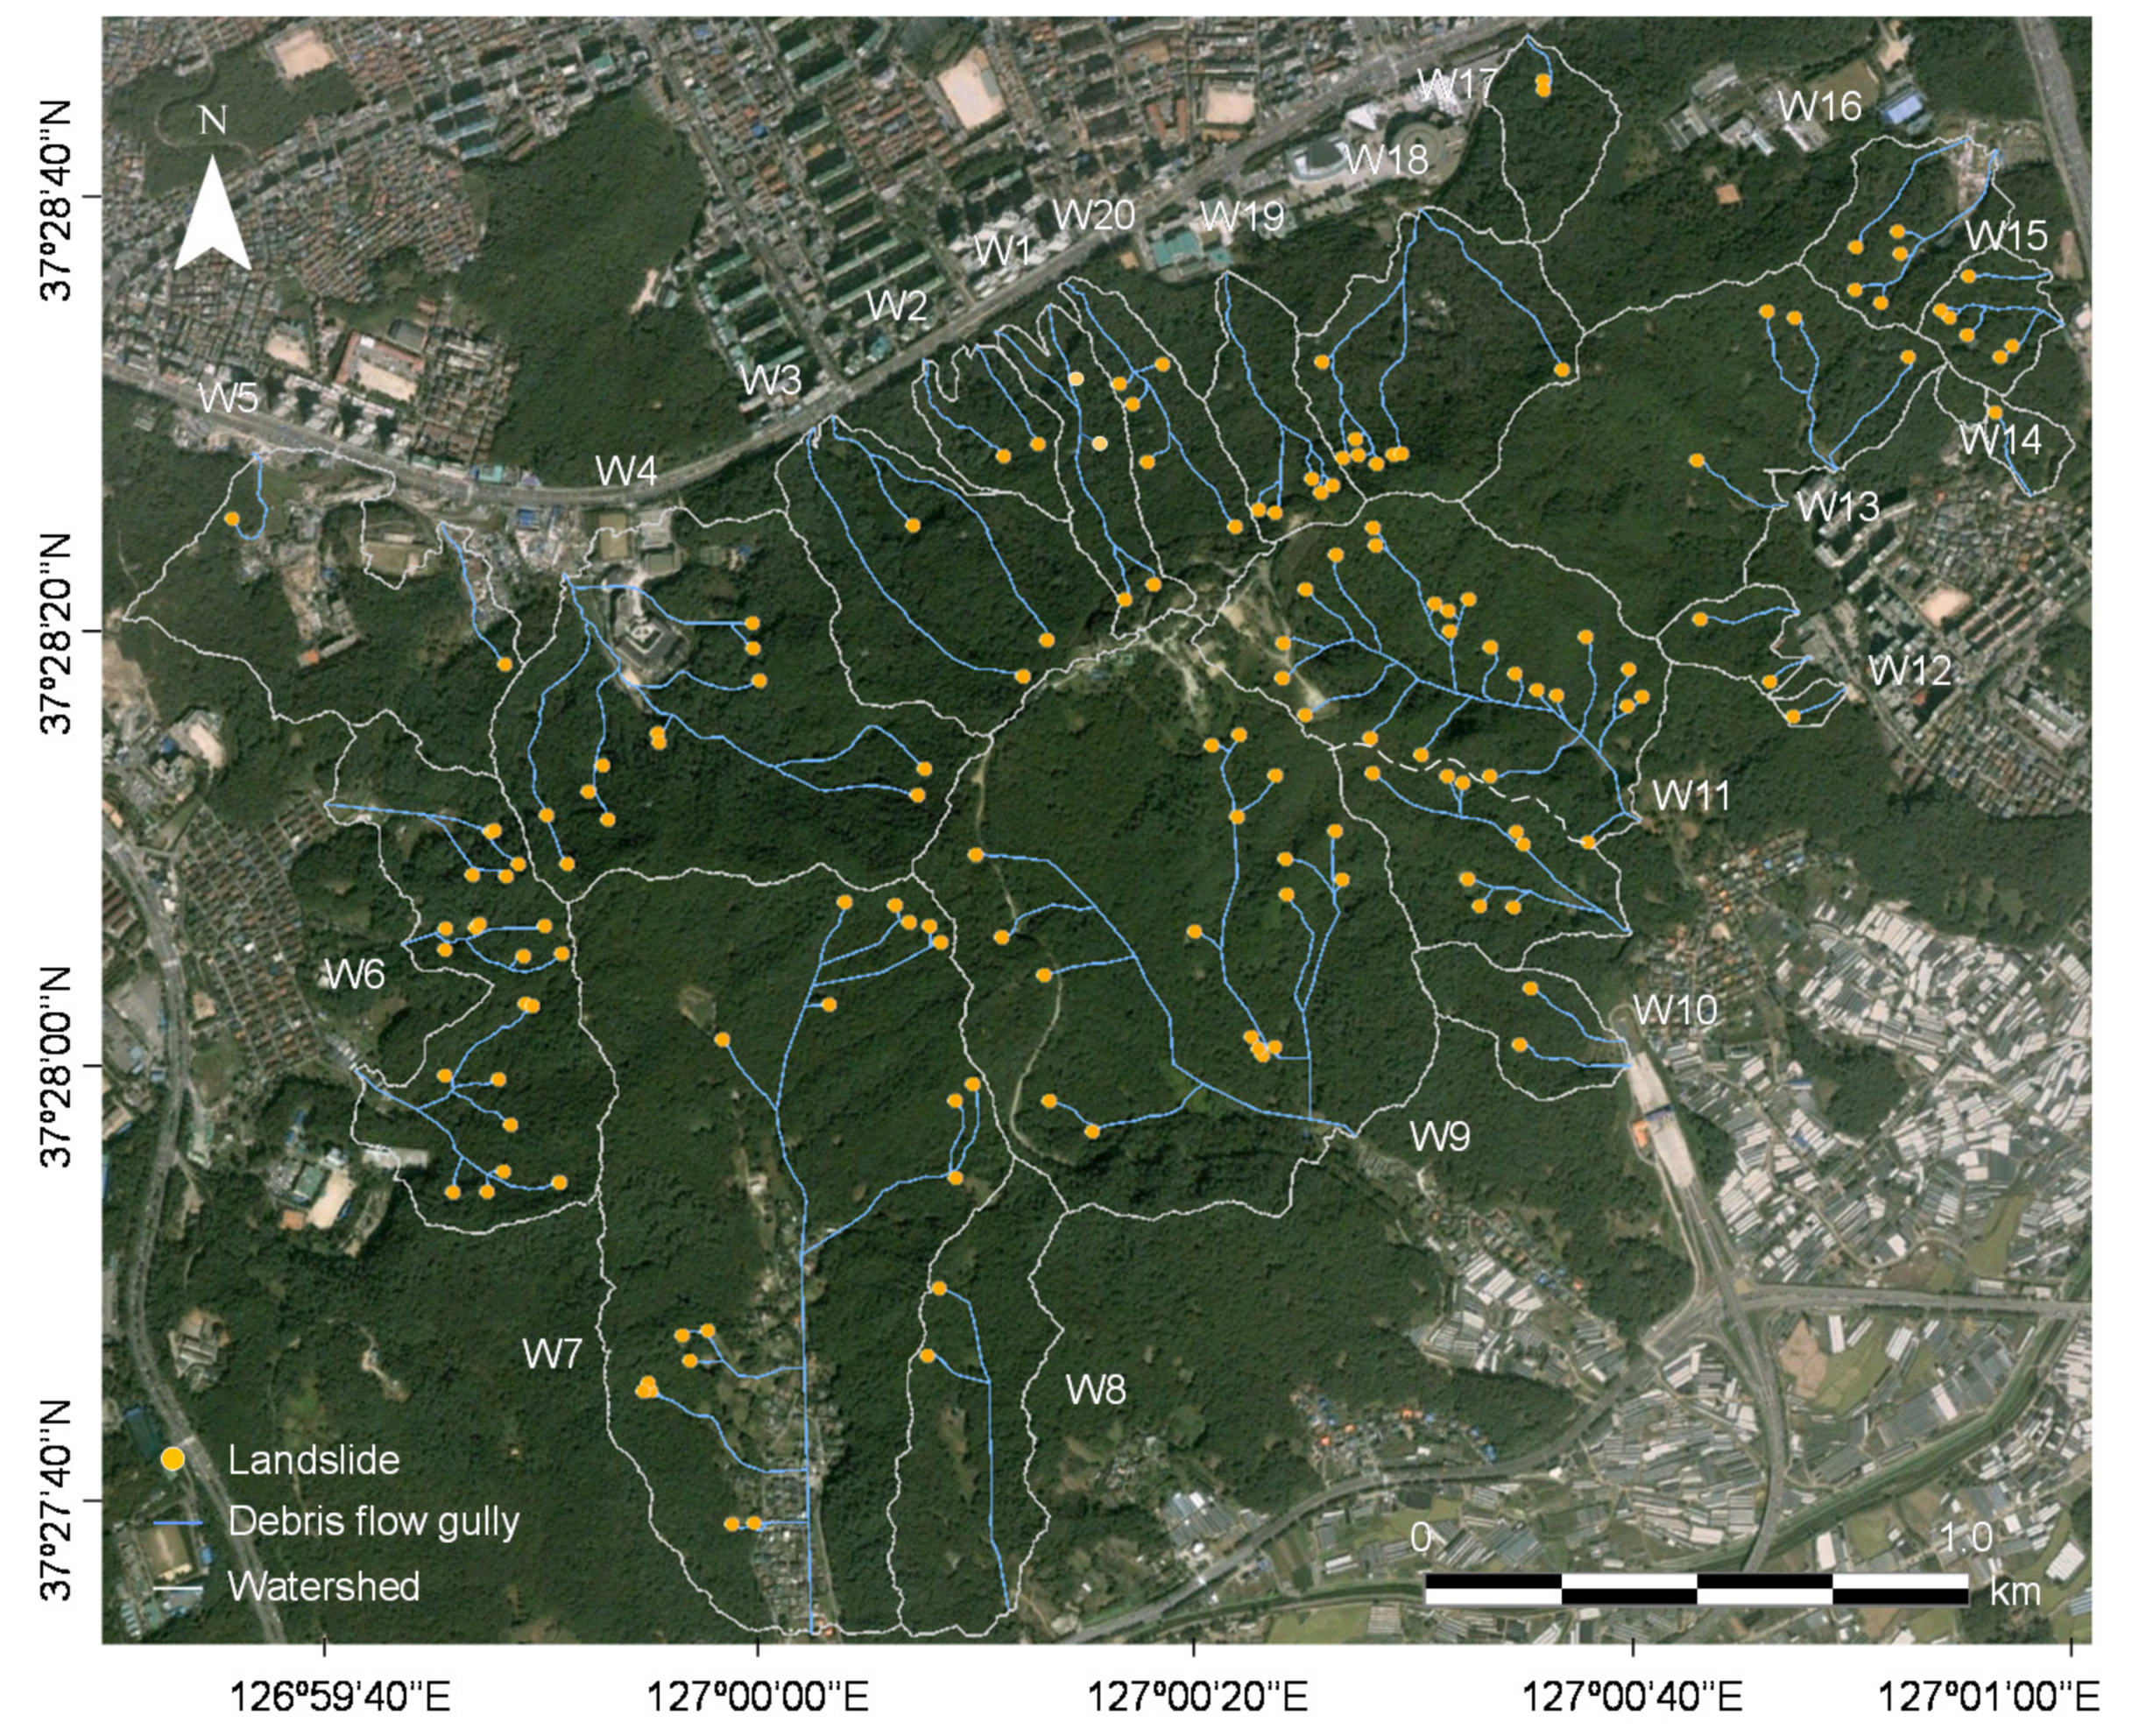
The catastrophic events that hit the Umyeonsan region include 151 landslides and 33 debris flows in 20 watersheds [25]. The landslides are concentrated along the ridgeline of the mountain where slopes are steepest. The slope soil has low strength and low density. Debris flows was similar to fluid flow and the volume was increased by eroding the ground. A catastrophic landslide watershed, Raemian and Deokuam (W1 and W20 in Figure 2), was selected as a study area.
2.2. Geological and Geomorphological Data
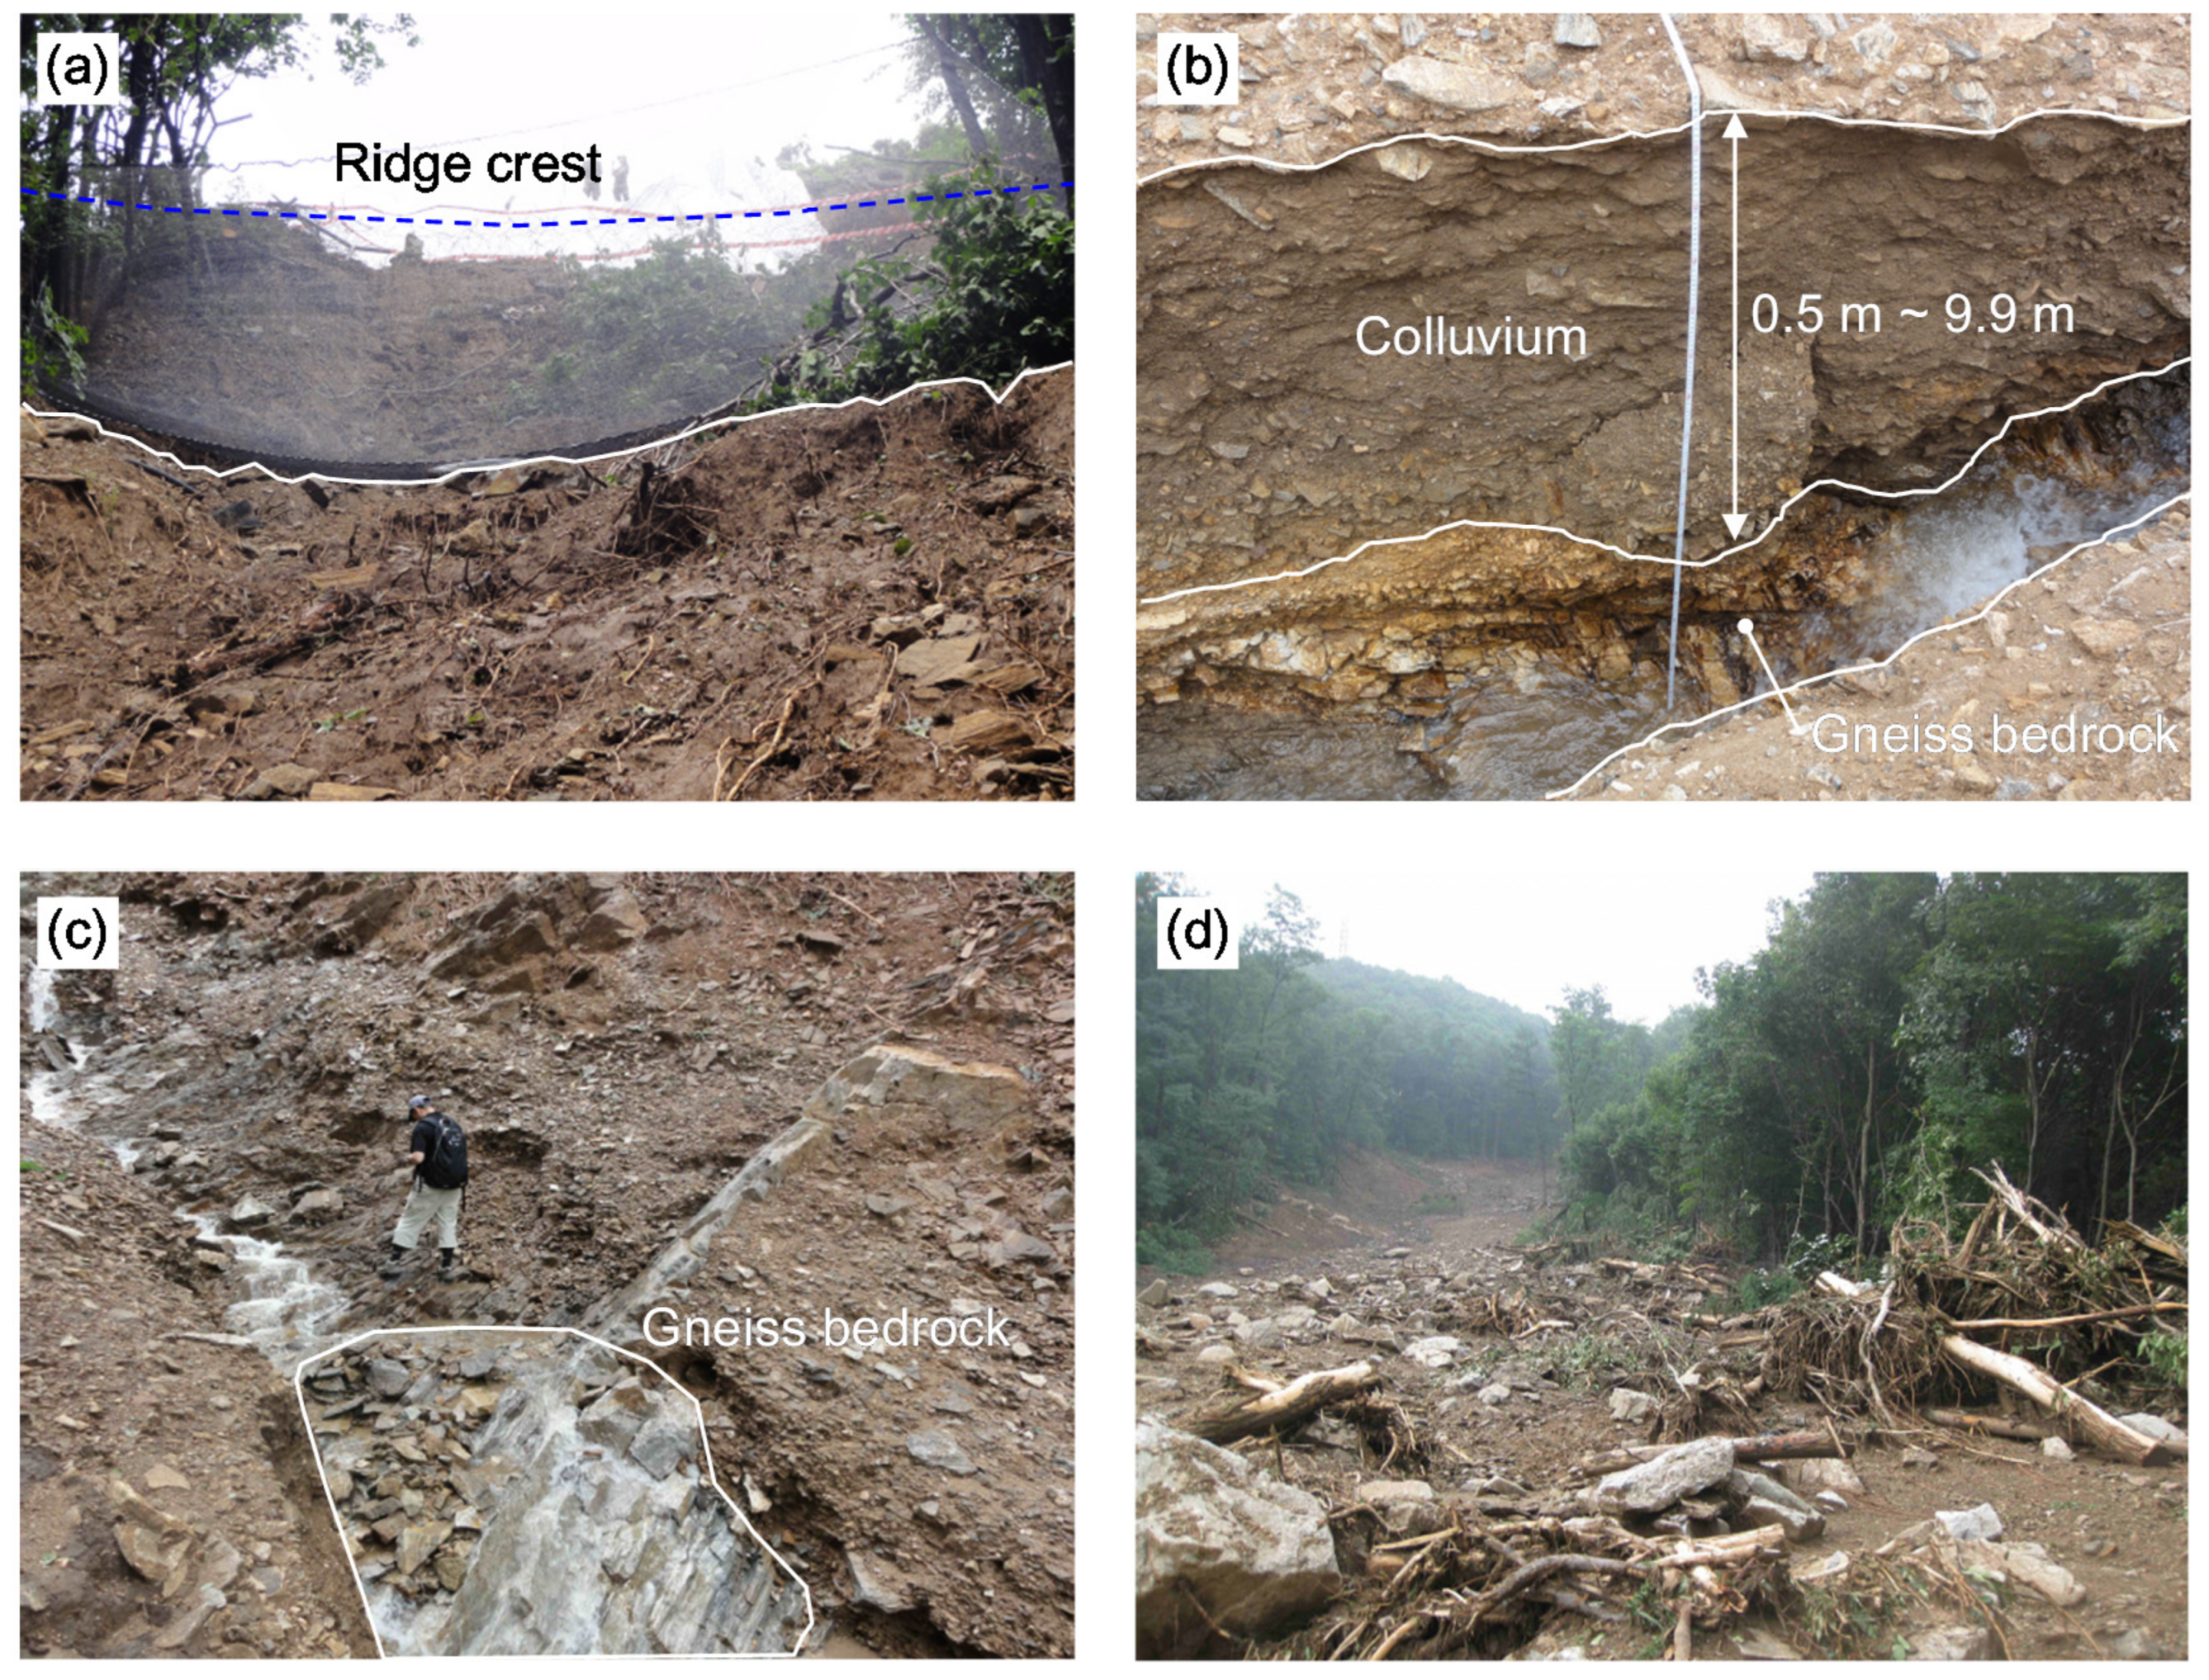
The morphology of the Umyeonsan region [25] is characterized by a series of watersheds with surface areas ranging from 17,700 to 786,400 m2, channel gradient generally less than 22 degrees, and a maximum runout distance of all debris flows of 1365 m. Individual watersheds contain up to 30 landslides and these form the main source of the debris flow development. The mobilized volume ranges from 8 to 1827 m3 in each gully. The Raemian watershed (W1, study area) has the largest debris flow volume of 1827 m3, some 52% of the total landslide volume. Landslides are initiated at slope angles ranging from 16 to 44° and some 60% of all landslides occurred at slope angles greater than 30°. The morphological characteristics are summarized in Table 1. It can therefore be concluded that most debris flows will also originate at slope angles close to 30°, and this observation is supported at other sites [26]. Field surveys revealed that landslide and debris flow in the Umyeonsan region were the result of three main steps: (1) initial failure produces a shallow landslide trace caused by the transitional sliding of the loose colluvium overlying gneiss bedrock (Figure 3a). (2) with the incorporation of surface water runoff resulting from intensive rainfall, the soil mobilizes completely to form debris flows; (3) overland flow in rills is gradually concentrated in the gully, which then easily erodes the loose debris flow deposits and runs rapidly downhill in relatively narrow channels. The depth of these channels varied from 0.1 to 1.5 m, and the base of the gullies was located within the colluvial layer or along the interface between the colluvium and bedrock (Figure 3b). The gneiss bedrock, where exposed, was deeply fractured and highly weathered (Figure 3c). The intense rainfall was concentrated in steep bedrock channels with relatively thick colluvium. It caused surface runoff. The transported debris flow was deposited at the toe of the mountain. The debris flow material was comprised of various sizes of rock, soil, woody blocks, and water (Figure 3d). In general, the gneiss has thick weathering layers enriched in fine particles and clay minerals that appear to be essential for long-distance debris flow transport [27].
3. Methodology
3.1. Laboratory and Field Tests
Both field and laboratory studies were conducted to determine the geotechnical, hydrogeological and vegetation characteristics and to investigate the geomorphological features and spatial distribution of the landslides. These included interpretation of aerial photographs, analysis of rainfall records, visual inspection, and plant community survey. The rainfall data recorded by two automatic rain gauges, in Seocho and Namhyun stations, were used to assess landslide triggering rainfall conditions. Both stations are located 2 km from the highest peak of the Umyeonsan region (Figure 1).
To explore the species distribution and structural diversity of vegetation communities, a field survey was conducted at the Raemian watershed. All the trees in a radius of 11.3 m and an area of 400 m2 were investigated. A total of six circles were investigated (Figure 4). As a result, 149 woody species were recorded: all living trees (the diameter at breast height, DBH > 0.06 m) were counted, and the characteristics of vegetation communities that include species, DBH, height, and root depth were measured.
Ground investigation was performed to determine the geotechnical and hydrogeological properties of the initiation (landslide) and transportation areas of the debris flows. Five boreholes were drilled to confirm the stratigraphy previously described and to undertake in situ tests including standard penetration tests (SPT), saturated permeability tests, and borehole shear tests. Six trial pits were also constructed to characterize the surficial materials that remained along the debris flow gullies. Both disturbed and undisturbed soil samples were obtained for laboratory tests.
The laboratory program to characterize the colluvial soil included tests for the following: (1) soil classification (ASTM D2487-11); (2) water content (ASTM D4643-08); (3) Atterberg limits (ASTM D4318); (4) grain size distribution (ASTM D422-63); (5) soil-water characteristic curves (ASTM D6836-02, ASTM D5298-94); and (6) shear strength parameters from direct shear tests (ASTM D3080). Matric suction that reflects soil infiltration is considered very important to analyze rainfall-induced landslides in this landscape [28]. Therefore, the volumetric water content is estimated as a function of the matric suction of soil by laboratory tests and the initial matric suction is measured in the field.
The soil water characteristic curve (SWCC), which represents the relationship between volumetric water content and matric suction, is a fundamental input parameter in the seepage analysis. For the seepage analysis, the input parameters such as unsaturated permeability, volumetric water content (dependent on matric suction) and initial matric suction for the soil (which governs the groundwater flow) have been derived from the soil–water characteristic curves of the soils. The SWCC and initial matric suction can be obtained by laboratory tests and field measurements.
In order to get the hydrogeological characteristics of the landslide, the matric suction is monitored with a jet-filled tensiometer [29]. On the other hand, the osmotic suction was not measured.
Figure 4 shows a location of installed tensiometer. A total of 18 tensiometers were installed at six different locations (T1-T6) adjacent to the debris flow gullies (only the results for T1 and T5 are presented here). At each location, three tensiometers were embedded within the colluvial layer at depths of 0.3, 0.6, and 1.3 m below the ground surface.
3.2. Landslide Analysis
Numerical studies were conducted to investigate the influence of anticipate rainfall and in situ matric suction distributions on the landslides at the watershed scale. This numerical method incorporates field matric suction and rainfall data at the watershed. The mechanism of rainfall-induced landslides is influenced by matric suction, which plays a crucial role in unsaturated soils. In this regard, a series of transient seepage and limit equilibrium analyses are performed using commercial programs, SEEP/W and SLOPE/W [15], respectively. The results from the transient seepage analyses are used as input parameters for a subsequent limit equilibrium analysis of landslide.
Transient seepage analyses were carried out by means of a two-dimensional finite element program, SEEP/W. The transient seepage equation for a 2D unsaturated medium is based on the theorem of the continuity of the water phase and the assumption of negligible influence of the air flow used in the FEM program can be expressed as:
where kx and ky are the permeability coefficients in x and y directions, respectively. H is the total water head. q is rainfall and mw is the slope of SWCC. In SEEP/W program, the permeability function of unsaturated soils is calculated from the SWCC fitted, based on the saturated permeability coefficient Ksat. In this study, van Genuchten [30] SWCC model was used. Limit equilibrium analyses were conducted by using SLOPE/W to determine the safety factor of the landslide, based on the pore water pressure distributions from the transient seepage analyses. And the minimum factor of safety is determined within the range for a slope failure. Strength parameters of unsaturated soils are needed for estimating the safety factor using Bishop’s simplified method. A modified form of the Mohr–Coulomb equation must be used to describe the shear strength of an unsaturated soil (i.e., a soil with negative pore water pressures). The shear strength equation is:
where ua is the pore air pressure and uw is the pore water pressure. ϕb is the angle indicating the rate of increase in shear strength relative to the matric suction.
This equation indicates that the shear strength of a soil can be considered as having three components (c’, φ’, ϕb). For most analyzes the pore air pressure can be set to zero. This analysis uses ϕb whenever the pore water pressure is negative and ϕ’ whenever the pore water pressure is positive. The internal friction angle associated with matric suction is called ϕb and can be estimated as an alternative solution [31]. For the friction angle of unsaturated soils, Equation (3) [22] is used:
where θ is the volumetric water content, and θs and θr are the saturated and residual volumetric water content, respectively.
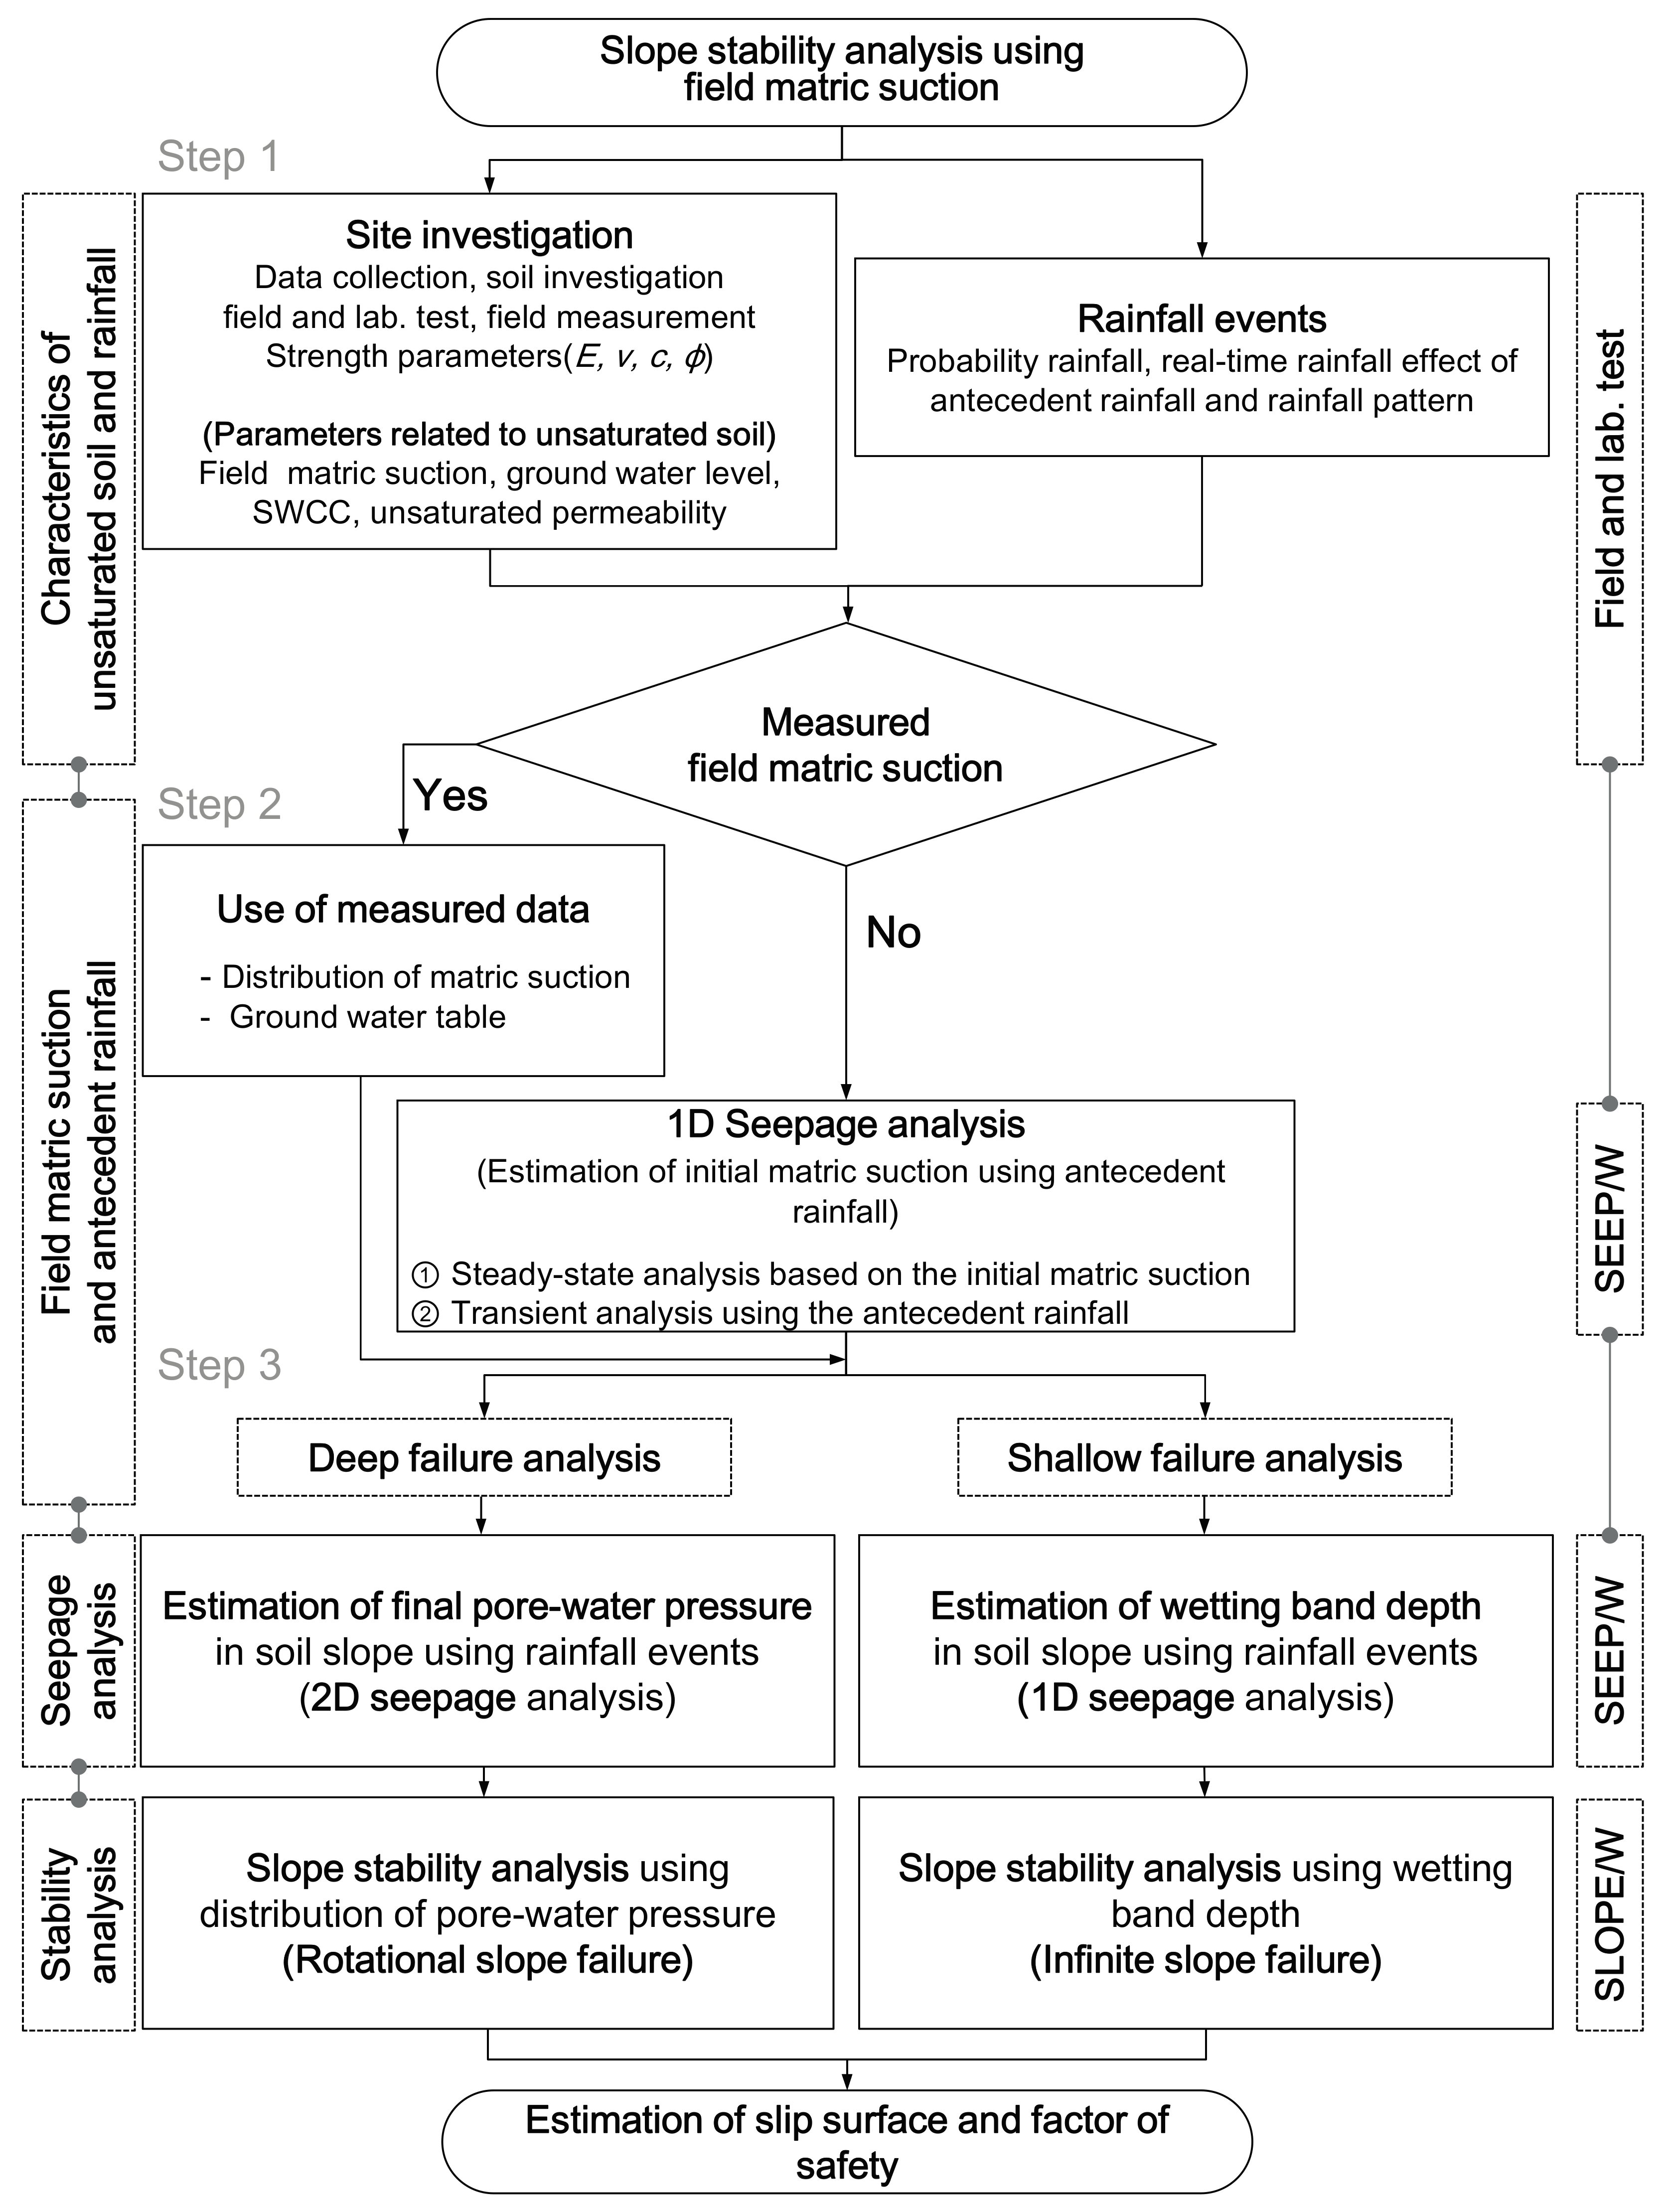
For landslide analyses considering anticipate rainfall and matric suction, the methodology for evaluating rainfall-induced landslide in watershed scale was summarized through field investigations, laboratory tests, and numerical analyses. The flowchart shown in Figure 5 can be divided into three steps: (1) defining unsaturated characteristics of a soil and rainfall characteristics; (2) evaluating initial matric suction; and (3) conducting seepage and stability analyses. The first stage is to define the index properties and unsaturated characteristics through the geotechnical survey and laboratory test. The second step is to evaluate initial matric suction of the site for seepage analysis. To consider initial matric suction, field measurement of matric suction should be carried out on the site. When the field data required for determining initial conditions are unavailable, one-dimensional (1D) infiltration model analysis can be used to determine the wetting band depth. The test site can be modeled as a one-dimensional column and the steady state seepage analysis is performed using a pressure head boundary condition to be dry condition. To consider antecedent rainfall, a steady-state seepage analysis is first performed to generate the initial condition of the site. Subsequently, a transient seepage analysis is performed based on the real-time rainfall record. As a result, the calculated pore-water pressure distribution is considered as initial conditions, which is used to calculate the new pore-water pressure distribution of the two-dimensional analysis. The third stage is to conduct seepage analyses with pore-water pressure distribution and stability analysis, Slope instabilities can be divided into shallow failure and deep-seated failure.
In the case of infinite slope failure, the wetting band depth obtained from the seepage analysis is applied to the design slope. Perform a stability assessment of the shallow slope. The deep-seated landslides may be attributed to the deepening of a wetting front into the slope due to rainfall infiltration and groundwater rise, which results in an increase in moisture content, a decrease in soil matric suction, and a decrease in shear strength on the potential failure surface. Therefore, in the case of deep fracture analysis, consideration should be given to rainfall infiltration and groundwater flow. In the case of circular failure, the initial pore water pressure distribution determined through one-dimensional infiltration model or field measurement, and then rainfall infiltration analysis conducted with considering groundwater table. It is used as the initial value for slope stability analysis. Thereafter, the further slope stability analysis is performed.
4. Results and Discussion
4.1. Rainfall Characteristics
The return period of rainfall intensities of this rainstorm for different durations was determined by applying the Gumbel distribution to the historical rainfall records of the Seoul observatory, where records began in 1961. The Seoul observatory is located 11.7 km from the Umyeonsan peak.
According to the Korea Meteorological Administration, the average annual rainfall among Seoul is approximately 1450.5 mm, and during the summer season (June, July, August), a total of 892.1 mm of rainfall precipitation is recorded, which accounts for approximately 61% of the annual precipitation rate. It can be deduced that the summer season receives a large portion of the annual rainfall [32].
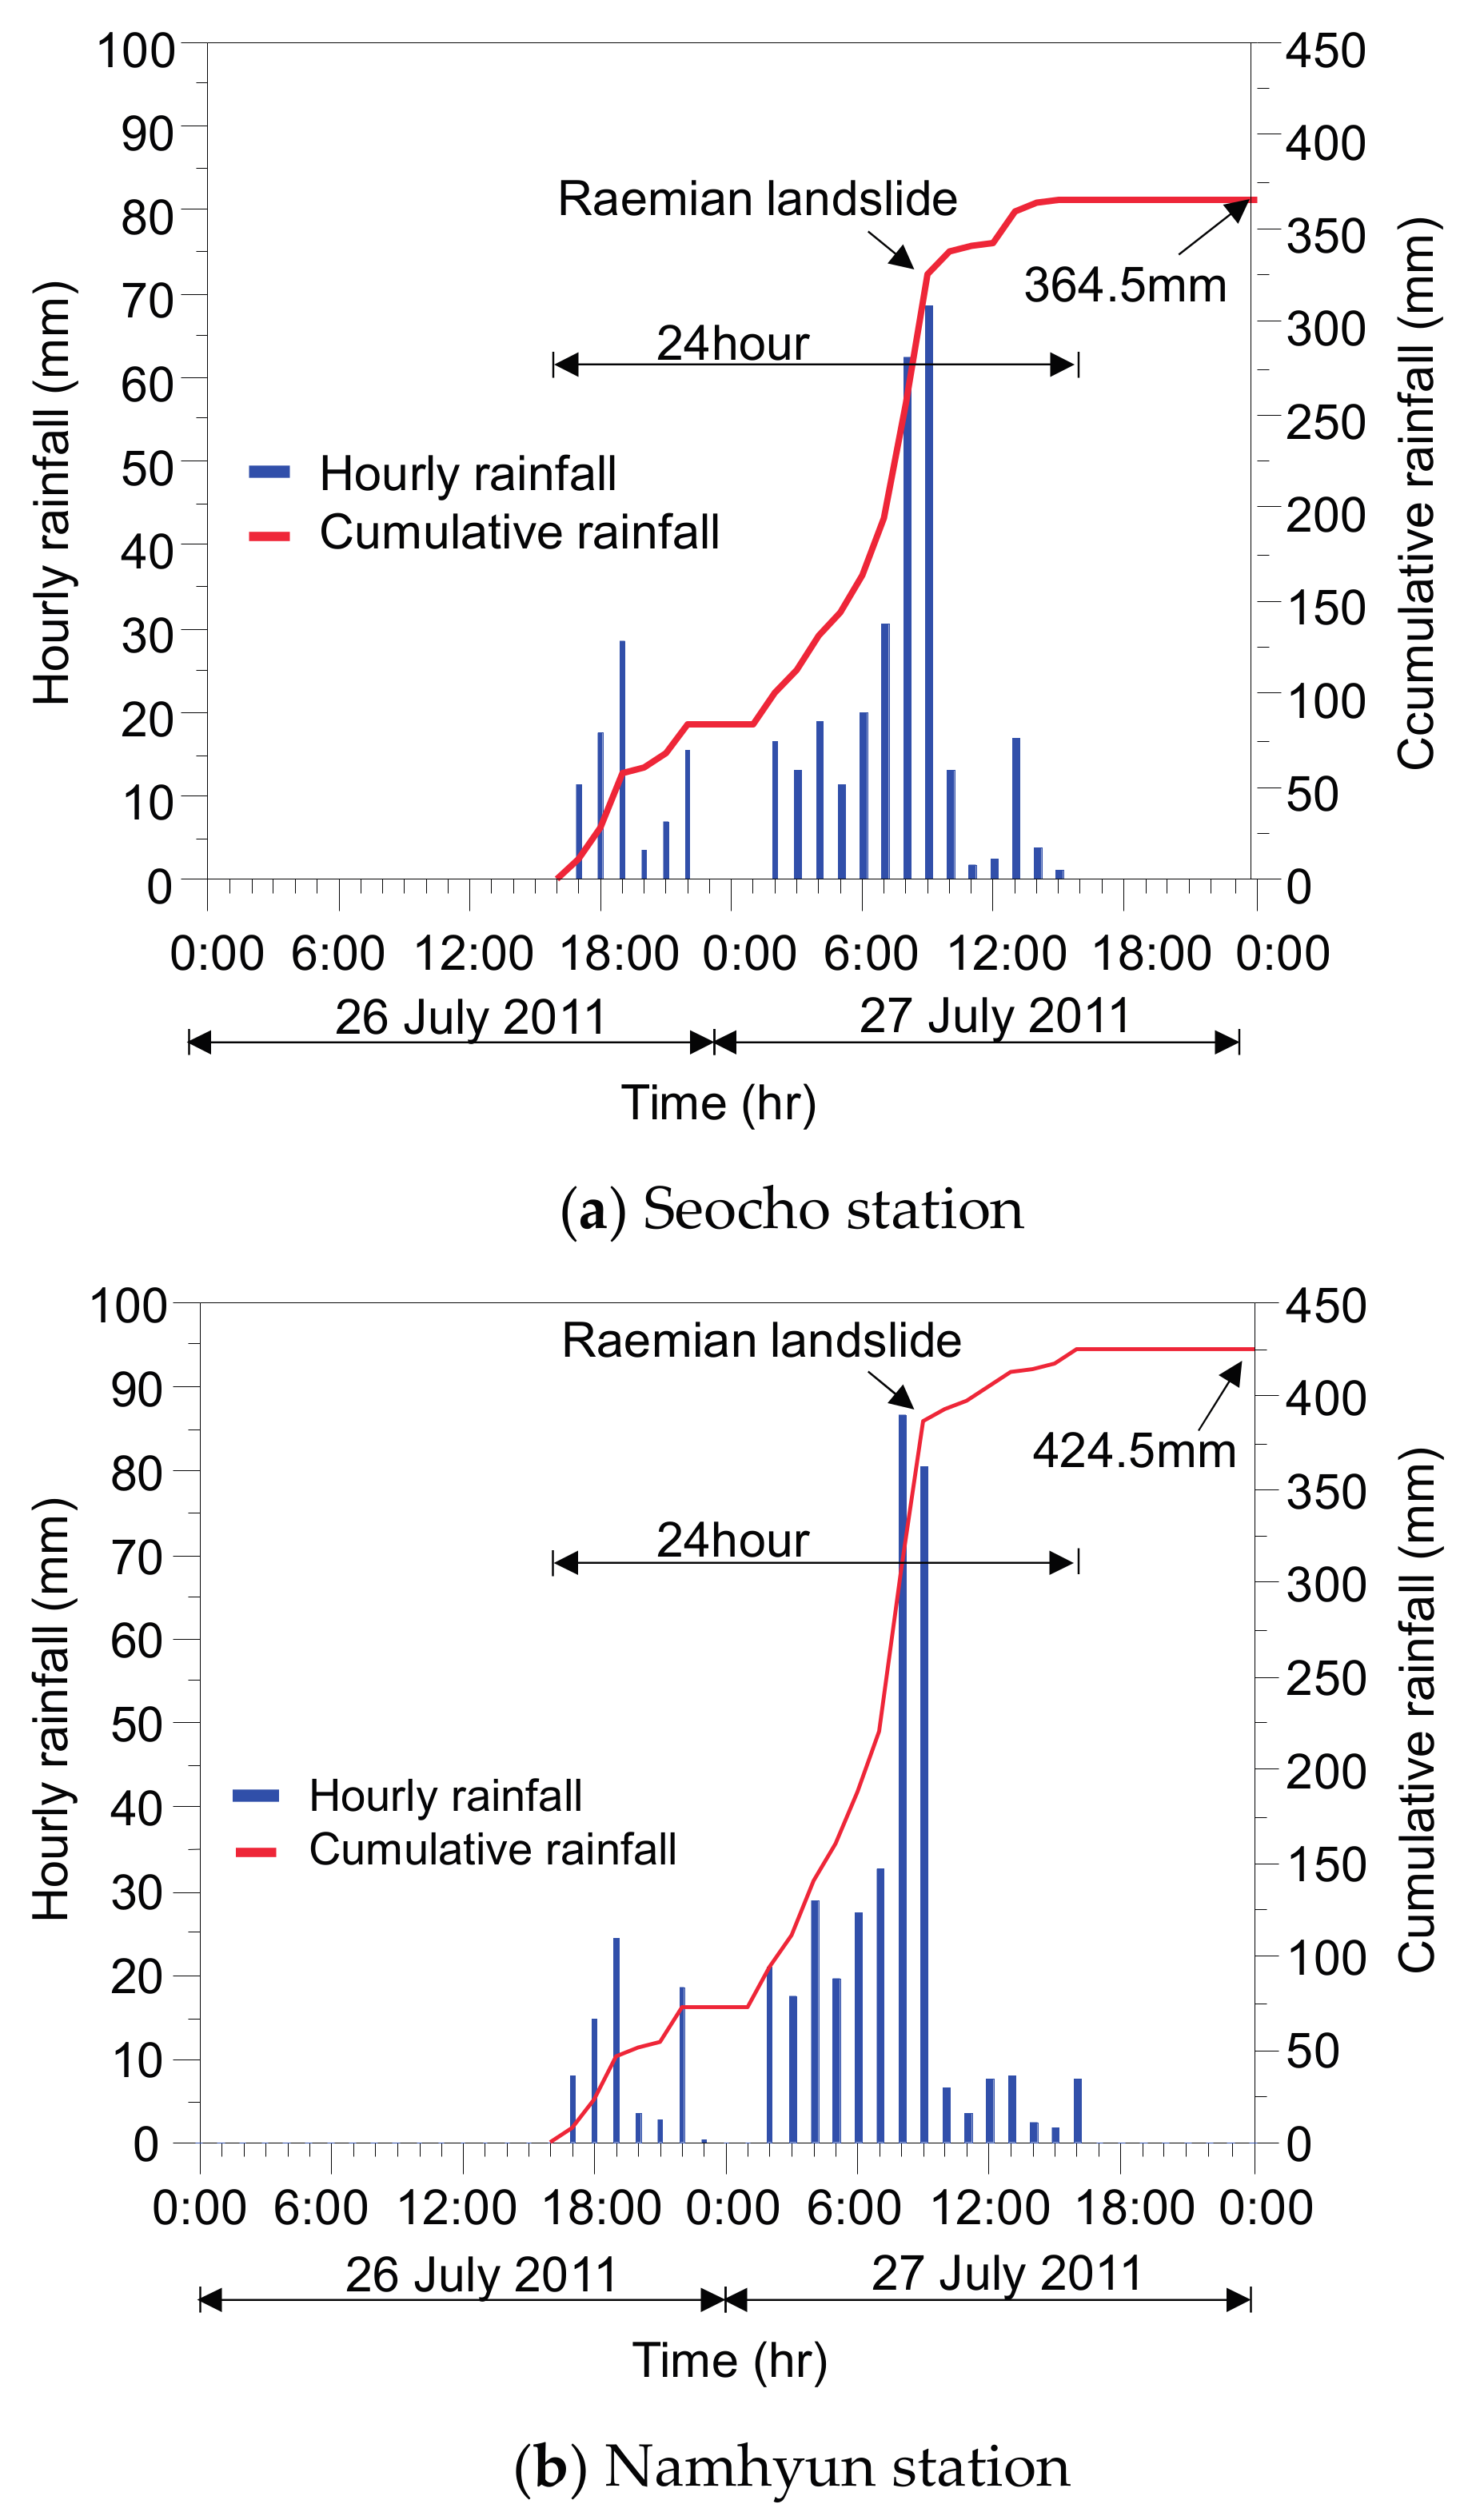
Figure 6 shows the hourly and cumulative rainfall for 26–27 July 2011 recorded at the rain gauges installed at Seocho and Namhyun stations. The cumulative 24-h rainfall ending at 12:40 p.m. on 27 July 2011 was 364.5 mm and 425.5 mm, respectively (i.e., very heavy rainfall). The maximum hourly rainfall for the station was 85.5 mm and 112.5 mm, which occurred between 7:40 and 8:40 a.m. on 27 July 2011. The 1-h rainfall registered at the Seocho and Namhyun station was very severe, with a corresponding return period of more than 120 years. Interestingly, the peak hourly rainfall coincided well with the time triggering of the landslides at the Raemian watershed (starting at 8:30 p.m.).
The event occurred on 26–27 July 2011. Accumulation of rainfall during this period was unprecedented, which played a critical role in the landslide’s occurrence. Rainfall intensity-duration thresholds (ID-curve method) are commonly used to predict the temporal occurrence of landslides, and the validity of the rainfall thresholds was also established within physically-based model results [33]. The thresholds represent the lower limit of peak rainfall intensities that induce landslides. Empirical ID thresholds are usually in the form of a power law equation [34]:
where I is the rainfall intensity (mm/h), D is the duration (hour), and α and β are the empirical constants. Considering the duration of rainfall (16 h) prior to the Raemian landslide and the corresponding cumulative rainfall of 306.5 mm for the Namhyun station, the average rainfall intensity is 19.2 mm/h. For Seocho station, the average rainfall intensity for the same duration is 16.0 mm/h. As shown in Figure 7, this measured rainfall is not only beyond the ID threshold curves of this region as suggested by Hong et al. [35], but also exceeds the international representative ID curves proposed by many researchers [34,36,37,38,39,40,41].
4.2. Vegetation Characteristics
Vegetation, especially trees with root systems, plays a decisive role in slope stability, particularly on steep forested slopes liable to shallow rapid failures. The effect of vegetation on slope stability includes (1) mechanical stabilization of soil by roots and the surcharge from the self-weight of trees, and (2) soil water modification via evapotranspiration [42]. In shallow slopes, the tree roots may penetrate the entire soil mass, which acts as tensile elements within the soil matrix as well as anchors connecting weak soil into adjacent more stable soil. The root fiber reinforcement is highly variable, depending on the type and depth of soils and root characteristics controlled by species, edaphic and hydrological conditions [43].
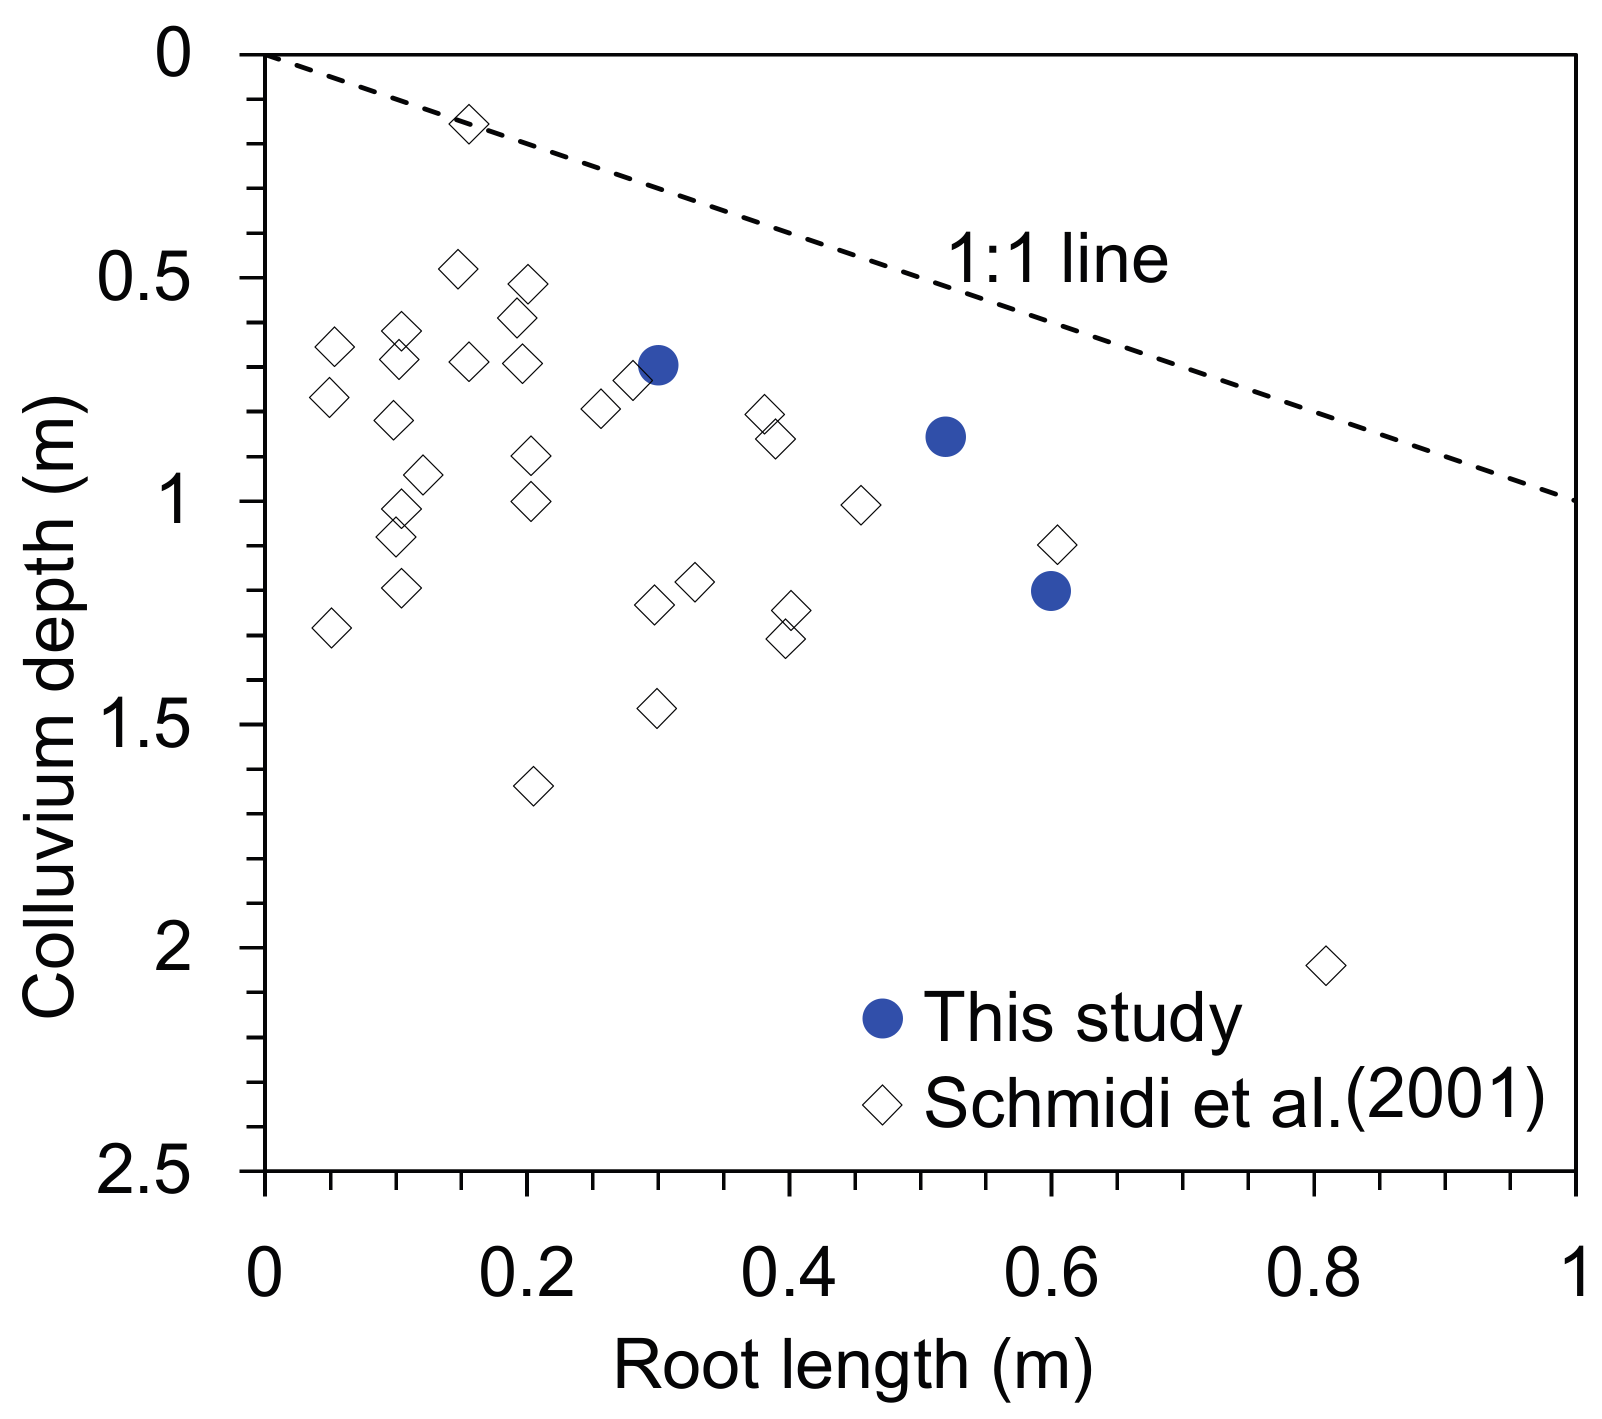
The Umyeonsan region is rich in flora. Species composition is dominated by Quercus mongolica (43%), known as the Mongolian Oak. Since the Mongolian Oak grows fast, it has been widely used in the region for combating soil erosion as well as shallow landslides and debris flows. In the Umyeonsan region, dense understory vegetation (shrubs, bushes and herbs) with many well-branched stems within 2 m of the ground surface were sparsely distributed. The field survey also revealed that the root depths appear to be restricted to the surface layer of <1 m, although the majority of colluvium depths in debris flows lie in the range of 1 to 2 m (Figure 8). Typically, the presence of roots in soil reduces both water content and pore water pressure by the process of evapotranspiration and tree canopies, resulting in an increase of soil shear strength. However, the evapotranspiration and tree canopies are not influencing factors for landslides during the extensive rainy season. In the event of landslides occurring in the Umyeonsan region, soils were saturated and evapotranspiration was low due to the high intensity storm. Hammond [44] suggested the infinite slope model by considering the uniform load from the vegetation and constant number of additional shear strengths from the roots of the vegetation. The resisting Coulomb friction and cohesion on a slip surface to the gravitationally induced downward slope driving stress:
where c’s is the cohesion of the soil, c’r is the constant number of additional shear strengths by the roots of trees, Ds is the depth of the unsaturated soil, Dw is the depth of the wetting band, q0 is the uniform load from trees, γt is the total unit weight of the soil, γsat is the saturated unit weight of the soil, γw is the unit weight of water, and β is the angle of the slope.
In this study, the additional shear strengths by the roots of trees (c’r) is considered as 1 kPa and uniform load from trees (q0) is considered as 0.253 kPa. Consequently, a slight reduction in safety factor had been found in the Raemian watershed analysis (0.01 to 0.08). This result is in accordance with the previous phenomenological approach [45]; it is well known that the self-weight, length, and strength of tree roots have a close relationship with landslides. As confirmed in this study, such results were categorized as contributing factors of the landslide.
4.3. Geotechnical Characteristics
In this study, to obtain the SWCC of top soil on the Raemian watershed of the Umyeonsan region, a pressure plate extractor and filter paper tests were performed. The results of these tests are shown in Figure 9. According to the Unified Soil Classification System (USCS), the top soil can be classified as SM (silty sand). The tested soil water characteristic curve showed an air entry value of 12 kPa, saturated volumetric water content was 50% and by the end of the desaturation, residual volumetric water content fell to 18%.
The matric suction values were measured for 47-day periods from 29 June to 14 August 2012. As shown in Figure 10, the matric suction response to rainfall events at different locations and depths for T2 and T5. The initial matric suction was measured between 75 to 85 kPa at the site on 29 June 2012, prior to the rainy season. After the rainfall began, the matric suction within the colluvium rapidly decreased to 0 and 10 kPa at depths of 0.2 m (T5) and 0.3 m (T2), respectively. At depths of 0.9 m (T5) and 0.6 m (T2), the matric suction reduced to approximately 20 kPa, which is the residual state of the soil. At depths of 1.3 m (T2) and 1.4 m (T5), the matric suction remained at its initial value for five and six days, respectively. Such a phenomenon can be explained by the fact that infiltrated water from rainfall had not yet reached these depths. After some time, due to additional rainfall, matric suction finally decreased. The infiltration rate decreased with increasing depth from the ground. In the field measurement analysis, matric suction at 0.3 m was lower than colluvium located in a deeper layer due to the dominant effect of rainfall infiltration. The results imply that changes in matric suction due to rainfall infiltration increase the water content as well as the unsaturated permeability.
The soil investigation results are summarized in Table 2 and Table 3. Table 2 shows the results of the constant head permeability and shear tests in the boreholes. To best describe the in situ soil properties, shear tests in the borehole (STB) and constant head permeability were conducted, since they can rapidly determine a Mohr–Coulomb failure envelope and permeability in a borehole. Table 3 shows the results of laboratory soil tests performed to obtain the detailed information of slope failure at the Umyeonsan landslide in 2011. The direct shear test of the undisturbed soil samples indicates that the average strength parameters corresponded to cohesion of 9.2 kPa and friction angle of 24.8°, which is similar to those from the in situ tests in the boreholes. The physical properties of the soil samples obtained from depths of 0.15–0.5 m in the colluvium are summarized. Such tabulated material properties of soil are reflected in the seepage analysis. Figure 11 shows the locations of boreholes and seismic prospecting carried out within the watersheds.
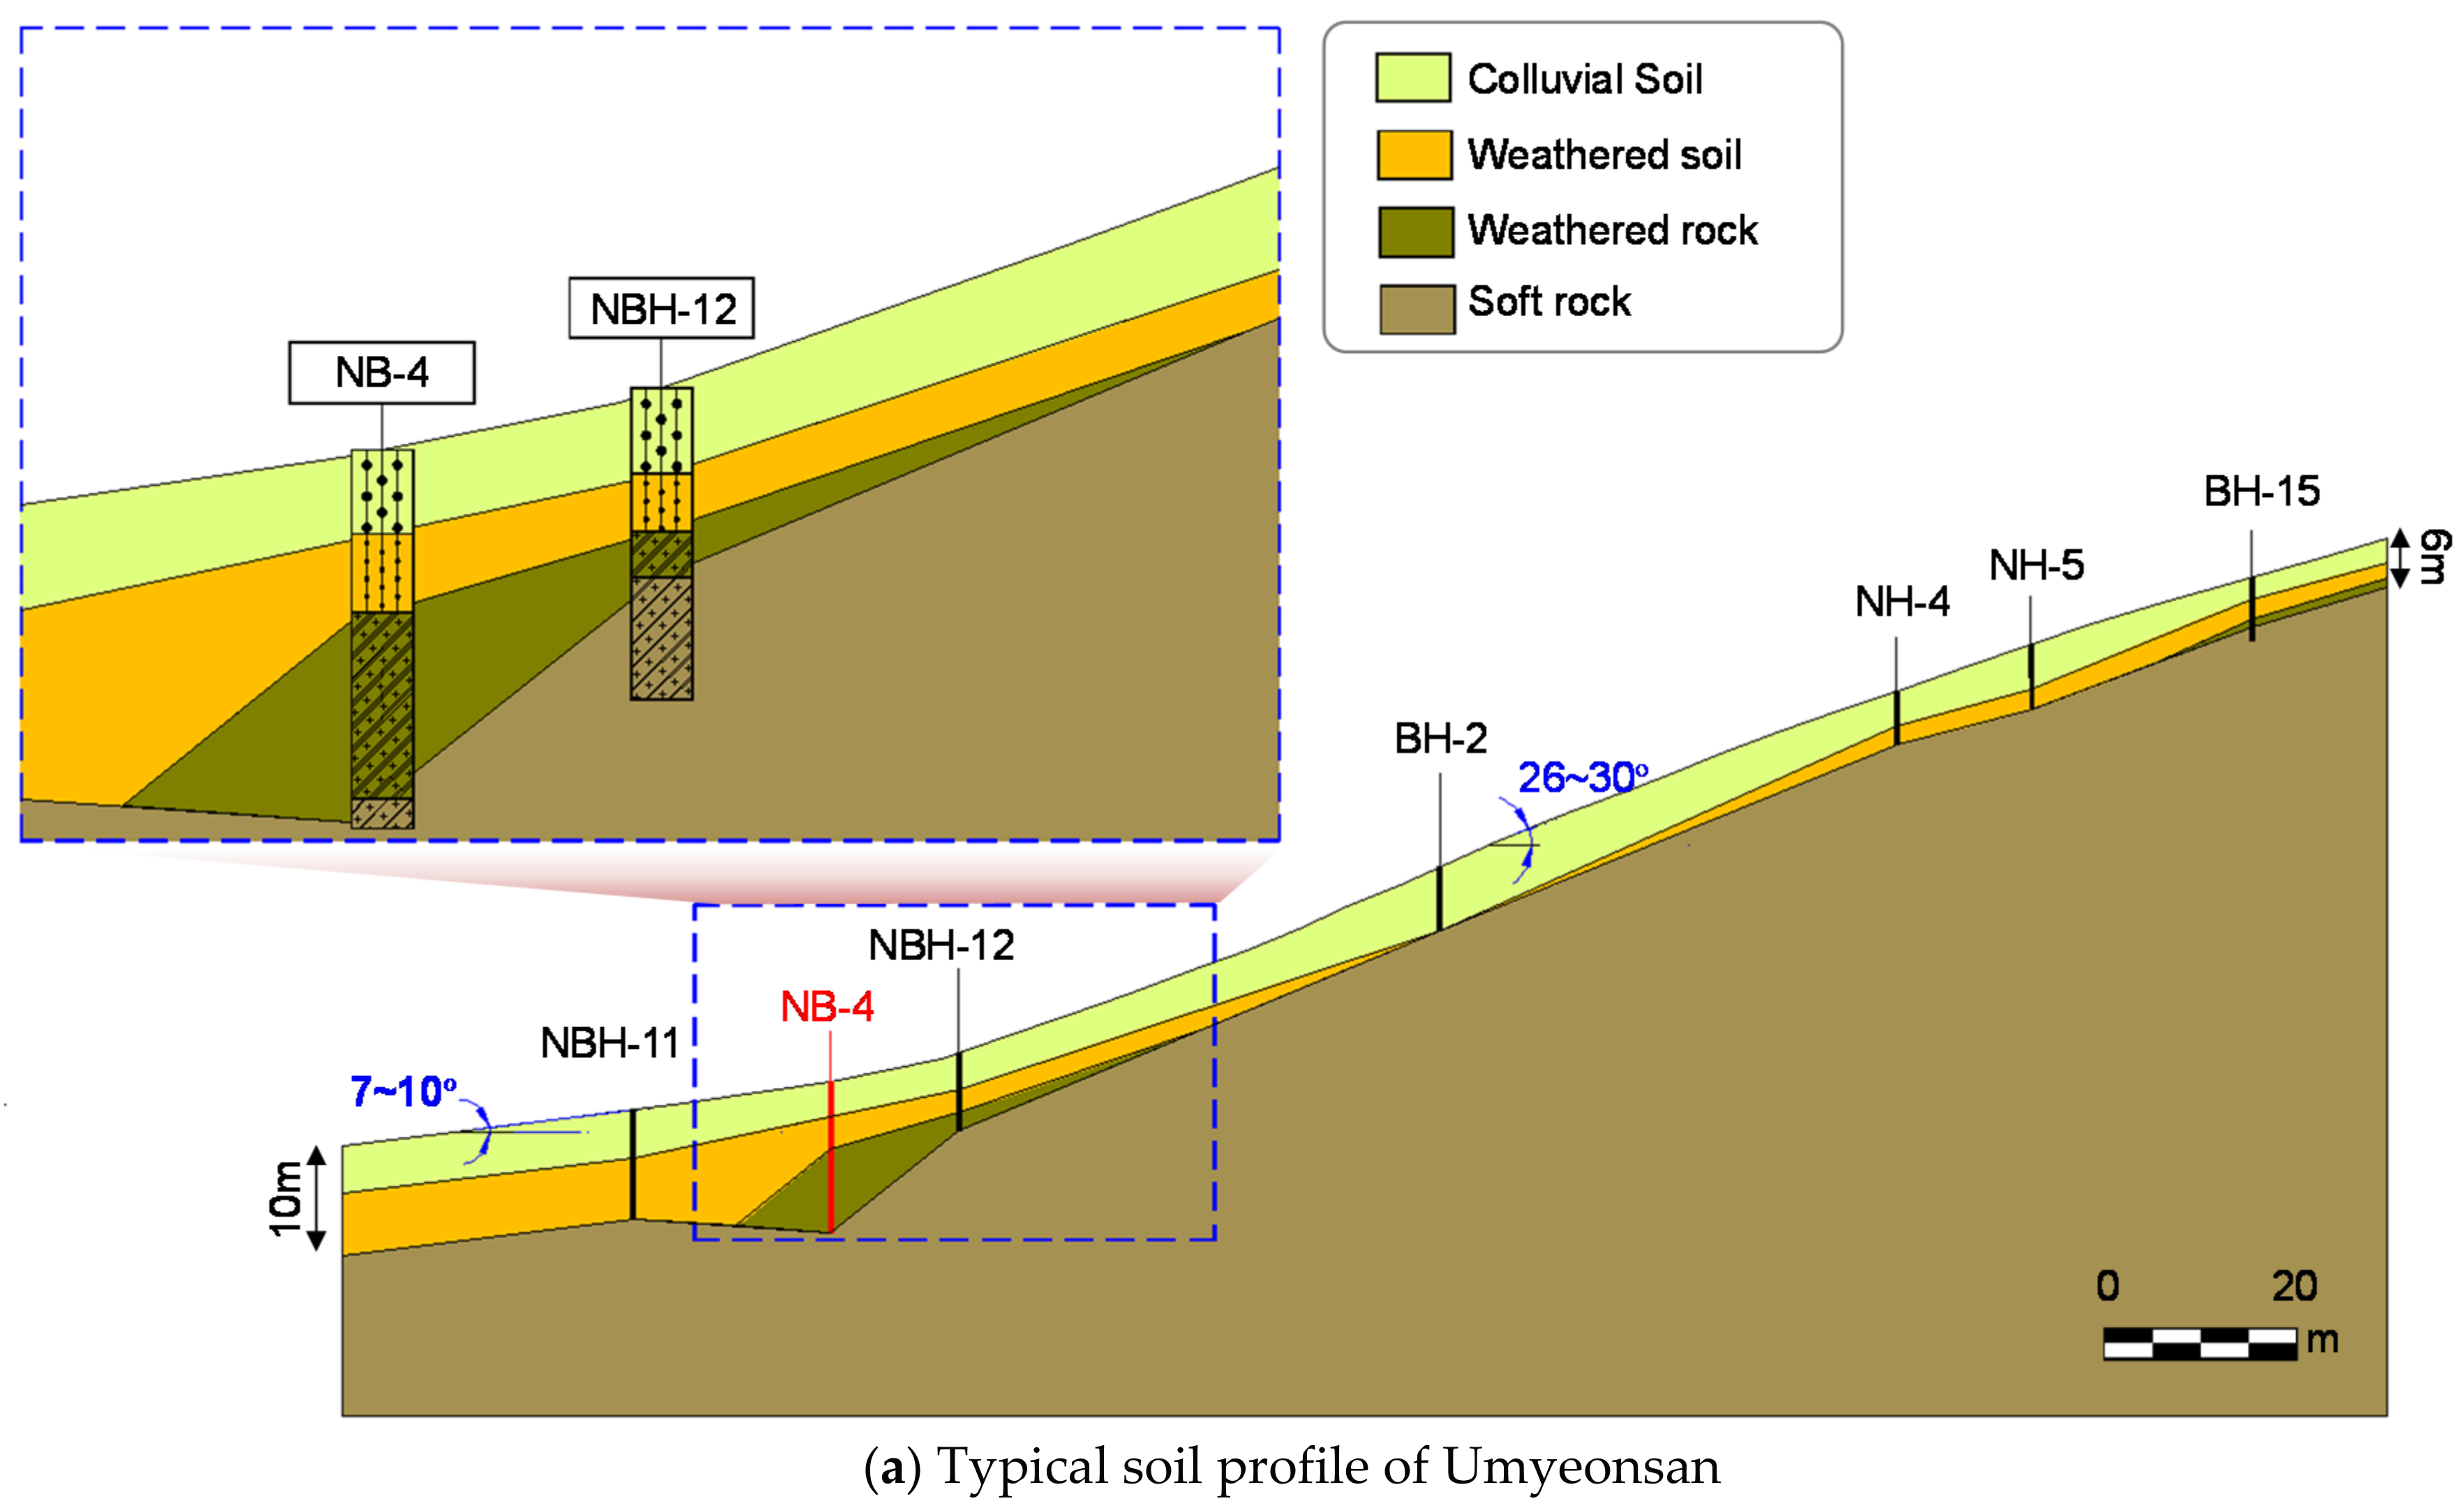
The geology from the borehole survey consists of distinct three layers, including a 1.5–4.5 m layer of colluvium, followed by a 0.5–9.9 m layer of highly weathered rock, and fresh rock (Figure 12). The colluvial soils are made up of a wide range of particle sizes, characterized as silty sand. The gravel, cobbles and pebbles of various sizes are identified in colluvial deposits. Their shapes appear to be sub-angular to angular. The standard penetration number (N-value) of the colluvium is approximately 4/30–5/30. In general, N-values of less than 10 mean that the soil is very soft and loose [46]. Therefore, it is inferred that the colluvial deposit provides the source material available for debris flows. The N-value of weathered rock widely varies from 12/30 to 50/10, depending on the degree of weathering. Based on the results of the constant head permeability and shear tests in boreholes, the permeability of the colluvium is approximately 10−4 m/s and the permeability of the weathered rock is on the order of 10−5 m/s.
The physical properties of the soil samples obtained from depths of 0.15–0.5 m in the colluvium are summarized. The water contents ranges from 14.1 to 32.1%, indicating that the superficial layer is wet, with the soils having a high degree of saturation. The plastic and liquid limits of the soils are in the range of 20.9 to 23.8% and 30.2 to 42.1%, respectively. The colluvial deposits contain fines (i.e., silty and clay) of 28.8–55.7%, which help sustain high pore water pressure in the debris flow promoting travel [47]. Ellen and Fleming [48] analyzed the clay content of soil samples from colluvial slopes and demonstrated that the slope failure is significantly associated with a clay content of 8 to 25%. According to the Unified Soil Classification System (USCS), the colluvial soils are classified as SM (Silty sand) and SC-CL (Clayey sand with many fines).
4.4. Numerical Results
In this study, a rigorous numerical method using hydro-geotechnical coupled analysis to determine the wetting band depth for shallow and deep-seated slope failure in watershed-scale landslide was applied to confirm the effect of rainfall and soil properties and slope geometry, and vegetation on landslide occurrence. This framework is a landslide analysis method that takes into account field investigations including matric suction and anticipates rainfall at the watershed scale. The initial groundwater table was assumed to be located at the top of the bedrock. The initial slope conditions were taken as hydrostatic with initial matric suction of 80 kPa obtained from field measurements and applied to the subjected stratigraphy. Several soil properties are summarized in Table 4. For the purpose of validation of this modeling, the results of SEEP/W analysis were compared with the field matric suction monitoring (in Figure 10). Figure 13 shows the field matric suction distribution at depths of 0.3 m, 0.7 m, and 1.1 m with dashed lines and the simulated matric suction at the same depth with solid lines. Average matric suction for four nodes in the target element is used in these comparisons. Stiffer responses of matric suction variation compared with those from field measurement are observed in the analysis. This indicates the limitation of the numerical analysis method used in this study. The complicated distribution of field matric suction, which depends on several surrounding circumstances, cannot be simply simulated through the numerical method in an idealized condition. Although the model has such limitations, the general trend of the measured matric suction is fairly well predicted. The depth from the slope surface affects the response of matric suction. When the infiltration distance is relatively long, it takes more time for the rainfall infiltration to reach a greater depth because rainfall flow on the slope surface is easily delayed in the small permeability of unsaturated soil.
The rainfall data recorded at the Seocho station was used as the flux boundary conditions, which is controlled at the surface of the slope. The total duration of rainfall from 22 June to 27 July was 850 h (35.4 days) and was divided into several stages to simulate a realistic rainfall event. In addition, a non-ponding boundary condition was adopted to prevent excessive accumulation of rainfall on the slope surface. The nodal flux value of zero was applied along the sides and the base of the slope to simulate the no flow zone. Figure 14 presents the boundary condition of the analysis and results of pore water pressure distribution due to the infiltration analysis. The real-time rainfall intensity was applied in the hydraulic boundary condition at the surface of the soil layer. The bedrock, on the other hand, showed relatively low hydraulic permeability, which led to the conclusion that the bottom layer was impermeable.
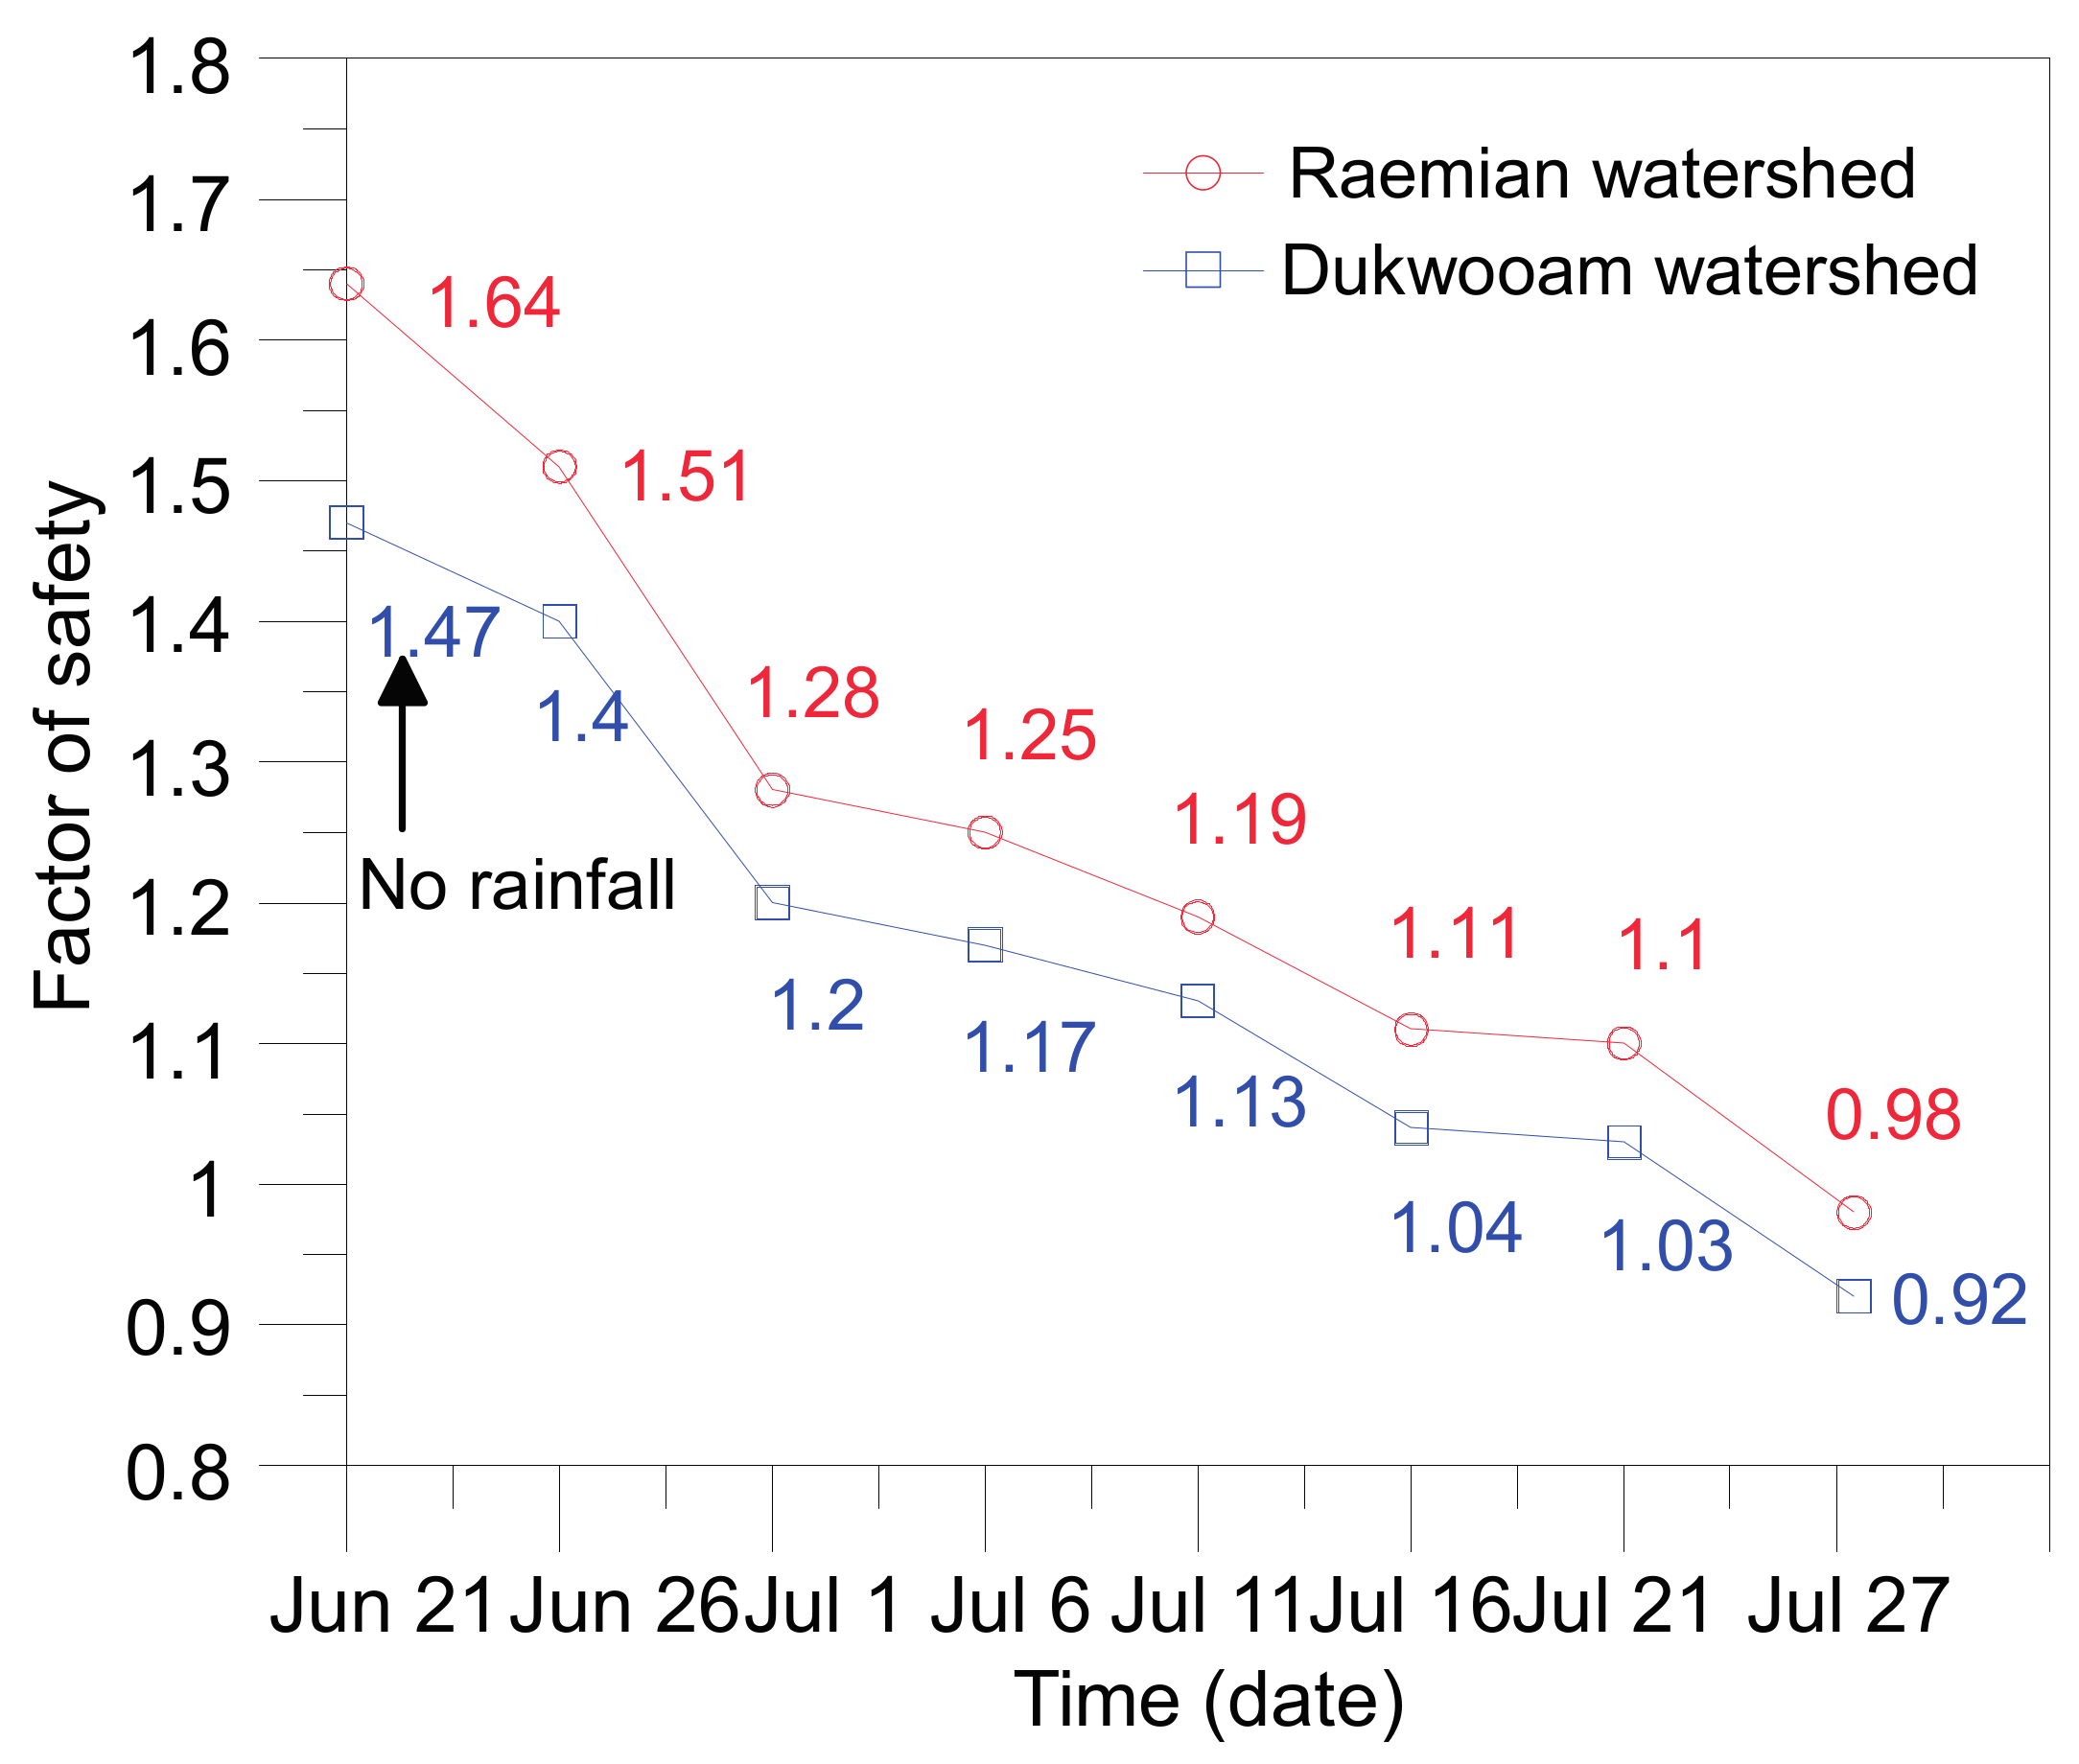
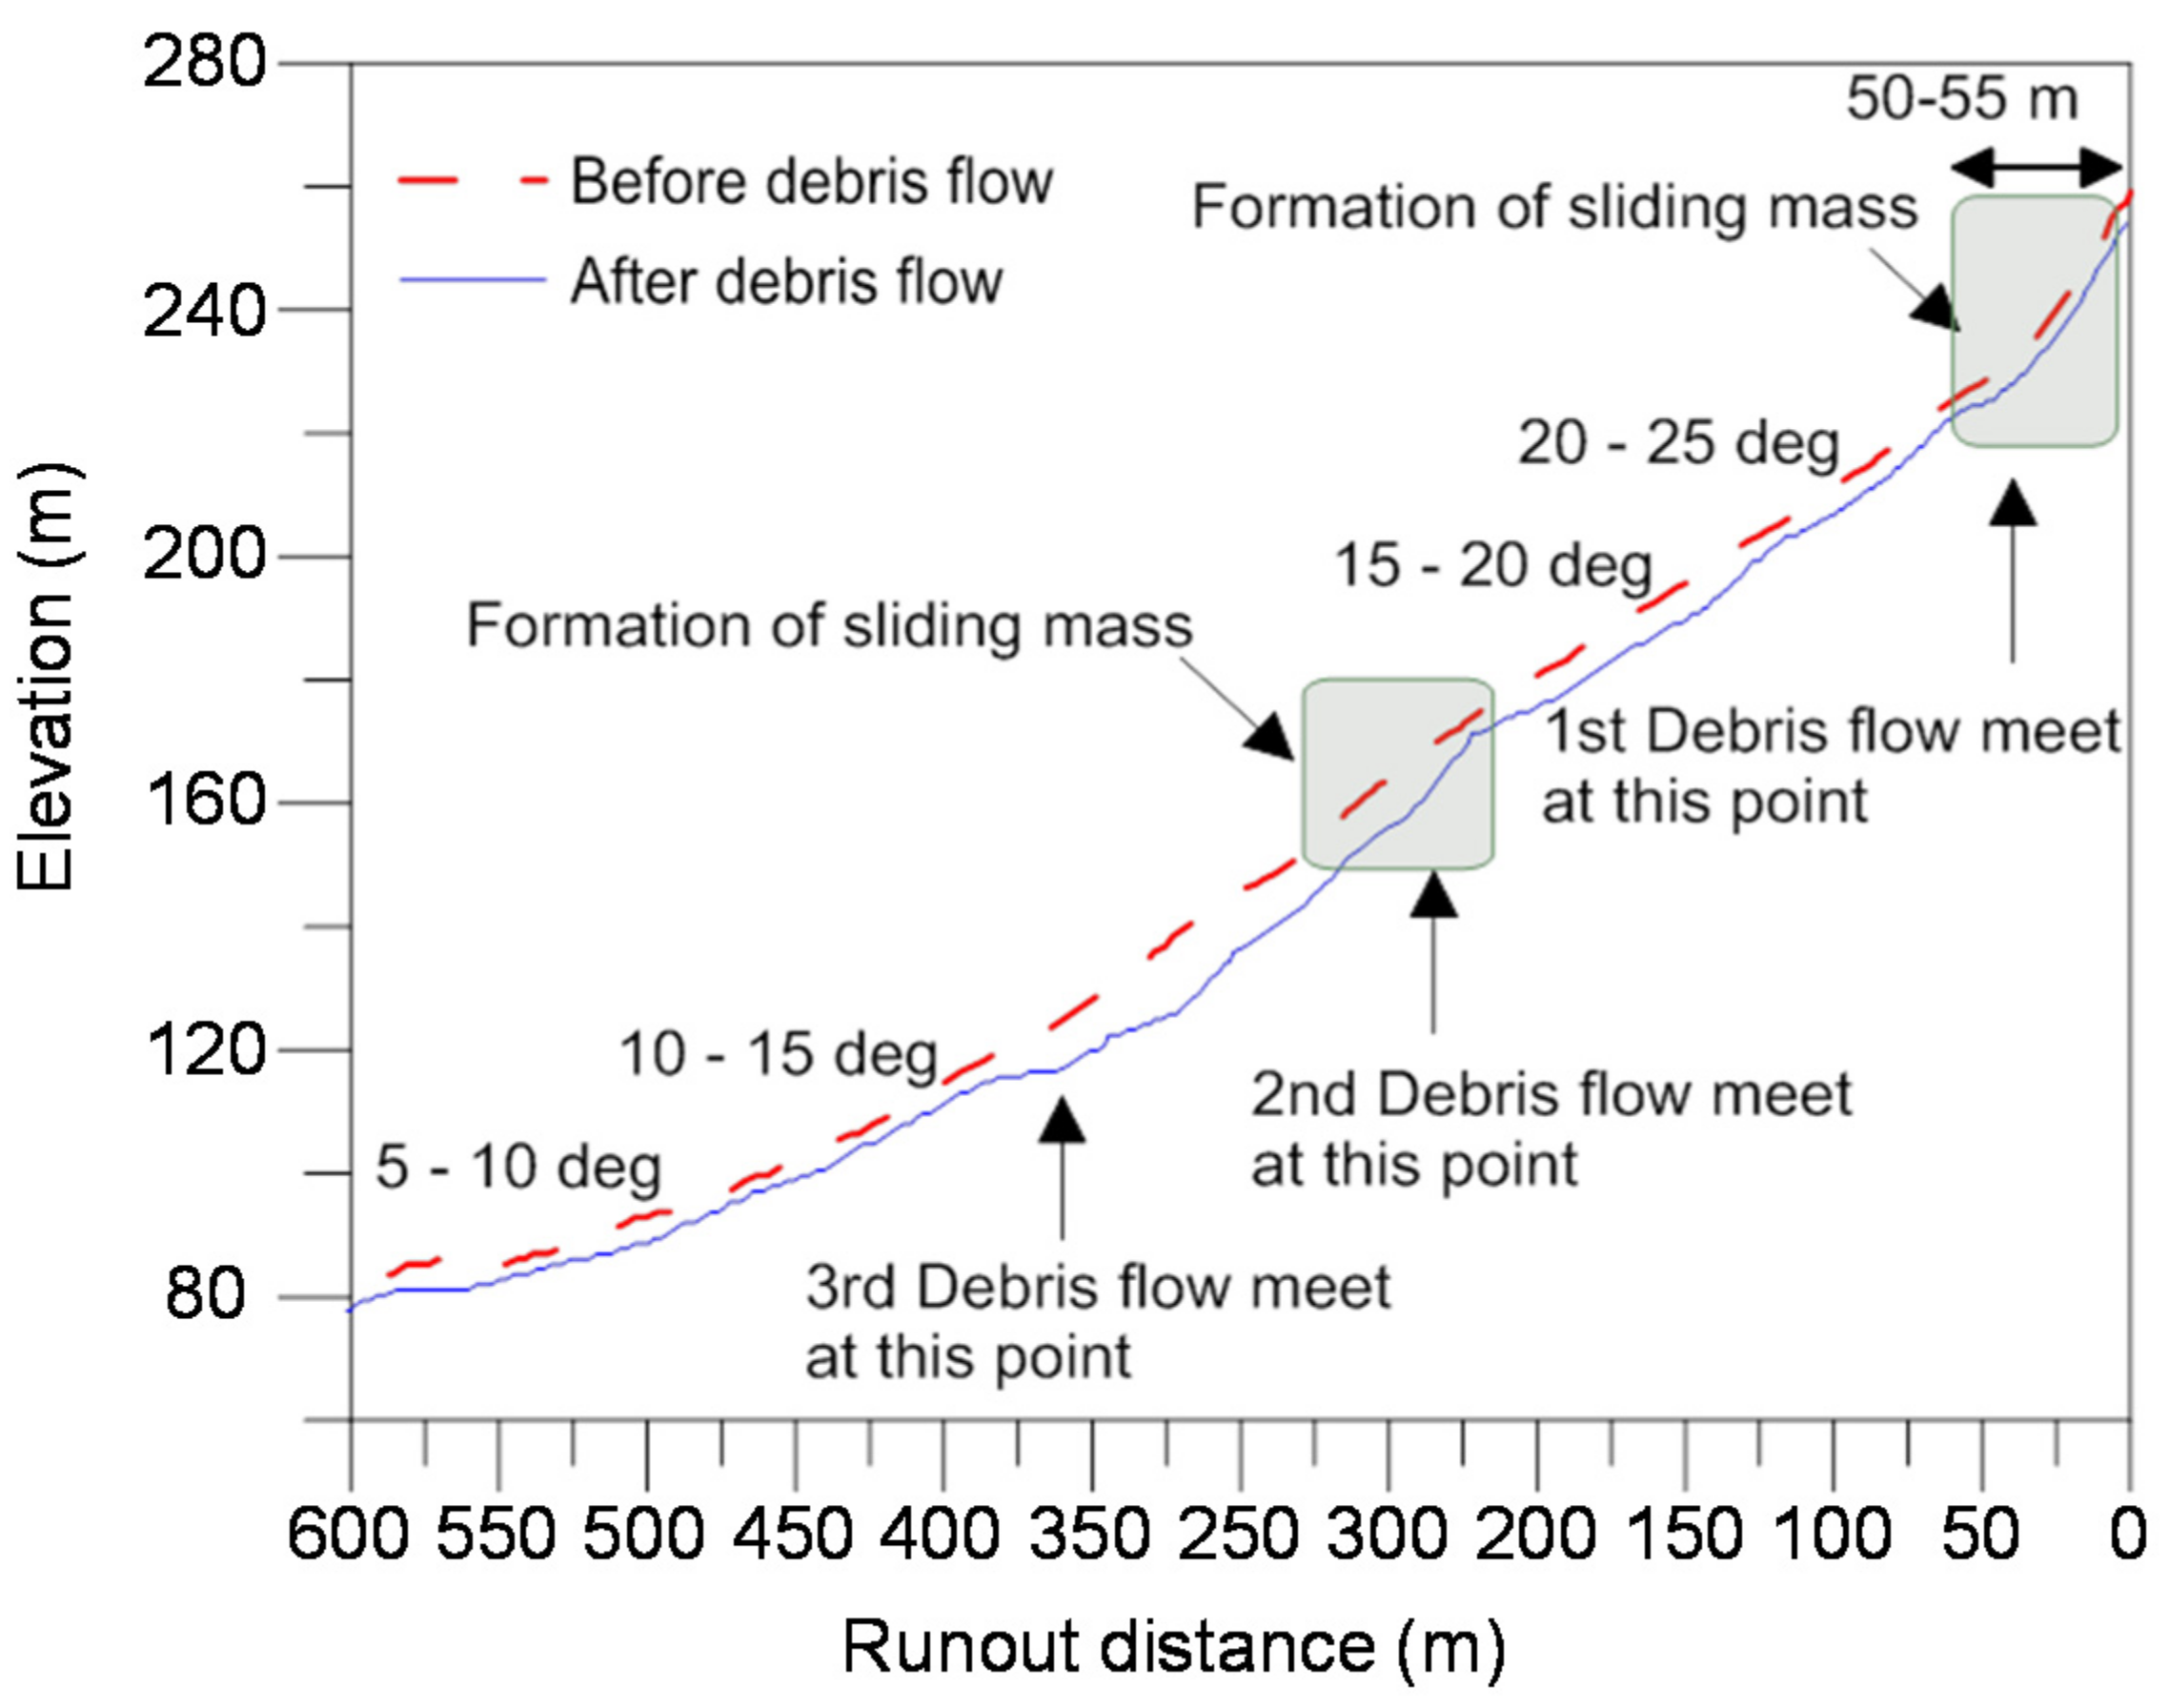
Regarding the infiltration characteristics of the soil slope, a critical slip surface was evaluated to investigate slope instabilities and failure zones. Figure 15 shows critical slip surfaces in the Raemian and Dukwooam watershed. The critical slip surface gradually deepens towards the bedrock with time during rainfall events. Figure 16 shows the variations in the factor of safety at the top, which is the most dangerous part of the Raemian and Dukwooam watershed. The factor of safety of slopes for both watersheds decreased with time, reaching their minimum values at the end of the rainfall events. The initial factor of safety for the slope in Raemian watershed is 1.64 during the driest period, which is larger than that of the Dukwooam watershed (1.47) due to the different slope angles and soil depths. The factor of safety decreased significantly at the beginning of the rainfall events due to the effect of a reduction in matric suction. When rainwater infiltrated the soil layer, the matric suction decreased rapidly and the factor of safety also fell in response. The magnitude and rate of decrease in the factor of safety are also related to the rainfall intensity. Figure 17 depicts the change in the longitudinal profile before and after the landslide, the subjected Raemian watershed features a channel length of 632 m, a width of 30–40 m, and an average incised depth of 1.6 m of gully from the LiDAR survey.
The critical slip surface is consistently developed on the colluvium-bedrock interface at the end of the rainfall events, which shows good agreement with the actual failure zone (Figure 15 and Figure 17). Two types of landslides occurred in the Raemian watershed, and a series of landslides were triggered by subsurface infiltration and rising groundwater-table. In the Dukwooam watershed, the results of analysis for both relevant mechanisms reasonably agree with all of landslide observations. Because this site has a generally shallow soil depth of 2.0–3.0 m, it is sufficiently shallow with relation to the wetting band depth of 2.0 m in the test site. The results show the primary triggering factors causing landslides, i.e., spatial and temporal distributions of groundwater variations. As mentioned above, deficit matric suction is one of the most important variables for the analysis of rainfall-induced landslides. Rainfall-infiltration depth, known as a main triggering factor of a landslide, is a response by the initial matric suction and is affected by antecedent rainfall. It is difficult to analyze a rainfall-induced landslide for unsaturated soil slopes because all of the affecting aspects such as rainfall, initial matric suction, and groundwater level must be considered. A rigorous numerical method that couples hydro-geotechnical analysis for shallow and deep-seated slope failure is clearly demonstrated in watershed-scale landslides. The simulated results agree closely with the investigation results, which indicates that the applied method is appropriate for use in the simulation of rainfall-induced landslides in watershed scale.
5. Conclusions
The overall objective of this study is to investigate the rainfall-induced landslides on partially saturated soil slopes using the 2011 Umyeonsan landslides. An integrated analysis of rainfall-induced landslide was carried out through laboratory tests, field tests, and numerical analyses. Special attention was given to rainfall penetration analysis to determine the wetting band depth for shallow and deep-seated slope failure in watershed-scale landslide. The following conclusions can be drawn from the findings of this study.
- The results of comprehensive investigations in the Umyeonsan region demonstrate that landslide activity is closely related primarily to rainfall, vegetation, and soil properties. From the data collected in the field, we can conclude that:
- ○
- The Umyeonsan landslides were triggered by a heavy rainfall event of a relatively high intensity (112.5 mm/h), preceded by a long period of antecedent rainfall (a total rainfall of 306.5 mm over the 16 h prior to the landslides). The average rainfall intensity of this rainstorm exceeded the rainfall intensity-duration thresholds for landslide initiation with respect to other global rainfall events.
- ○
- The roots of the vegetation were generally located at a relatively shallow depth (<1 m) in the colluvial deposits, indicating the lack of deeply penetrating roots in the Umyeonsan region. Wood was an important part of the landslide, and became concentrated at the front of the deposits.
- ○
- The colluvial soils in Umyeonsan region are classified as SM (Silty sand) and SC-CL (Clayey sand with many fine particles). As a result of the soil water characteristic curve test, the air entry value was 12 kPa, the saturated volumetric water content was 50%, and the residual volumetric water was 18%. According to the results of field measurements, the matric suction of the ground was 75 to 85 kPa in the dry season and approximately 20 kPa in the wet season.
- From numerical simulations of slope stability analysis we can conclude that:
- ○
- The hydro-geotechnical coupled analysis was conducted to confirm the effects of rainfall, vegetation and soil properties on landslide. The infiltration analysis was performed by applying unsaturated soil characteristics and actual recorded rainfall. In order to apply the infiltration analysis method used for simple slopes to the watershed-scale interpretation, special attention was given to the infiltration of rainfall into the underground using a one-dimensional infiltration model. It was used to determine the wetting band depth in shallow depth failure analysis and to determine the initial matric suction of the ground effect of the anticipated rainfall in deep-seated failure analysis. From the results of the numerical limiting equilibrium analysis, conducted in an elongated and narrow watershed, we can conclude that rainfall infiltration due to the considered rainfall event was responsible for triggering the observed landslide.
- ○
- The simulated results agree closely with the investigation results, which indicate that the applied method is appropriate for use in the simulation of the landslide in unsaturated soils. The simulated results has illustrated that the methodology applied in this work are consistent with both shallow and deep-seated rainfall-induced landslides. In fact, the simulated critical slip surfaces corresponding to the minimum factor of safety are in reasonable agreement with the observed ones.
Acknowledgments
The authors acknowledge support in this research from the National Research Foundation of Korea (NRF) (Grant no. 2011-0030040 and 2014R1A2A1A11054606).
Author Contributions
All authors significantly contributed to the research. Sangseom Jeong designed this research. Kwangwoo Lee and Yongmin Kim collected and analyzed data. Junghwan Kim wrote the paper.
Conflicts of Interest
The authors declare no conflict of interest.
References
- Kim, J.; Jeong, S.; Park, S.; Sharma, J. Influence of rainfall-induced wetting on the stability of slopes in weathered soils. Eng. Geol. 2004, 75, 251–262. [Google Scholar] [CrossRef]
- Jeong, S.; Kim, J.; Lee, K. Effect of clay content on well-graded sands due to infiltration. Eng. Geol. 2008, 102, 74–81. [Google Scholar] [CrossRef]
- Sorbino, G.; Nicotera, M.V. Unsaturated soil mechanics in rainfall-induced flow landslides. Eng. Geol. 2013, 165, 105–132. [Google Scholar] [CrossRef]
- Fredlund, D.G.; Rahardjo, H.; Fredlund, M.D. Unsaturated Soil Mechanics in Engineering Practice; John Wiley & Sons: New York, NY, USA, 2012. [Google Scholar]
- Kim, J.; Lee, K.; Jeong, S.; Kim, G. GIS-based prediction method of landslide susceptibility using a rainfall infiltration-groundwater flow model. Eng. Geol. 2014, 182, 63–78. [Google Scholar] [CrossRef]
- Lu, N.; Likos, W.J. Unsaturated Soil Mechanics; John Wiley & Sons: New York, NY, USA, 2004. [Google Scholar]
- Lu, N.; Godt, J. Infinite slope stability under steady unsaturated seepage conditions. Water Resour. Res. 2008, 44, 11. [Google Scholar] [CrossRef]
- Rahardjo, H.; Leong, E.C.; Gasmo, J.M.; Tang, S.K. Assessment of rainfall effects on stability of residual soil slopes. In Proceedings of the 2nd International Conference on Unsaturated Soils, Beijing, China, 27–30 August 1998; Volume 2, pp. 280–285. [Google Scholar]
- Ng, C.W.W.; Zhan, L.T.; Bao, C.G.; Fredlund, D.G.; Gong, B.W. Performance of an Unsaturated Expansive Soil Slope Subjected to Artificial Rainfall Infiltration. Géotechnique 2003, 53, 143–157. [Google Scholar] [CrossRef]
- Ng, C.W.W.; Springman, S.M.; Alonso, E.E. Monitoring the Performance of Unsaturated Soil Slopes. Geotech. Geol. Eng. 2008, 26, 799–816. [Google Scholar] [CrossRef]
- Baum, R.L.; Savage, W.Z.; Godt, J.W. TRIGRS—A Fortran Program for Transient Rainfall Infiltration and Grid-based Regional Slope-stability Analysis Version 2.0. In USGS Numbered Series; U.S. Geological Survey: Reston, VA, USA, 2008. [Google Scholar]
- Alvioli, M.; Baum, R.L. Parallelization of the TRIGRS model for rainfall-induced landslides using the message passing interface. Environ. Modell. Softw. 2016, 81, 122–135. [Google Scholar] [CrossRef]
- Rigon, R.; Bertoldi, G.; Over, T. GEOtop: A Distributed Hydrological Model with Coupled Water and Energy Budgets. J. Hydrometeorol. 2006, 7, 371–388. [Google Scholar] [CrossRef]
- Mergili, M.; Marchesini, I.; Alvioli, M.; Metz, M.; Schneider-Muntau, B.; Rossi, M.; Guzzetti, F. A strategy for GIS-based 3-D slope stability modelling over large areas. Geosci. Model Dev. 2014, 7, 2969–2982. [Google Scholar] [CrossRef]
- GEO-SLOPE. User’s Manual; Geo-Slope International Ltd.: Calgary, AB, Canada, 2012. [Google Scholar]
- Brinkgreve, R.; Swolfs, W.; Engin, E. Plaxis User’s Manual; Plaxis: Delft, The Netherlands, 2010. [Google Scholar]
- Soil Vision. SVFlux User Manual: Saturated/Unsaturated Finite Element 2D/3D Seepage Modeling; Soil Vision Ltd.: Saskatoon, SK, Canada, 2009. [Google Scholar]
- Lu, N.; Wayllace, A.; Oh, S. Infiltration-induced seasonally reactivated instability of a highway embankment near the Eisenhower Tunnel, Colorado, USA. Eng. Geol. 2013, 162, 22–32. [Google Scholar] [CrossRef]
- Da Costa, A.; Sagaseta, C. Analysis of shallow instabilities in soil slopes reinforced with nailed steel wire meshes. Eng. Geol. 2010, 113, 53–61. [Google Scholar] [CrossRef]
- Gui, M.W.; Wu, Y.M. Failure of soil under water infiltration condition. Eng. Geol. 2014, 181, 124–141. [Google Scholar] [CrossRef]
- Urciuoli, G.; Pirone, M.; Comegna, L.; Picarelli, L. Long-term investigations on the pore pressure regime in saturated and unsaturated sloping soils. Eng. Geol. 2016, 212, 98–119. [Google Scholar] [CrossRef]
- Fredlund, D.G.; Rahardjo, H. Soil Mechanics for Unsaturated Soils; John Wiley & Sons: New York, NY, USA, 2012. [Google Scholar]
- Kim, J.; Jeong, S.; Regueiro, R.A. Instability of partially saturated soil slopes due to alteration of rainfall pattern. Eng. Geol. 2012, 147, 28–36. [Google Scholar] [CrossRef]
- Le, T.; Bae, D.H. Evaluating the utility of IPSS AR4 GCMs for hydrological application in South Korea. Water Resour. Manag. 2013, 27, 3227–3246. [Google Scholar] [CrossRef]
- Korean Geotechnical Society (KGS). Research Contract Report: Addition and Complement Causes Survey of Umyeonsan (Mt.) Landslide; KGS: Seoul, Korea, 2012. [Google Scholar]
- Tiranti, D.; Bonetto, S.; Mandrone, G. Quantitative basin characterization to refine debris-flow triggering criteria and processes, an example from the Italian Western Alps. Landslides 2008, 5, 45–57. [Google Scholar] [CrossRef]
- Griffiths, P.G.; Webb, R.H.; Melis, T.S. Frequency and initiation of debris flows in Grand Canyon, Arizona. J. Geophys. Res. 2004, 109, 321–336. [Google Scholar] [CrossRef]
- Li, A.G.; Yue, Z.Q.; Tham, L.G.; Lee, C.F.; Law, K.T. Field-monitored variations of soil moisture and matric suction in a saprolite slope. Can. Geotech. J. 2005, 42, 13–26. [Google Scholar] [CrossRef]
- Gasmo, J.; Hritzuk, K.J.; Rahardjo, H.; Leong, E.C. Instrumentation of an unsaturated residual soil slope. Geotech. Test. J. 1999, 22, 128–137. [Google Scholar]
- Van Genuchten, M.T. A close-form equation for predicting the hydraulic conductivity of unsaturated soils. Soil Sci. Soc. Am. J. 1980, 44, 892–898. [Google Scholar] [CrossRef]
- Vanapalli, S.K.; Fredlund, D.G.; Pufahl, D.E.; Clifton, A.W. Model for the prediction of shear strength with respect to soil suction. Can. Geotech. J. 1996, 33, 379–392. [Google Scholar] [CrossRef]
- Korea Meteorological Administration (KMA). 2016 Abnormal Climate Report; KMA: Seoul, Korea, 2017; pp. 30–32. [Google Scholar]
- Alvioli, M.; Rossi, M.; Guzzetti, F. Scaling properties of rainfall induced landslides predicted by a physically based model. Geomorphology 2014, 213, 38–47. [Google Scholar] [CrossRef]
- Guzzetti, F.; Peruccacci, S.; Rossi, M.; Stark, C.P. The rainfall intensity-duration control of shallow landslides and debris flows an update. Landslides 2008, 5, 3–17. [Google Scholar] [CrossRef]
- Hong, M.; Kim, J.; Jung, G.; Jeong, S. Rainfall Threshold (ID curve) for Landslide Initiation and Prediction Considering Antecedent Rainfall. J. Korean Geotech. Soc. 2016, 32, 15–27. [Google Scholar] [CrossRef]
- Caine, N. The rainfall intensity: Duration control of shallow landslides and debris flows. Geogr. Ann. Ser. A Phys. Geogr. 1980, 6, 23–27. [Google Scholar] [CrossRef]
- Innes, J.L. Debris flows. Prog. Phys. Geogr. 1983, 7, 469–501. [Google Scholar] [CrossRef]
- Calcaterra, D.; Santo, A. The January 10, 1997 Pozzano landside, Sorrento Peninsula, Italy. Eng. Geol. 2004, 75, 181–200. [Google Scholar] [CrossRef]
- Chen, C.Y.; Chen, T.C.; Yu, F.C.; Yu, W.H.; Tseng, C.C. Rainfall duration and debris-flow initiated studies for real-time monitoring. Environ. Geol. 2005, 47, 715–724. [Google Scholar] [CrossRef]
- Jan, C.D.; Chen, C.L. Debris flows caused by Typhoon Herb in Taiwan. In Debris Flow Hazards and Related Phenomena; Jakob, M., Hungr, O., Eds.; Springer: Berlin/Heidelberg, Germany, 2005; pp. 363–385. [Google Scholar]
- Dahal, R.K.; Hasegawa, S.; Nonomura, A.; Yamanaka, M.; Masuda, T.; Nishino, K. GIS-based weights-of-evidence modelling of rainfall-induced landslides in small catchments for landslide susceptibility mapping. Environ. Geol. 2008, 54, 311–324. [Google Scholar] [CrossRef]
- Nilaweera, N.S.; Nutalaya, P. Role of tree roots in slope stabilization. Bull. Eng. Geol. Environ. 1999, 57, 337–342. [Google Scholar] [CrossRef]
- Wu, W.; Sidle, R.C. A distributed slope stability model for steep forested basins. Water Resour. Res. 1995, 31, 2097–2110. [Google Scholar] [CrossRef]
- Hammond, C.; Hall, D.; Miller, S.; Swetik, P. Level I Stability Analysis (LISA) Documentation for Version 2.0; US Department of Agriculture, Forest Service, Intermountain Research Station: Ogden, UT, USA, 1992.
- Schmidt, K.M.; Roering, J.J.; Stock, J.D.; Dietrich, W.E.; Montgomery, D.R.; Schaub, T. The variability of root cohesion as an influence on shallow landslide susceptibility in Oregon Coast Range. Can. Geotech. J. 2001, 38, 995–1024. [Google Scholar] [CrossRef]
- Bowel, J.E. Foundation Analysis and Design, 5th ed.; McGraw-Hill: Singapore, 1997. [Google Scholar]
- Iverson, R.M. The debris-flow rheology myth. Debris Flow Hazards Mitig. Mech. Predict. Assess. 2003, 1, 303–314. [Google Scholar]
- Ellen, S.D.; Fleming, R.W. Mobilization of debris flows form soil slips. Rev. Eng. Geol. 1987, 7, 31–40. [Google Scholar]
- Norris, J.E.; Stokes, A.; Mickovski, S.B.; Cammeraat, E.; van Beek, R.; Nicoll, B.C.; Achim, A. Slope Stability and Erosion Control. In Ecotechnological Solutions VI; Springer: Berlin, Germany, 2008; p. 290. [Google Scholar]
- Korea forest research institute (KFRI). Standard Manual for Forest Biomass Investigation; KFRI: Seoul, Korea, 2006. [Google Scholar]
Figure 1.
Location of the Umyeonsan landslides in Seoul, Korea.
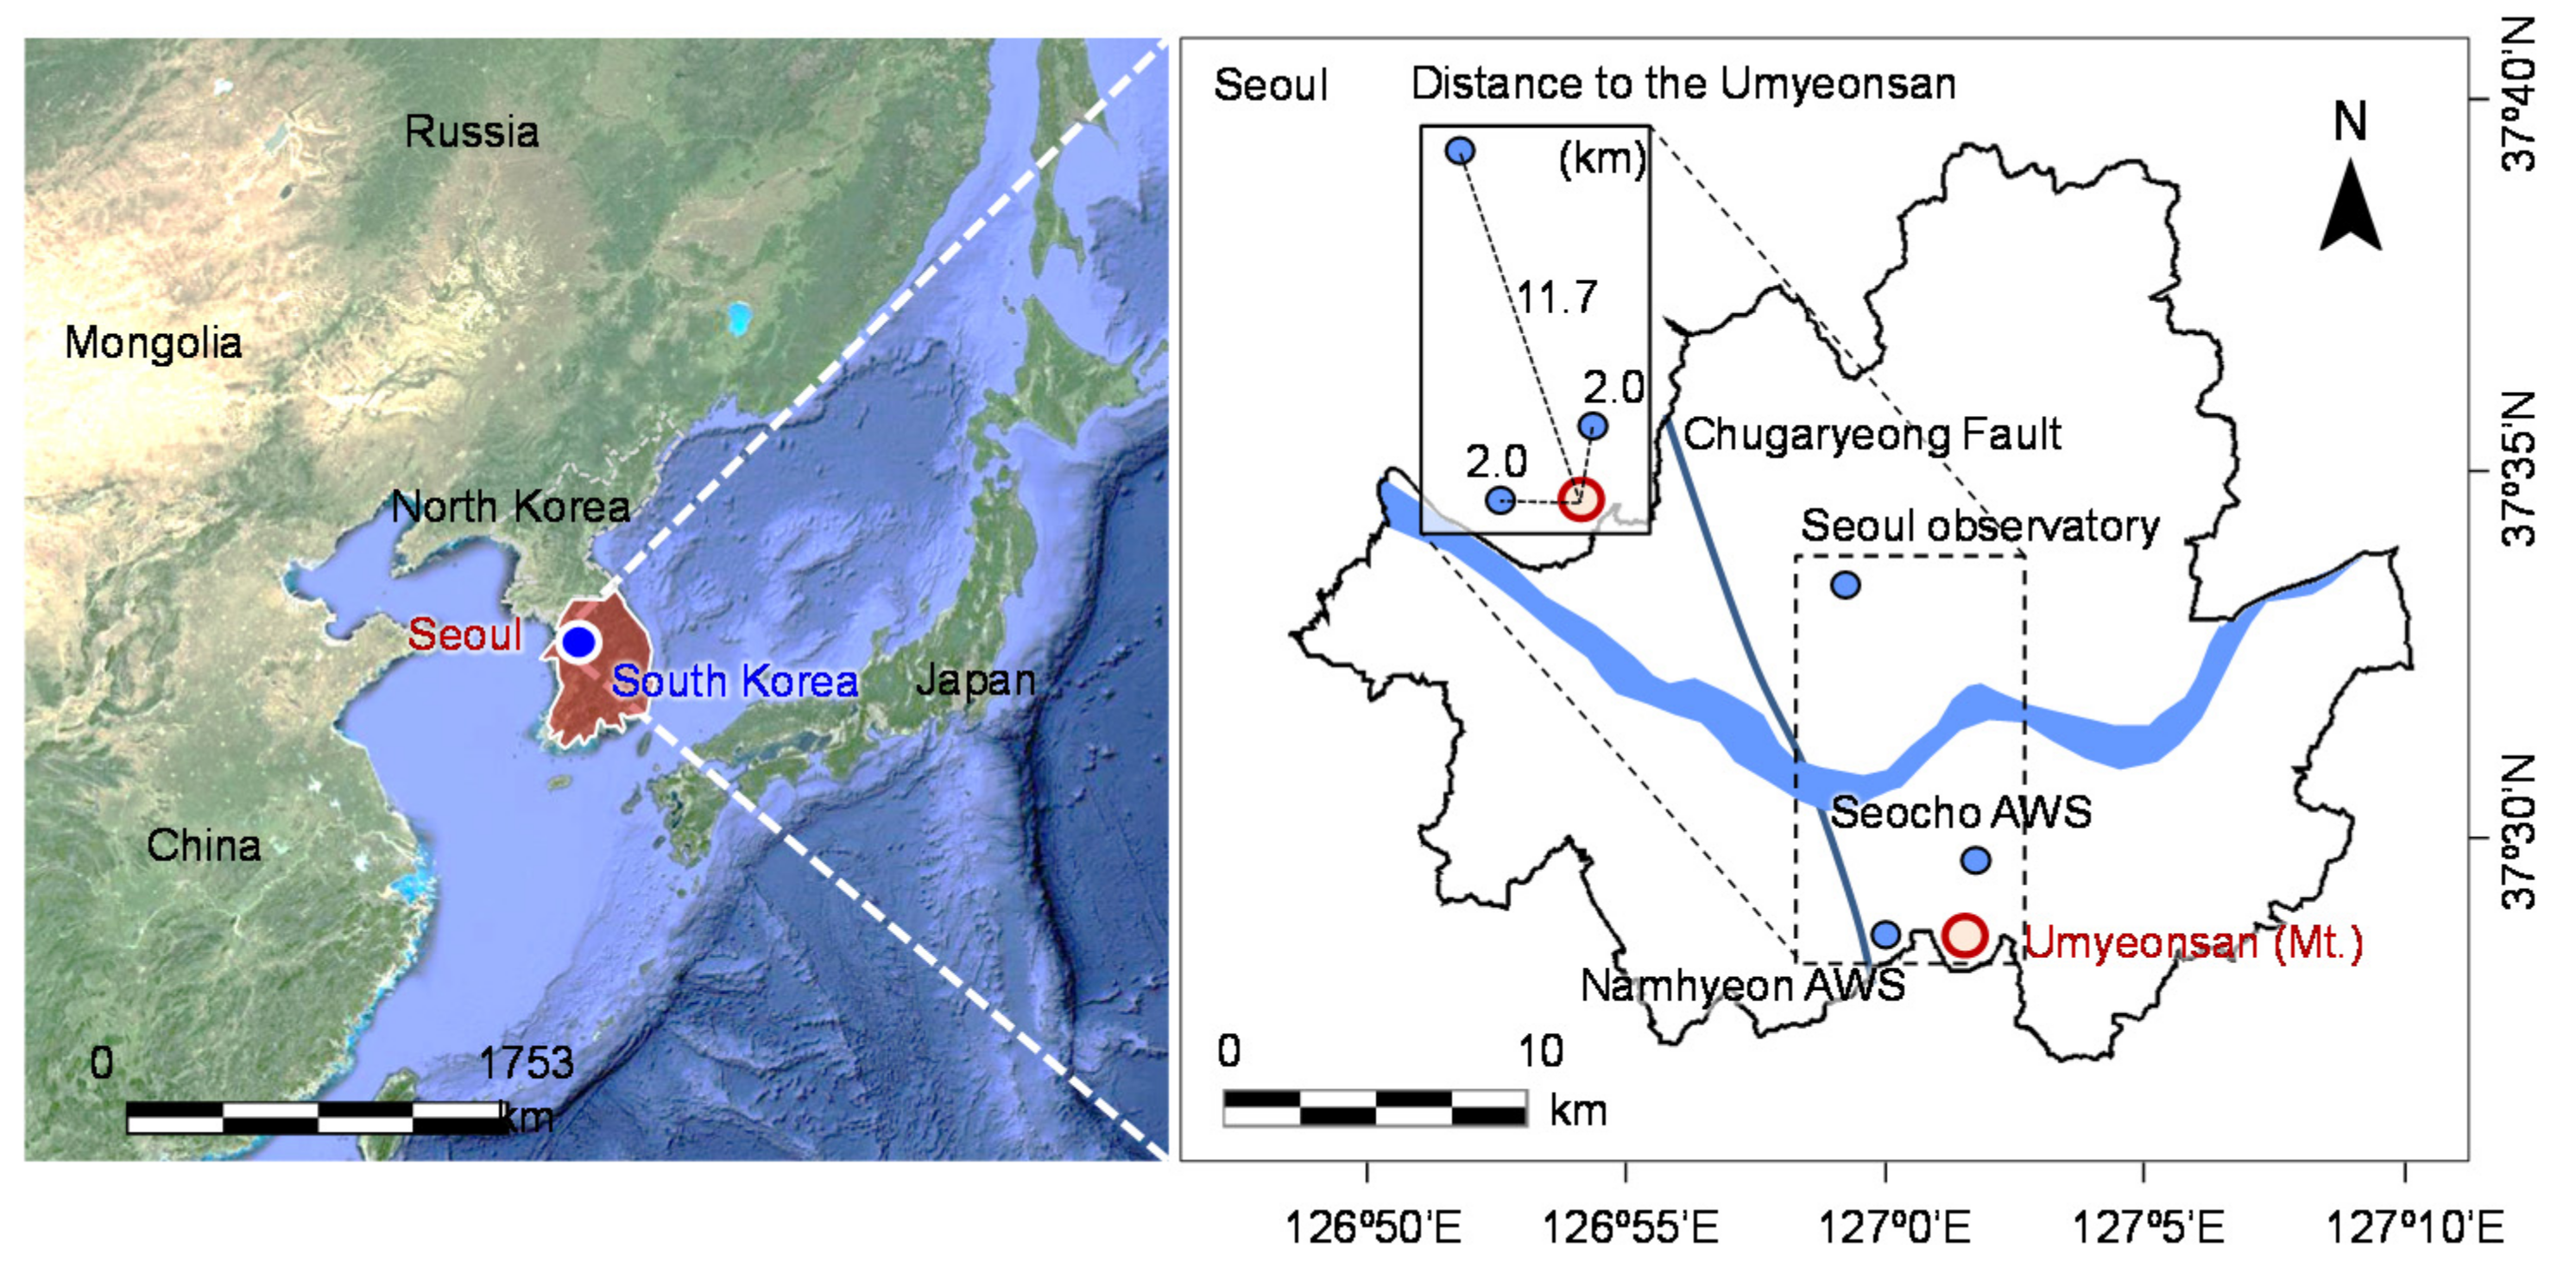
Figure 2.
Satellite image showing 33 debris flow gullies (marked in blue), watersheds (outlined by white lines), and 151 landslides (modified from Korean Geotechnical Society, 2012).
Figure 2.
Satellite image showing 33 debris flow gullies (marked in blue), watersheds (outlined by white lines), and 151 landslides (modified from Korean Geotechnical Society, 2012).

Figure 3.
Photographs of geotechnical and geological characteristics of landslide damage sites. (a) main scarp of landslide at a ridge crest; (b) soil profile at the center of a channel; (c) expose of the gneiss bedrock; (d) transported material at bottom of watershed.
Figure 3.
Photographs of geotechnical and geological characteristics of landslide damage sites. (a) main scarp of landslide at a ridge crest; (b) soil profile at the center of a channel; (c) expose of the gneiss bedrock; (d) transported material at bottom of watershed.

Figure 4.
Location maps of boreholes, test pits, and matric suction of monitoring site.
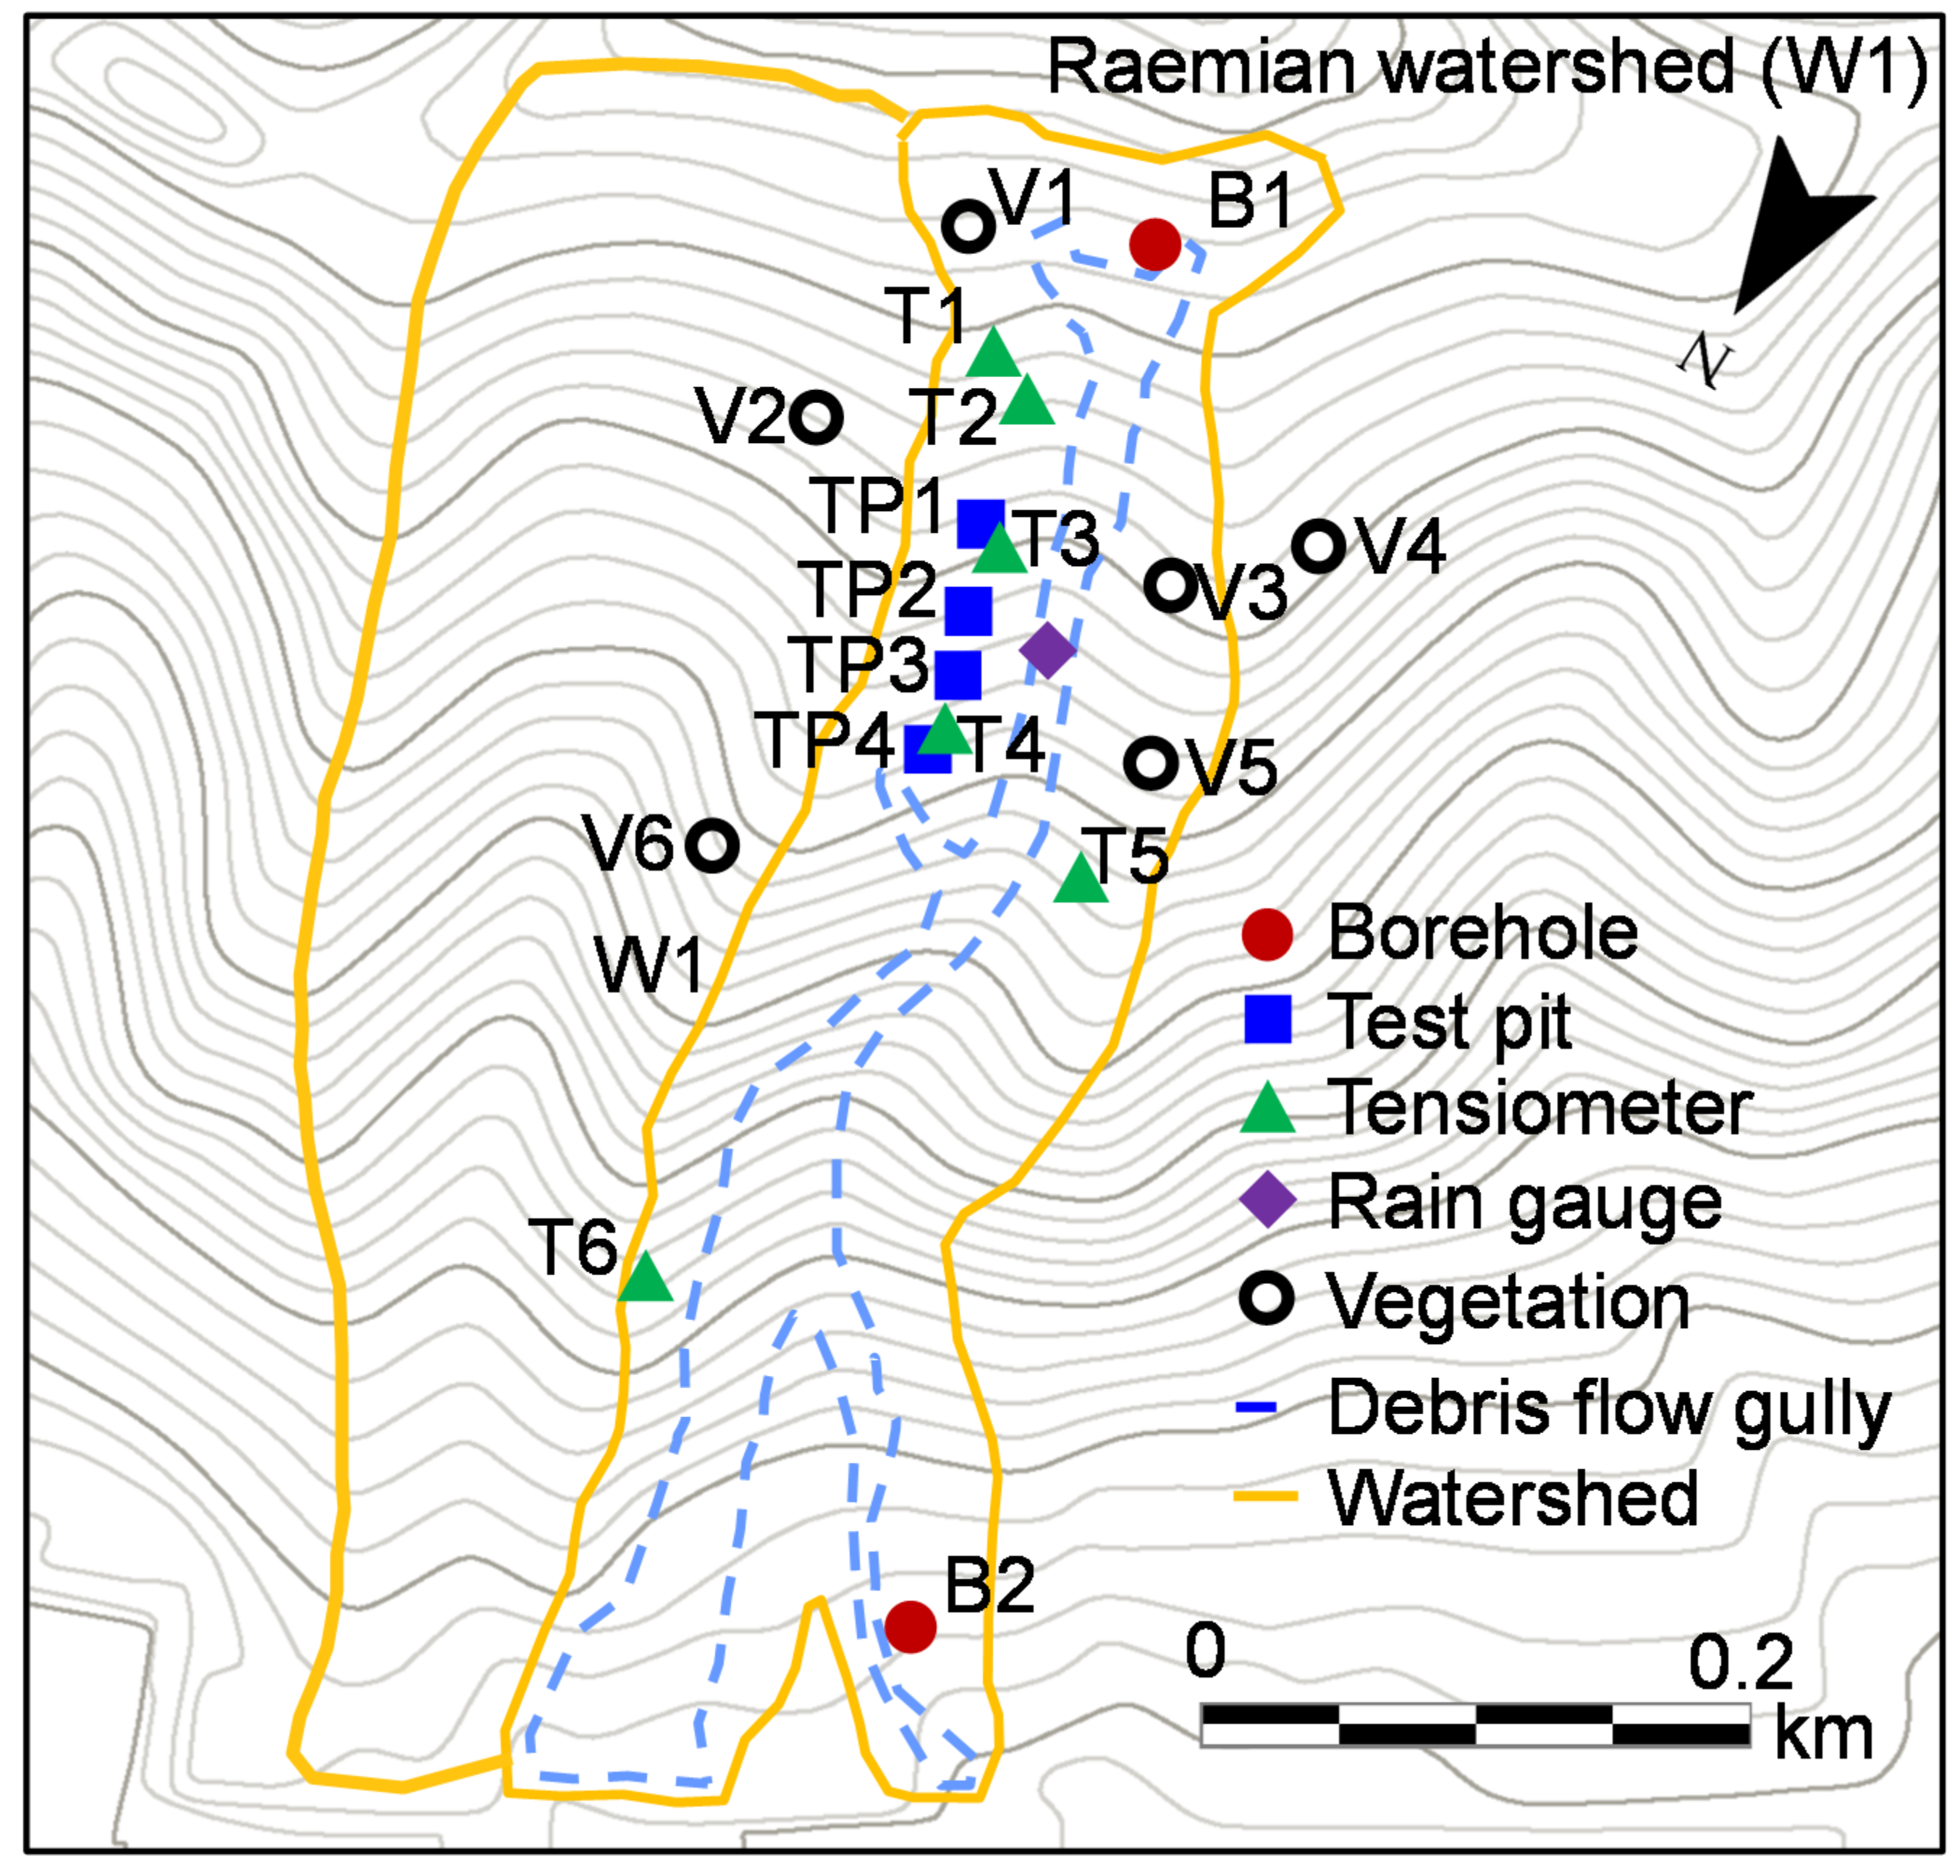
Figure 5.
Flow chart of integrated landslide analysis methodology in this study.

Figure 6.
Hourly and cumulative rainfall for 26–27 July 2011: (a) Seocho station; (b) Namhyun station.
Figure 6.
Hourly and cumulative rainfall for 26–27 July 2011: (a) Seocho station; (b) Namhyun station.

Figure 7.
Comparison of measured rainfall intensity–duration data and existing intensity–duration threshold curves.
Figure 7.
Comparison of measured rainfall intensity–duration data and existing intensity–duration threshold curves.
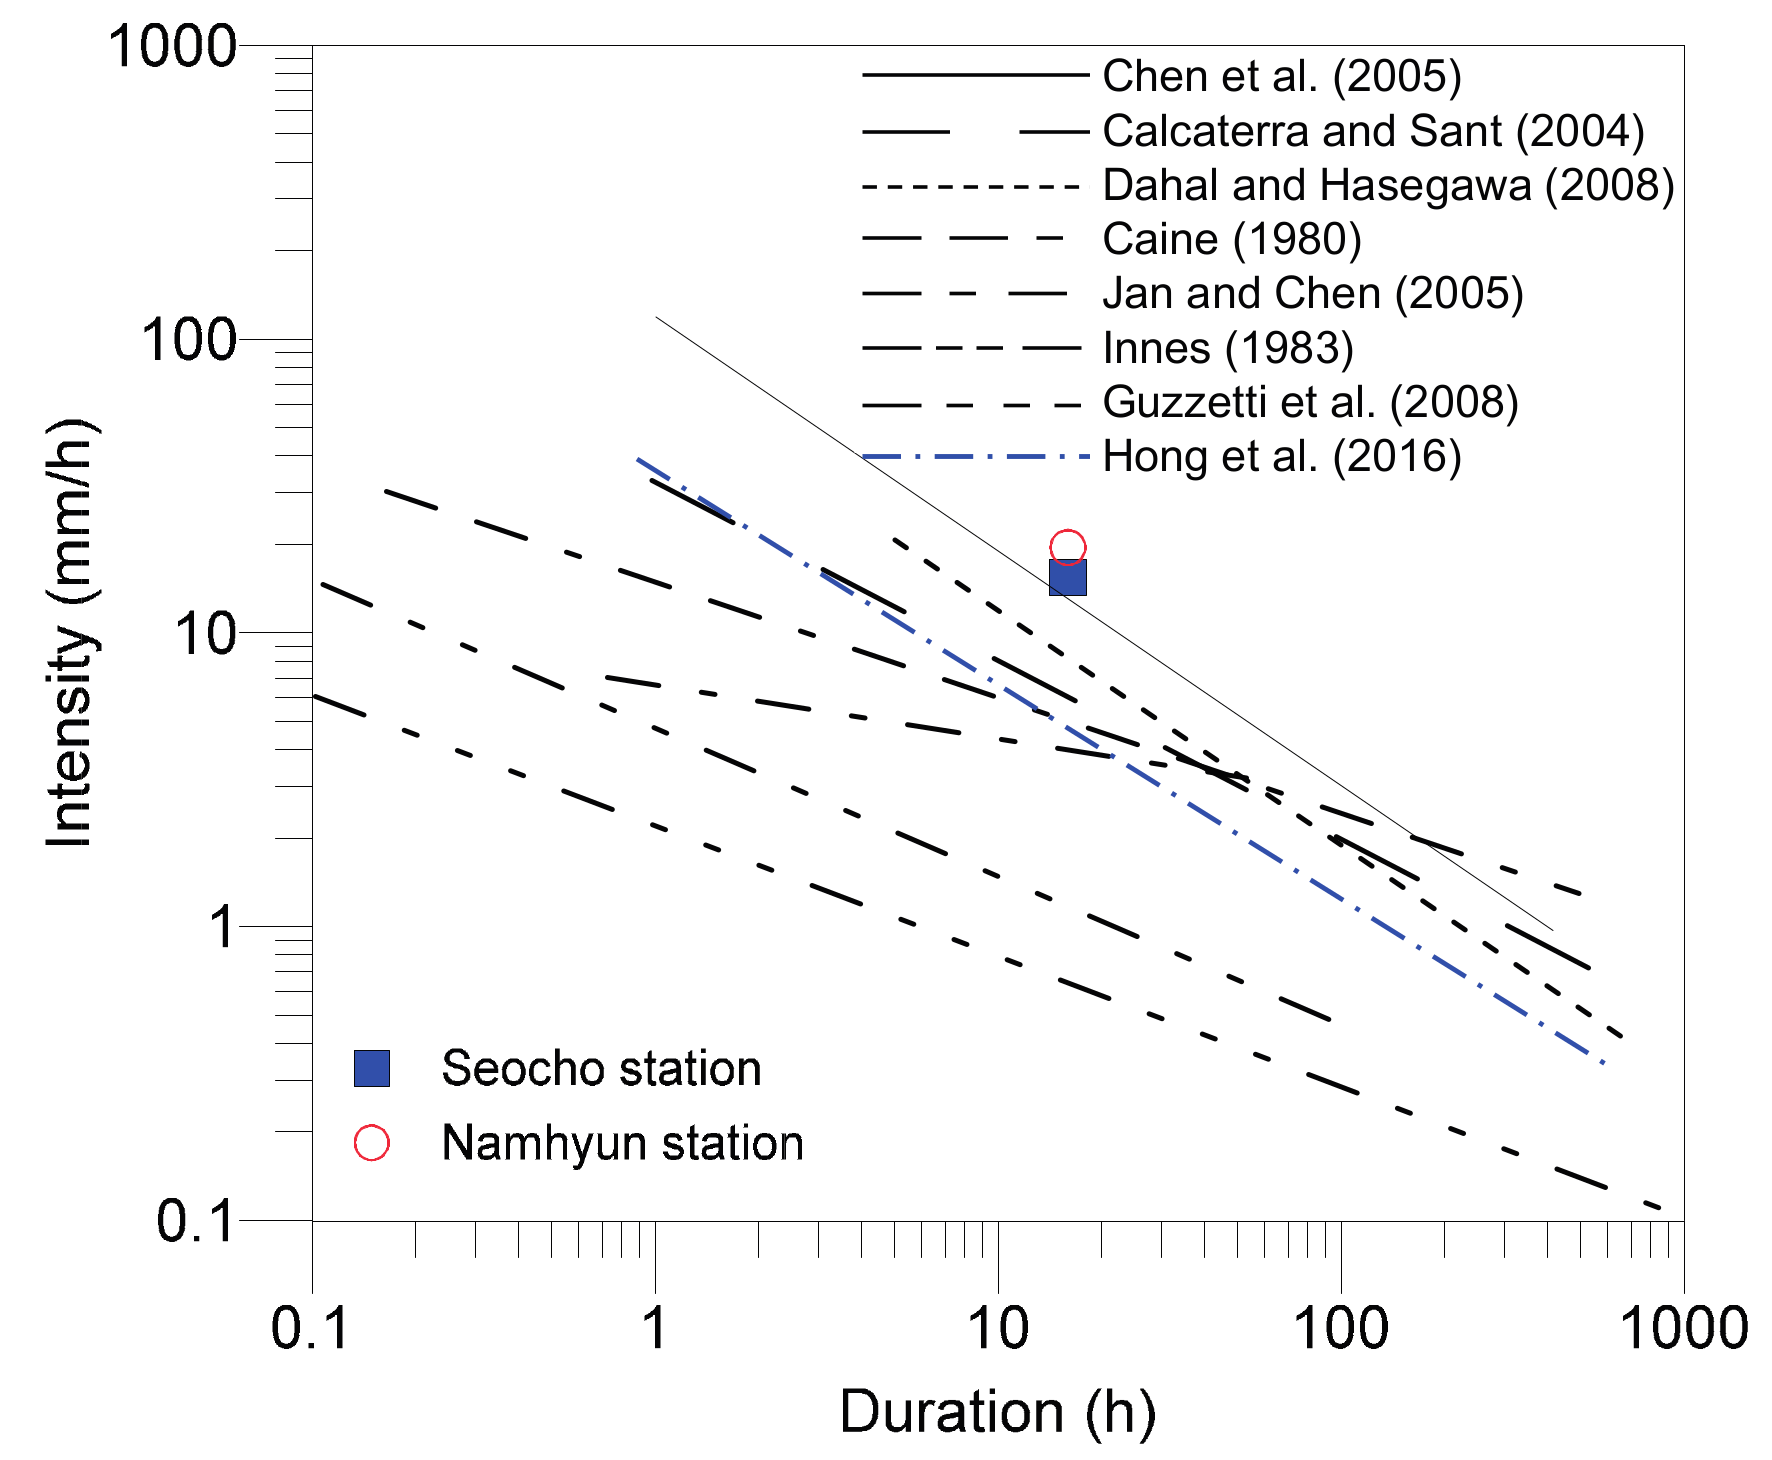
Figure 8.
Relationship between root length and colluvium depth.

Figure 9.
Soil–water characteristic curve.
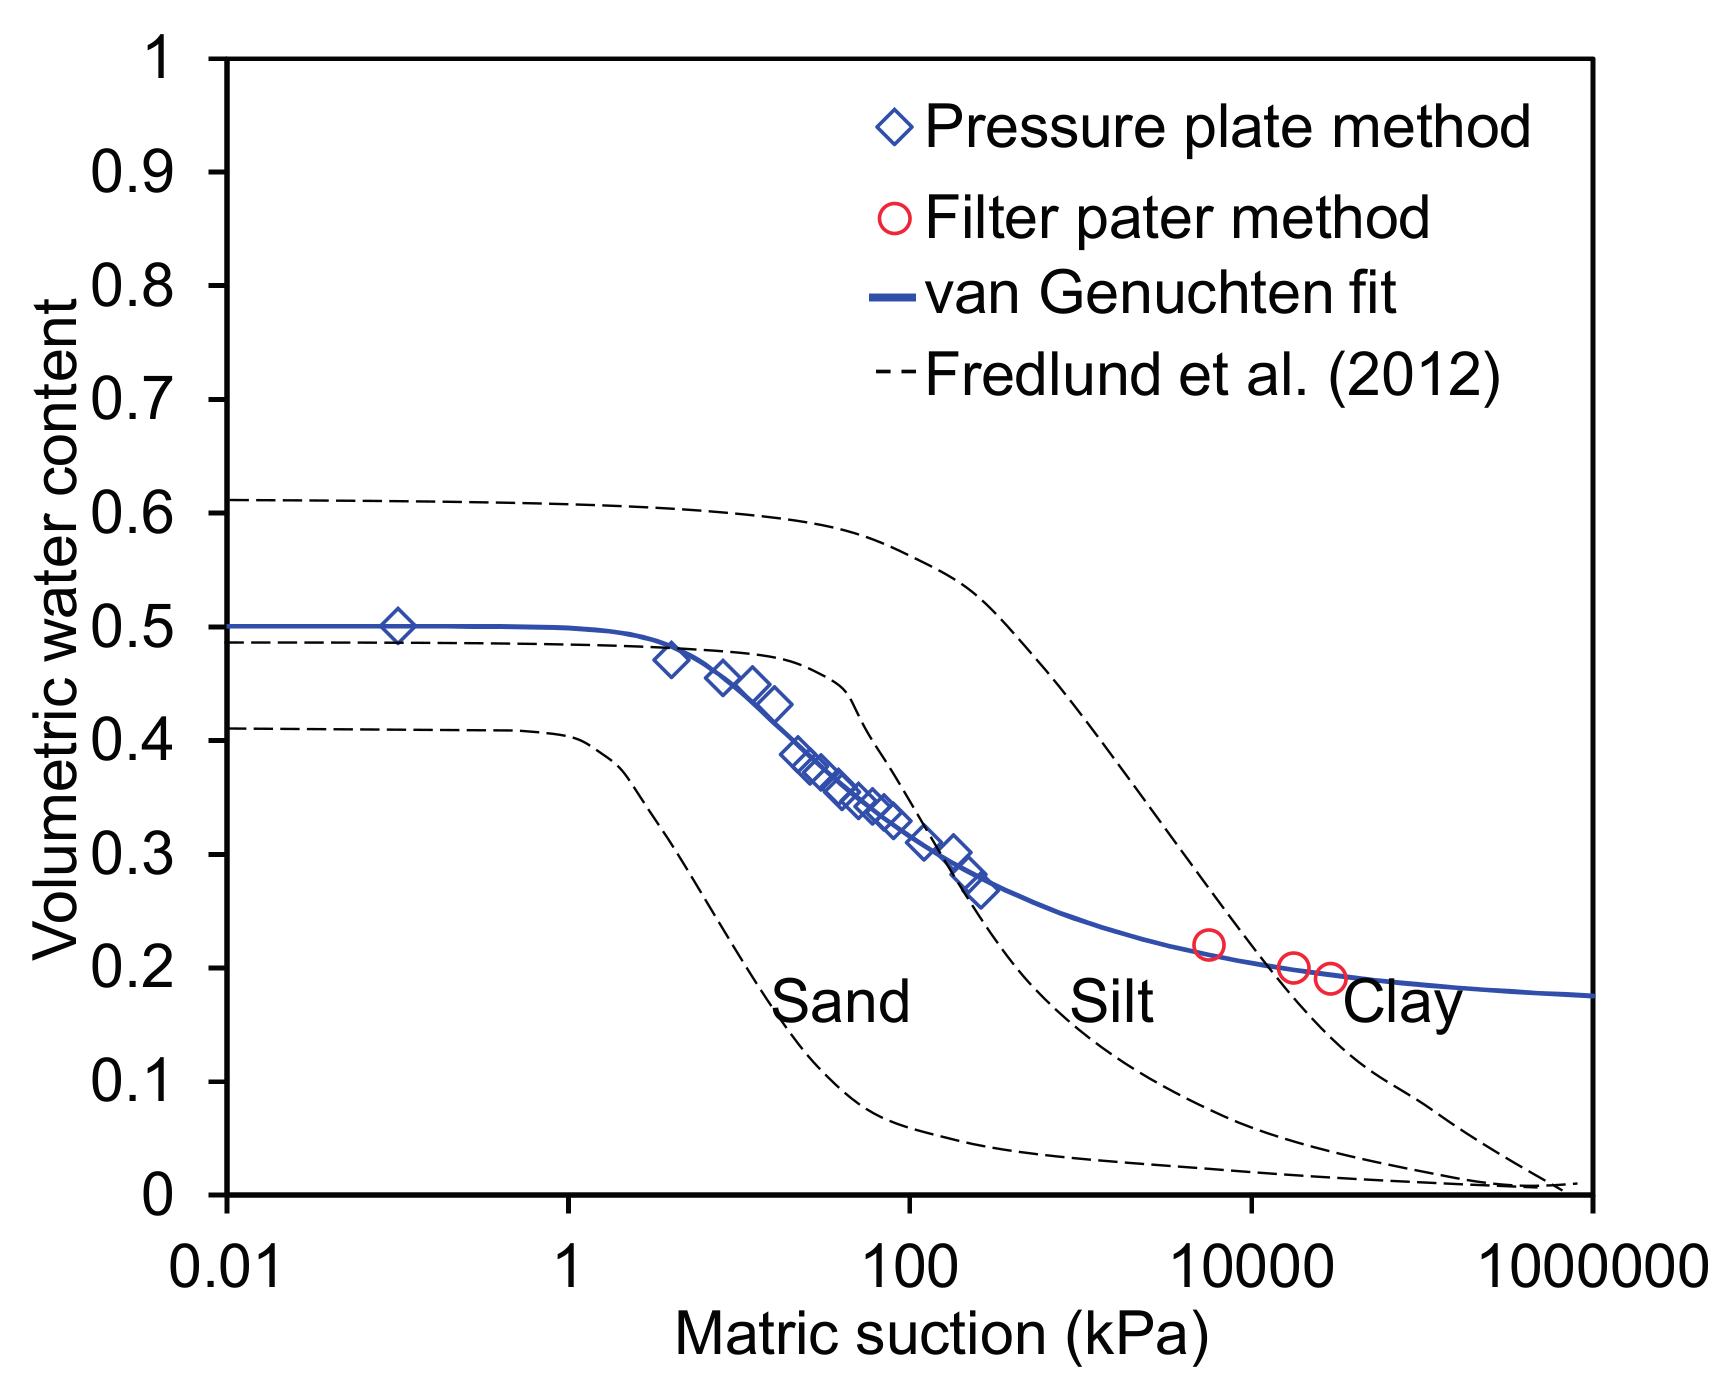
Figure 10.
The results of field measurement and rainfall data (T2, T5).
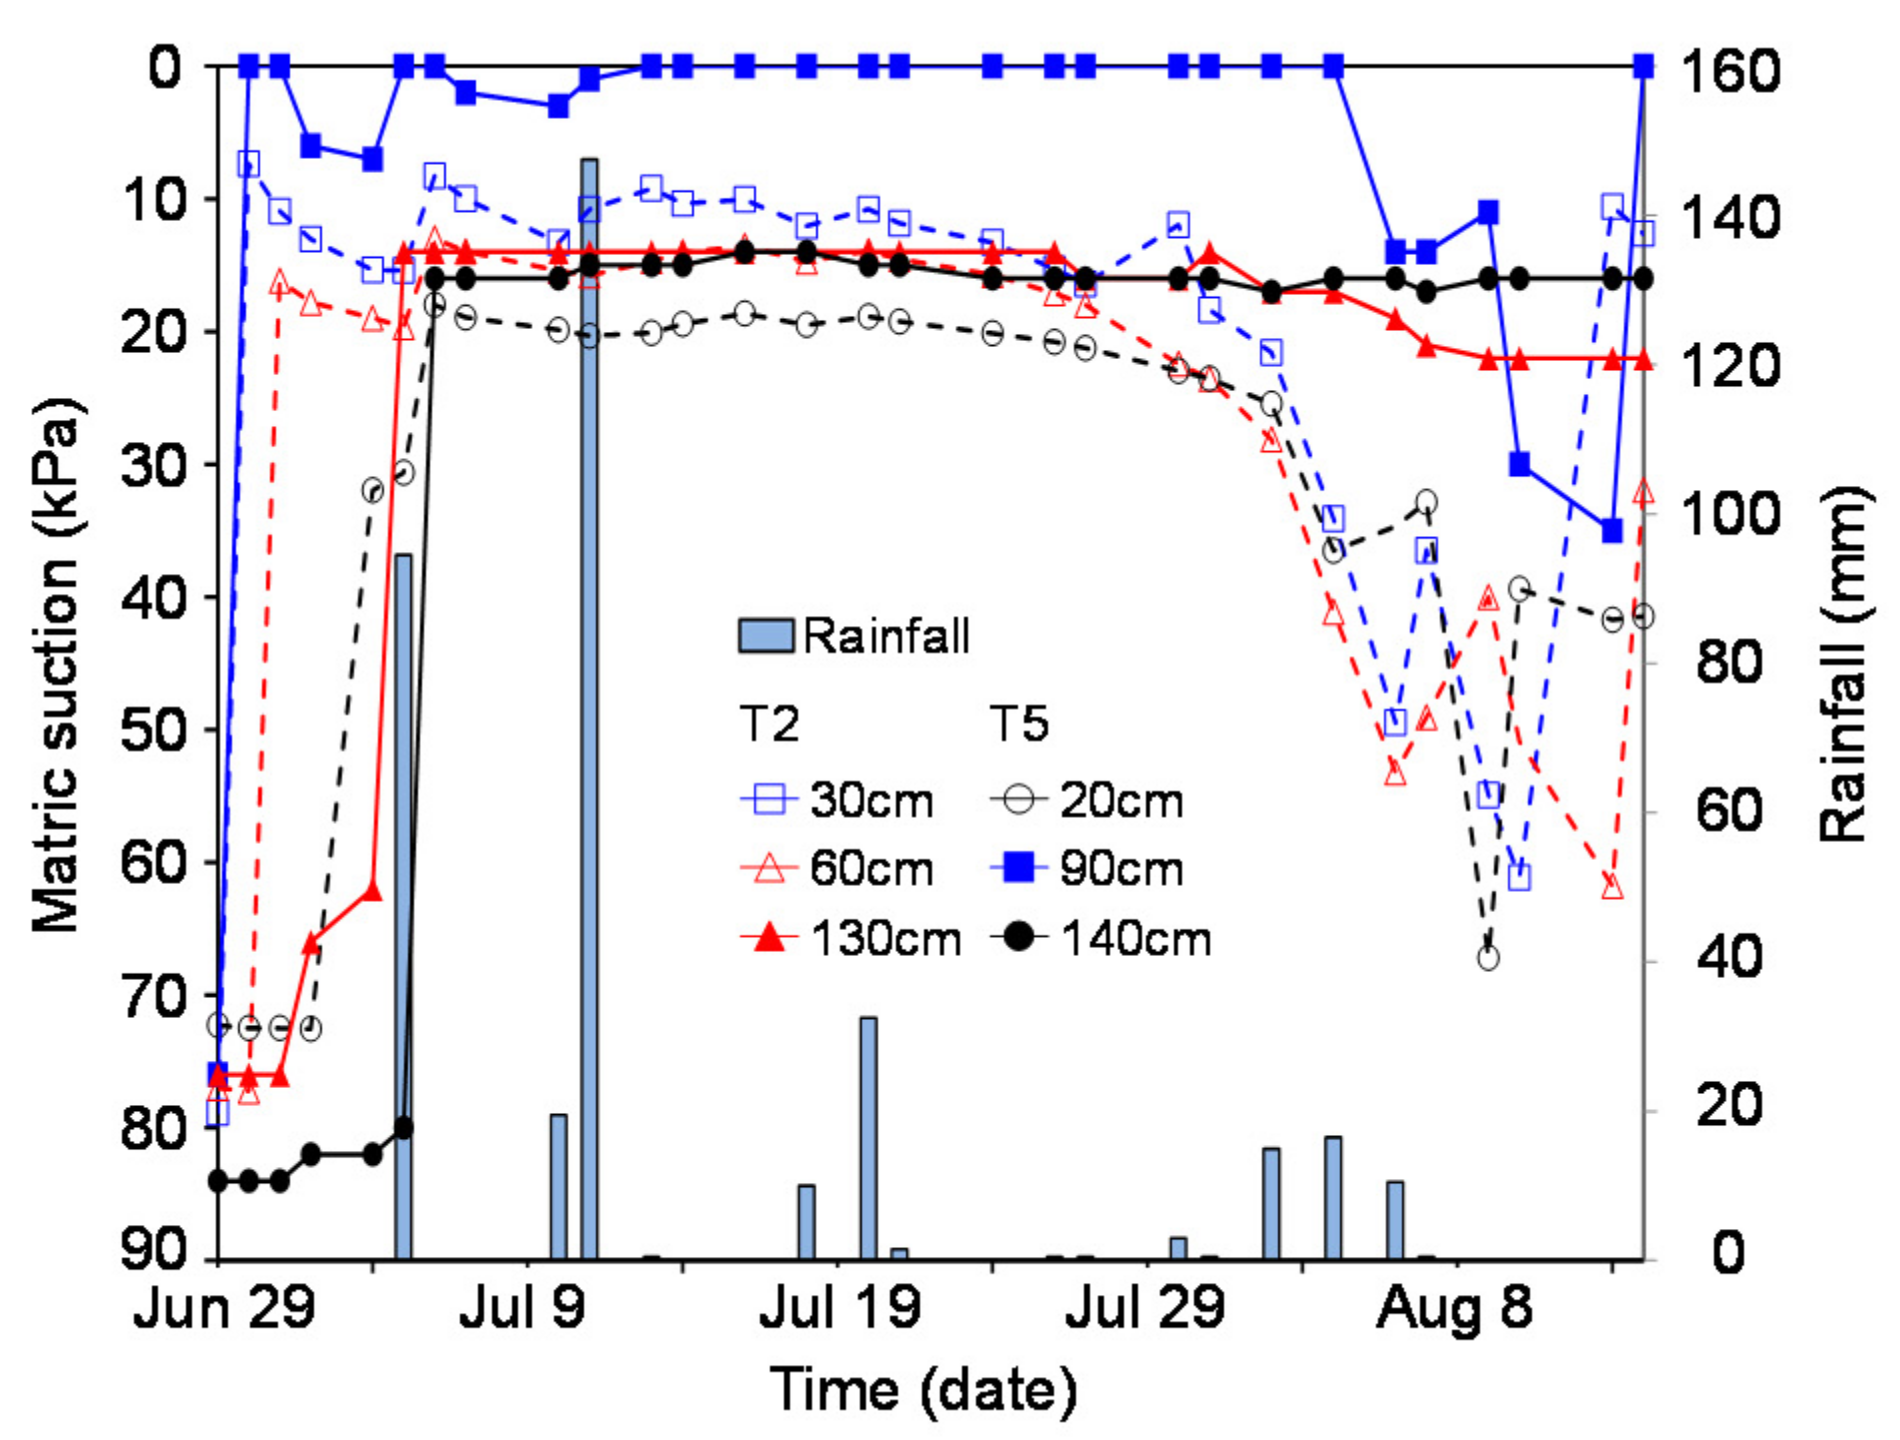
Figure 11.
Location of ground investigations (Korean Geotechnical Society, 2012).
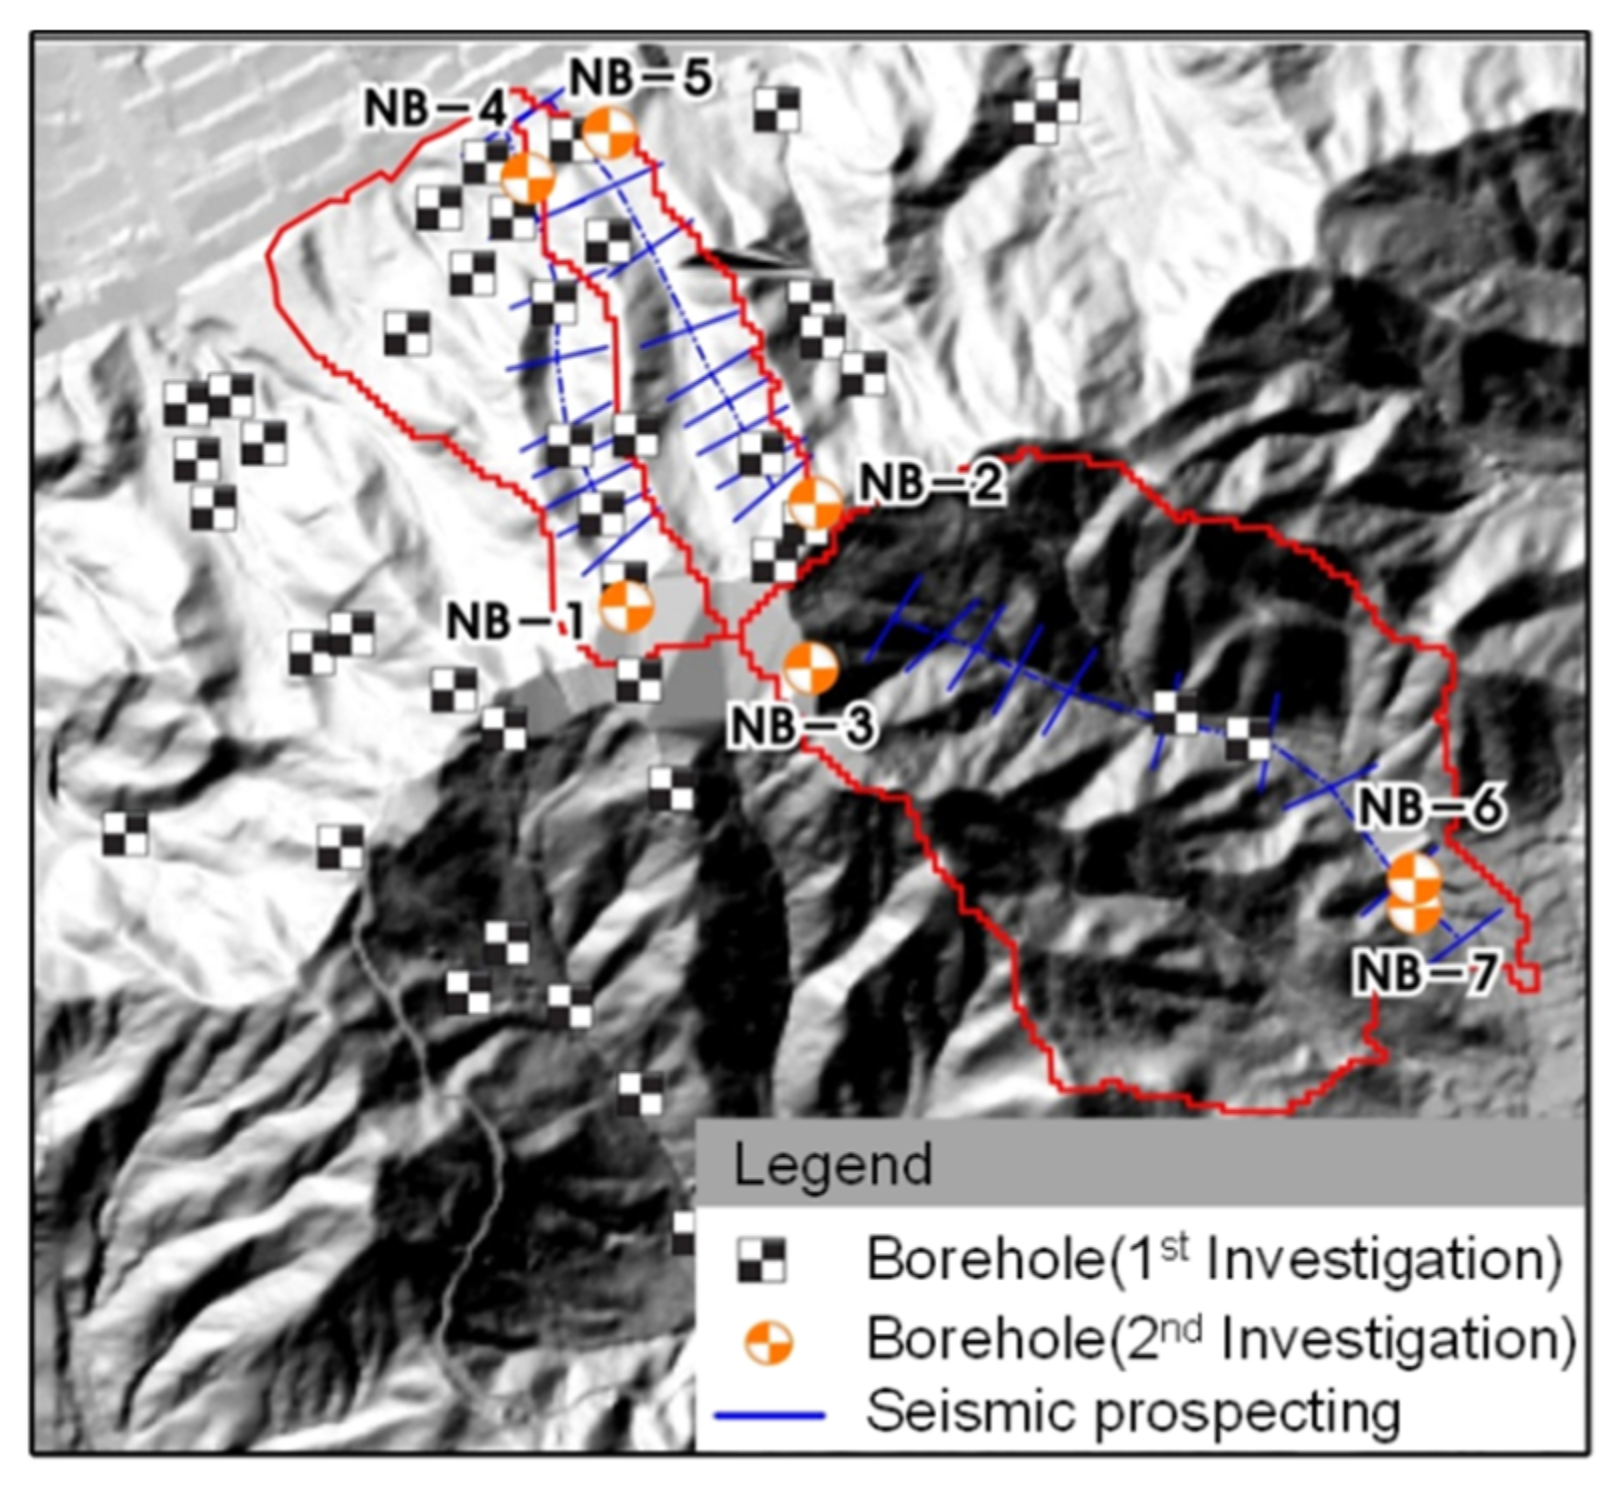
Figure 12.
Soil profile of the studied area: (a) Typical soil profile of Umyeonsan; (b) representative soil profiles of two watersheds.
Figure 12.
Soil profile of the studied area: (a) Typical soil profile of Umyeonsan; (b) representative soil profiles of two watersheds.

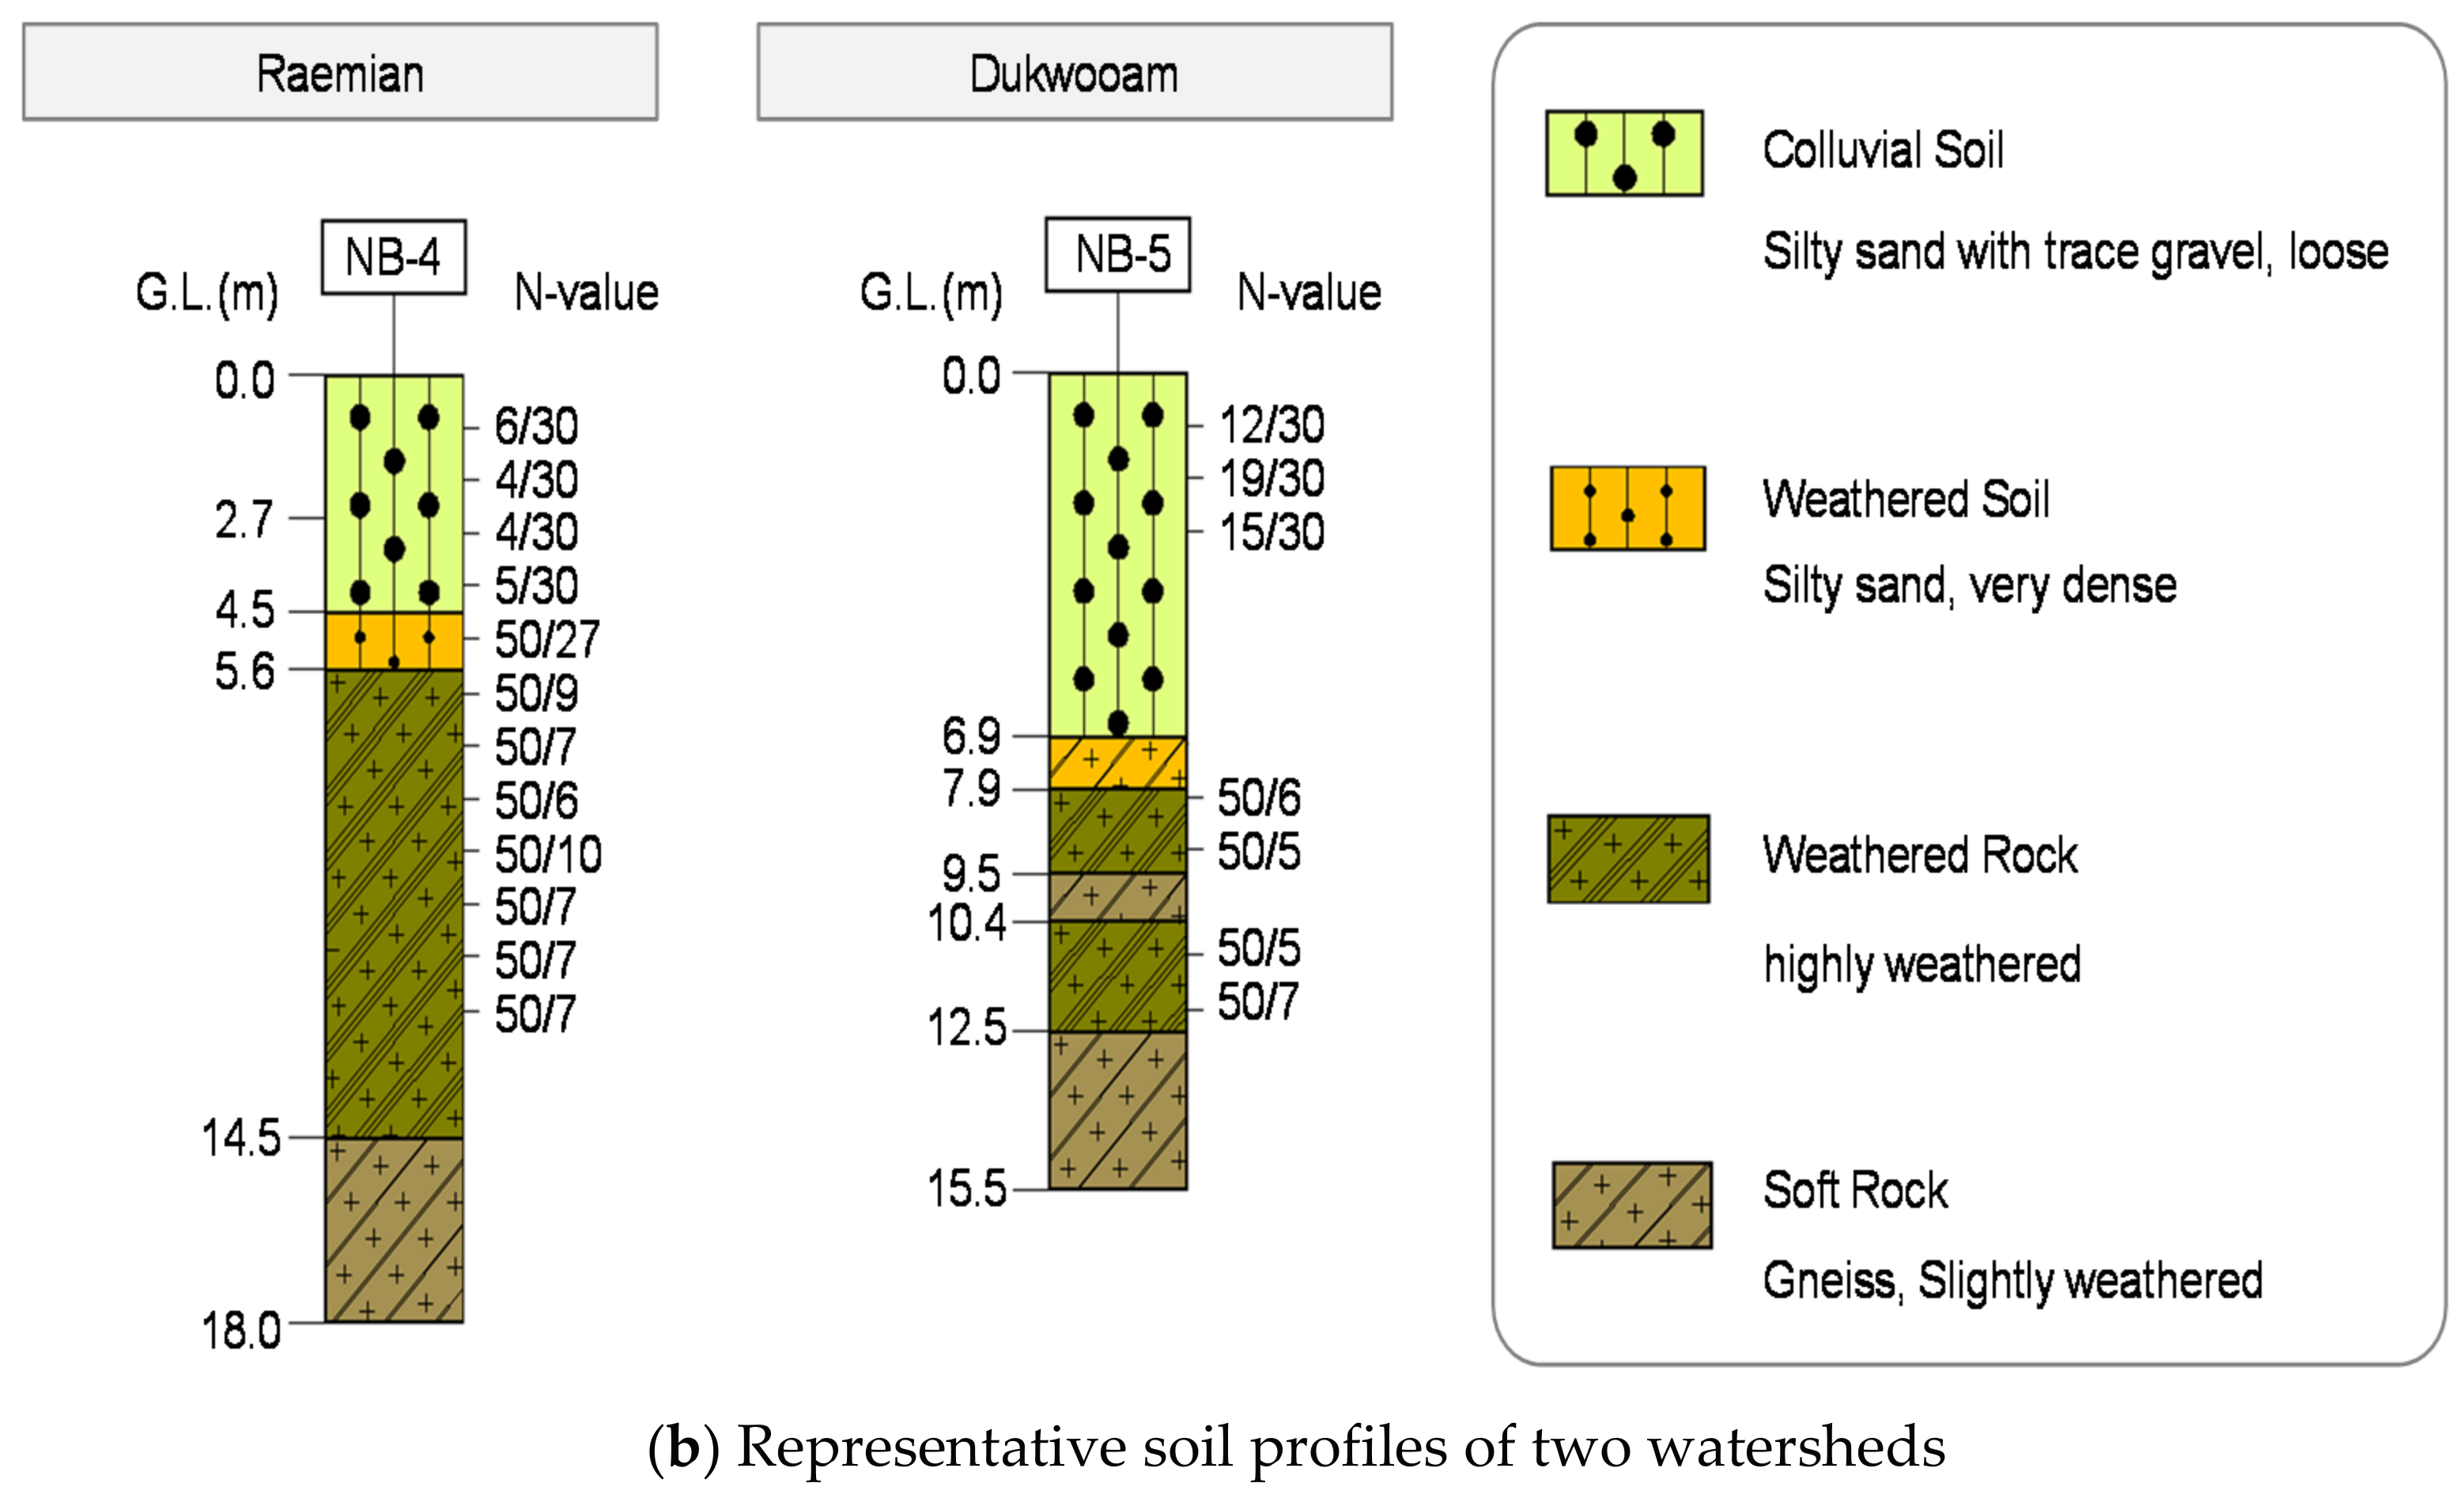
Figure 13.
Comparison between field and predicted matric suction.
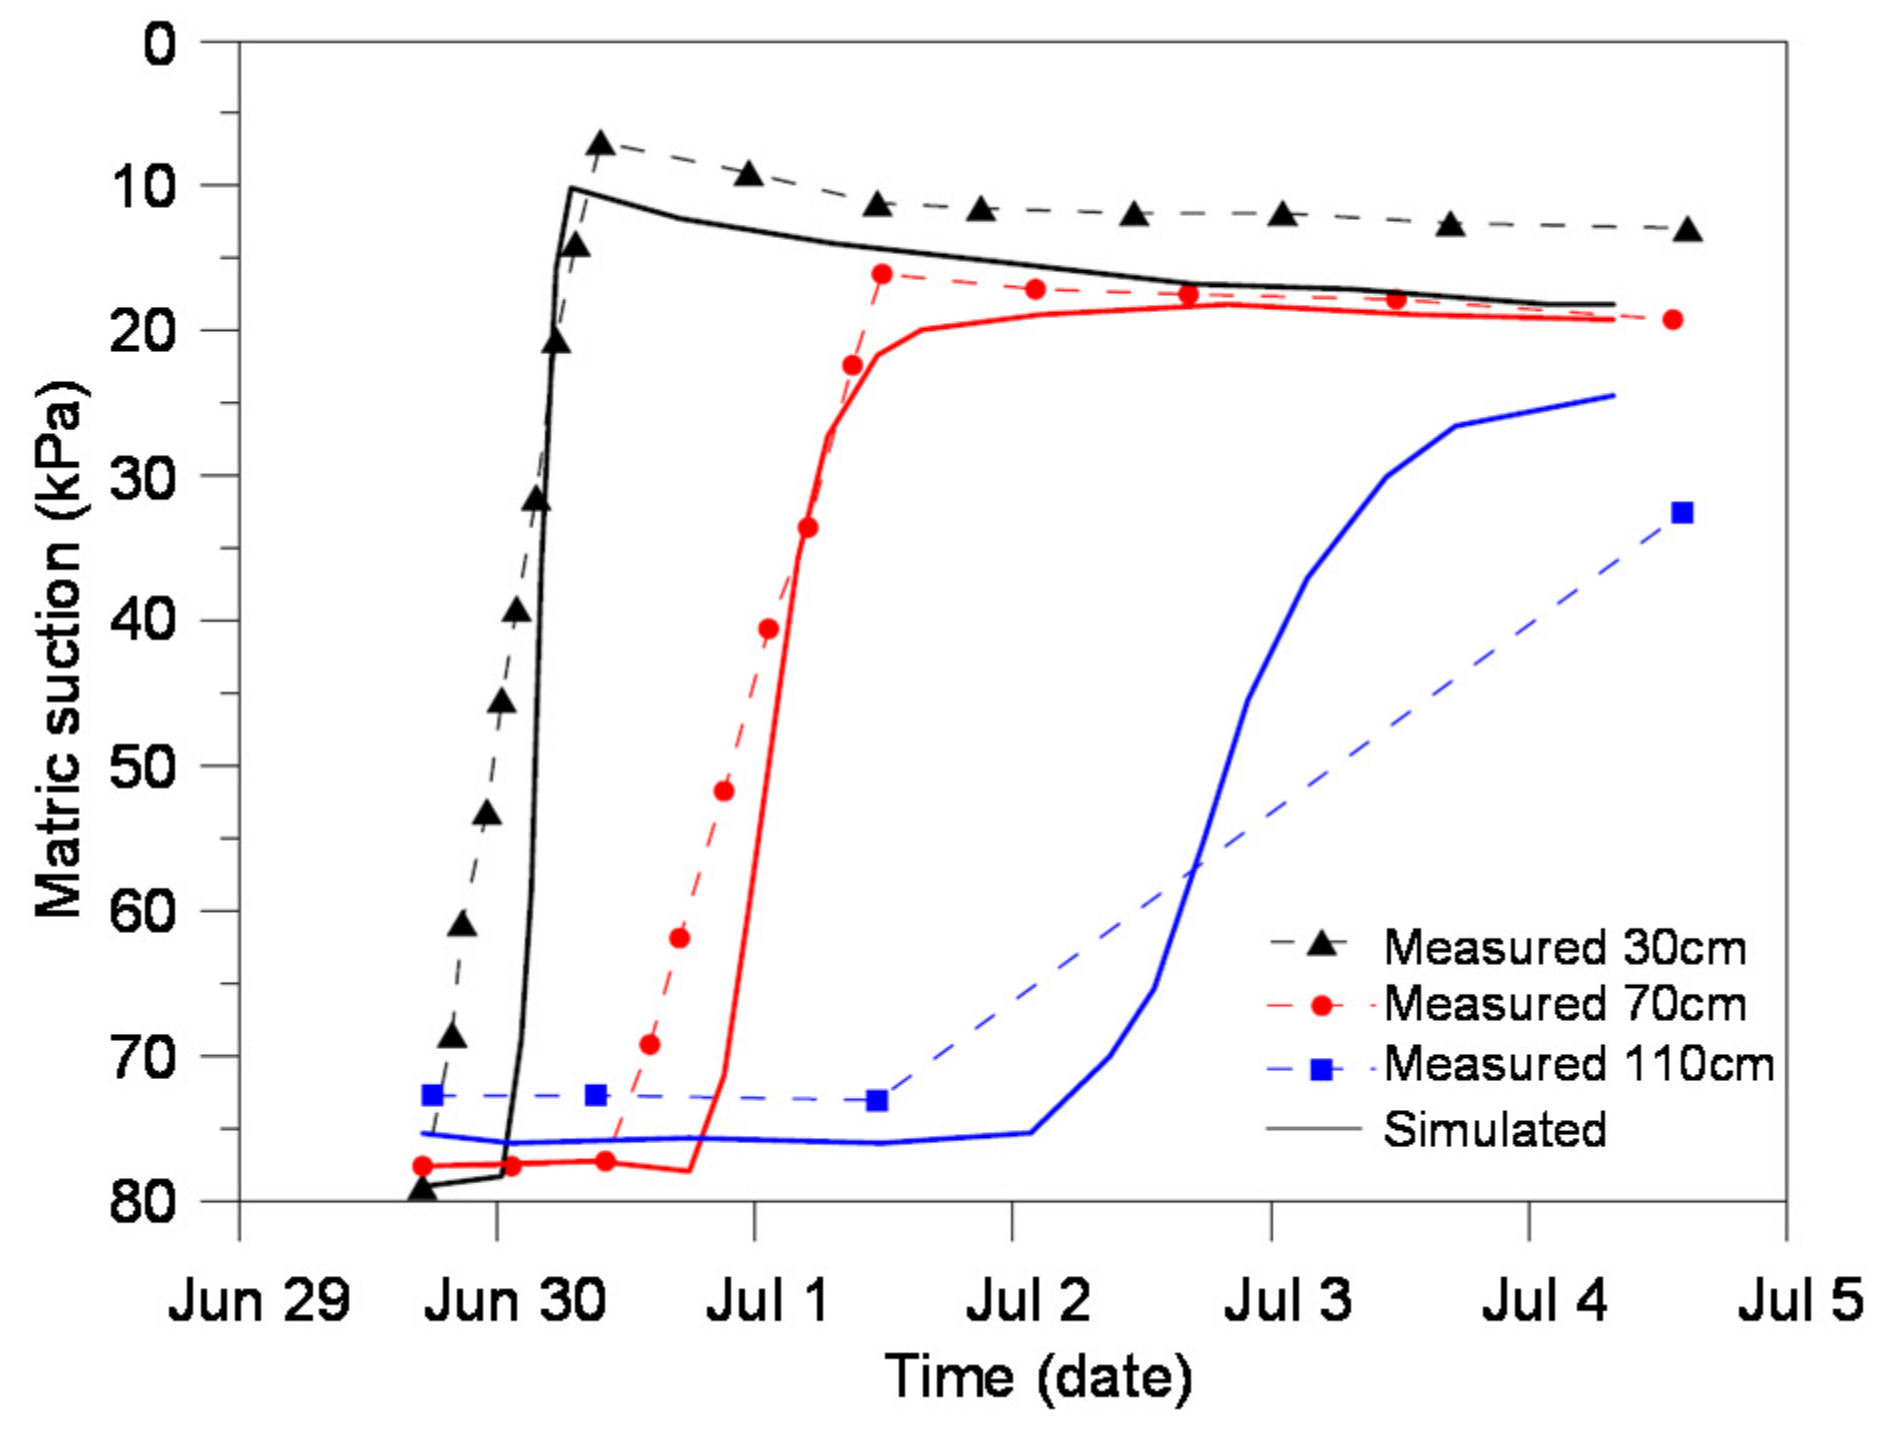
Figure 14.
Soil slope mesh used for two-dimensional seepage analysis, boundary conditions, and results of pore-water pressure distribution.
Figure 14.
Soil slope mesh used for two-dimensional seepage analysis, boundary conditions, and results of pore-water pressure distribution.
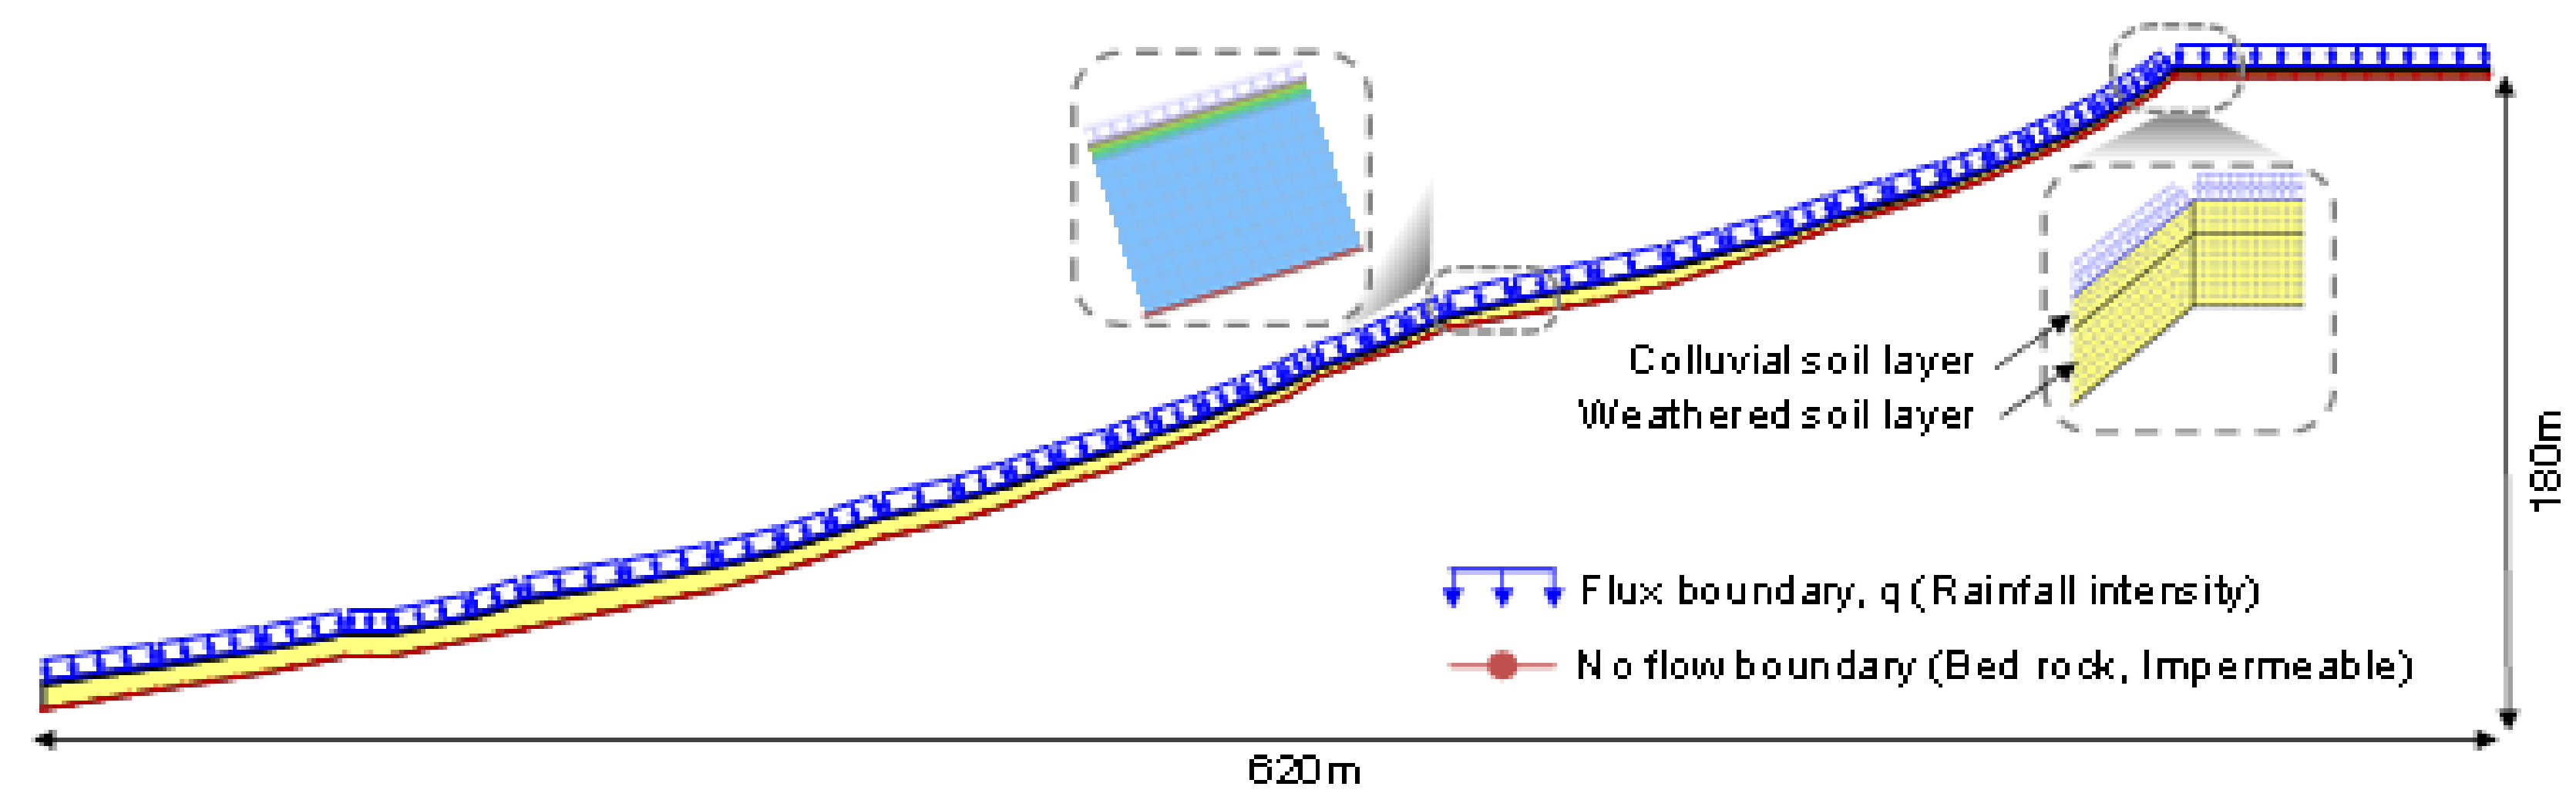
Figure 15.
Critical slip surface from coupled analysis: (a) Raemian watershed; (b) Dukwooam watershed.
Figure 15.
Critical slip surface from coupled analysis: (a) Raemian watershed; (b) Dukwooam watershed.
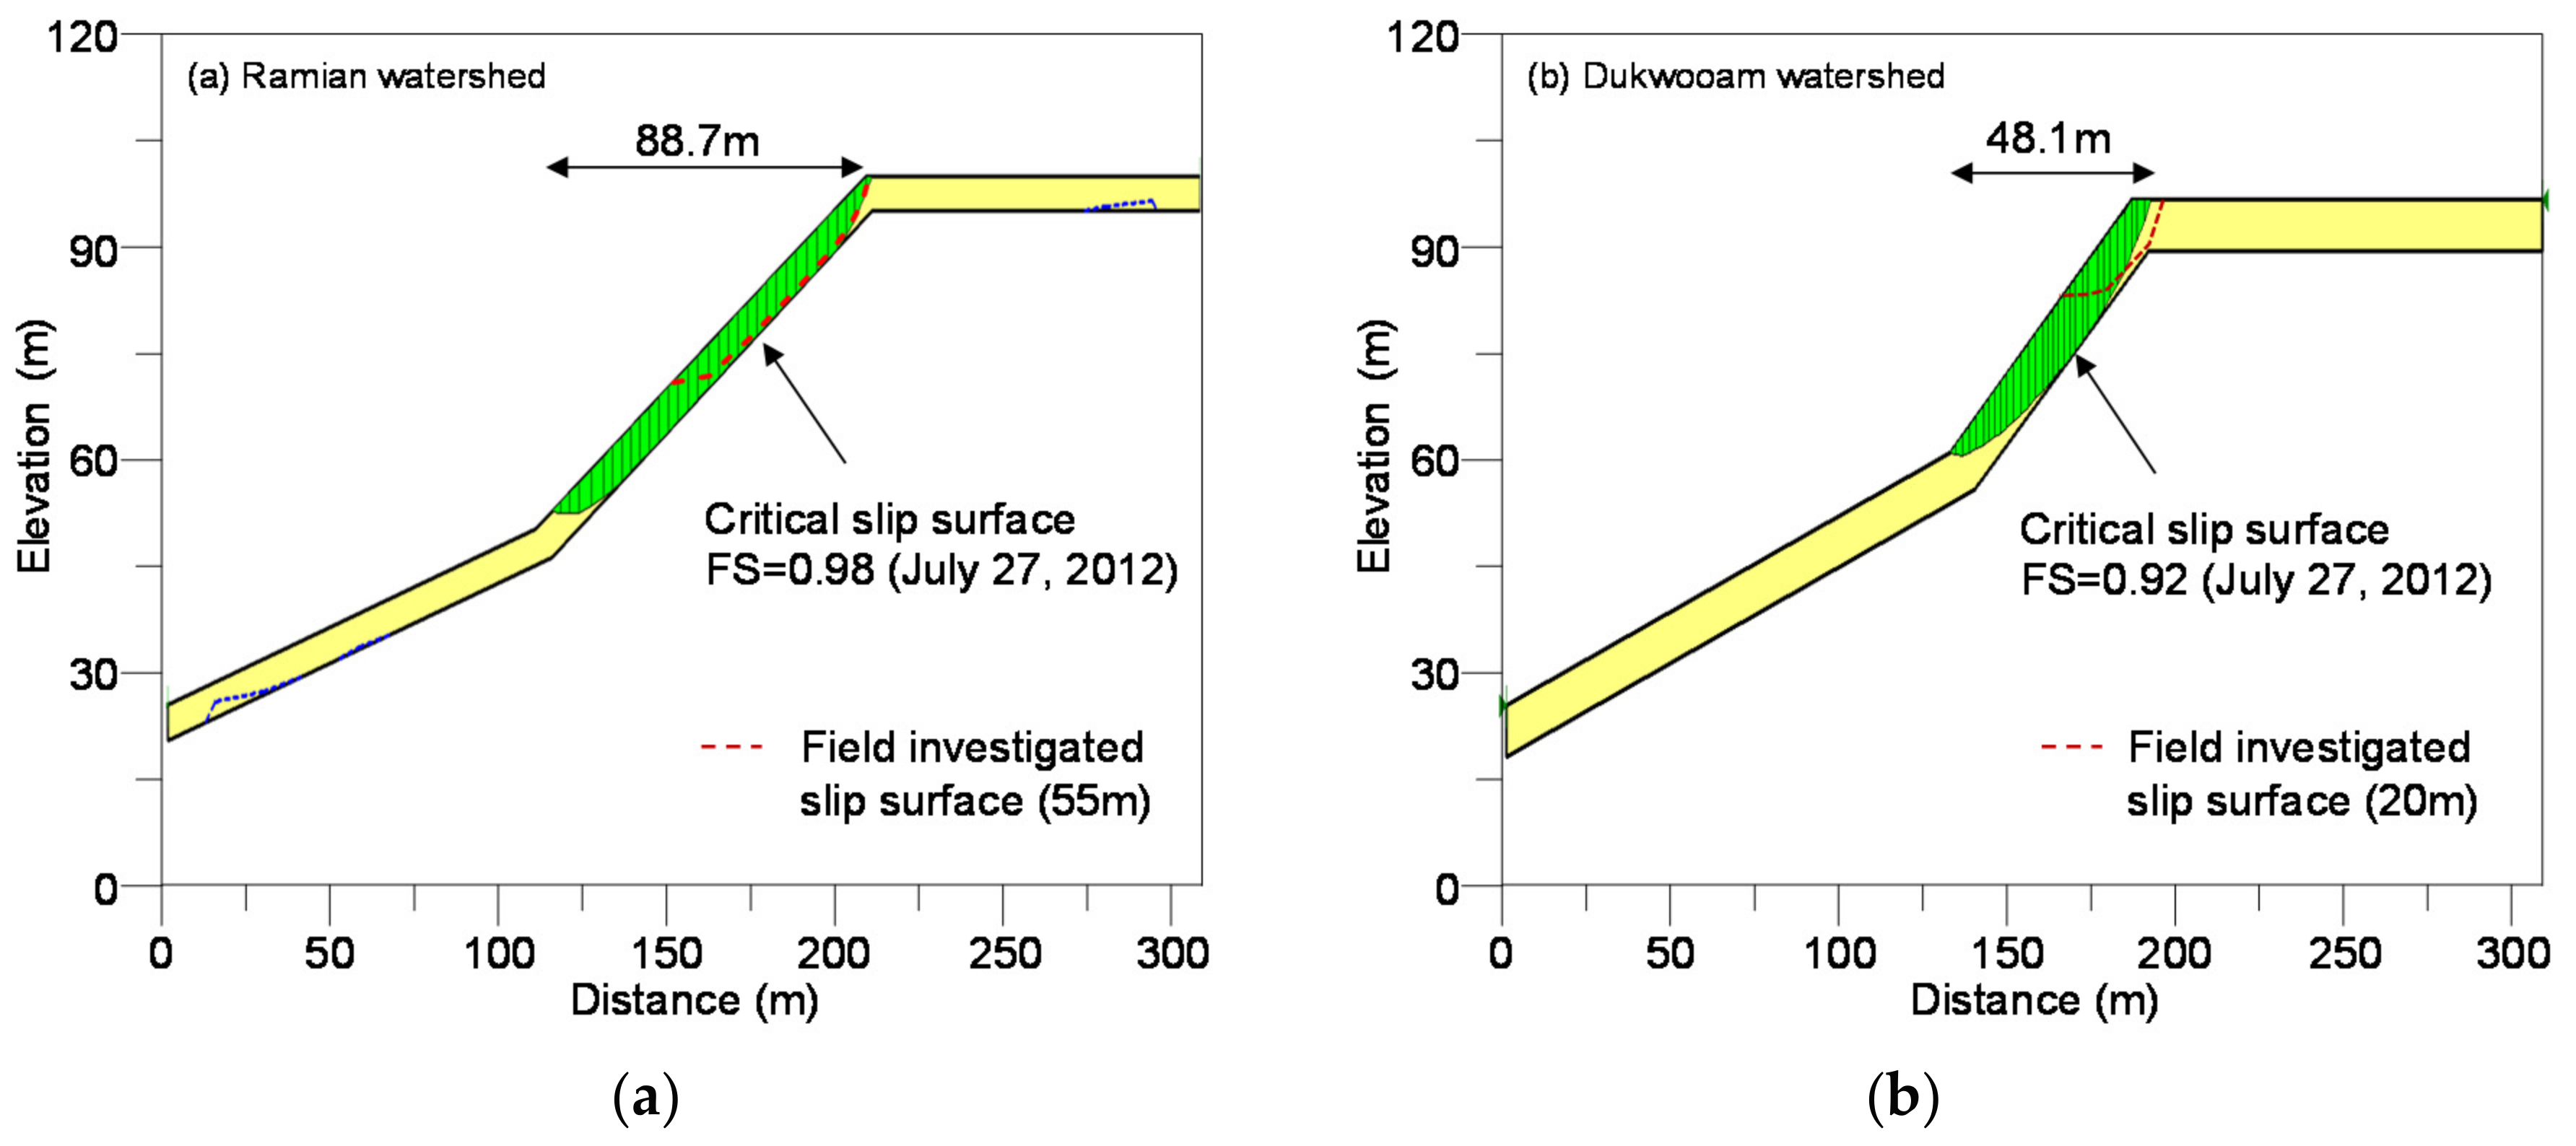
Figure 16.
Variation in factor of safety for studied areas with time.

Figure 17.
Longitudinal profile of debris flow gully from LiDAR survey in Raemian watershed.


Table 1.
Morphological characteristics of Umyeonsan area.
| ID | Basin Area (×103 m2) | Runout Distance (m) | Landslides Volume (m3) | Average Slope (°) |
|---|---|---|---|---|
| W1 | 75.6 | 606.7 | 1827.0 | 44 |
| W2 | 54.1 | 267.3 | 45.7 | 29 |
| W3 | 214.4 | 663.6 | 105.0 | 26 |
| W4 | 421.4 | 900.0 | 153.6 | 36 |
| W5 | 233.4 | 307.1 | 19.8 | 16 |
| W6 | 271.8 | 454.4 | 62.9 | 27 |
| W7 | 786.4 | 1365.1 | 34.2 | 35 |
| W8 | 178.2 | 632.0 | 125.2 | 26 |
| W9 | 678.9 | 941.3 | 182.0 | 36 |
| W10 | 64.2 | 229.7 | 129.3 | 29 |
| W11 | 444.8 | 960.3 | 75.4 | 34 |
| W12 | 41.4 | 201.5 | 70.2 | 29 |
| W13 | 324.0 | 385.4 | 73.2 | 30 |
| W14 | 17.7 | 176.3 | 108.6 | 33 |
| W15 | 48.9 | 246.8 | 55.4 | 34 |
| W16 | 90.9 | 435.7 | 134.3 | 40 |
| W17 | 57.0 | 130.6 | 8.1 | 37 |
| W18 | 183.6 | 562.9 | 112.3 | 40 |
| W19 | 76.2 | 495.2 | 86.9 | 35 |
| W20 | 90.8 | 625.3 | 98.7 | 35 |
| Total | 4353.7 | 10,450.2 | 3507.8 | - |
Table 2.
In situ soil properties from constant head permeability and shear tests performed in boreholes.
Table 2.
In situ soil properties from constant head permeability and shear tests performed in boreholes.
| Borehole | Depth (m) | Soil Type | k (m/s) | c (kPa) | φ (°) |
|---|---|---|---|---|---|
| B-1 | 1–2 | Colluvium | 4.67 × 10⁻⁶ | 7.5 | 22.3 |
| B-2 | 3–4 | Colluvium | 8.08 × 10⁻⁶ | 6.9 | 25.1 |
| 5–6 | Weathered rock | 1.99 × 10⁻⁶ | 18.1 | 27.3 | |
| B-3 | 1–2 | Colluvium | 8.08 × 10⁻⁴ | 8.36 | 24.78 |
| 3–4 | Weathered soil | 1.02 × 10⁻⁴ | 18.55 | 28.22 | |
| B-4 | 2–3 | Colluvium | 7.92 × 10⁻⁴ | 11.89 | 27.01 |
| 8–9 | Colluvium | 9.55 × 10⁻⁵ | 14.96 | 32.13 |
k: Permeability; c: Apparent cohesion; φ: Internal friction angle.
Table 3.
Geotechnical properties of the colluvial deposit from laboratory tests.
| Test Pit | Depth (m) | w (%) | PL (%) | LL (%) | % Fines | USCS | c (kPa) | φ (°) |
|---|---|---|---|---|---|---|---|---|
| TP-1 | 0.5 | 18.2 | 21.2 | 36.6 | 51.9 | CL | 9.2 | 21.7 |
| TP-2 | 0.5 | 14.1 | 22.3 | 31.6 | 28.9 | SC | 10.9 | 23.7 |
| TP-3 | 0.5 | 32.1 | 23.7 | 40.6 | 55.7 | CL | 11.3 | 23.1 |
| TP-4 | 0.5 | 15.8 | 20.9 | 35.9 | 44.4 | SC | 11.8 | 22.7 |
w: water content; PL: Plastic limit; LL: Liquid limit; % Fines < 0.075 mm; USCS: Unified Soil Classification System; c: Cohesion; φ: soil friction angle.
Table 4.
Geotechnical and hydraulic properties of the soil used in this study.
| Parameters | Values | Description |
|---|---|---|
| Hydraulic conductivity, ks | 8 × 10⁻⁶ m/sec (28.8 mm/h) | In situ permeability test |
| Initial water contents, | 28.0~32.0 (30.0)% | SWCC test |
| Water-content deficit, | 0.20 | SWCC test |
| Wetting front suction head, | 830 mm | SWCC test |
| Soil cohesion, | 6.9~18.5 (11.7) kPa | Direct shear test, borehole shear test |
| Soil friction angle, | 21.7~32.1 (25.3) deg. | Direct shear test, borehole shear test |
| Total unit weight of soil, | 17.0~18.5 (18.0) kN/m3 | laboratory density test |
| Additional shear strength by roots of tree, | 1.0 kPa | suggested by Norris et al. [49] |
| Uniform load by tree, | 0.253 kPa | suggested by KFRI, [50] |
(): average value.
© 2017 by the authors. Licensee MDPI, Basel, Switzerland. This article is an open access article distributed under the terms and conditions of the Creative Commons Attribution (CC BY) license (http://creativecommons.org/licenses/by/4.0/).
Share and Cite
MDPI and ACS Style
Jeong, S.; Lee, K.; Kim, J.; Kim, Y. Analysis of Rainfall-Induced Landslide on Unsaturated Soil Slopes. Sustainability 2017, 9, 1280. https://doi.org/10.3390/su9071280
AMA Style
Jeong S, Lee K, Kim J, Kim Y. Analysis of Rainfall-Induced Landslide on Unsaturated Soil Slopes. Sustainability. 2017; 9(7):1280. https://doi.org/10.3390/su9071280
Chicago/Turabian StyleJeong, Sangseom, Kwangwoo Lee, Junghwan Kim, and Yongmin Kim. 2017. "Analysis of Rainfall-Induced Landslide on Unsaturated Soil Slopes" Sustainability 9, no. 7: 1280. https://doi.org/10.3390/su9071280
Note that from the first issue of 2016, this journal uses article numbers instead of page numbers. See further details here.