1. Introduction
The world population continues to shift to urban areas. Cities are loci of capital accumulation, economic growth, political power, social and cultural activities, and technological innovation [
1]. This high level of concentration of resources and activities makes cities potentially vulnerable to a variety of natural and man-made risks and disasters. Identifying potential risks and developing mitigation plans to reduce urban vulnerability is critical for achieving urban sustainability and should be an integral part of urban planning and design [
2,
3]. Urban vulnerability can be defined as the extent of the damage that occurs to the components of a city. Urban vulnerability is a function of the severity and frequency of hazards, the sensitivity of the urban system, and the city’s adaptive capacity [
4]. In general, there are different types of vulnerability, and these can be divided into four main categories: physical, social, economic, and environmental [
5]. Depending on the origin of the disaster, vulnerability can also be classified as either natural or man-made [
6]. Among other things, what makes hazards major threats is the lack of preparedness to deal with them, so an effective way to deal with these hazards is to create and maintain preparedness [
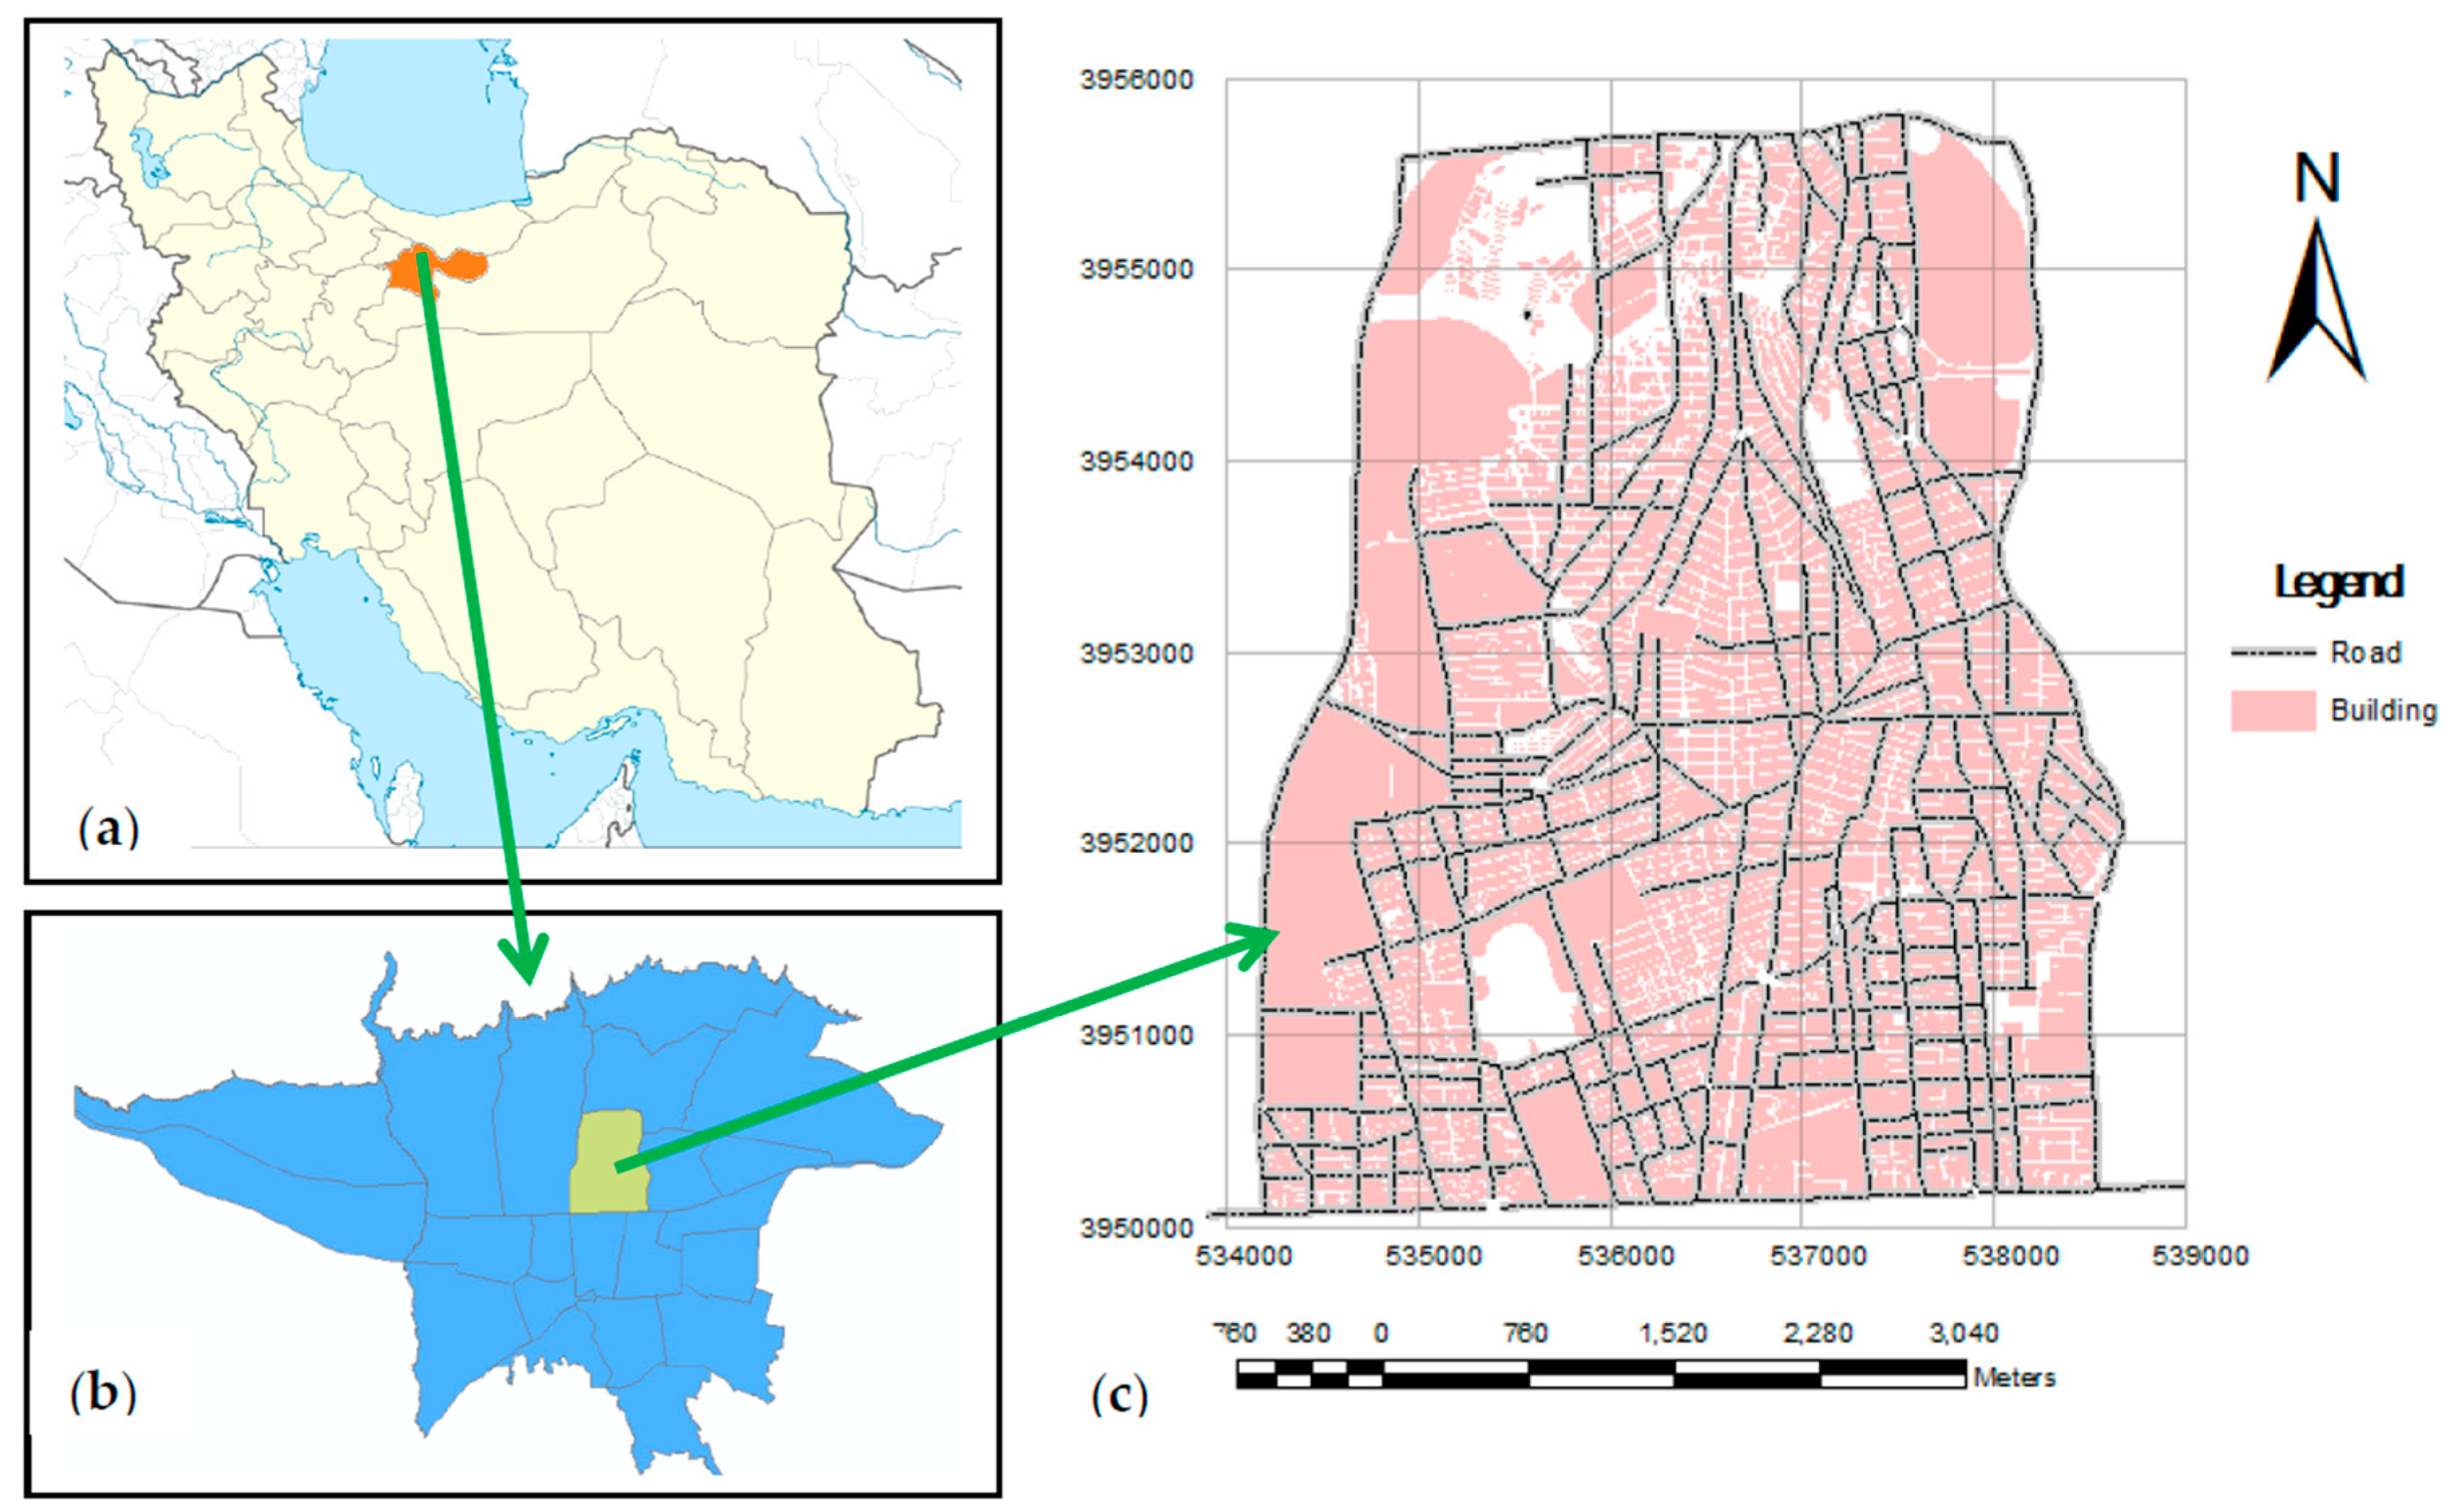
7]. One of the basic ways to create preparedness for hazards is by improving awareness of the degree of vulnerability in different locations and areas of the city. This study aims to analyze the vulnerability of buildings, as major physical urban elements, to intentional explosions, which are a common form of man-made hazard. The vulnerability of the building stock in District 6 of Tehran is evaluated under different risk conditions, varying from the most optimistic to the most pessimistic scenario.
This study only considered the modelling of physical vulnerability to an explosion hazard (one of the man-made hazards). Among various physical components, only the vulnerability of buildings has been of interest in this research. Vulnerability is a function of several criteria; therefore, this study used a multi-criteria decision making (MCDM) model. MCDM or multiple-criteria decision analysis (MCDA) is a subdiscipline of operations research that explicitly evaluates multiple conflicting criteria in the decision-making process. MCDM is concerned with structuring and solving decision and planning problems involving multiple criteria [
8]. The difficulty of the problem originates from the presence of more than one criterion.
However, many of the criteria related to vulnerability have a spatial nature, such that they are a function of the geographical positions of buildings. Hence, geospatial information systems (GIS) have a very high potential for storing, editing, and analyzing spatial data, and providing multiple applications for modelling vulnerability. Therefore, in this study, a combination of MCDM and GIS (GIS-based MCDM), as one of the most common models for vulnerability evaluation, is considered. Examples of spatial criteria include the distance from the facilities network and the distance from petrol pumps; these criteria and others are described in the criteria extraction section. According to the above description, the vulnerability of buildings is a function of their geographical position. Therefore, this study used spatial modelling for evaluating vulnerability.
Since many people may be living in the buildings, when they are damaged the population can be seriously affected. Such damage will also have many secondary consequences, including human loss and social and economic vulnerability. Although the purpose of this study is modelling physical vulnerability, the results can be used for modelling other types of vulnerability, (e.g., social, economic and environmental). For instance, based on the number of residents in each building, we can estimate the vulnerable population and the resulting human casualties.
GIS-based, multi-criteria decision analysis techniques have been used extensively to evaluate disaster risk, prioritize risks, and inform land-use planning. Studies employing such techniques are mainly focused on the vulnerability of cities to natural hazards such as floods and earthquakes [
9,
10,
11,
12,
13,
14,
15,
16,
17]. Many investigations have been conducted regarding combining the GIS-MCDM models and fuzzy set theory [
18,
19,
20,
21,
22,
23,
24,
25]. Risk management is an integral part of urban crisis management [
26] and many studies have been undertaken on the application of GIS in crisis management and modelling vulnerability in different risk conditions [
27,
28,
29,
30,
31,
32,
33]. Risk management uses various different techniques and models; in this research, ordered weighted averaging (OWA) has been employed as one of the commonly-used aggregation operators. In recent years, there has been much progress in this area and many researchers have used the OWA operator [
34,
35,
36,
37,
38,
39].
As previously stated, use of certain techniques for estimating risks and losses related to man-made and technological hazards such as explosions and blast loads is limited (with respect to natural hazards). Arguing that it is important to enhance the blast resistance of civilian structures, Tadepalli and Mullen [
40] proposed a model for risk assessment, damage analysis, and loss estimation. Their GIS model incorporates building data such as the type of structure, occupancy level, number of storeys, type of glazing, economic value of the building and its contents, and the maximum number of building occupants. Damage levels were quantified as low, moderate, or high. Once the degree of damage in a building due to a blast event was determined, the performance levels of the building were classified into levels for immediate occupancy, life safety, and collapse prevention. The loss due to a blast event was computed using a methodology similar to that used for seismic loss estimation. The premise was that the range of damage states which might occur due to a blast is similar to those which occur during earthquakes. The results of a simulation analysis conducted for buildings located at the University of Mississippi were visualized in the GIS environment. The results of this type of simulation study can be used for blast-hazard mitigation. Kulawiak and Lubniewski [
41] used a web-based GIS to spatially visualize the impact of a simulated blast on a railway station in Gdansk, Poland. Results indicated that this technique can reveal vulnerabilities in terms of the extent to which buildings and critical infrastructure can be damaged, and the costs and injuries that may occur. Ma and Cheng [
42] developed a GIS-based quantitative risk analysis (QRA) model and simulated the potential damage to buildings as a result of a natural gas pipeline explosion. The process incorporated an assessment of the failure rates of integrated pipeline networks, a quantitative analysis model of accident consequences, and an assessment of individual and societal risks. Firstly, the failure rates of the pipeline network were calculated using empirical formulas influenced by parameters such as external interference, corrosion, construction defects, and ground movements. Secondly, the impacts of accidents due to gas leakage, diffusion, fires, and explosions were analyzed by calculating the area subject to instances of poisoning, burns, and death. Lastly, based on the previous analyses, individual risks and social risks were calculated. The potential damage was divided into four categories, i.e., minor damage, minor structural damage, major structural damage, and partial demolition. The proposed GIS-based QRA system proved to be promising for use in planning for urban risk management of gas pipeline networks on a macro-scale. By combining GIS index modelling and risk assessment methods, Armenakis and Nirupama [
43] developed a spatial risk assessment method to estimate the spatial risks of hazards caused by a propane explosion. Their work investigated the propane explosion that occurred on the 10 August 2008 at 3:30 a.m. in a Toronto neighborhood, as a case study to estimate spatial risk in the neighborhood around the explosion site using a GIS-based approach. The total vulnerability was estimated based on social, physical, and economic vulnerabilities. This research demonstrated the utility of risk assessment using GIS techniques for prioritizing spatial risks and estimating the potential impacts based on proximity to the blast source. Integrating such techniques into land-use planning is essential for disaster risk reduction in urban areas. Matijosaitiene and Petriashvili [
44], by investigating explosion-related terrorist events in different countries, concluded that terrorists’ choice of targets was firmly based on a series of criteria. Therefore, the researchers identified these factors via questionnaires, and the most effective factors were identified using automatic regression analysis. The authors demonstrated that crime prevention through environmental design principles—such as minimizing vehicle access points to buildings, separating public and private domains, and ensuring that buildings with identical functions in a given area are highly distributed—can have a significant impact on whether a site is likely to be selected as a target for terrorist attacks.
On the other hand, research on the vulnerability of the built environment to blast and explosion is scarce in the Iranian context. Integrating GIS and analytic hierarchy process (AHP) techniques, Azizi et al. [
45] evaluated the vulnerability of urban blocks in the 11th district of Tehran Municipality. Vulnerability was evaluated using 13 criteria. Ultimately, a vulnerability map was generated for the studied structural blocks, in which 8% of structural blocks had low vulnerability, 64% had medium vulnerability, and 28% had high vulnerability. Results also indicated that antiquity of structures and high structural density were the main factors inducing vulnerability in the buildings of Tehran’s 11th district. This study was developed based on the hypothesis that vulnerability to air raids can be modelled in a similar way to vulnerability to earthquakes. Accordingly, no specific criterion relating to explosions was incorporated into the study. Other limitations of the study were that the model was developed based on certainty conditions (no inclusion of uncertainty factors) and there was no sensitivity analysis. Torabi and Mehdi Nezhad [
46] modelled road network vulnerability (among other physical components of cities) in the 6th district of Tehran Municipality, Iran. The Delphi method was used for extraction of criteria, along with the IHWP method for allocating weights to the different criteria. After identifying 11 vulnerability criteria and their corresponding weights, criterion maps were combined using weighted linear combination (WLC) to generate a final vulnerability map. According to the vulnerability map, 8% of road networks were of low vulnerability, 55% had medium vulnerability, and 37% were of high vulnerability. Similarly to the previous study, uncertainty was not considered during the modelling phase and model validation was not performed.
As can be understood from the above paragraphs, existing research is mainly focused on single-point blast events, with a special focus on critical infrastructures such as railways and street networks, and less attention has been paid to structures at a relatively large scale (for instance at a district level). Blast-hazard risk management and mitigation in urban areas warrants further investigation. The present study builds on existing research by demonstrating how GIS-based MCDA can be used to estimate vulnerability at the district level to intentional explosion hazards. Fuzzy sets theory is utilized to take account of uncertainty conditions in the decision-making process. Compared to existing research, this study uses a more comprehensive list of vulnerability criteria. In this study, vulnerability maps were generated for different risk conditions (varying from the most optimistic to the most pessimistic scenario). However, most existing studies produced only a single vulnerability map as output. The main advantage of modelling under different risk conditions is gaining knowledge about the minimum and maximum vulnerability of buildings. In fact, this information is essential for risk management which is an integral part of urban crisis management [
26]. Therefore, the final outcome of this study is a series of vulnerability maps for addressing one of the needs of urban planners and managers in achieving sustainable development. In addition to vulnerability maps, the main causes of vulnerability and some solutions to the problem of reducing vulnerability are presented in this study. This is in contrast to most research which mainly focuses on producing vulnerability maps and pays less attention to the reasons behind vulnerabilities and approaches for alleviating these issues. The authors of the present study attempted mainly to identify vulnerability criteria and to weight them using experts’ opinions. By identifying these criteria and their weights, vulnerability maps were generated using GIS and MCDM techniques for different risk conditions. A sensitivity analysis was finally performed as a means of validating the model.
The paper proceeds with a detailed description of the study area in
Section 2, and the methodology and research framework in
Section 3. The results of the study are presented and discussed in
Section 4. The results of the sensitivity analysis are given in
Section 5. The paper concludes with notes on the possible implications of the study and suggestions for future research.
3. Methodology
There are several models for evaluating vulnerabilities that can be generally classified into the two categories of data-driven and knowledge-driven models [
48]. In data-driven models, by analyzing the existing data, a vulnerability model can be developed. Therefore, such models are practicable when a history of the data related to vulnerability is available. The most widely used data-driven models and techniques are neural networks, fuzzy rule-based systems, and genetic algorithm-based modelling [
49]. Among the most common data-driven vulnerability models are seismic vulnerability models, which benefit from the presence of numerous seismic centers in many parts of the world that continually monitor and record earthquakes. Therefore, a large database of earthquake information (such as location, time, and magnitude of earthquakes) is always available. Since a history of explosion data is not available in the study area, data-driven models have not been used in the present study.
On the other hand, knowledge-driven models are of special importance when there are not enough data available for modelling and a model is designed based on existing knowledge and experts’ opinions. This type of model is therefore suitable for the present study. In the present research, physical vulnerability modelling of urban buildings with respect to explosion hazards is considered, with the assumption that explosion data (such as location, time, and vulnerability) are not available for the study area, and therefore, the modelling must be carried out using the knowledge and opinions of experts. Considering that vulnerability is a multi-criteria function, multi-criteria analysis models based on knowledge and experts’ opinions are used in this research. The model was designed and developed according to the characteristics of the study area using experts’ opinions. In addition, during the design of the model, content from the National Building Regulations, which were considered to be the basis for designing and building the studied buildings, was used. The main concern of the researchers in this study was firstly to identify the criteria influencing the vulnerability of buildings with respect to explosion; secondly, to classify these criteria based on the degree of vulnerability; and thirdly, to consider the relative importance of the criteria to one another. By identifying the criteria and their weights, MCDM techniques were used to determine the final vulnerability. The purpose of this study was not to propose or develop a MCDM technique, but rather to use existing MCDM techniques to develop a vulnerability assessment model. MCDM models are generally divided into multi attribute decision making (MADM) and multi objective decision making (MODM) types [
50]. The present study makes use of MADM models, since the alternatives relating to multi-criteria evaluation (of buildings) have been explicitly specified.
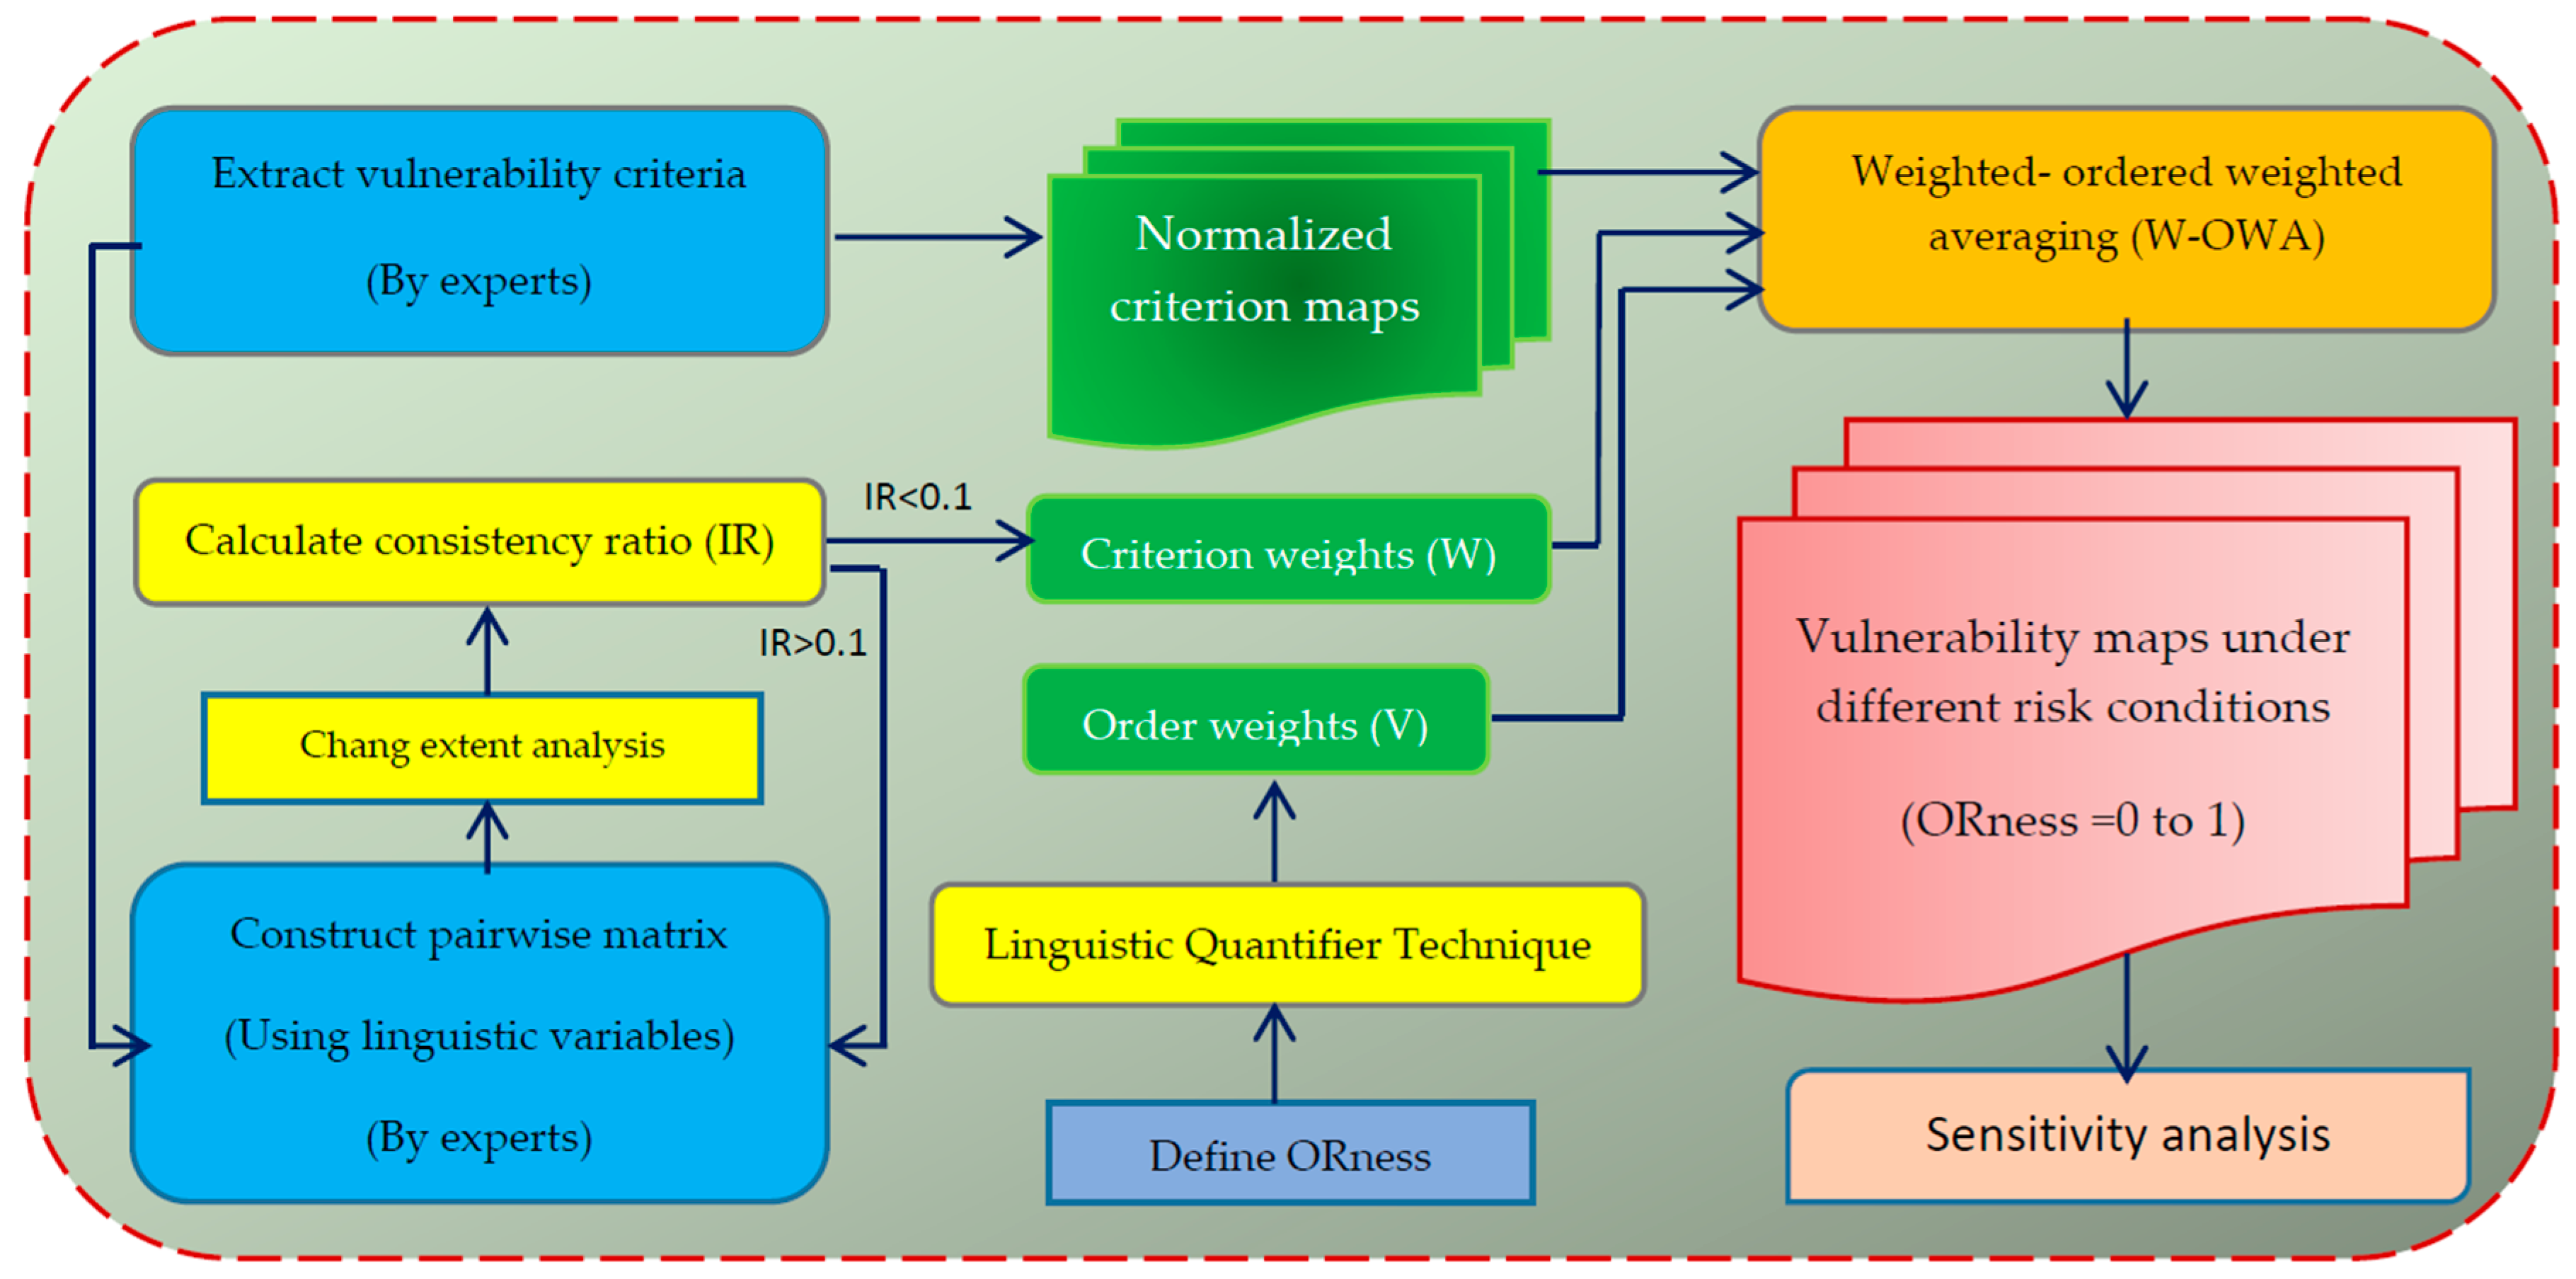
The overall research framework is illustrated in
Figure 2. The first step in the modelling is the extraction of vulnerability criteria. Following this, standard criterion maps were generated and normalized. These standard maps were produced at a scale of 1:2000 (using existing urban cadastral maps at the same scale) and they illustrate the vulnerability of buildings in the study area against each of the vulnerability criteria.
This study identified various criteria and their relative importance with respect to one another by using experts’ opinions. It is obvious that if a different set of experts had been used, the quantitative results may have differed slightly. Changes in the results could be owing to uncertainty in the experts’ opinions, which, in turn, could be due to the use of the linguistic variables used to draw out those opinions. To manage such uncertainties, fuzzy sets theory was applied [
22]. However, this also has some deficiencies, for instance, in terms of expressing the membership degree with a real number. To address this issue, type-2 fuzzy sets or intuitionistic fuzzy sets can be used [
51].
Calculation of the weights of the criteria was performed by extracting the experts’ opinions and conducting a pairwise comparison. A number of methods exist for assigning weights to criteria such as ranking, rating, pairwise comparison, and trade-off analysis [
52]. Considering the large number of criteria in this study, it was not possible to compare all the criteria simultaneously. Therefore, their relative importance could only be found using pairwise comparison methods. One of the most popular weighting methods based on pairwise comparison is the AHP method. This study used the Chang extent analysis (CEA) method, which is a fuzzy analytic hierarchy process (fuzzy AHP). There are a number of reasons justifying the use of this method, including the low complexity of the structure of the vulnerability criteria in this study and the high accuracy of the technique [
53]. It is also possible to calculate the consistency ratio using this method. Another reason for using this method was the fact that it is able to simultaneously compare qualitative and quantitative criteria. In addition, the calculated weights in this method are no longer fuzzy numbers, and therefore do not need any further processing for defuzzification. Buckley’s geometric averaging can be a suitable substitute for the CEA if trapezoidal fuzzy numbers are used instead of triangular fuzzy numbers [
54]. If the criterion structure is more complex, the use of a fuzzy analytic network process (fuzzy ANP) is recommended.
Given the criteria and their weights, the vulnerability map can be generated by the weighted combination of criterion maps. There are several methods for providing a decision rule for combining criterion maps (such as WLC, TOPSIS, VIKOR, ELECTRE, PROMETHEE, DEMATEL, etc.). In this study, the OWA method has been used. The reason for using the OWA method is its ability to generate vulnerability maps under different risk conditions, while other existing methods can only produce a single vulnerability map. Generating vulnerability maps for different risk conditions can be beneficial in many applications of crisis management and urban planning in order to achieve sustainable development, which is also the main objective of this research.
Sensitivity analysis was used for validation and robustness-checking of results. Sensitivity analysis is an integral part of MCDM and is used in many models whose efficiency has been well confirmed [
55]. Other methods, such as error propagation analysis and Monte Carlo simulation, can also be used instead of sensitivity analysis. All the steps and methods of the research are given in more detail below.
3.1. Expert Survey for Extracting Vulnerability Criteria
In this study, the vulnerability criteria were derived based on a literature review and on experts’ opinions. Accordingly, a report of the previous studies was prepared by the authors and given to experts to evaluate, improve, and complete. All the selected experts had prior knowledge and experience related to the study theme. General information about the experts is provided in
Table 2.
In the extraction stage of the multi-criteria decision making, a number of principles have been followed. These principles are that the criteria used should be: complete, operational, decomposable, non-redundant, and minimal [
55]. Finally, 14 vulnerability criteria were extracted, as shown in
Table 3.
Since in most intentional man-made disasters the targets are predefined and prioritized, the “degree of importance” is the most important criterion. This criterion implies that the potential targets of intentional attacks are often prioritized according to their socio-economic and/or political importance. In this study, depending on their “degree of importance”, buildings are divided into five main categories, namely, critical, sensitive, important, of low importance, and of very low importance. Examples of facilities falling under each category are shown in
Table 4. This classification has been made according to the stipulations of the national building regulations.
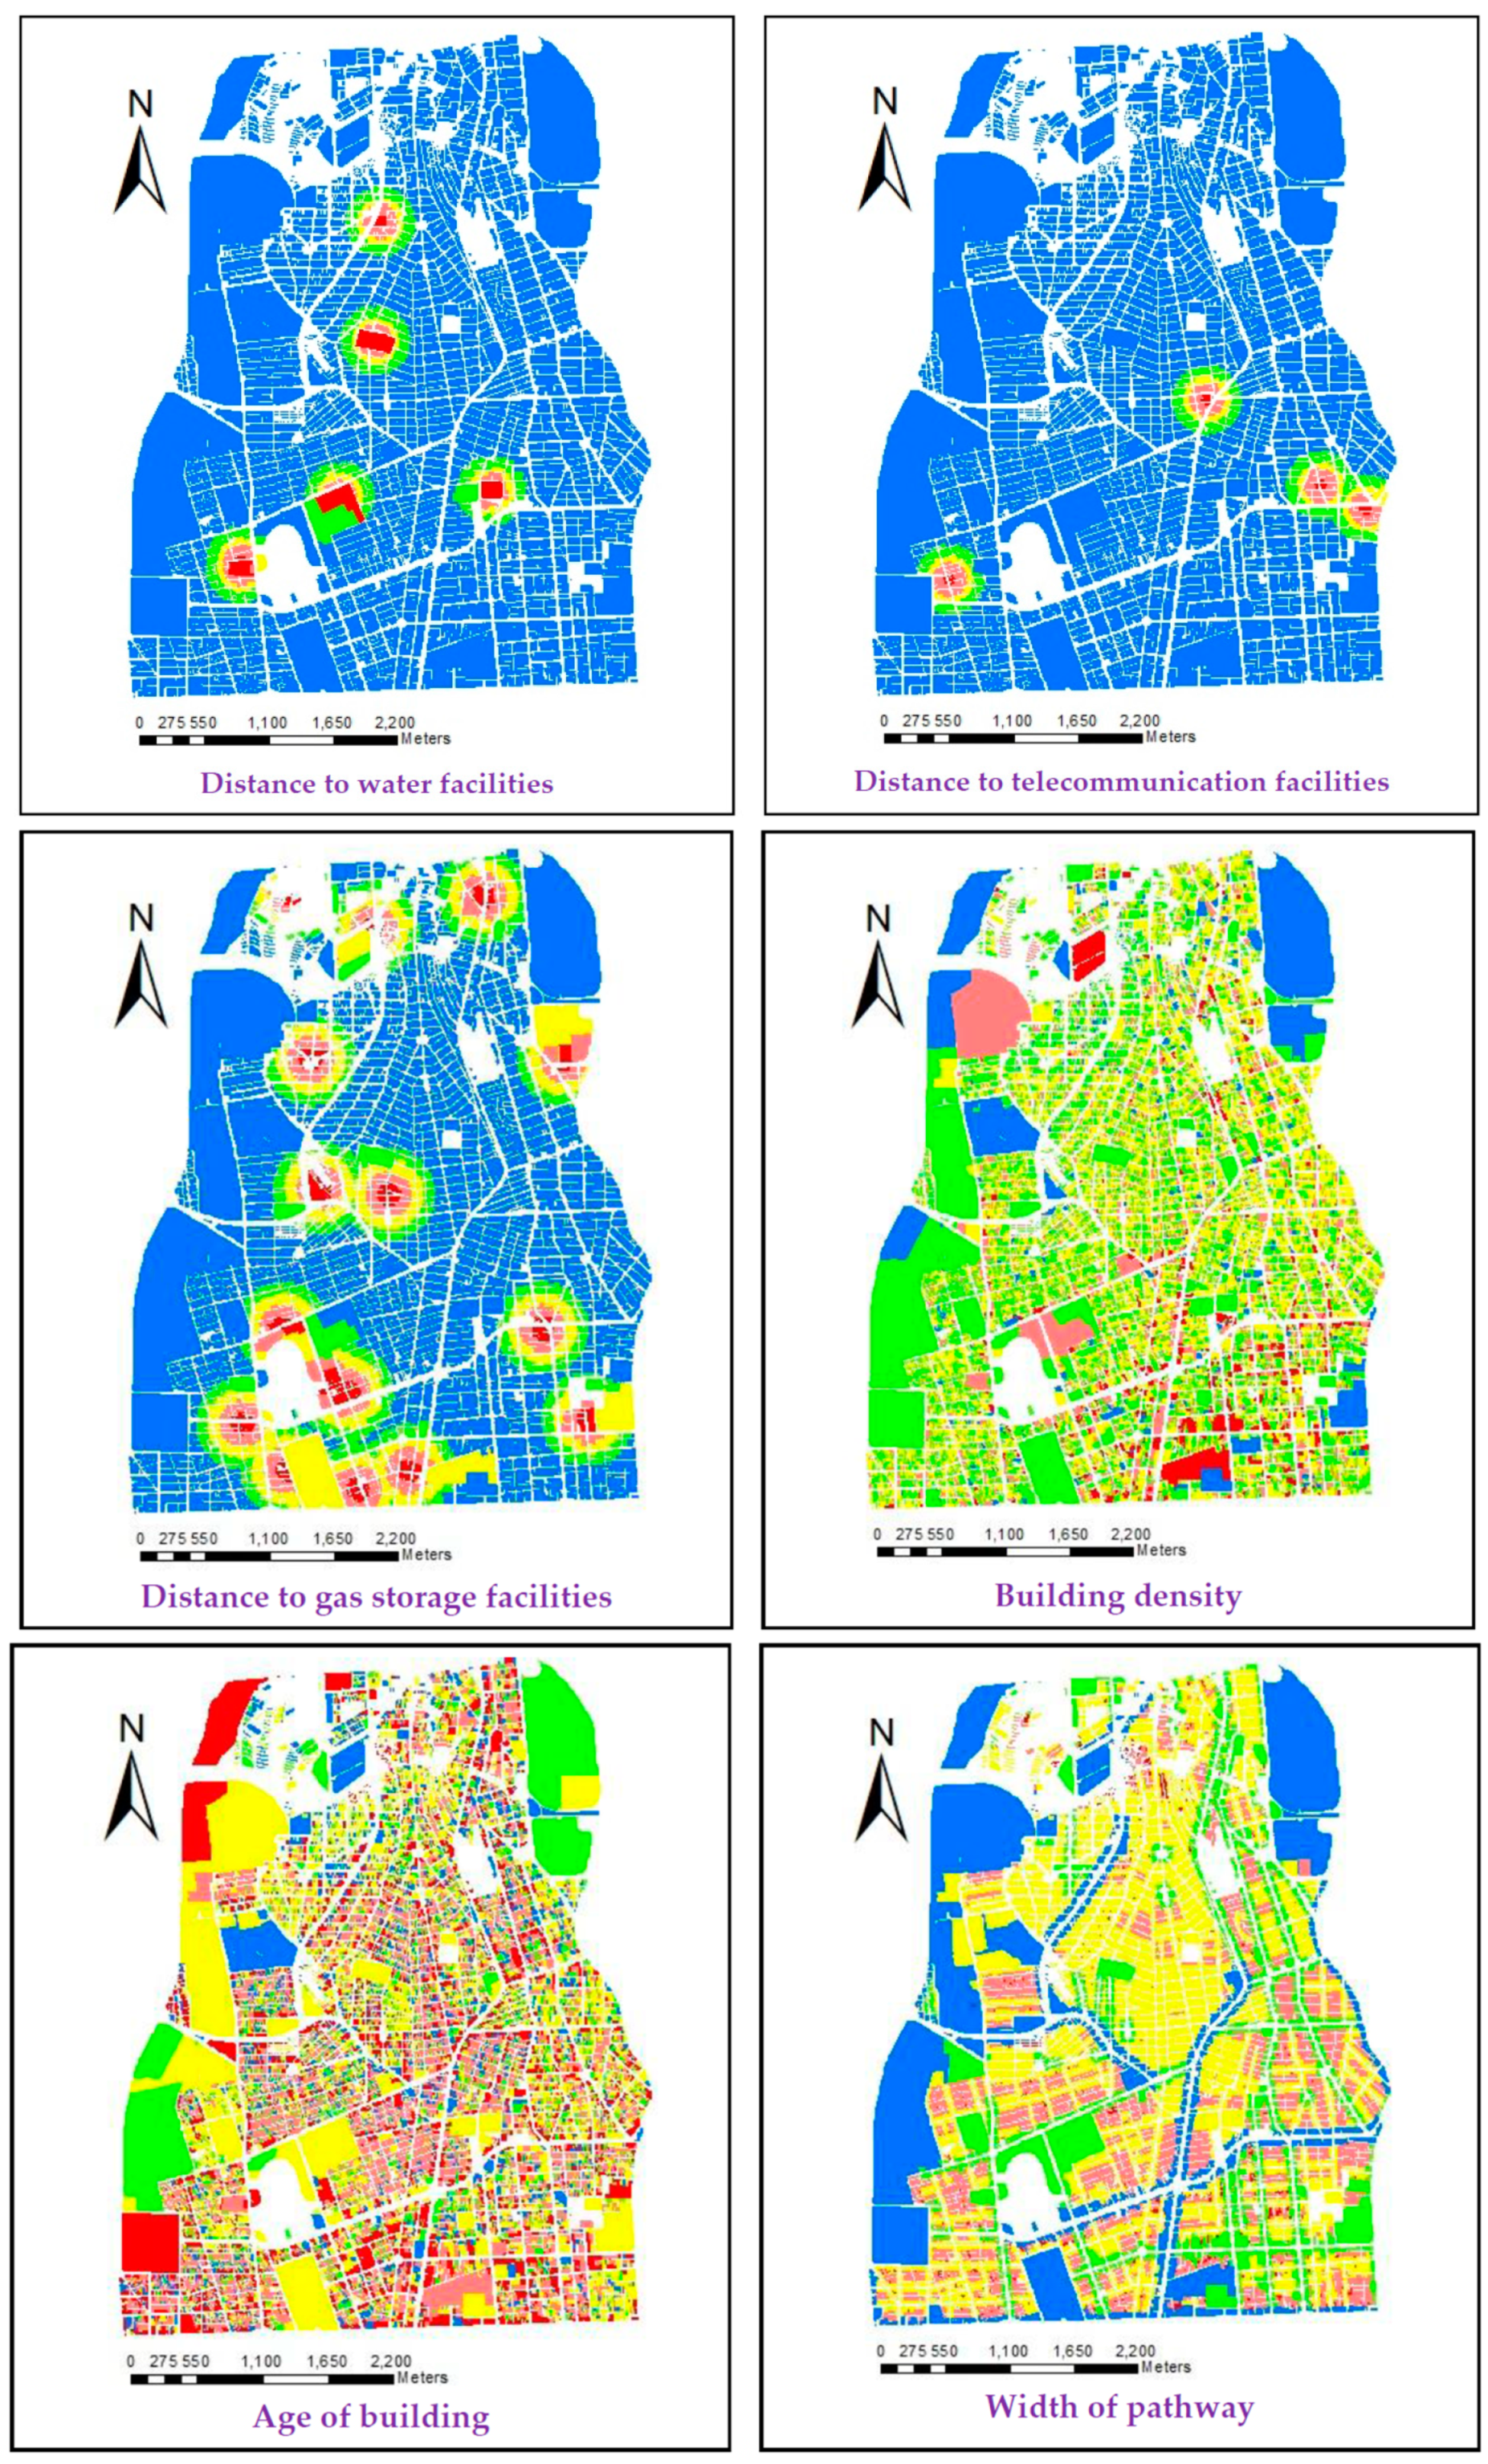
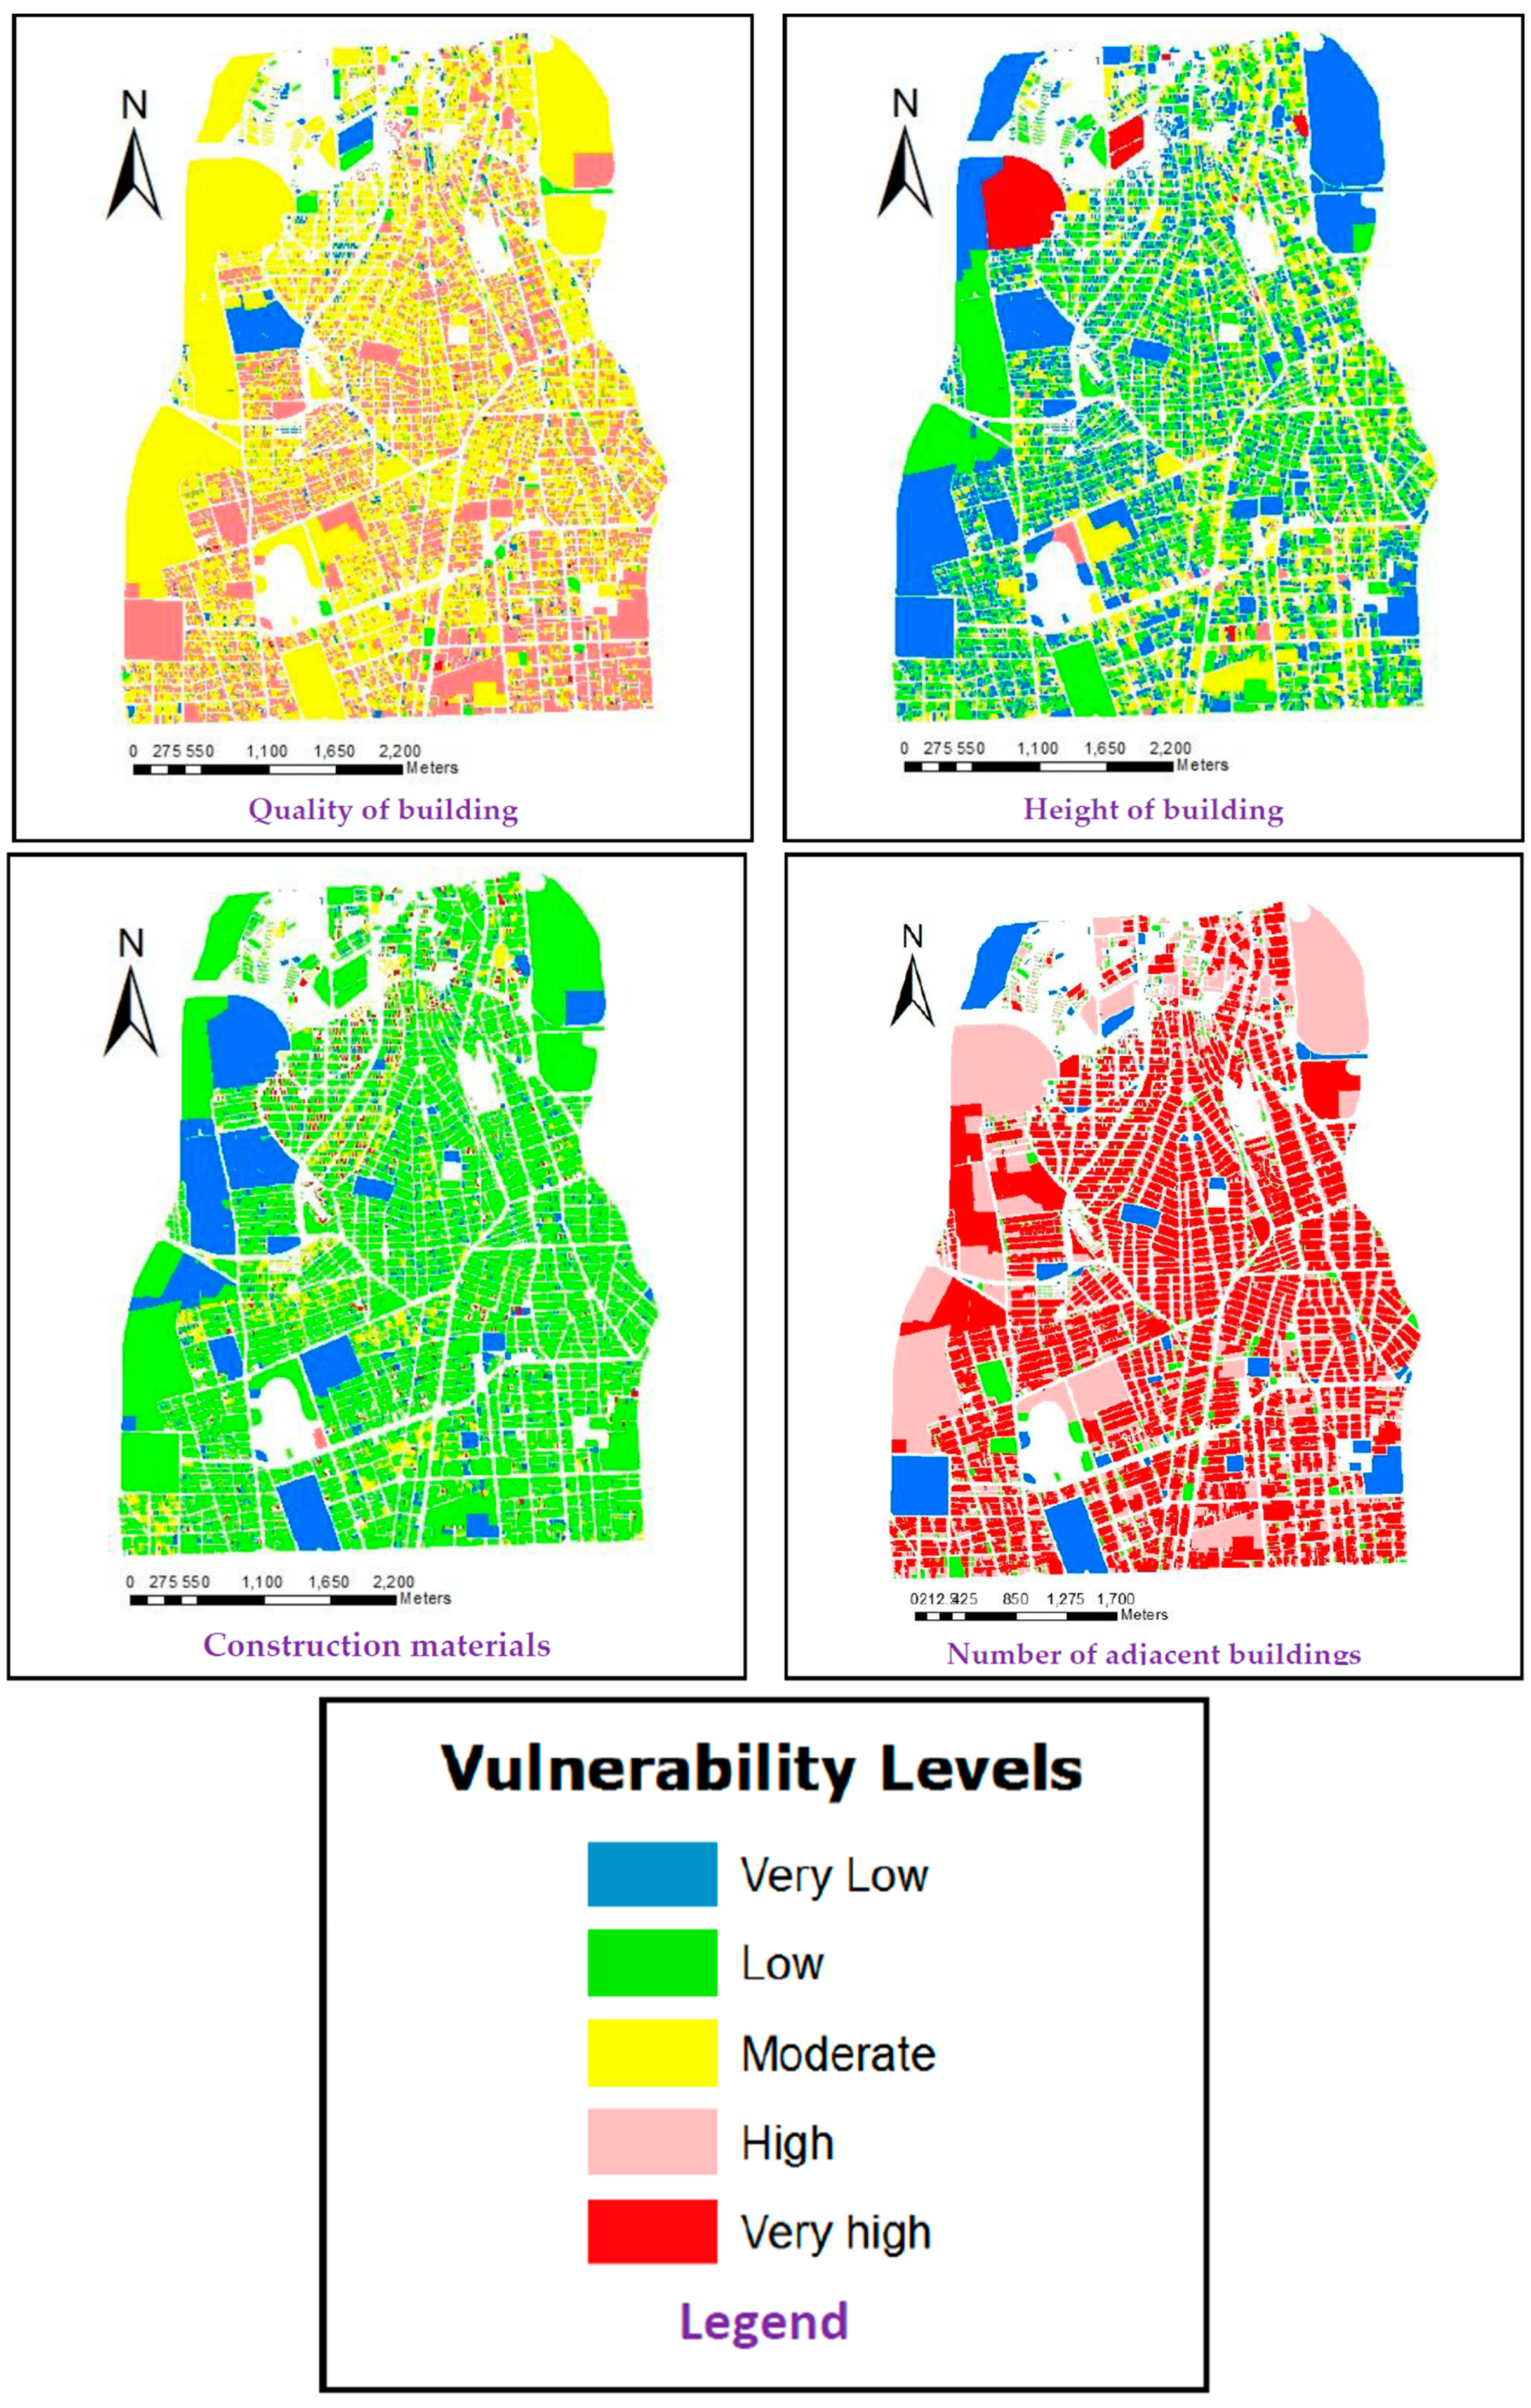
3.2. Generating Criterion Maps
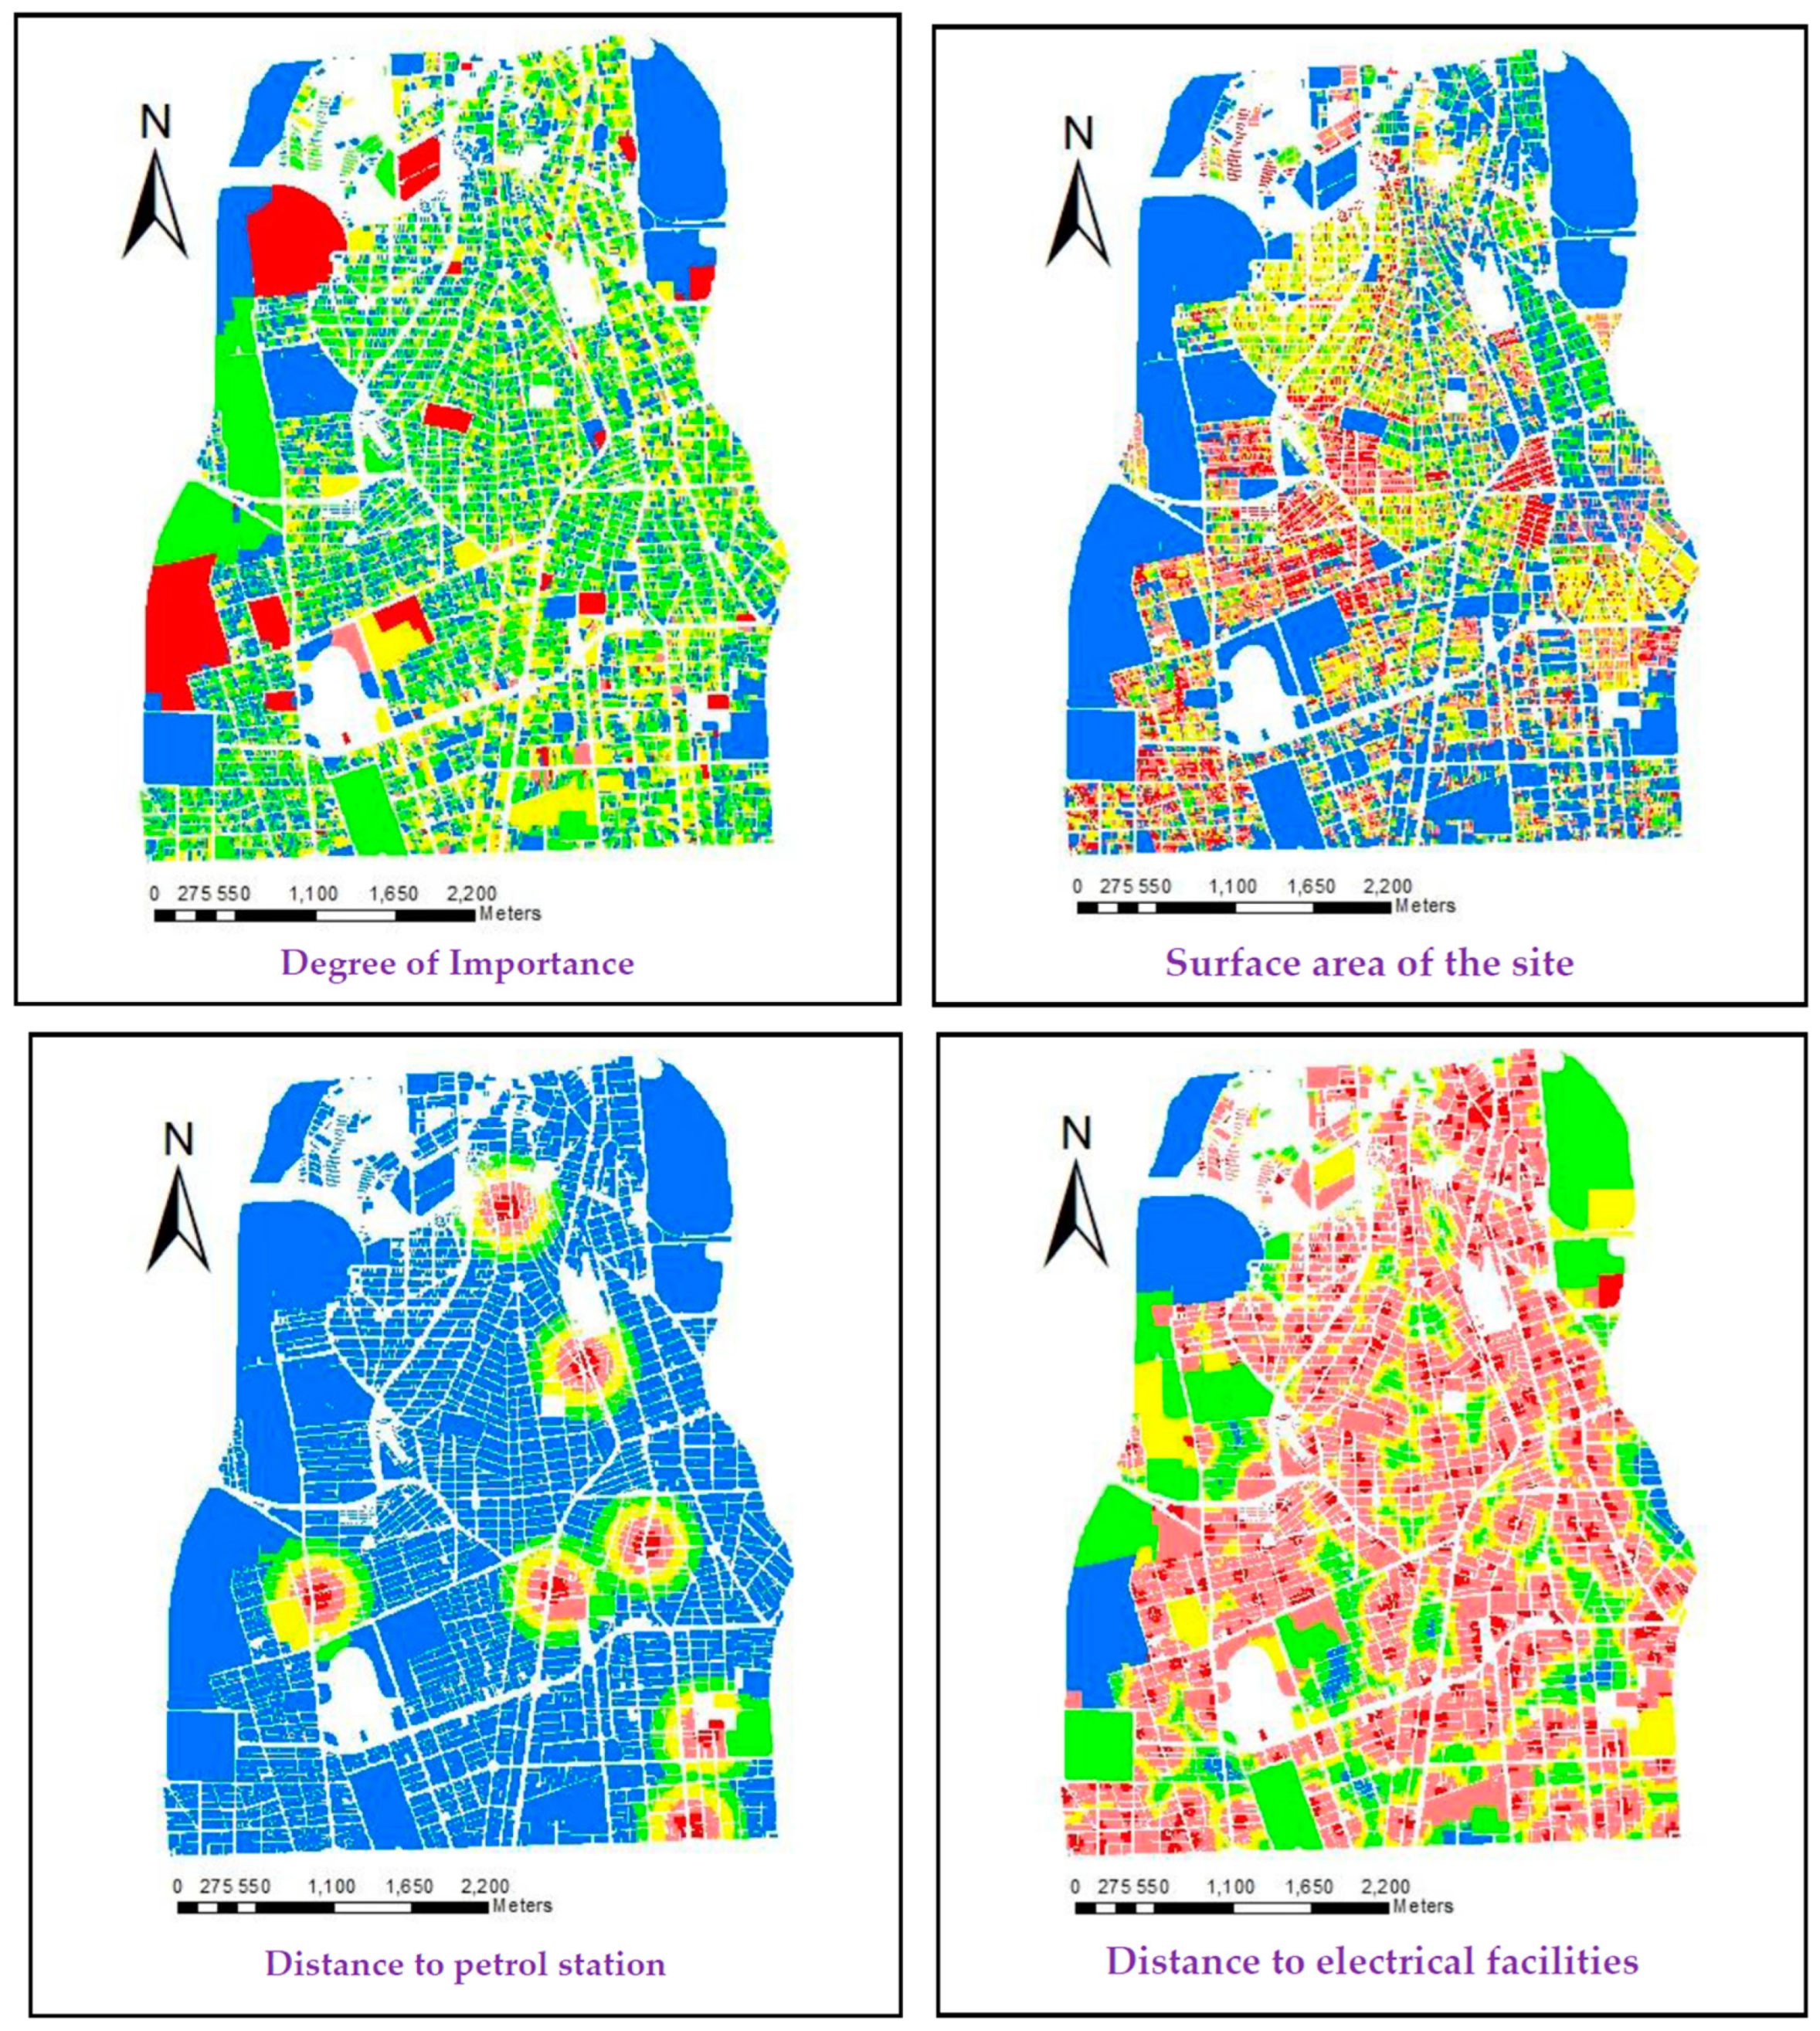
Criterion maps in this study are the maps indicating the vulnerability of buildings in the district against each vulnerability criterion (
Figure 3). Each criterion map contains 28,228 building units generated from maps at a scale of 1:2000. Since the qualitative and quantitative criteria used in this study are measured on different scales, all the criterion maps were normalized, and the degree of vulnerability of buildings (against each criterion) is shown by a real number that falls within a fixed range between zero and one.
Various methods exist for normalizing vulnerability maps, for example, linear scale transformation, the value function approach, the utility function approach, the probabilistic approach, revised probabilistic and fuzzy set membership [
55]. Given that no special function was used for the normalization of the data and also that no probabilistic methods were used for modelling in the present study, the method of linear scale transformation was used as the simplest normalization method. The min-max scaling method was used for the purpose of normalization via the following equation:
For the purpose of illustration, the criterion maps are generated for five different degrees of vulnerability, ranging from ‘very low’ (0 to 0.2) to ‘very high’ (0.8 to 1). All maps were generated using ESRI’s ArcGIS 10.3 software (Esri, Redland, CA, USA).
3.3. Weighting Criteria
In this study, pairwise comparison of the criteria using the experts’ opinions is used for assigning weights (Table 6). As a result of using this method, uncertainties associated with the subjective judgements of the experts are involved and should be considered in the calculations. The experts used linguistic variables for pairwise comparison of criteria and for expressing their preference for (the importance of) one criterion over another, and this procedure is associated with uncertainties. The uncertainties caused by linguistic variables are handled using fuzzy logic [
22]. As mentioned, in this study Chang’s extent analysis, which is one type of fuzzy analytical hierarchy process (AHP) method, is used.
The linguistic variables and their corresponding triangular fuzzy numbers are shown in
Table 5. In
Table 6, which shows the matrix of pairwise comparisons, verbal variables are shown with numbers from
to
in order to save space.
According to Wang et al. [
57], Chang’s extent analysis, whose final outputs are the relative weights of criteria, has five basic steps as follows:
- Step 1:
Formation of a pairwise comparison matrix with triangular fuzzy numbers
(where n is the number of criteria)
- Step 2:
Calculating the fuzzy synthetic geometric mean of each criterion using the following equation for
(where
i and
j are the number of rows and columns, respectively)
In Chang’s extent analysis, if two triangular numbers
and
are considered, mathematical operators are defined as
It should be noted that the product of two triangular fuzzy numbers or the reverse of a triangular fuzzy number is not a triangular fuzzy number. These equations show an approximation of the actual product of two triangular fuzzy numbers and the inverse of a triangular fuzzy number. Thus,
will be calculated as
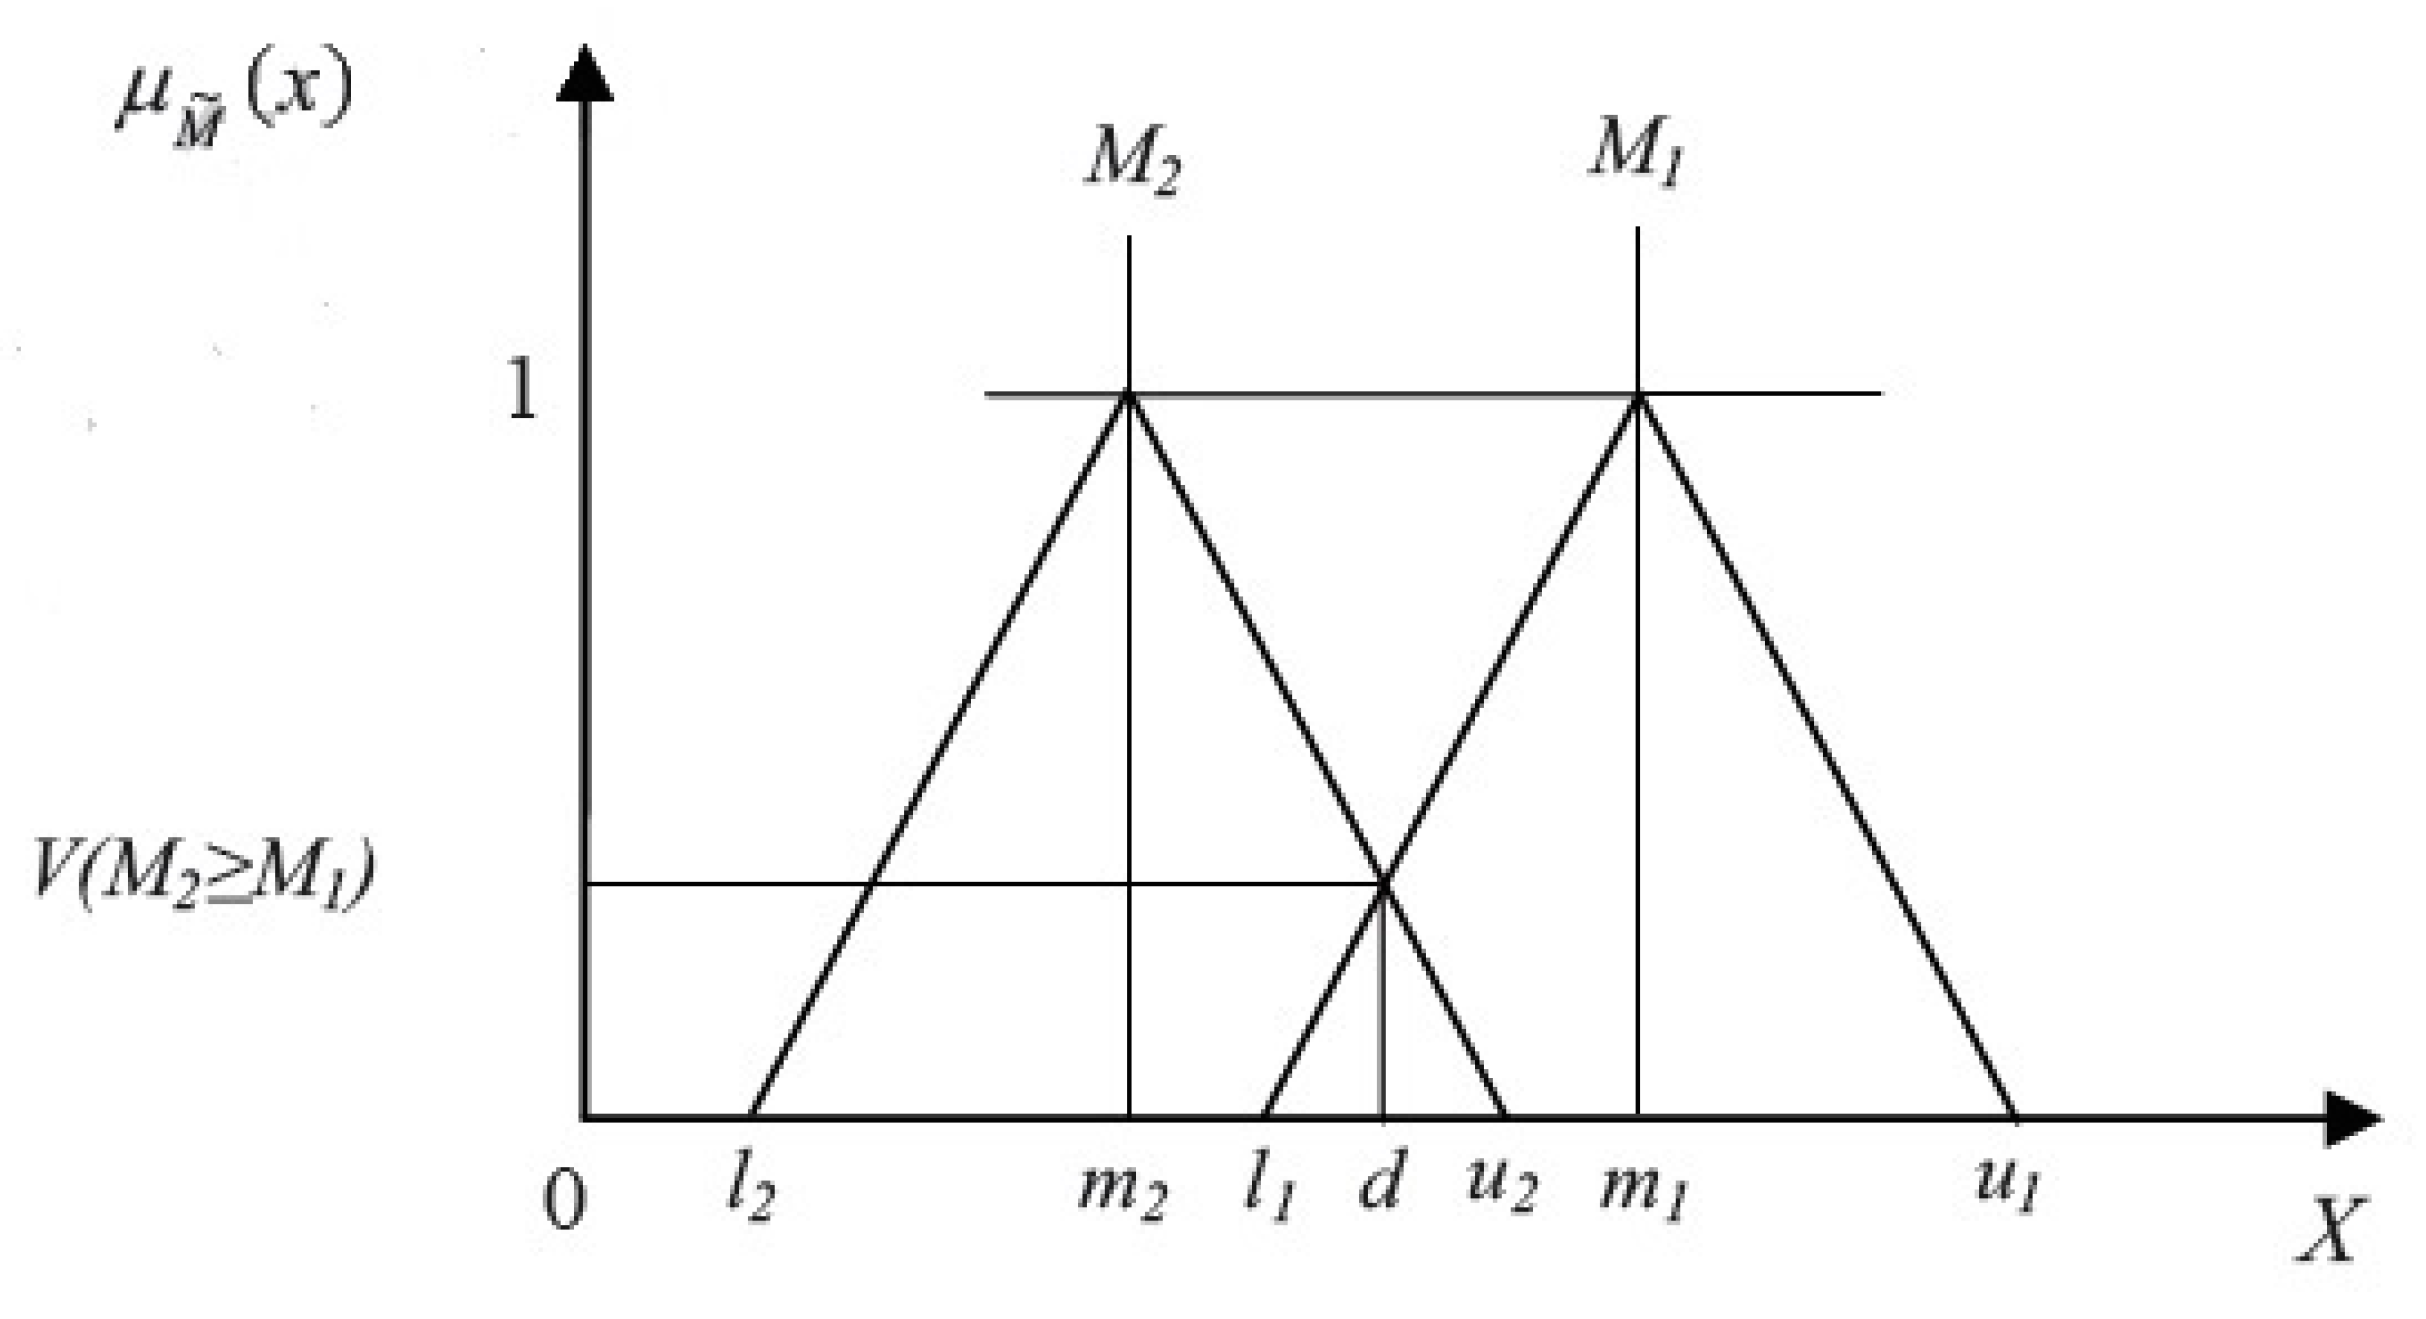
- Step 3:
Calculating the magnitudes or priorities of
with respect to each other (
), according to the equation
This value is obtained for triangular fuzzy numbers from the equation
In this equation,
d represents the coordinates of the highest point of intersection between
and
as shown in
Figure 4 and its value is derived from the equation
- Step 4:
Calculating the magnitude of each
compared to
, that can be calculated for
k fuzzy numbers through the equation
The weight vector is obtained using the equation
where
- Step 5:
At this stage, the calculated weights should be normalized using the equation
It should be noted that one of the most important steps in AHP and fuzzy AHP is calculating the consistency ratio of the pairwise comparison matrix. This rate is also calculated in this study. Various methods have been proposed for calculating the consistency ratio in fuzzy AHP. One method is defuzzification of pairwise comparison matrix elements using one of the available methods and calculation of the consistency ration with the classic method [
58]. In this case, a consistency ratio lower than 0.1 shows acceptable pairwise comparison with respect to the experts, (i.e., the experts’ opinions have acceptable consistency with each other) [
59]. Various methods have been presented for defuzzification of fuzzy numbers. In this study, defuzzification of the center of gravity has been used. The best non-fuzzy performance (BNP) for a triangular fuzzy number
is achieved by a defuzzification process using the center of gravity, calculated using the equation [
60]
After defuzzification of the pair-wise comparison matrix (
M), the consistency ratio can be calculated. Initially, using Equations (17) and (18), the eigenvector
of the pairwise matrix is calculated.
By identifying the eigenvector and using its maximum value
, the consistency index and the consistency ratio can be determined using Equations (19) and (20).
where
n is the number of criteria, i.e., 14.
Table 7 gives the RI (random index) for different values of
n.
All calculations in this research have been performed using MATLAB 8.1 (MathWorks, Natick, MA, USA) and Microsoft Excel software (Microsoft, Redmond, WA, USA). The final weights of criteria are shown in
Table 6. Moreover, a consistency ratio of 0.039 is obtained, indicating acceptable consistency of the experts’ opinions.
3.4. Combination of Criterion Maps
When the generation of criterion maps is completed, a suitable decision rule should be used to combine the maps and develop the eventual vulnerability map. Weighted linear combination (WLC) is the simplest combination operator which functions under moderate risk conditions (neutral conditions) and provides the maximum balance between the criteria [
36]. However, since the objective here is to generate different vulnerability maps under different risk conditions, weighted-ordered weighted averaging (W-OWA) is used for combining the criterion maps. The W-OWA method involves using two types of weights: ‘criterion weights’ which were calculated in the previous section and ‘order weights’ which are exclusive to the OWA operator [
62]. The main difference between criterion weights (
w) and order weights (
v) is that the former weights are identical for all the features available in a given layer, (i.e., buildings in this study), while the latter vary for different features that exist in a given layer. Criterion maps are obtained by pairwise comparison between the criteria and remain constant under different risk conditions. However, order weights vary depending on the risk-taking or risk-avoiding behavior of the decision maker [
63]. Therefore, it is the order weights which lead to the generation of different vulnerability maps under different risk conditions. These two types of weights (criterion and order) sum to unity as shown by the equation
In Equation (17), n indicates the number of criteria, i.e., 14 in this study. In the following sections, the OWA operator, methods for calculating the ordered weight vector and the W-OWA operator are explained.
3.4.1. OWA Operator
OWA was introduced by Yager in 1988. It is an aggregation operator
F with a weighting vector (
v), such that the following equation holds for the components of an input dataset
[
64]:
where
bi is the
i-th largest value in the dataset
X that is sorted in a descending order and
Vi is the
i-th element of the ordered weight vector of the OWA operator. Two characteristics are used for explaining the behavior of the OWA operators: (1) the degree of ORness (or risk-taking) and (2) the extent of trade-offs between the criteria. The degree of ORness shows the position of the OWA operator between AND (min) and OR (max) operators. This degree is used to understand how much emphasis is put on higher (better) or lower (worse) values of a set of criteria by decision makers. In other words, it is used to understand the extent to which decision makers tend to be optimistic or pessimistic. The degree of ORness is defined using the equation [
64]
Higher values of ORness indicate that the decision maker is more risk-taking or optimistic and lower values mean that the decision maker is more pessimistic or risk-avoiding. Generally, ORness values higher than 0.5 imply that the decision maker tends to be optimistic or a risk taker, an ORness value equal to 0.5 indicates the neutrality of the decision maker and ORness values lower than 0.5 mean that the decision maker tends to be pessimistic or a risk avoider. The closer the behavior of the OWA operator is to that of the OR (or max) operator, the closer is its ORness to unity. However, if the behavior of this operator is closer to that of the AND (or min) operator, its ORness is closer to zero. Therefore, considering
as the weight vector of the AND operator,
as the weight vector of the OR operator and
as the weight vector of the weighted linear combination (WLC) operator, we obtain
ORness can also be calculated as ANDness = 1 − ORness.
The degree of trade-off between the criteria is the second characteristic associated with the OWA operator. Trade-off refers to the interaction between the criteria and the extent to which they affect one another. It can be defined using the equation [
64]
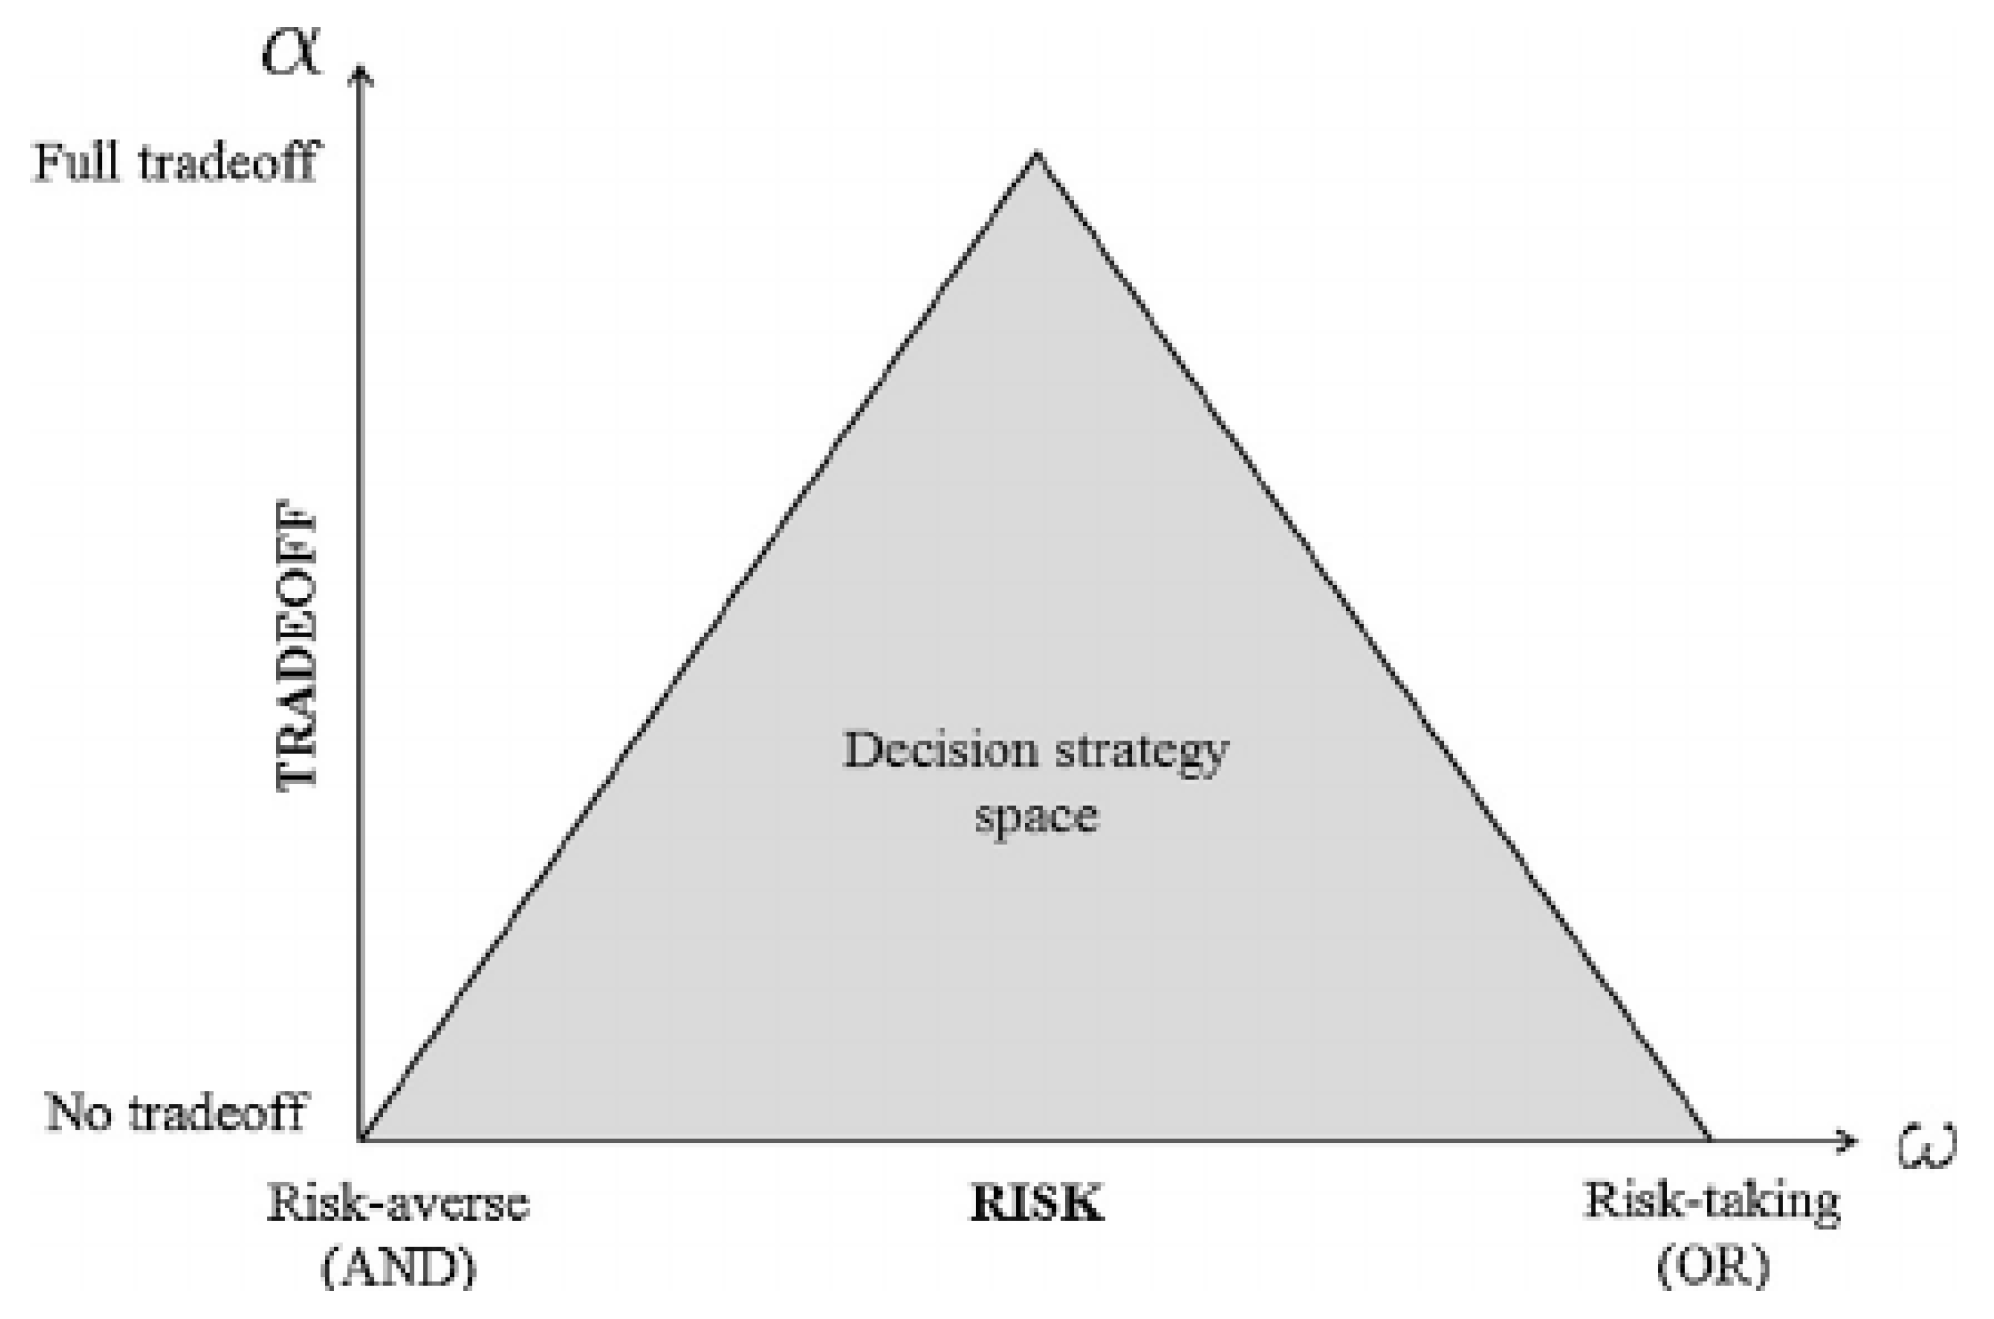
A broad range of trade-off and risk conditions can be identified regarding the two main attributes of the OWA operator. A vulnerability map can also be produced for each of these two characteristics. As
Figure 5 shows, this wide range is situated within a triangular decision strategy space (
Figure 5).
As can be seen in
Figure 5, minimum risk without balance, maximum risk without trade-off, and average risk and maximum trade-off correspond to the AND operator, the OR operator, and the weighted linear combination (WLC) operator, respectively. Therefore, various operators can be generated between the two operators (AND operator and OR operator).
3.4.2. Calculation of Weight Vector of the OWA Operator
When defining the OWA operators, it is essential to calculate the weight vector (
V). Different methods exist for calculating the weight of an OWA operator. Calculation using linguistic quantifiers is used in this paper [
66]
where,
i is the criterion number,
n is number of criteria, and
Q is a linguistic quantifier that reflects the concept of the fuzzy maximum and is used to calculate the ordered weight vector [
66]
Note that, as shown in the equation below,
Q is closely related to the level of optimism [
66]
If
, then ORness (
v) < 0.5. This indicates that the decision maker is risk-avoider or pessimistic. If
, then ORness (
v) = 0.5, indicating the neutrality of the decision maker and if
, then ORness (
v) > 0.5, indicating that the decision maker tends to be a risk-taker or optimistic. Since various levels of optimism exist, a broad range of risk conditions between the AND and OR operators can be defined. For each risk condition, vulnerability under the most pessimistic scenario (AND), the most optimistic scenario (OR), and an infinite number of other scenarios that lie between these two is examined. Linguistic quantifiers and corresponding
parameter and ORness degree are shown in
Table 8.
A broad range of risk scenarios, with different optimism levels can be identified between the AND operator and the OR operator. In addition, vulnerability related to each of these risk scenarios can be evaluated under the most pessimistic scenario (AND), the most optimistic scenario (OR), and an infinite number of other scenarios between these two.
3.4.3. W-OWA Operator
In a multi-criteria analysis, each criterion carries a weight. These weights are called criterion weights and are identical for all features of a specific layer. In the W-OWA operator, in addition to ordered weights which are associated with the OWA operator, criterion weights are employed for aggregation purposes [
68].
where the order
is obtained by arranging the values of each alternative (building) for each of the criteria and
is the criterion weight arranged following the order of
values. As mentioned earlier, the ordered weight vector can be produced using different methods, including the method associated with the linguistic quantifiers explained in the previous section. In this method, proposed by Yager, criterion weights can be used for generating ordered weights using the equation [
68]
Considering the above equations and under the condition
, we obtain the equation
4. Results and Discussions
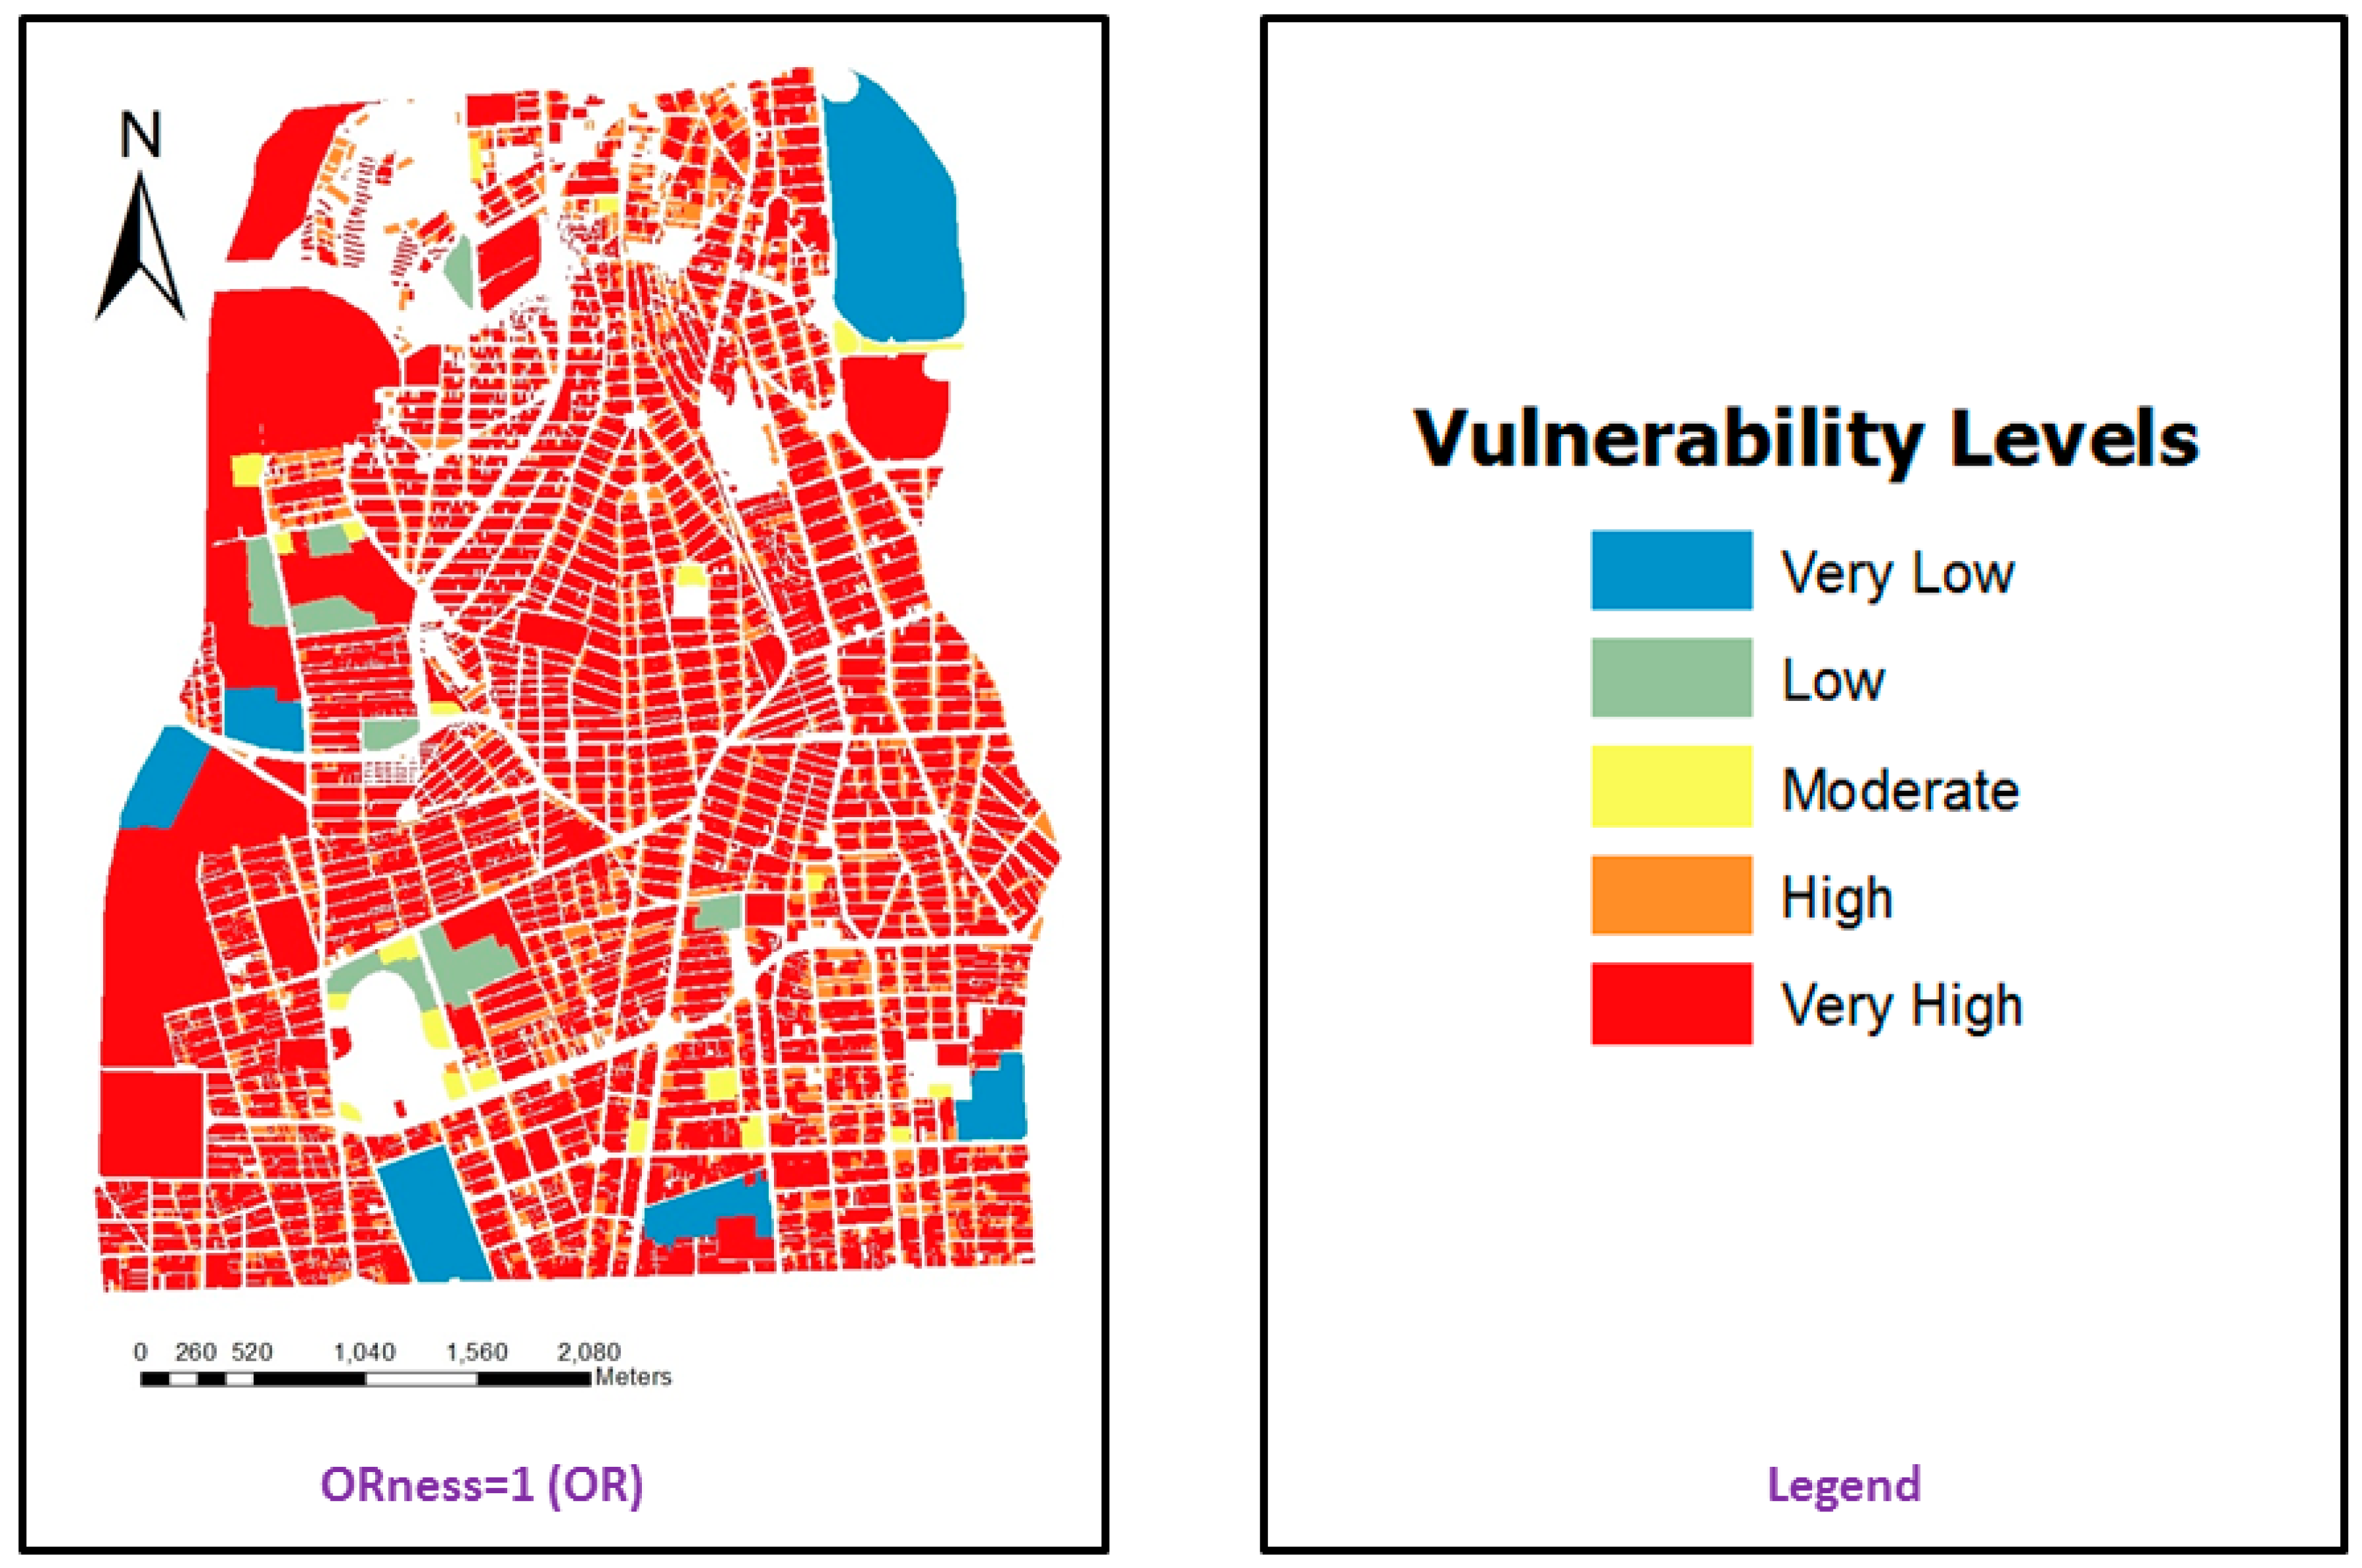
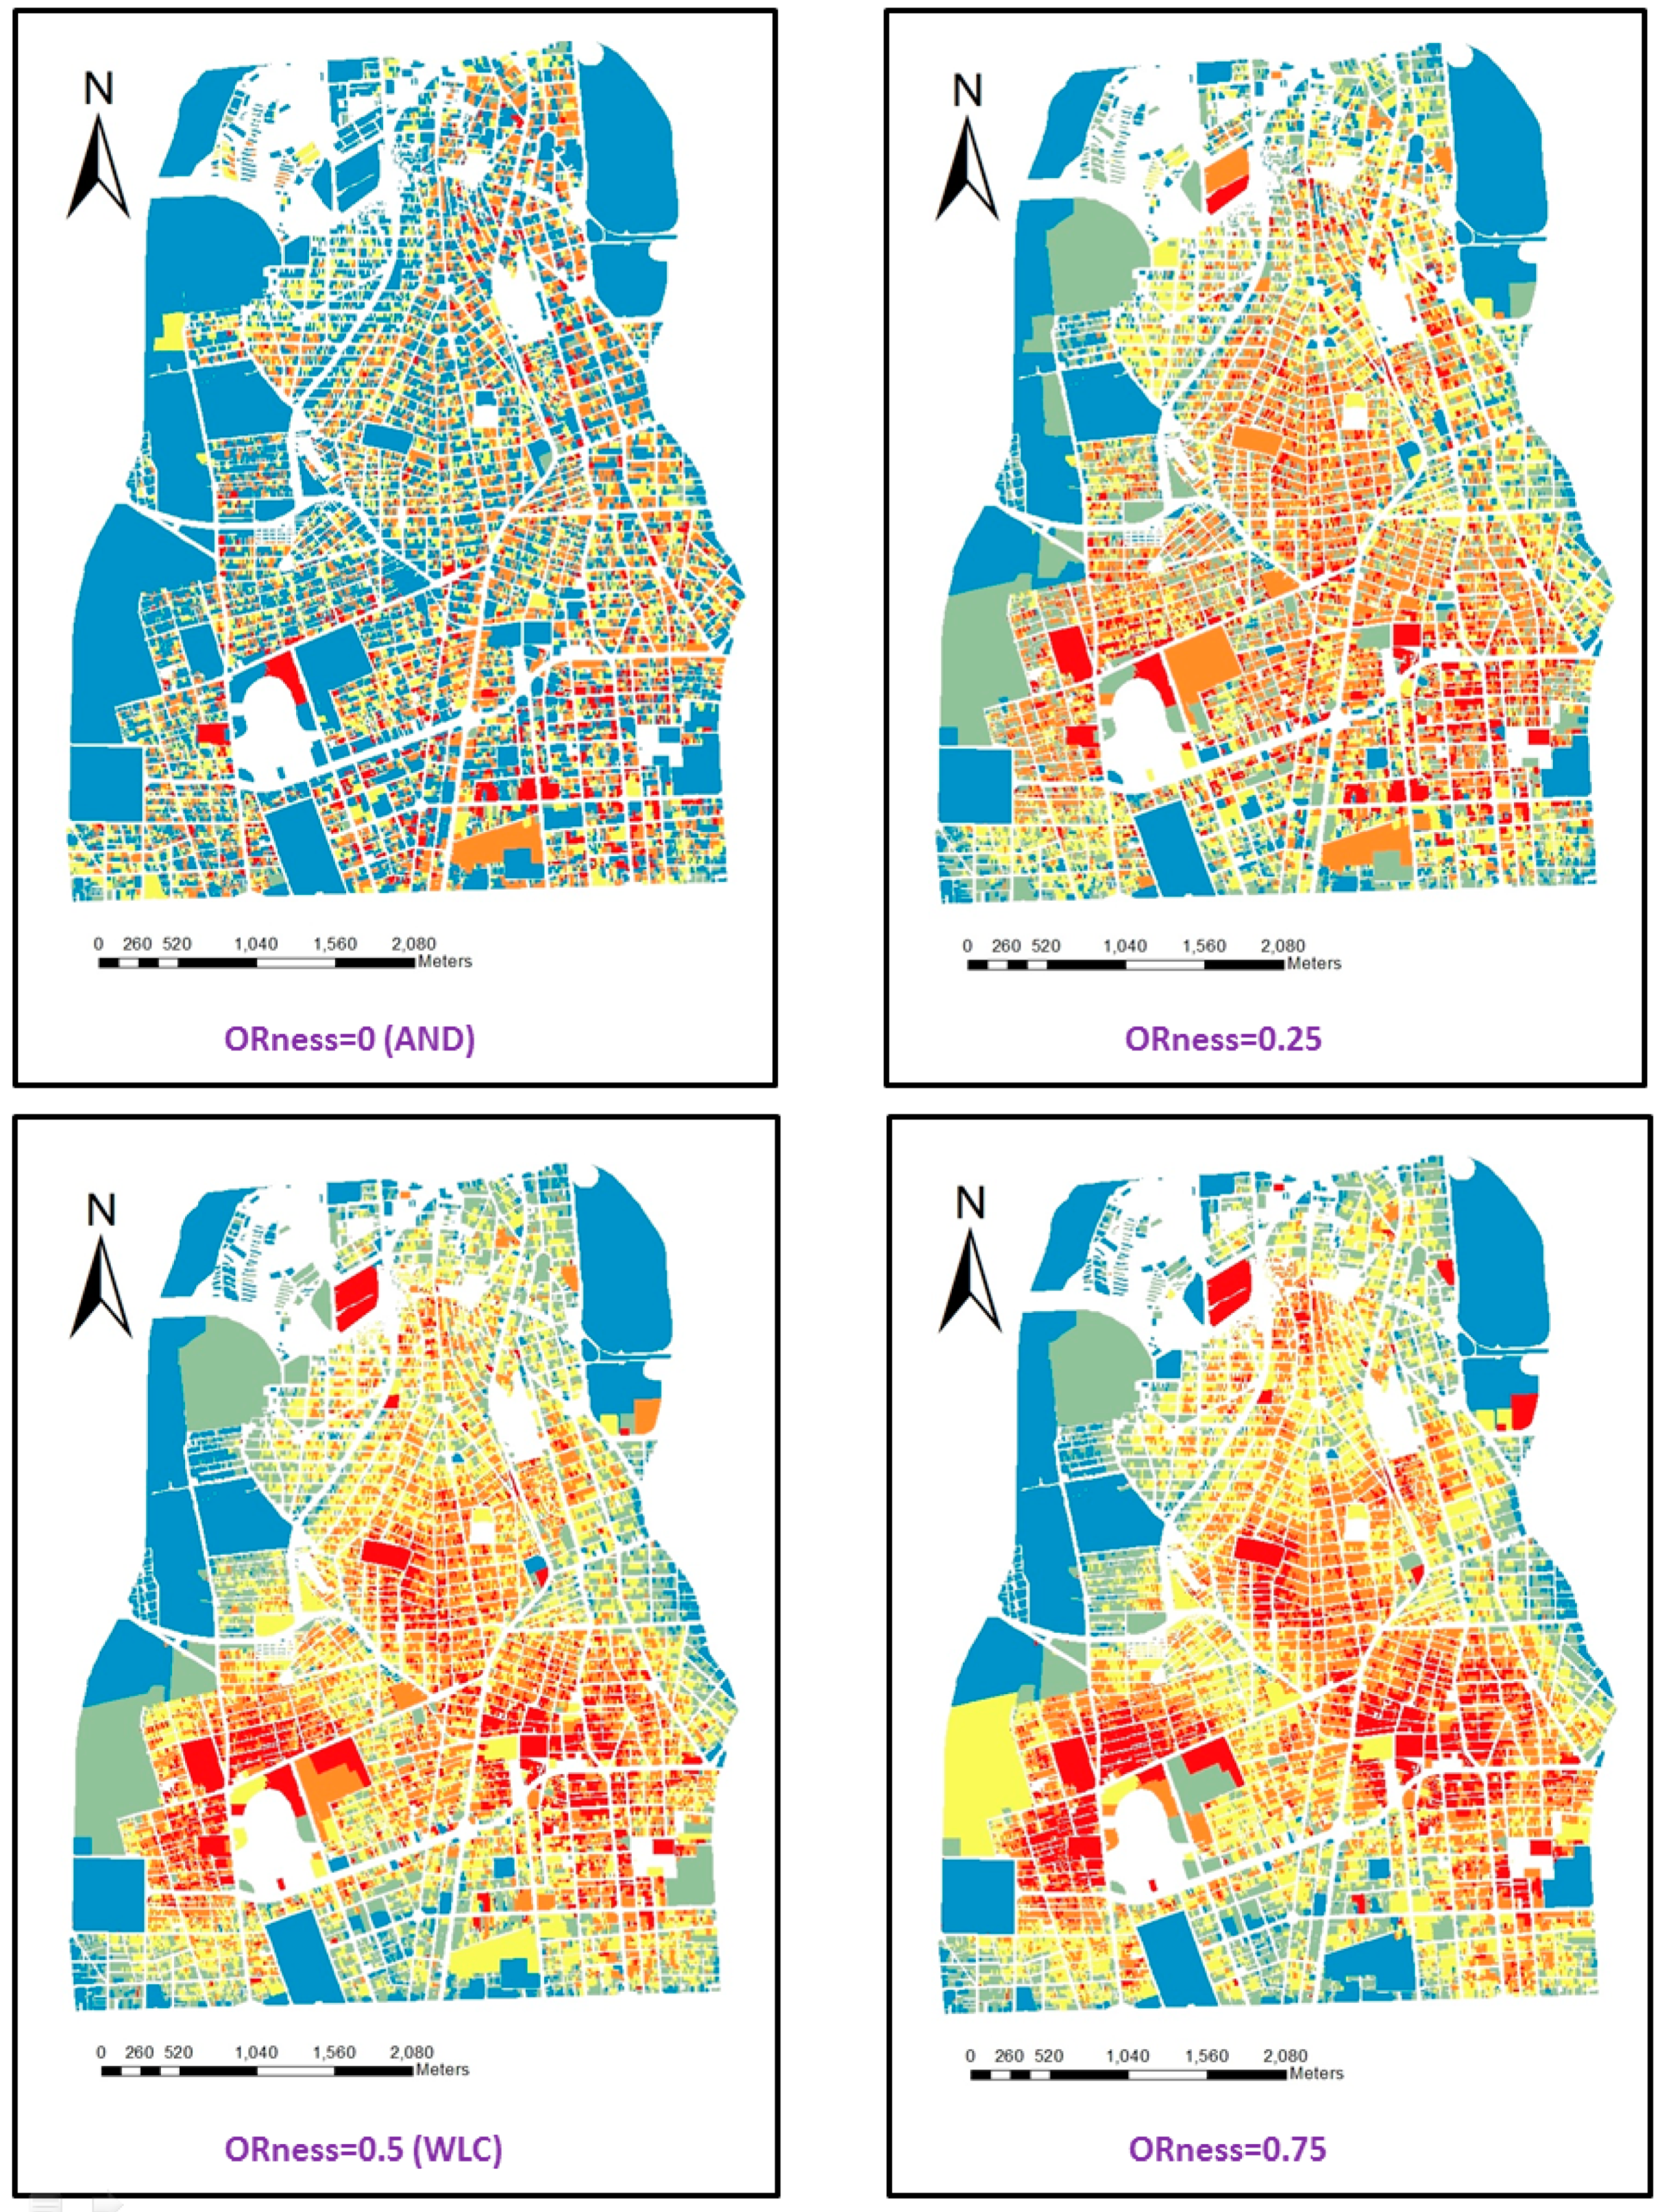
The OWA operator mentioned in the previous sections can be used to generate vulnerability maps for different risk conditions (ranging from the most pessimistic to the most optimistic). These vulnerability maps are illustrated in
Figure 6. The maps present five different categories of vulnerability, namely, ‘very low’, ‘low’, ‘moderate’, ‘high’, and ‘very high’.
As can be seen in
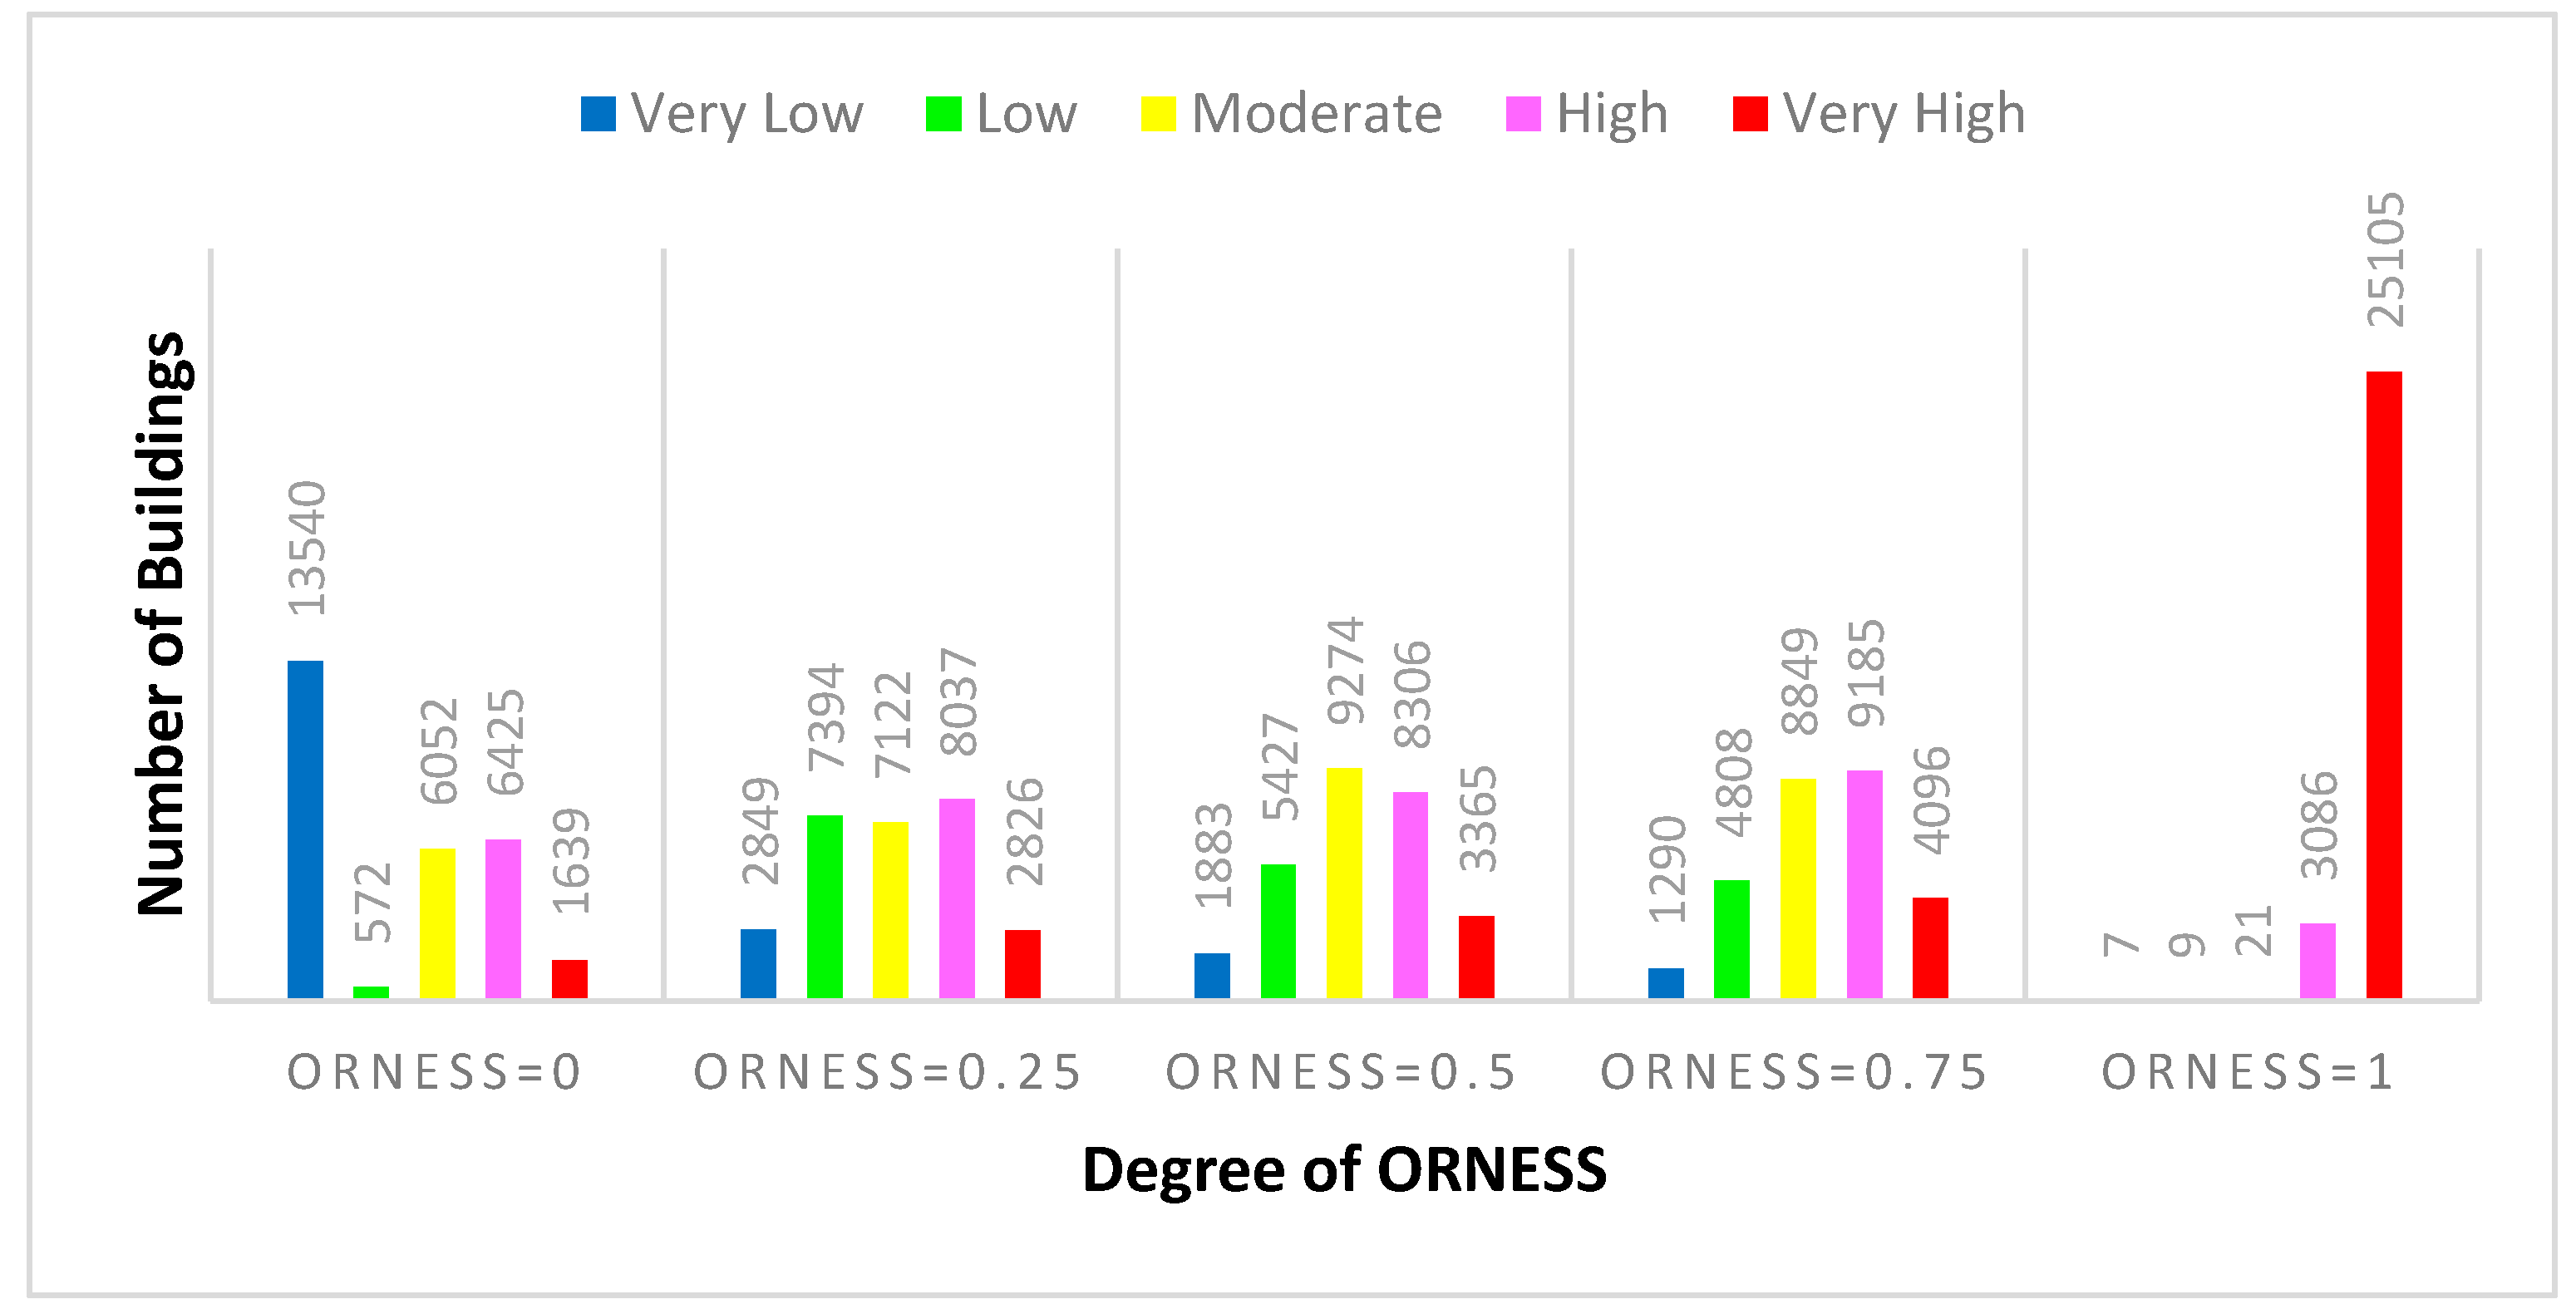
Figure 6, in the most optimistic scenario, more than 50% of the buildings exhibit very low levels of vulnerability. Under the most pessimistic scenario, about 90% of the buildings are very highly vulnerable. The statistical analysis of vulnerability under different scenarios (conditions) is presented in
Figure 7.
According to
Figure 7, when ORness = 0 (indicating the most optimistic scenario) approximately 48, 2, 21, 23, and 6% are categorized as having ‘very low’, ‘low’, ‘moderate’, ‘high’, and ‘very high’ vulnerability respectively. A simpler presentation of these results can be found in
Table 9. It can be observed that under the most pessimistic scenario, only a few buildings exhibit low levels of vulnerability and 11% and 89% of the buildings are categorized as having ‘high’ and ‘very high’ vulnerability.
As is expected, the higher the degree of optimism of the decision taker, the lower the vulnerability level (value) calculated for the buildings should be. The degree of optimism is, in fact, an indication of the extent of proximity between the OWA and OR operators. As the degree of optimism increases gradually, the number of buildings categorized as ‘very low’ vulnerability increases and the number of those categorized as ‘very high’ vulnerability declines. Detailed statistical information about the vulnerability of buildings under different degrees of optimism is shown in
Figure 7. As vulnerability carries a negative connotation, the most optimistic condition is indicative of a scenario where vulnerability is at its minimum level. Conversely, the most pessimistic condition occurs when vulnerability is at its maximum level.
As mentioned, one of the main purposes of this study is modelling vulnerability under different risk conditions. The main advantage of modelling under different risk conditions (from the most optimistic to the most pessimistic) is gaining knowledge about the minimum and maximum vulnerability of buildings. In fact, this information is needed for risk management which is an integral part of urban crisis management [
26]. In contrast to the related works previously mentioned, the present study has the benefit of producing multiple vulnerability maps for various risk conditions.
Vulnerability maps, in both the optimistic (maximum risk) and pessimistic (minimum risk) views, are of special importance for managers and urban planners. Vulnerability maps in the pessimistic view (minimum risk) show the worst or maximum vulnerability of buildings in the city and therefore the planners know that the condition will not be aggravated, and they assume that if they act based on these maps, the vulnerability can be reduced and adequate measures can be adopted to protect the city against the hazards. On the other hand, in some cases, adequate measures may not be adopted to reduce the vulnerability and achieve the ideal state, but nevertheless minimum actions are needed to reduce vulnerability. Vulnerability maps developed based on the optimistic viewpoint show the minimum urban vulnerability. As mentioned, the model developed in this study can prepare maps for different degrees of risk (between maximum and minimum). The choice of risk degree depends on the approach followed by city managers and planners.
Obviously, the desired risk preparation can only be achieved if the most pessimistic conditions are used as a basis for planning and decision-making, and if proper measures are taken to minimize the degree of vulnerability. The fact that, under the most pessimistic scenario, about 90% of buildings in District 6 are highly vulnerable, should serve as a strong warning to the local authorities that reducing vulnerability should be high on their agenda and urgent preparation and mitigation measures should be taken in order to minimize potential losses.
Even under the most optimistic scenario, about 50% of buildings exhibit moderate or higher levels of vulnerability and this is a clear indication of the urgent need for reducing physical vulnerability in the study area. Providing strategies and action plans for reducing vulnerability is beyond the scope of this paper. Here, the main intention is to raise awareness about the existing condition through generating maps that illustrate vulnerability under different risk conditions.
The high level of physical vulnerability in the district can be explained by the presence of critical facilities such as embassies and ministry buildings, high building density (higher than the average density of the city), high rates of canopy closure (height to width ratio), and the relatively high age of the building stock (over 50% of the buildings were built more than 25 years ago). However, it should be noted that similar results have also been achieved by other researchers, for instance Azizi et al. [
45], although less attention has been paid to reducing vulnerability, which is among the issues investigated in the present study. A more detailed look at the results reveals that the southern, and especially the south-eastern, parts of the district are relatively more vulnerable than the other parts. This is mainly because critical facilities such as the Ministry of Cooperatives, Labor, and Social Welfare; the Ministry of Petroleum; the Ministry of Roads and Urban Development; and the Ministry of Industry, Mining, and Trade are located in this part of the district. In addition, this part of the district features higher density levels and older buildings.
Due to the high vulnerability of buildings in District 6 of Tehran, it is necessary for the authorities to consider basic measures to reduce the vulnerability. Given the high concentration of important centers in this area, decentralization is needed and applications of critical importance must be transferred to areas with less vulnerability. In addition, owing to the high building density in the study area, it is necessary for the municipality to reconsider the regulations relating to construction and building permits. The other essential measure is retrofitting of old buildings, especially the oldest of these.
Furthermore, the municipality has poor control over construction activities in the district, passive defence principles are not appropriately taken into account and building regulations are often contravened. These have all contributed to the high levels of physical vulnerability in the district and should therefore be considered as major shortcomings that need to be addressed in the future.
6. Conclusions and Future Suggestions
As mentioned earlier, one of the main objectives of urban planning is to protect the city against a variety of hazards. One of the ways to protect the city against hazards is preparedness. One type of information necessary for this preparedness is awareness of the degree of city vulnerability to these hazards. In this study, the vulnerability maps could provide this awareness under different risk conditions and scenarios. It is very important that the governor, city council, and other authorities are aware of the city under their management, and by using vulnerability maps, they can adopt good policies toward ensuring a safe and sustainable city.
Vulnerability analysis is essential for enhancing the capacity of communities to plan and prepare for disruptive events. This study evaluated the physical vulnerability of buildings in District 6 of Tehran to intentional disruptions. The vulnerability maps produced in this study can be used to identify those areas that are in need of improvement and to prioritize allocation of the limited management resources. The maps can also be used for other purposes such as site planning, land-use planning and determining the optimum per-capita land-use standards. As the city is constantly changing, new plans with different applications can lead to increasing or decreasing vulnerability. Before deciding to implement a plan, by using a vulnerability model (like the one developed in this study), the impact of the plan on increasing or decreasing the city’s vulnerability can be determined; this can then influence the decision of the authorities regarding implementation, non-implementation, or changes in the project. In addition to the applications mentioned, physical vulnerability maps can be used in the vulnerability assessment of social, economic and environmental aspects. For example, by identifying the demographics of residents of each building at risk, the best place for building a shelter can be determined.
Results of the vulnerability analysis indicate that, even in the most optimistic scenario (minimum risk), about 50% of the buildings in the district are highly vulnerable to potential risk. Obviously, if optimal preparation for disaster risks reduction is to be provided, the most pessimistic scenario (highest risk) should be taken into account. Urban planning with the most pessimistic scenario in mind is vital for minimizing risk and achieving a safe building environment.
The case study area is located in the center of the city and hosts a wide array of critical facilities such as ministry buildings, embassies, public/private enterprises, etc. Therefore, appropriate measures need to be taken to minimize its physical vulnerability as much as possible. Principles of passive design can guide planners and local authorities on how to develop strategies for reducing physical vulnerability and improving disaster resilience in the district. Some specific strategies that can be applied are as follows: raising awareness of urban authorities of the extent of physical vulnerability and developing integrated management strategies for reducing urban vulnerability, improving control over construction activities and enhancing enforcement of building regulations, preventing building construction above the approved floor-area ratios, revitalizing decaying urban neighborhoods, improving the quality of street and pedestrian networks, (e.g., connectivity, accessibility, etc.), providing open spaces that can be used as shelters, and reducing the concentration of critical facilities in the district. Providing details about such strategies is beyond the scope of this study but should be prioritized in future research.
Research on modelling the vulnerability of buildings to intentional attacks (explosions) is still scarce and the issue warrants further investigation. It is suggested that other elements of the built environment, such as street networks and critical infrastructure, should also be included in future modelling studies. Furthermore, socio-economic and environmental dimensions of vulnerability to explosion-related risks are also important and should be considered in future research. Since criteria extraction, one of the most essential steps of the research, is conducted based on expert opinions, group decision-making techniques can be utilized for reducing subjectivity/uncertainty and achieving better and more realistic results. Further research is needed for better understanding of the uncertainty involved in multi-criteria decision-making processes. For instance, over the past decades major developments have occurred in the field of fuzzy logic, and new concepts such as type-2 fuzzy sets and intuitionistic fuzzy sets have been introduced. These new developments can be employed in order to further reduce uncertainties involved in the decision-making process.

 ,
, 


