1. Introduction
In recent years, phase change materials (PCMs) have become more popular in different building components such as underfloor heating [
1], cooling ceilings [
2], PCM wallboards [
3,
4], and especially in glazing systems [
5,
6,
7,
8]. This is thanks to their increasing the thermal inertia of the construction. These materials have a melting point in the area of the comfort in the building and they stabilize temperature fluctuations and reduce overheating on summer days.
According to their chemical composition, PCMs are divided into three main groups: organic compounds, inorganic compounds, and inorganic eutectics. Each group of PCMs has its typical properties, different melting points, and different applications as described in [
9]. It is important to match the suitable temperature range for the PCMs for a given application. PCM energy storage systems are based on these aspects [
10]. Some recent studies have concerned PCMs with a different chemical composition in glass systems [
2,
5,
6,
7]. As evident from these studies, different PCM compounds cause the different behavior of the PCM inside the glass system.
The architectural design of buildings increasingly uses glass structures. These building elements increase the heat load and increase cooling requirements. Reducing the heat transfer of solar radiation is possible with reflective elements such as a prismatic glass. PCMs allow the reduction of temperature fluctuations and the storage of excess energy that are primarily caused by solar gains. The combination of reflective elements and PCMs is able to achieve thermal comfort and reduce cooling requirements inside buildings. The subject of our research is the use of a specific glass elements using prismatic glass and a PCM. Solar radiation is reflected by the prismatic glass >40° but allows winter solar radiation to pass <35°. The solar transmittance of the PCM window is 11% for solid state and 15% for liquid state as described in [
6]. These results show no relevant difference in the direct solar transmittance between the solid and liquid states. The minimal effect of the solar transmittance can be explained the complex structure of the glazing, where the PCM layer has a much lower impact on the total behavior of the window panel [
6].
New PCM technology exploits its application into the entire cavity of the glass. Previous PCM technology used a polycarbonate segment that contained the PCM, as described in [
6]. This new technology improves the thermal performance and storage mass of the window panel. However, hydrate salts are present in a large volume and they can lead to incongruent melting. Salt hydrates consist of several components, at least one salt and water, that separate into different phases and thus show problems with cycling stability as described in [
11]. Salt hydrates have significantly higher vapor pressures. These pressures could induce water loss and progressive change of their thermal behavior [
12]. Therefore, the cavity of the window contains open space for the volume change from solid to a liquid that can be up to 10% of volume.
Calcium chloride hexahydrate CaCl
2·6H
2O was selected as the PCM in this experimental research. The use of this hydrate salts as a PCM was first proposed in 1951 by John R. Swanton. As described in [
13], the PCM was tested for long-term stability. No change in thermal properties was found after 5650 cycles of melting and solidification. The thermal cycles of calcium chloride hexahydrate are described in [
13]. The repeated thermal cycles showed an interesting stability of thermal properties i.e., the latent heat of fusion and the melting temperature. The thermal cycle tests were conducted by Differential Scanning Calorimeter. A large amount of this material represents changes in the process of melting and solidification.
Nevertheless, this material exhibits incongruent melting and supercooling tendencies [
14]. Incongruent melting causes uneven melting and it can consequently cause hydrate solids buildup. This crust impedes the heat release from the PCM and deteriorates the supercooling.
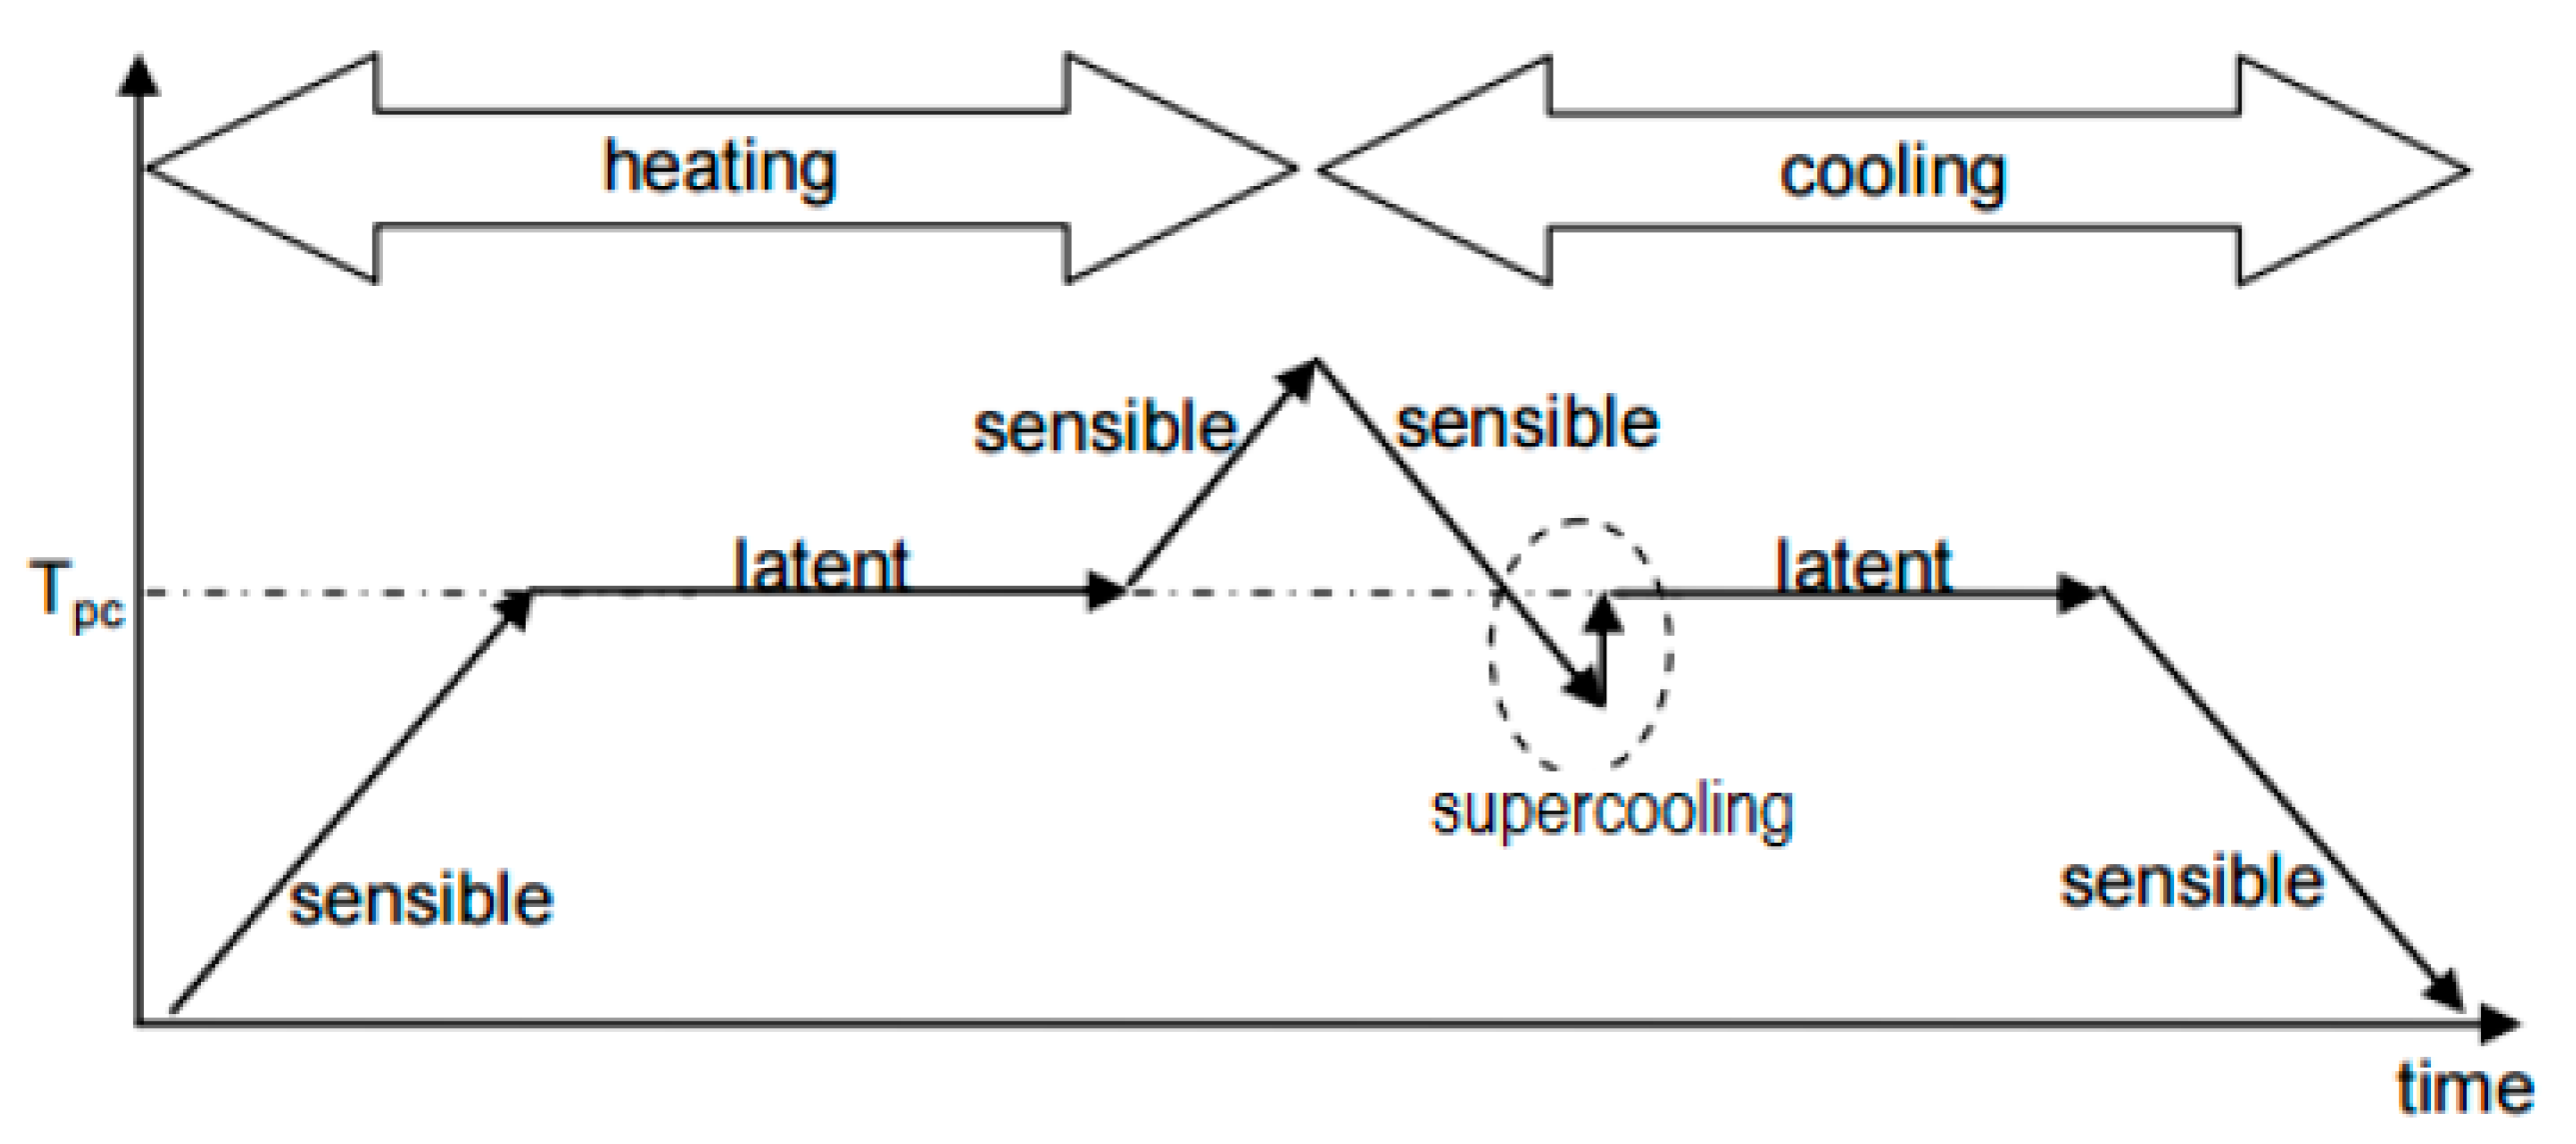
Supercooling is a state when PCMs do not solidify immediately upon cooling below the melting temperature: the crystallization starts when the temperature of the PCM is well below the melting temperature [
12,
15]. As can be seen in
Figure 1, the supercooling effect deteriorates the properties of the material. If nucleation does not happen, the latent heat is not released and the material only stores sensible heat [
16]. Some materials achieve supercooling at temperature differences ranging from a few degrees up to 20 °C. The reason for the high degree of supercooling is the rate of nucleation of crystals from the melt or the rate of growth of these nuclei or rate of both process is very slow. High-viscosity materials in the liquid state have low diffusion coefficients for their constituent atoms. These atoms can be unable to rearrange themselves to a solid; instead, the liquid undergoes supercooling [
10].
The study [
17] confirmed the supercooling effect of the calcium chloride hexahydrate between approximately 1 to 3 degrees Celsius.
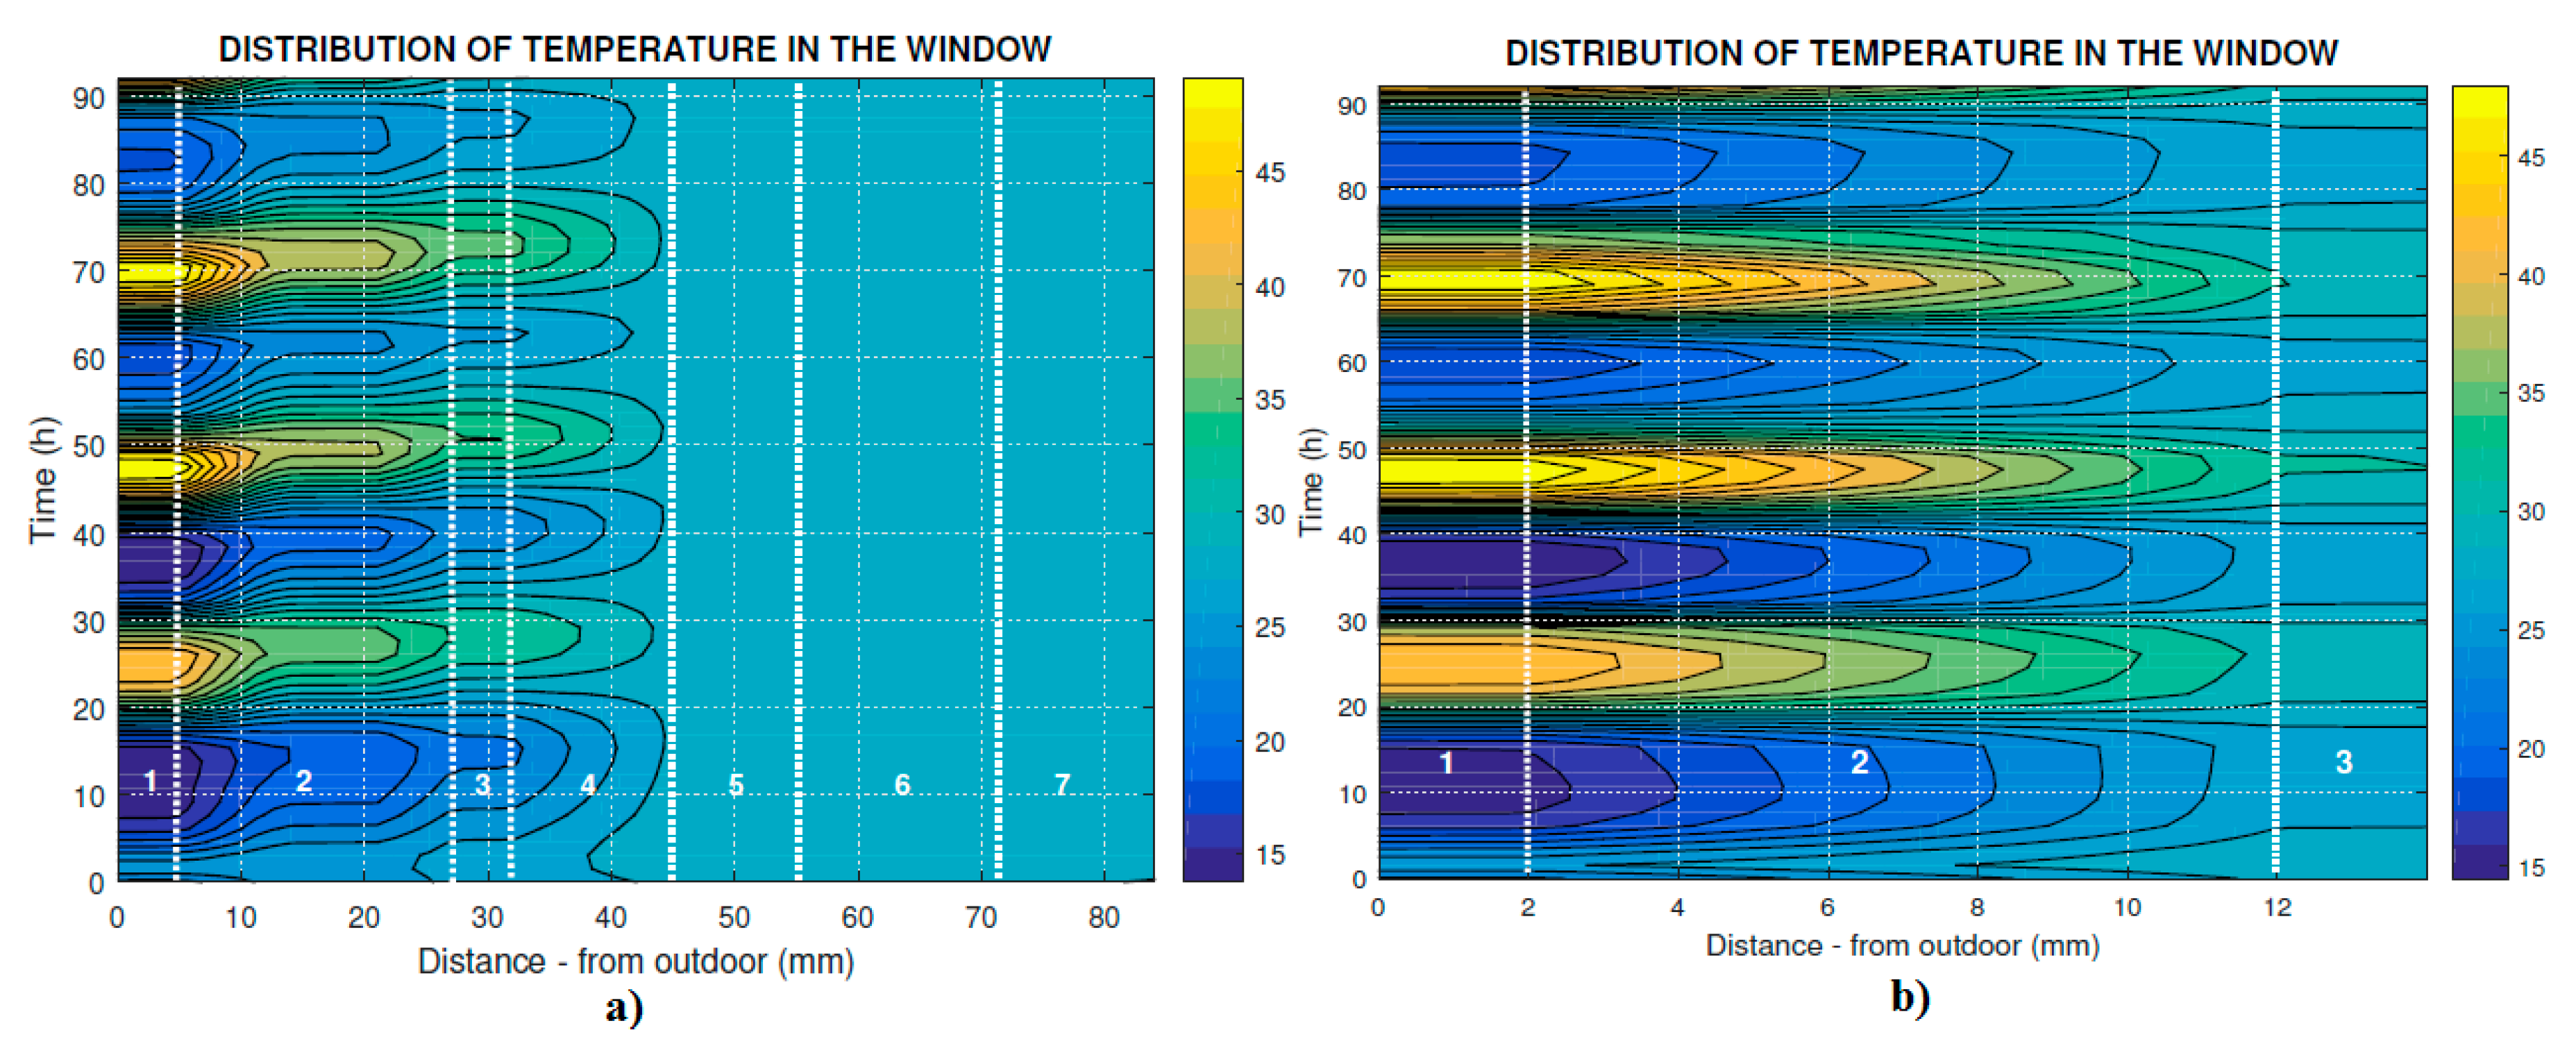
In this paper, the first section presents methods used for measuring the heat transfer by conduction by the melting process of the PCM inside the window. The second section presents the results of measurement of the PCM window panel in the double calorimetric chamber where the window panel was exposed to different temperatures. Finally, a simulation model of PCM window panel was created in the COMSOL Multiphysics. The model of the PCM window panel was performed to evaluate the impact of the window on the internal microclimatic condition of the room and also to compare it with a double-glazing system.
2. Methods
The measurement of heat transfer energy was performed on the specific glazing system in which a PCM is used to stabilize the climatic conditions in the indoor environment. The aim of this study was to measure the heat transfer by conduction through the window panel during the different microclimatic conditions. The window panel contains a PCM material that markedly decreases the solar transmission. Accordingly, it was important to verify the melting process of the PCM. The total surface thermal transmittance of the glazing defined the heat transfer through the window as described by the standard (EN 673 Determination of thermal transmittance). The thermal transmittance U value is defined according to BS 6993-1: (1989) the heat flux density through a given structure divided by the difference in environmental temperatures on either side of the structure in steady-state conditions. The thermal transmittance of the window is calculated for the inside heat transfer coefficient, the outside heat transfer coefficient, and the total heat transfer coefficient that incorporates radiative heat transfer through the window. The thermal transmission of the window is calculated by thermal transmission caused by the radiation and thermal transmission of the given gas and the PCM thermal transmission. The heat transfer coefficient is used in calculation the heat transfer typically by convection. Nevertheless, the heat transfer coefficient of the PCM is temperature-dependent and it is very difficult to determine heat transfer during the phase change of the PCM.
2.1. Instrumentation
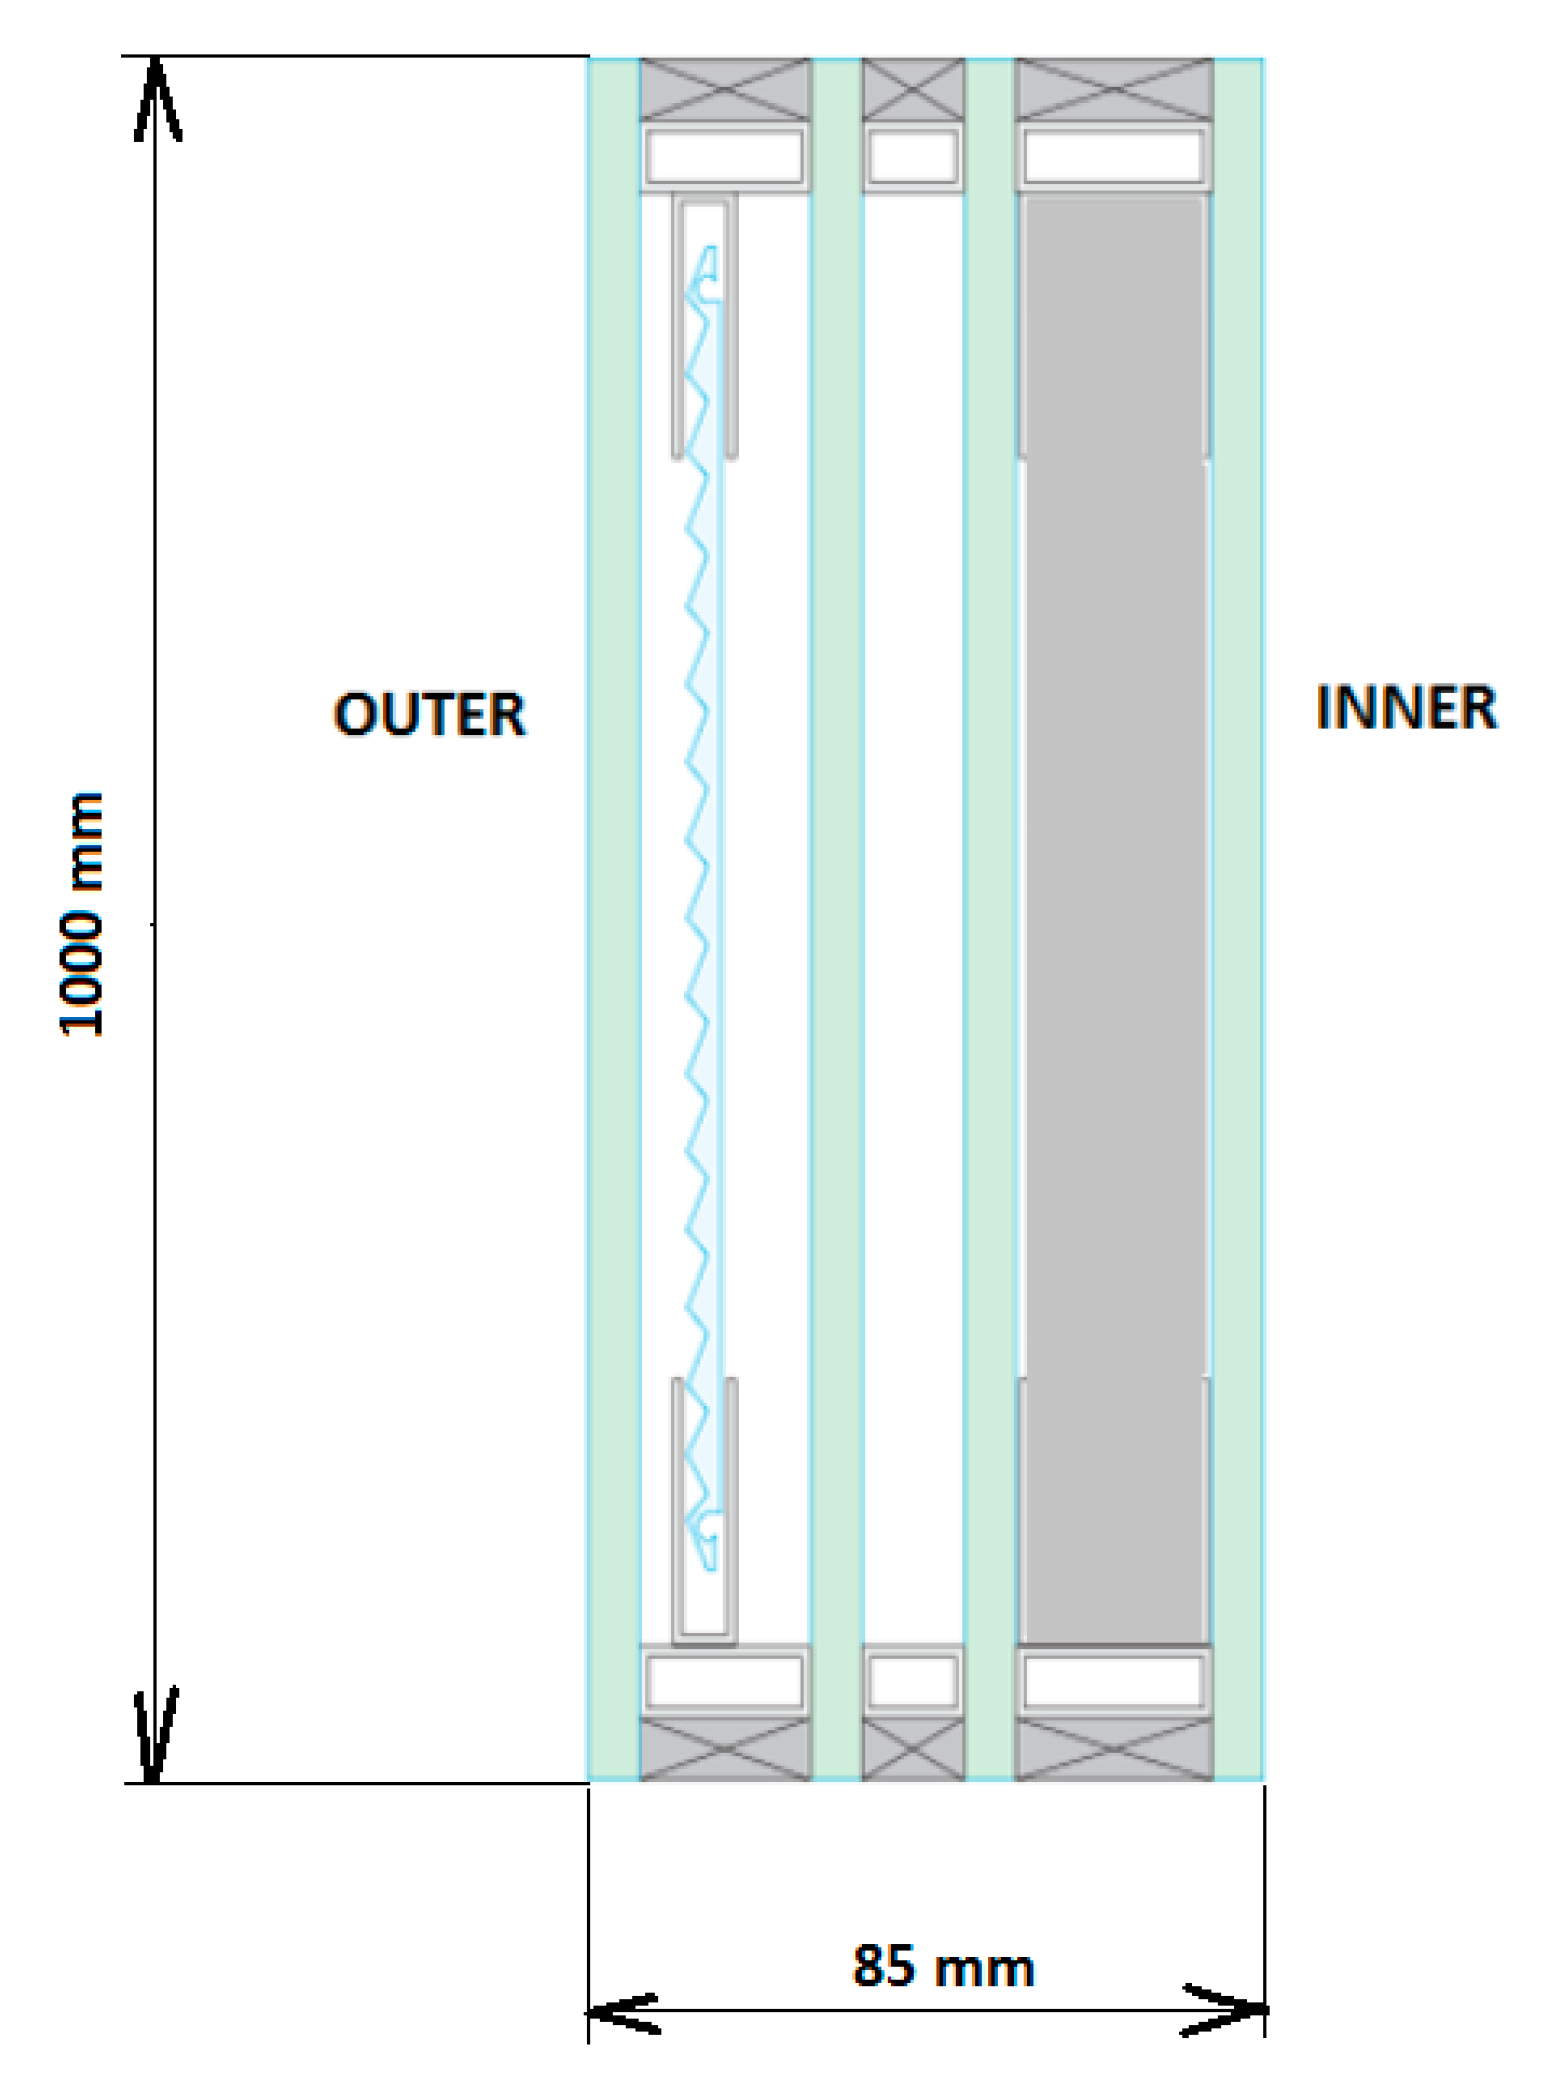
The dimensions of the window panel are 1 × 1 m and 0.085 m in thickness. It consists of a four-pane glazing package as is shown in
Figure 2. The prismatic glass solar reflection device is placed in the outermost cavity, the second cavity is filled with krypton gas, and the innermost cavity is filled with the PCM. The main goal of testing was to achieve the characteristic behavior of the PCM in the case that the outside air temperature grows up to the melting point of the PCM. The melting point presents the important thermal property of the PCM (Calcium chloride hexahydrate).
Figure 2 shows the sections of the window panel. These sections and their composition cause the high weight of the window panel (i.e., 95 kg). The density of Calcium chloride hexahydrate is 1562 kg/m
3 for liquid state and 1710 kg/m
3 for solid state.
Due to the massive construction of the glass panel, one of the measurements had to be done by attaching the glass panel to the existing glass construction, where the surface temperature on the both sides of the panel was measured. We tested the PCM window panel under different conditions and in a compensated calorimetric chamber to see if the PCM inside the cavity of PCM glass panel can melt in its entire volume.
The measurement device is a Compensated Calorimetric Chamber whose primary use is testing the energy and acoustic parameters of cooling units; air/air and air/water heat pump units, cooling ceilings and cooling beams, selected heating elements, and other building equipment. It consists of four parts, including the indoor and the outdoor sides, which each has compensated thermal control interspace as shown in
Figure 3. This compensated space always has the same temperature as the inner space, which ensures minimum heat loss to the outer space. The only heat transfer is through the partition wall between the indoor and outdoor spaces. All spaces have heat exchangers for temperature control connected to water-glycol distribution, ensuring temperature control between 5 °C to 40 °C. Electric heaters are also provided. The outdoor part has an additional direct chiller and its temperature can be maintained down to −30 °C. Humidity control is also provided and can be controlled in the range from 5% to 95%. All energy sources of cold or heat are designed to provide enough power up to measure units with the power of 20 kW.
The characterization of the partition wall was conducted by the calibration test. The test allowed the definition of heat dispersion through the partition wall between the indoor and outdoor chambers. The measurement of the thermal transmittance of the window is described in references [
18,
19].
Temperatures and heat flows were continuously monitored during the experiment. The heat flow was measured using Heat flow FQA on each side of the window panel. These heat flow meters have a measurement accuracy of ±0.05 W/m2. The heat flow meters are equipped with thermocouple with multiple contacts that make it possible to measure the temperature difference on both sides of the heat flow meter. The surface temperatures were measured by thermocouples in four positions on each side of the window panel. The thermocouple wires were lead along isotherm to reduce the heat conduction effects. A reflective aluminum foil was placed as a radiation shield over the sensors, leaving a ventilated cavity between the foil and the sensor. The surface temperature was also measured by thermal imager (Fluke Ti45), which was used to monitor the internal surface of the PCM window panel.
2.2. Numerical Simulations
The finite element method was used to predict the effect of a heat transfer through the PCM window panel. The model of the PCM window panel was created and tested under various thermal conditions. All the simulations were realized with the Heat Transfer Module in COMSOL Multiphysics.
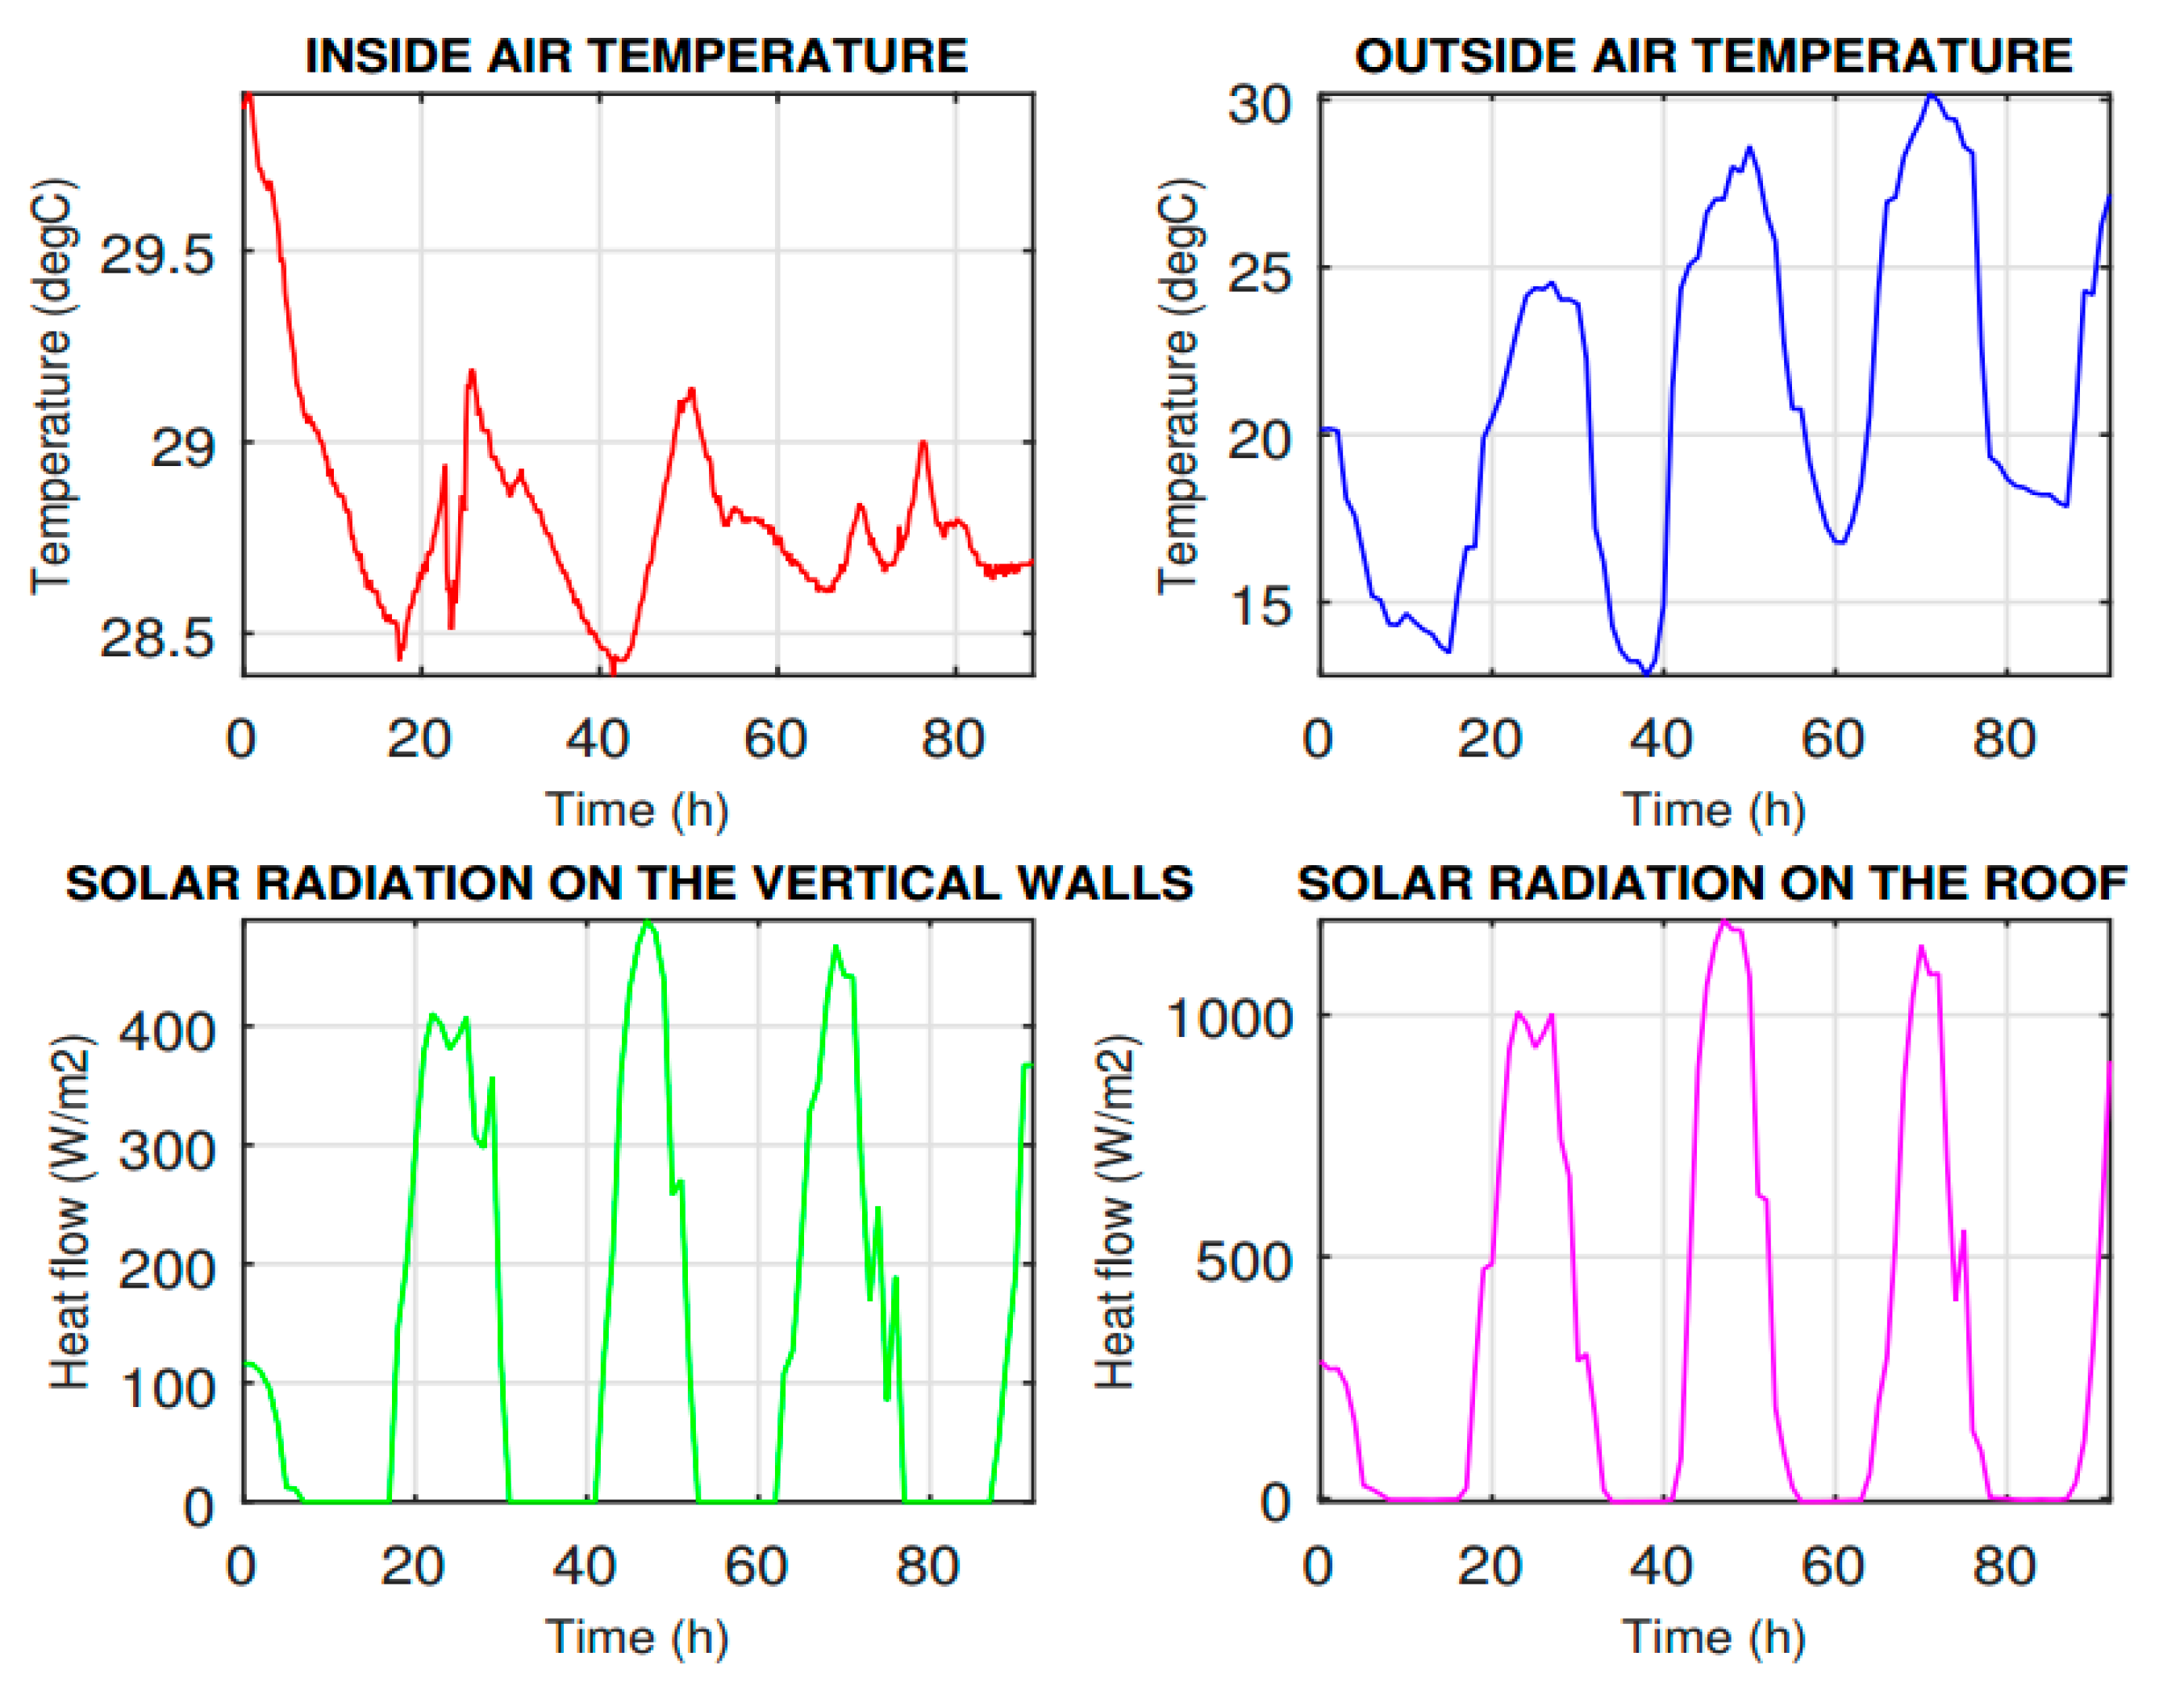
The initial conditions of the simulation were measured in the real laboratory at Faculty of Applied Informatics TBU in Zlín in the Czech Republic. The computer simulation also tested the model of the laboratory where the glass system with the PCM was applied. The first part of this study consists of the comparison of measured and predicted temperatures in the laboratory in order to assess the PCM window panel’s ability to decrease the maximal air temperature inside the building.
The input parameters—the inside air temperature, the outside air temperature, and the solar radiation—were measured in the laboratory. These parameters specify the results in the simulation model and obtained the thermal parameters of the window panel.
Table 1 shows the physical properties of the window materials. The amount of absorbed heat energy depends mainly on the thermal capacity of the PCM. The thermal capacity and the thermal conductivity are a function of the temperature of the PCM. The specific thermal capacity is measured by differential scanning calorimeter as described in [
20].
The simulation model of the PCM window does not allow to simulate the phase separation process between liquid and solid phases. Specific thermal capacity and thermal conductivity were implemented in the simulation model.
The COMSOL Multiphysics was validated by the model of the steady-state and transient ground-coupled heat test cases specified in the International Energy Agency Building Energy Simulation Test (IAE) by a methodology developed by Ron Judkoff. The combination of empirical validation, analytical verification, and comparative analysis techniques are main procedures of this methodology. It describes six cases of ground-coupled heat transfers test cases designed to be compared with verified whole building energy simulation software. Several of those already tested by IEA are EnergyPlus, FLUENT, Matlab, TRNSys, GHT and ANSYS Fluent. As you can see in [
21] COMSOL Multiphysics was validated at authors department, where simulated data showed agreement with the rest energy simulation software as well as with analytical solution.
2.2.1. Finite Element Equations for Heat Transfer in the Window Panel
A basic equation of non-stationary heat transfer in an isotropic body can be described by Equation (1),
where
| qx, qy, qz | components of heat flow density | (W·m−2), |
| ϕ = ϕ(x, y, z, t) | inner heat-generation rate per unit volume | (W·m−3), |
| ρ | material density | (kg·m−3), |
| cp | heat capacity | (J·K−1), |
| θ | temperature | (K), |
| t | time | (s). |
According to Fourier’s law, the components of heat flow can be expressed as follows [
22]:
where
λ thermal conductivity (W·m
−1·K
−1).
Substitution of Fourier’s relations Equation (2) into Equation (1) gives the basic heat transfer Equation [
21]:
It is assumed that the boundary conditions can be of the following types [
22]:
Specified temperature: θs = θ1 (x, y, z, t) on S1.
Heat flow density: qs = q(x, y, z, t) on S2.
Convection boundary conditions: qxnx + qyny + qznz = h (θs − θe) + qr on S3.
Boundary condition describing heat transfer in ideal body contact:
Radiation qxnx + qyny + qznz = σεTs4 − αqr on S4.
where
| h | heat transfer coefficient | (W·m−2·K−1), |
| θs | unknown surface temperature | (K), |
| θe | convective exchange temperature | (K). |
| qr | incident radiant heat flow per unit surface area | (W·m−2), |
| qx, qy, qz | components of heat flow density | (W·m−2), |
| σ | Stefan-Boltzmann constant | (W·m−2·K−4), |
| ε | surface emission coefficient | (−), |
| α | surface absorption coefficient | (−). |
For initial temperature field for a body at the time
t = 0 it holds [
21]:
2.2.2. Numerical Modeling of Phase Change Materials
During the phase change process of the PCM encapsulated in a porous building material can exist in three states: Solid, Liquid, and “Mushy” (the coexistence of both phases). The heat transfer process of the PCM is complicated in construction, especially when the PCMs are in a transition state. The thermal properties of a matrix of construction material are different from the constituent properties. The numerical model of the PCM window panel is simplified due to the fact that the COMSOL Multiphysics is not able to solve heat transfer during the complex crystallization and melting of the salt hydrate. However, the simulation model of the PCM window panel simply illustrates the heat transfer in a complex window element in order to compare it with a simple window element.
Differential equations of transient heat conduction with variable thermos-physical properties can be described by Equation (5) as described in [
23],
where
| h | specific enthalpy | (J·kg−1), |
| g | heat generation rate | (W), |
| x | spatial coordinates | (m). |
2.2.3. Enthalpy Method
Modelling of phase transient is used by methods of enthalpy and the method of effective heat capacity.
The latent heat is included to the function enthalpy. The enthalpy expresses heat that contains a unit amount of substance. It can be generally explained by Equation (6) as is described [
24],
where
| H | volumetric enthalpy | (J·m−3), |
| c | thermal heat capacity | (J·kg−1·K−1), |
| L | latent heat | (J·m−3). |
2.2.4. Effective Heat Capacity Method
The heat capacity includes latent heat of phase change. Therefore, the function of heat capacity sharply increases or decreases in the peak of phase change of the material. An advantage of this method is the primarily dependence on temperature. This method eliminates fluctuations of method enthalpy [
25]. It is important to determine the effective heat capacity of this method according to the results of differential scanning calorimetry [
4]. The effective heat capacity is calculated by the Equation (7),
where
| Ceff | effective heat capacity | (J·kg−1·K−1), |
| h | enthalpy | (J·kg−1). |
Heat transfer in the integration of effective heat capacity can be described by the Equation (8),
where
As the relationship between specific heat capacity and temperature in isothermal problems involves sudden changes, the zero-width phase change interval must be approximated by a narrow range of phase change temperatures. When the material properties are not dependent on temperature, parameters should be obtained during the consideration that the phase change occurs in a narrow temperature interval [
25]. In this case, the heat capacity can be expressed by Equation (9),
where
| ceff | effective heat capacity | (J·kg−1·K−1), |
| cps | average heat capacity-solid | (J·kg−1·K−1), |
| cpl | average heat capacity-liquid | (J·kg−1·K−1), |
| lpl | the heat of phase change per unit weight | (J·kg−1), |
| θm | the phase change temperature solid-liquid | (K), |
| θ | the temperature of storage medium | (K), |
| Δθm | the temperature semi-interval across θm | (K). |
2.2.5. Effect of the PCM Window Panel on Indoor Air Temperature and Comparison with a Double-Glazing Window
The double-glazing window was tested and was consequently compared to the model of the PCM window panel. The output data from the simulation model were only limited by the fact that the air temperature of the surrounding rooms of the laboratory was stable. The simulation data show the effect of the heat accumulation of the window panel in the room. The results of the PCM window panel are shown in
Figure 10, where they are compared with the commercial glazing system.
4. Discussion
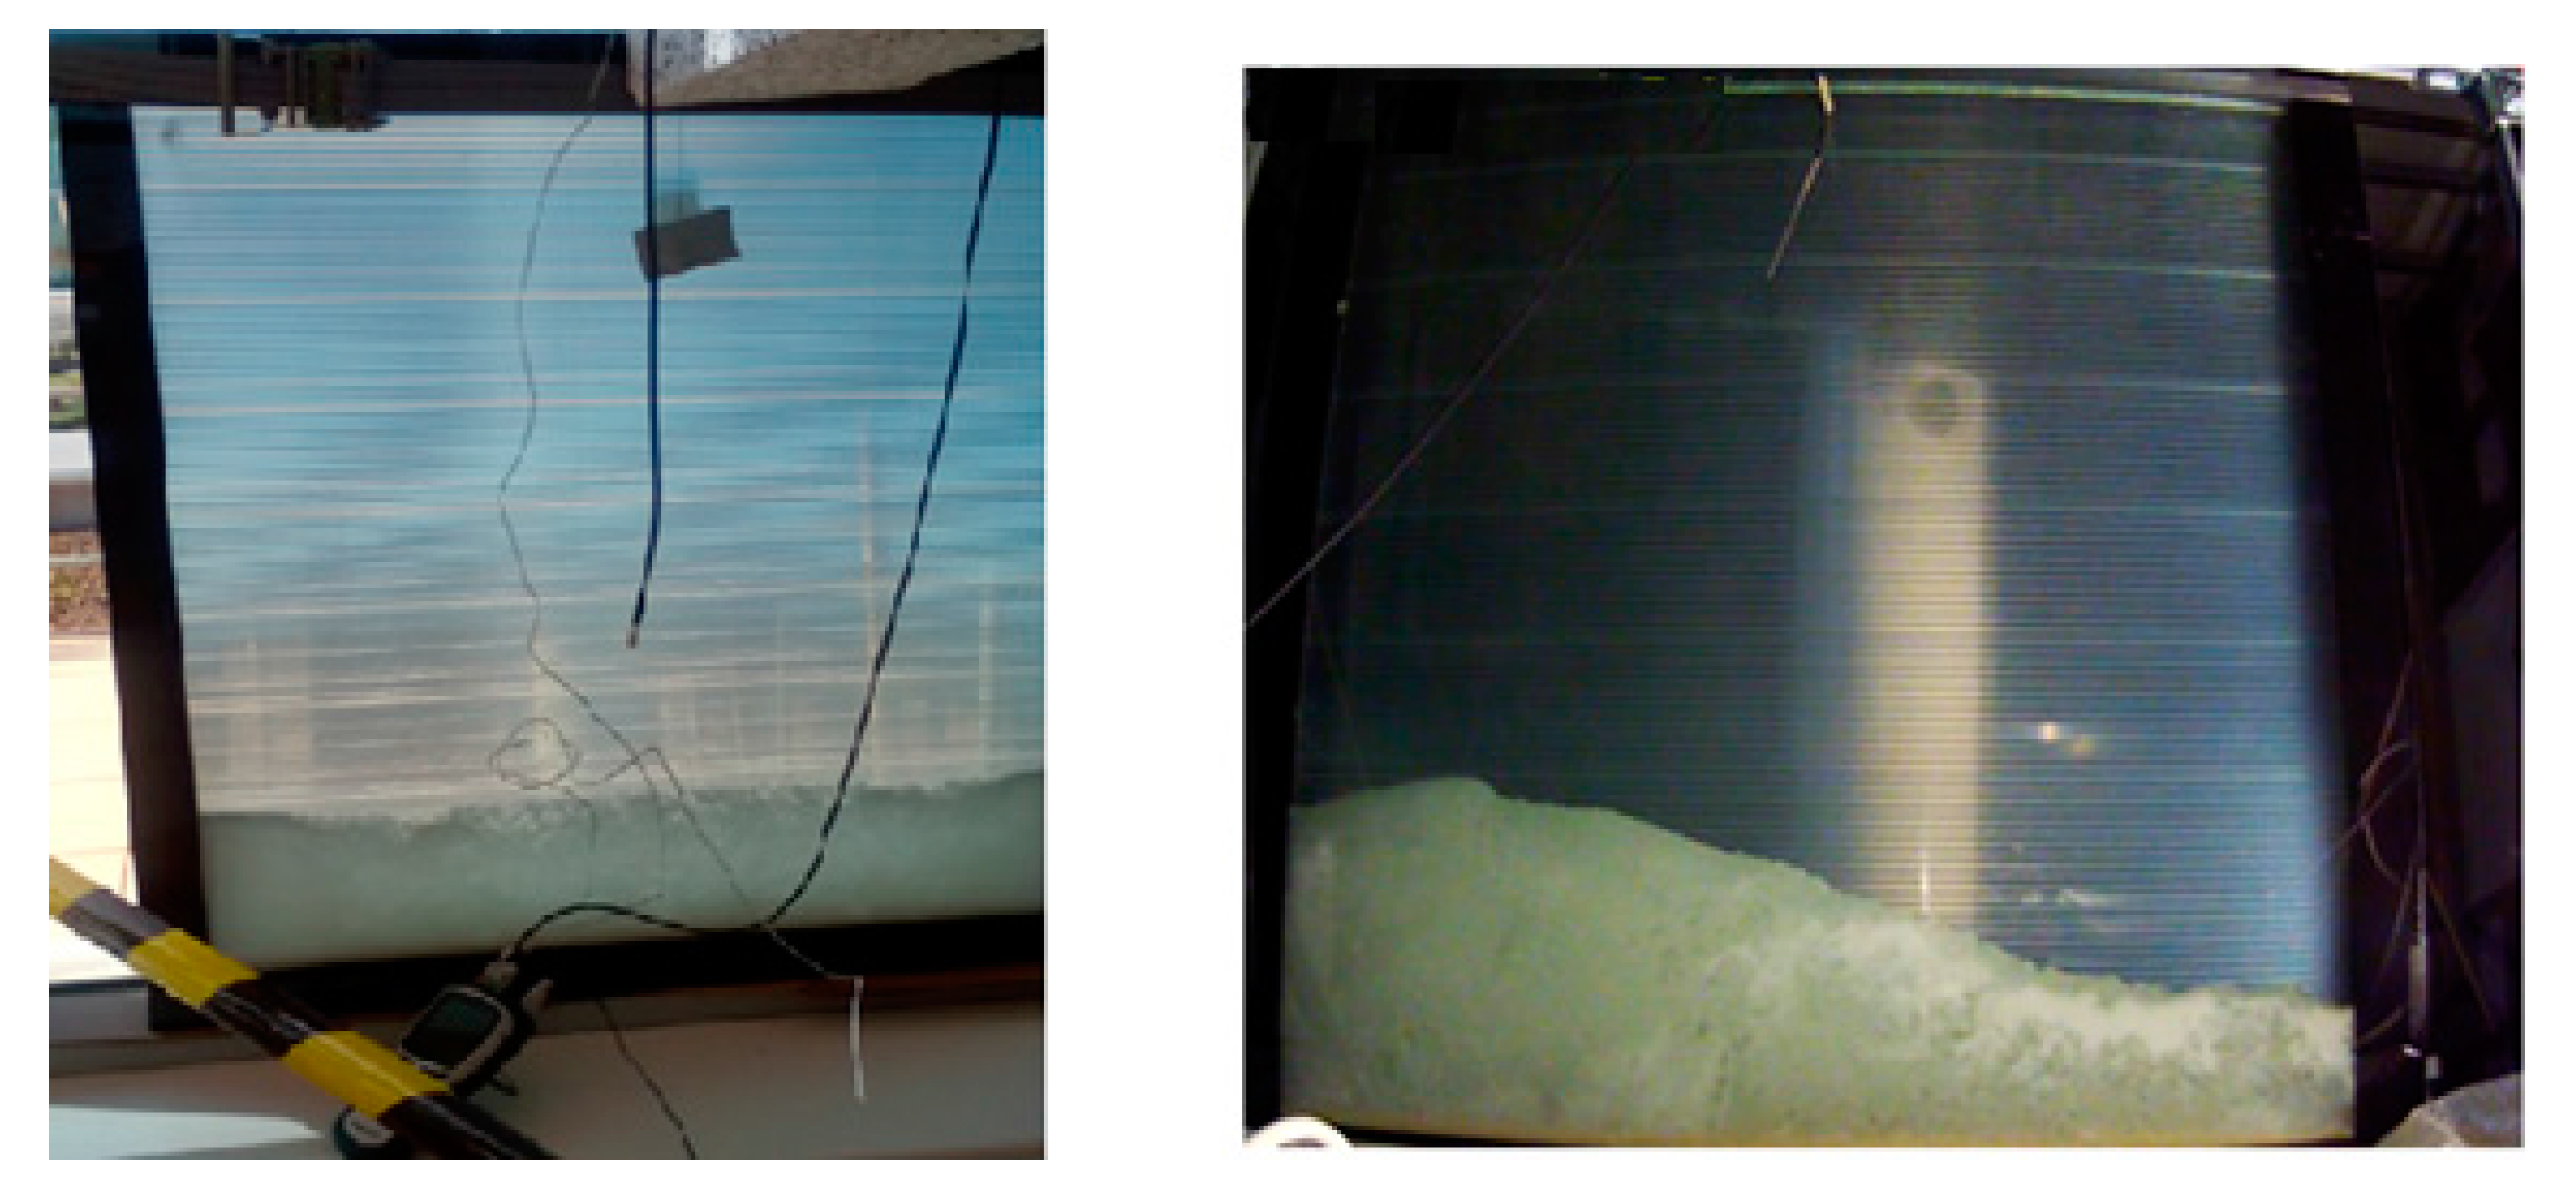
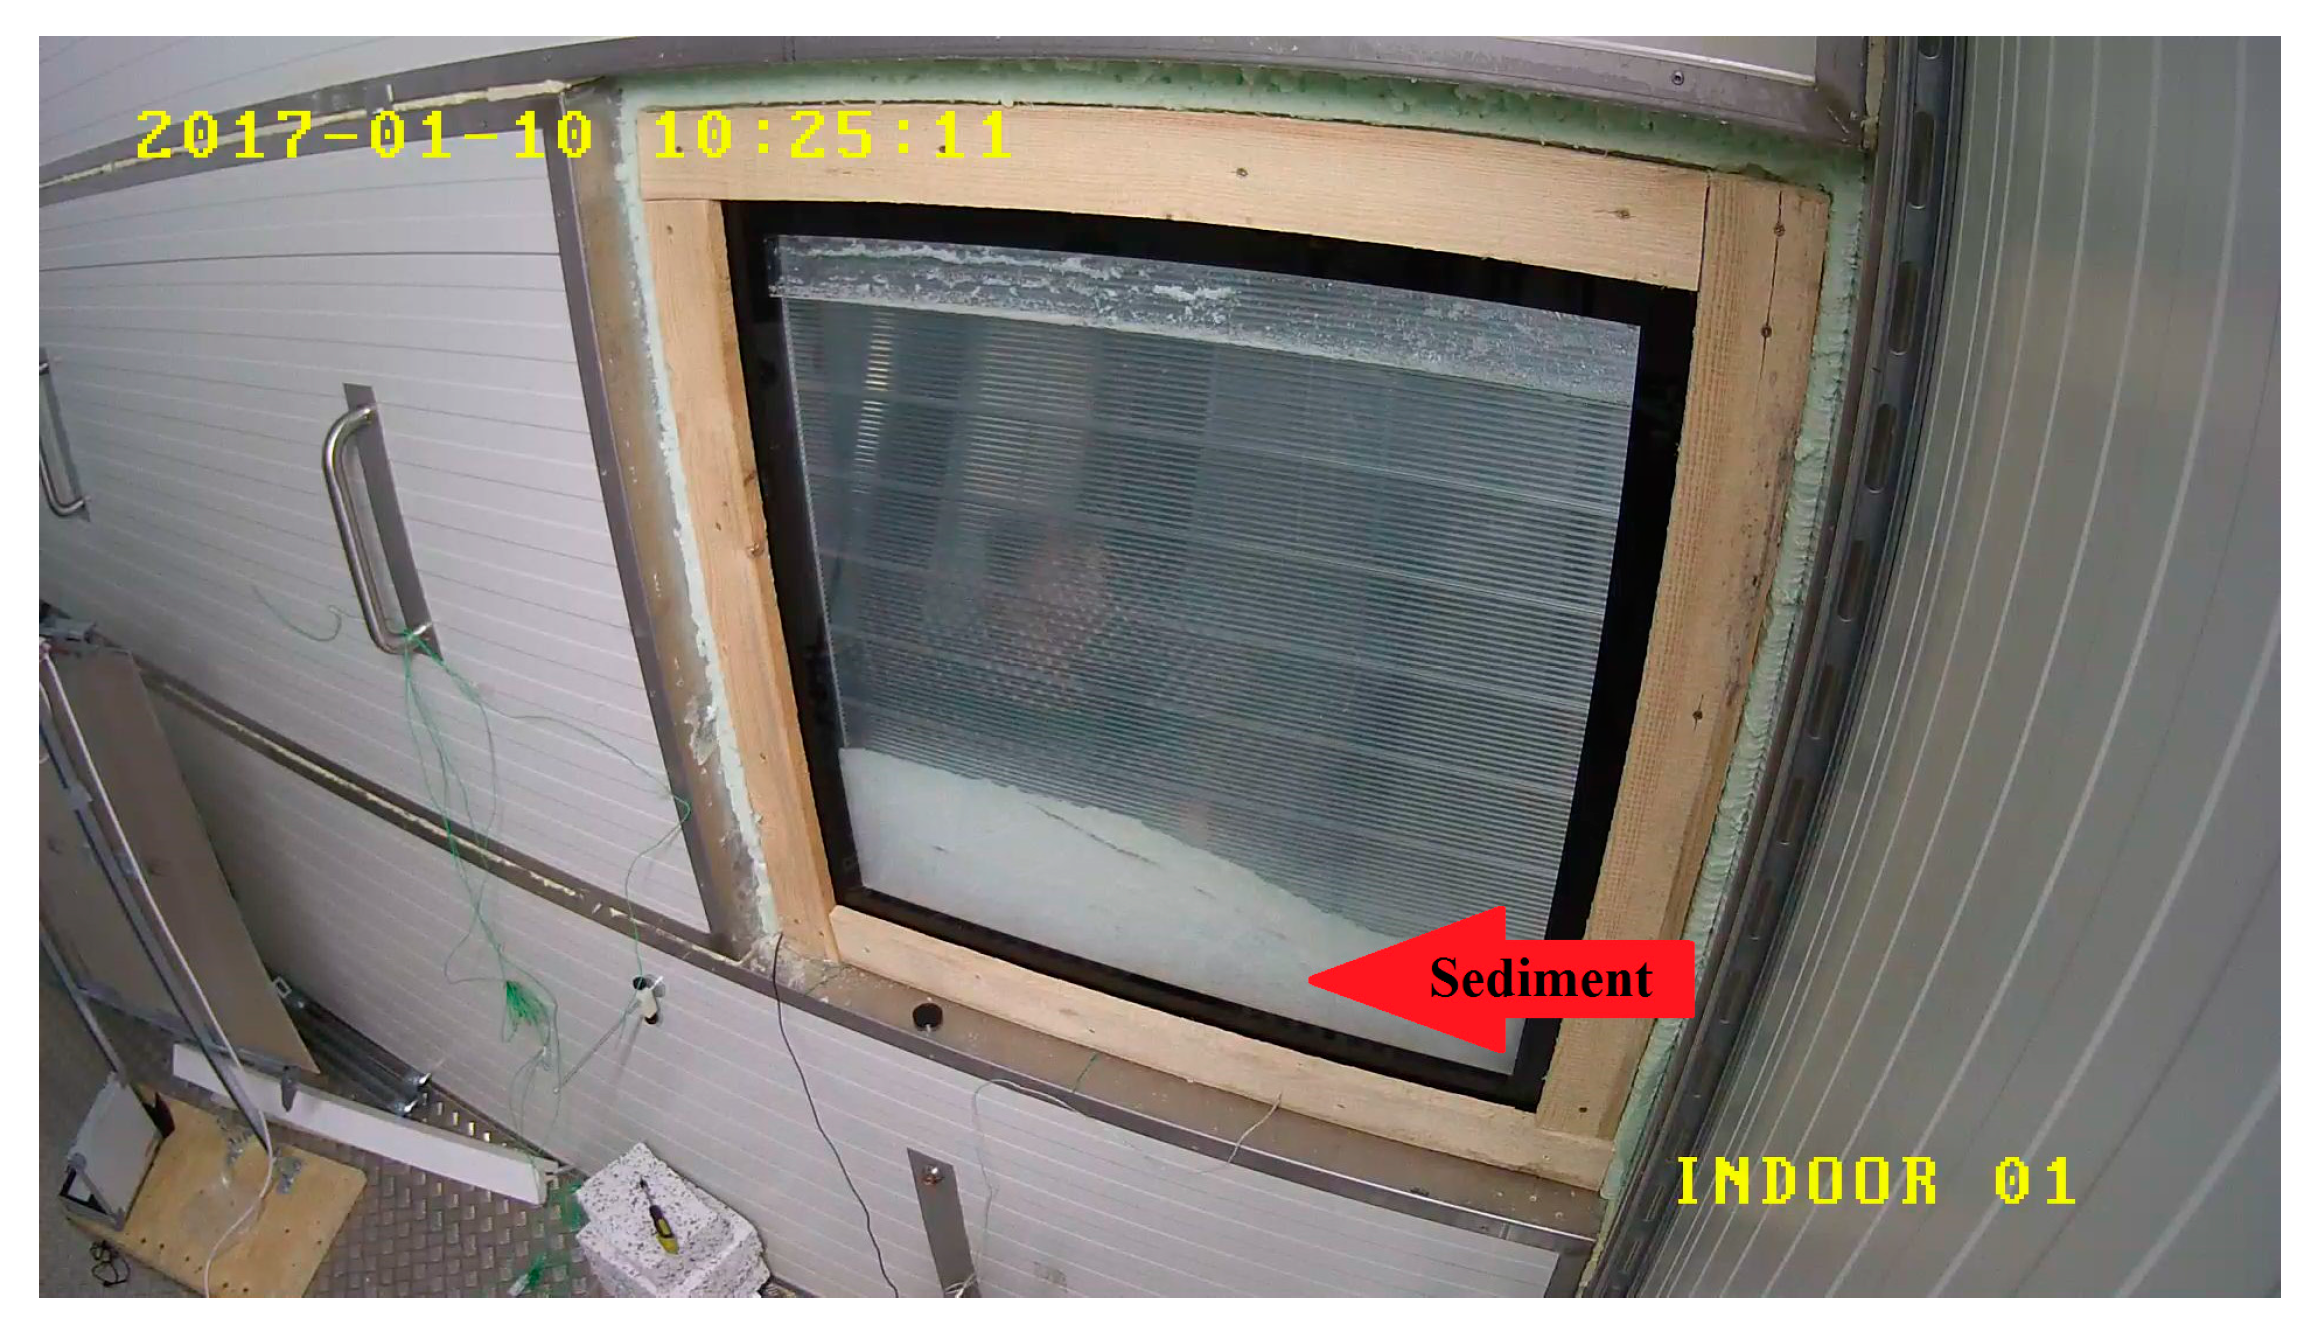
Testing of the PCM window panel affirmed the incongruent melting of salt hydrates that filled the whole cavity of the window panel. The use of the calorimetric chamber shows the high thermal inertia of the PCM window panel during different thermal conditions. Previous technology [
6] causes the non-linear behavior of the PCM layer because of usage of a polycarbonate encapsulated PCM. Due to this, we measured the surface temperature in several places with thermocouples and a thermal imager. Nevertheless, the results confirmed that the PCM window panel without polycarbonate containers caused the rise of the sediment in the cavity of the window panel. The thermal test of melting was performed for 10 times where the window was exposed to high temperature for 20 h during each cycle. The sediment was created during each melting cycle. The measurement confirmed problematic placement of the PCM inside the window.
It should be noted that this study was only concerned with the thermal behavior and the thermal inertia of the PCM window system under different climatic conditions. Nevertheless, the available devices cannot solve the issue of dependence on solar radiation. Finally, the results are limited to the realization of the summer cycle without the solar radiation simulator in the compensated calorimetric chamber, and we could not evaluate the effect on visual comfort.
5. Conclusions
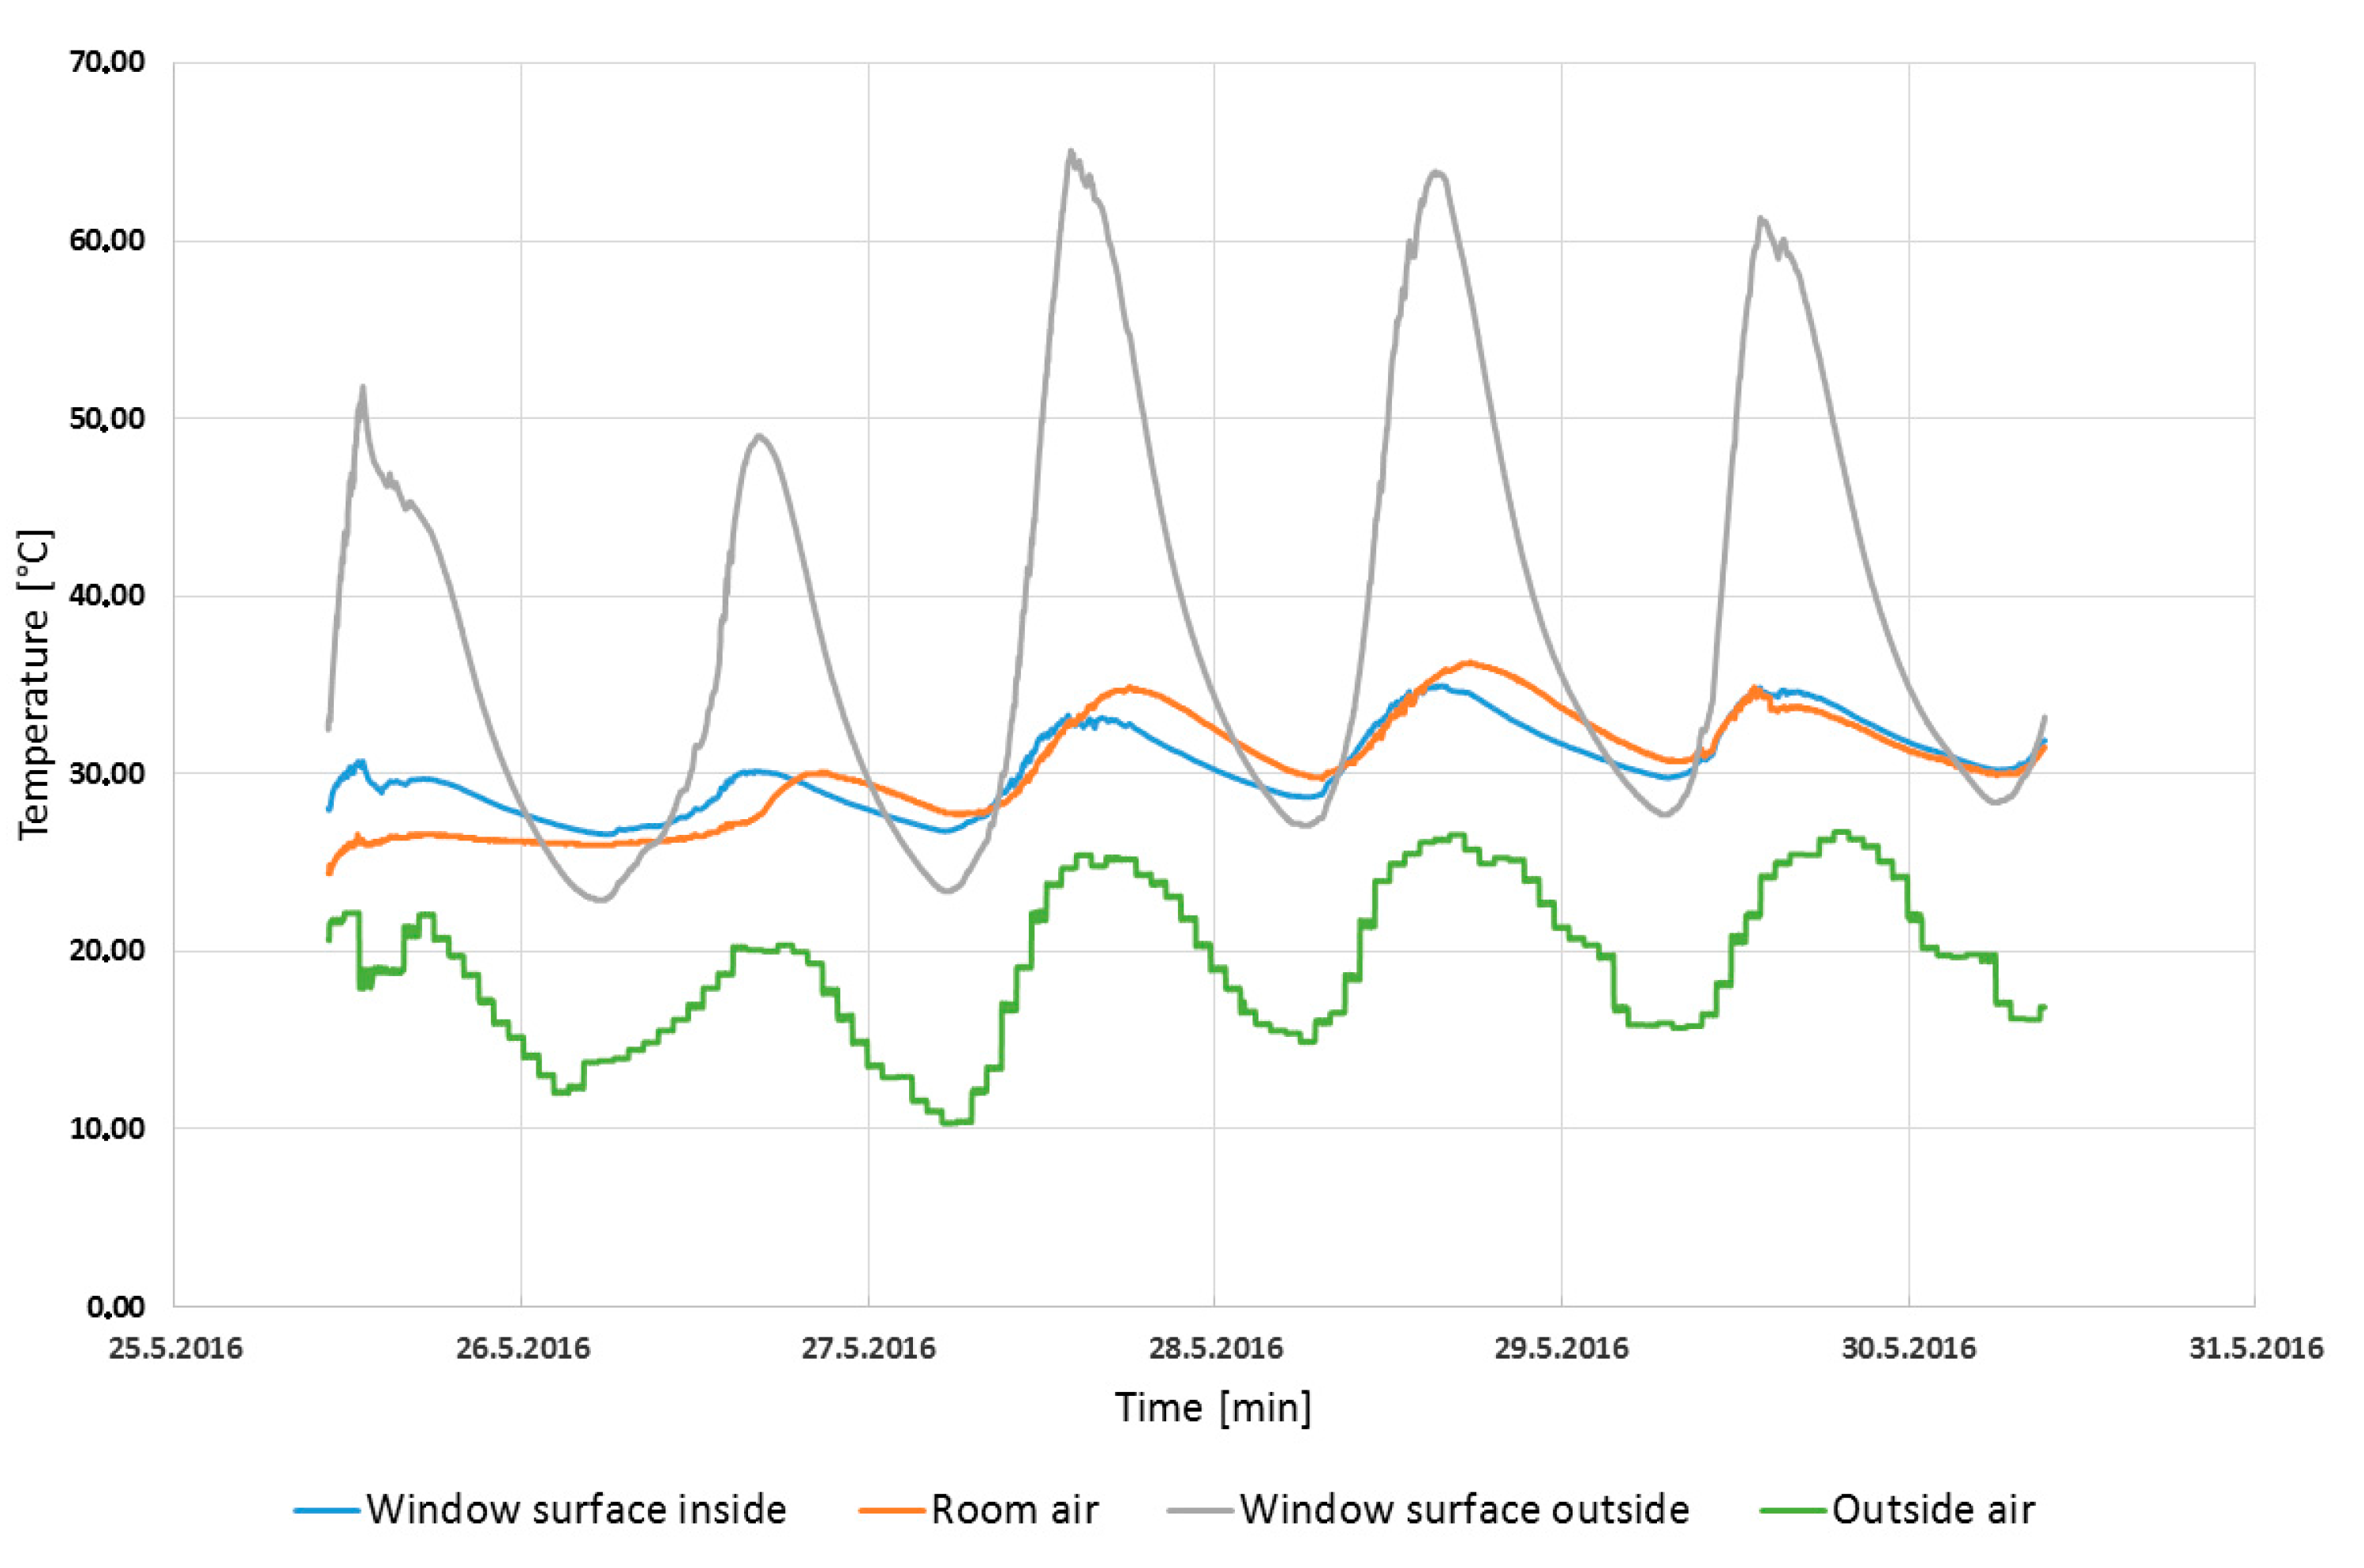
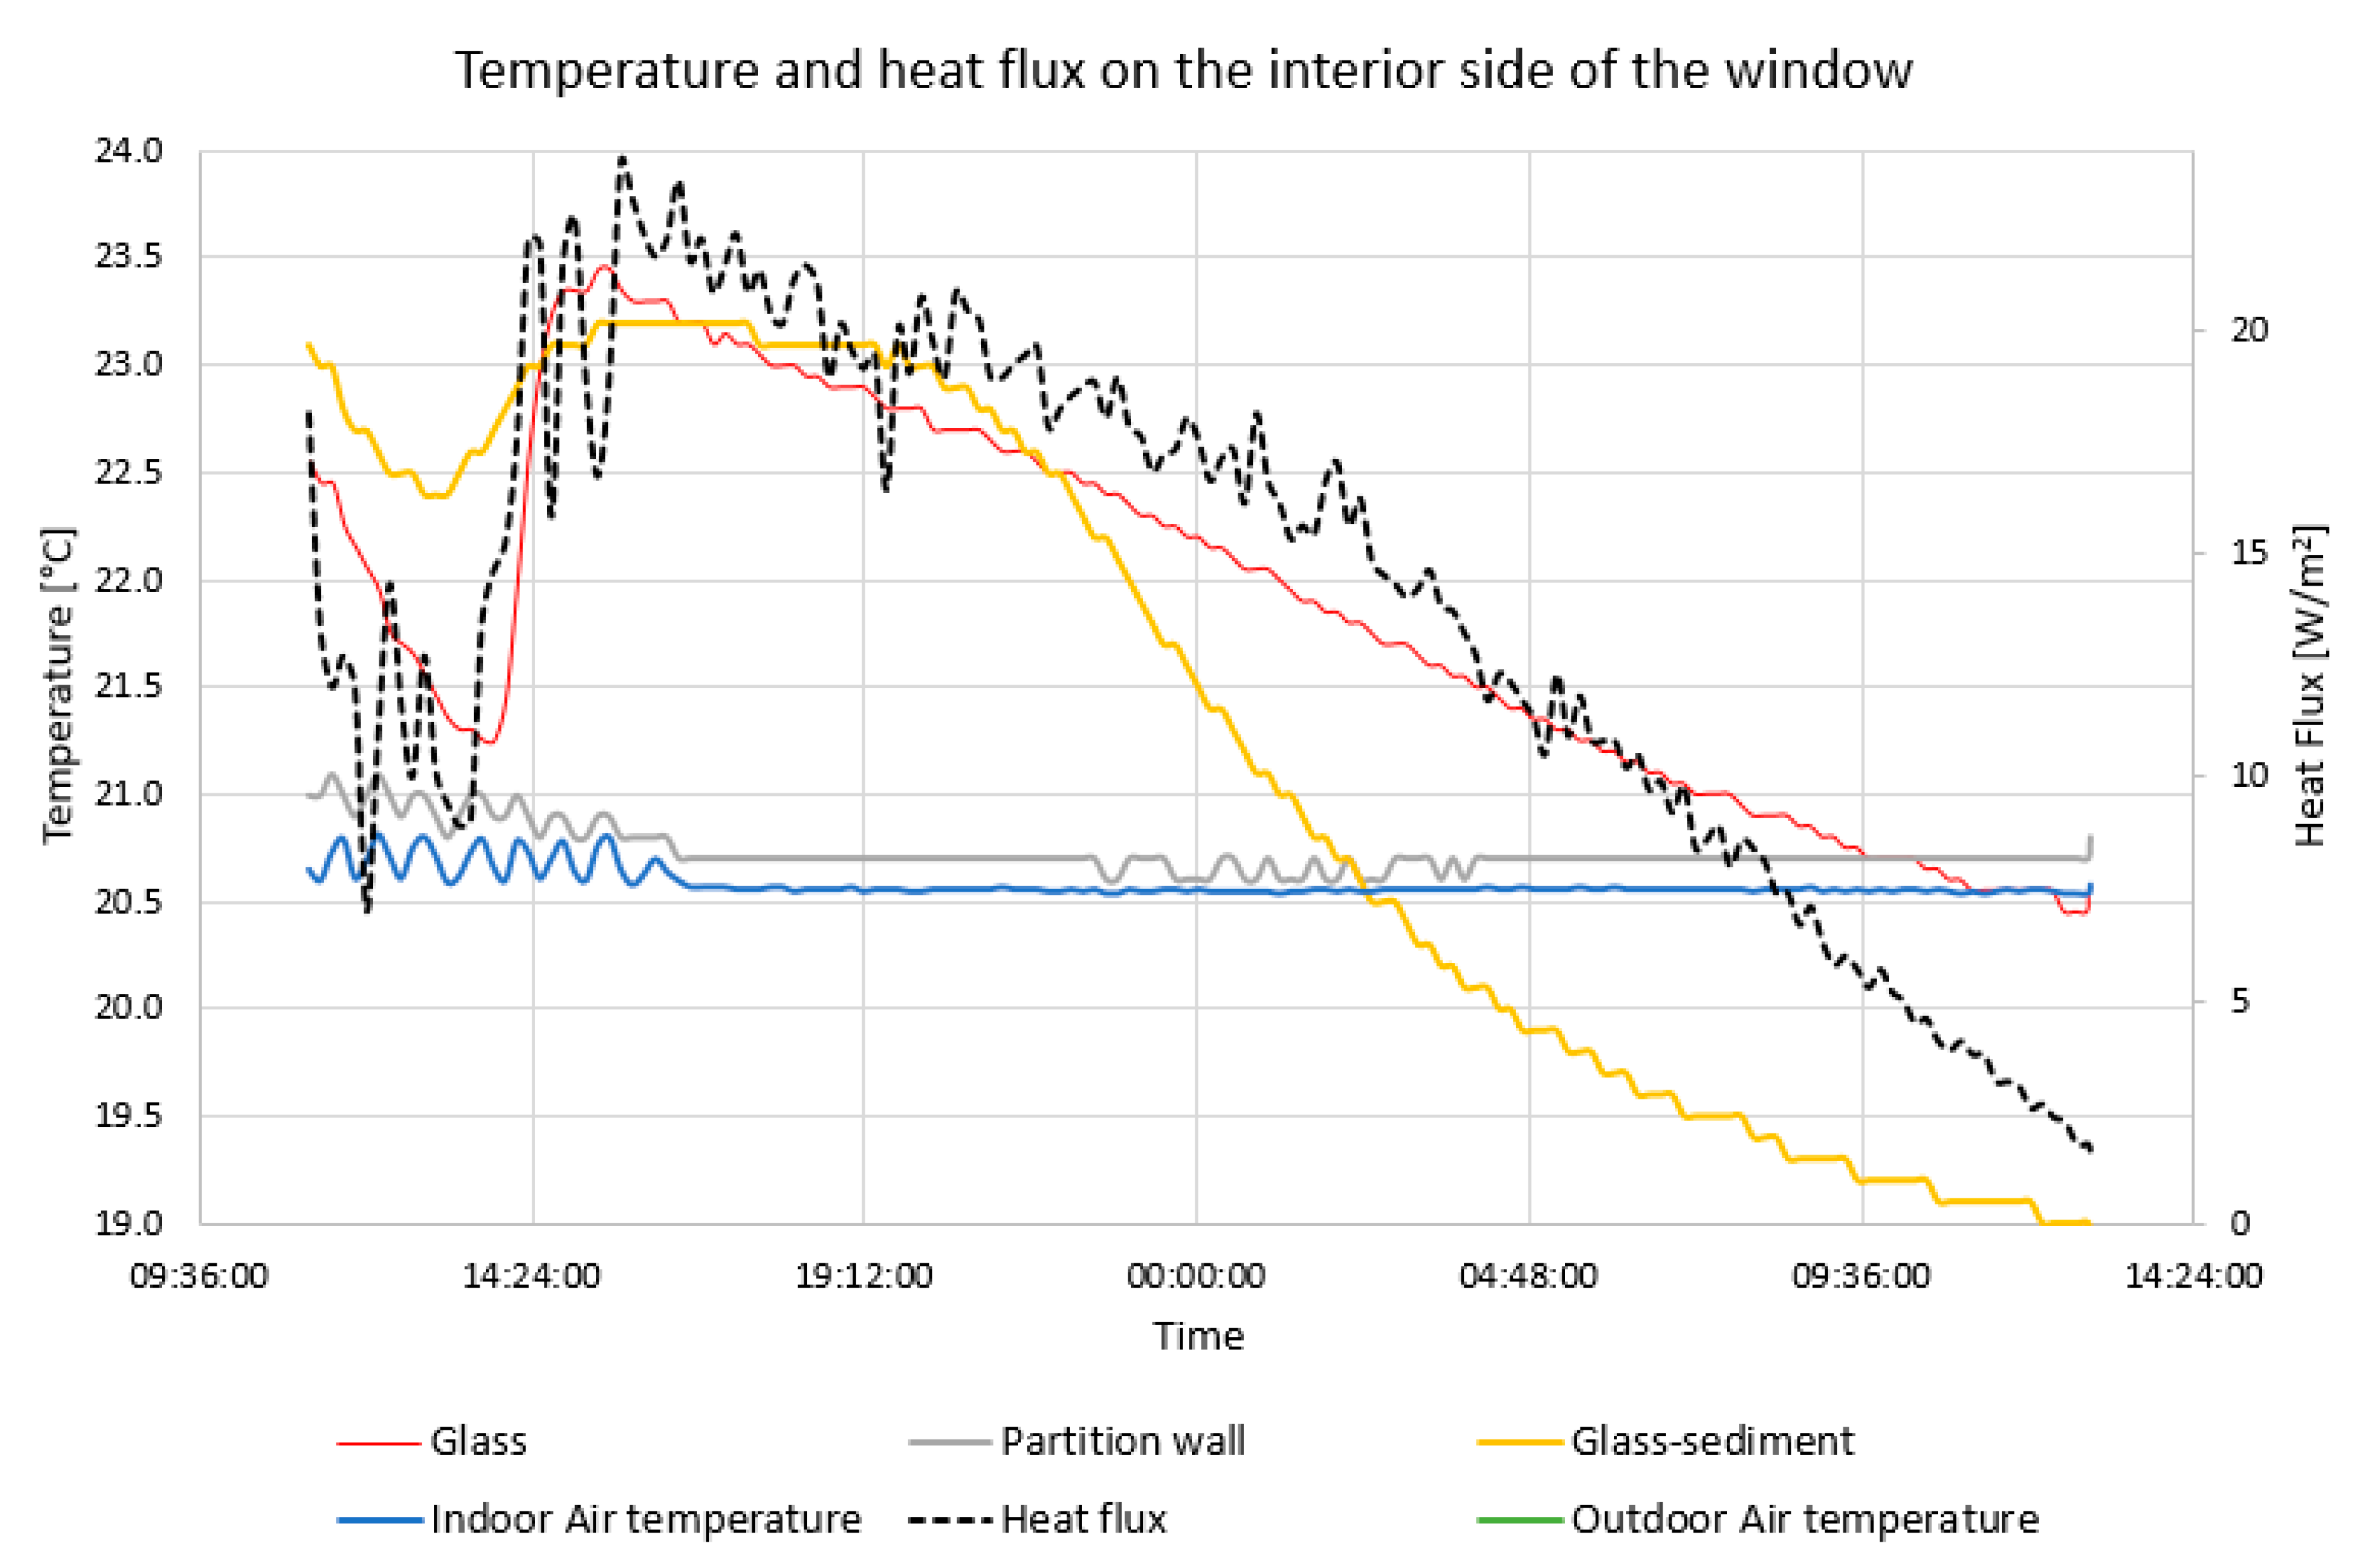
The experiment has been performed on a four-pane window system to investigate the dynamic thermal performance in the summer conditions. The surface temperature and the heat flux were measured on the interior and exterior sides of the sample. In summer conditions with a high outdoor air temperature of 35 °C, the temperature on the interior surface of the PCM window panel fluctuated in the range of about 21–23 °C, which means the overheating risk is avoided and the heat transferred into the room through the PCM window panel is markedly reduced compared with the double glazing system, as described in the simulation model. The air temperature was −15 °C on the exterior side of the window when the solidification process was tested. This measurement confirmed the incongruent melting of the PCM.
The effect of the solar radiation will be the subject of future studies. The results of the simulation model introduced in this study created a flexible model that can be used to inspect the effect of many variables in the building envelope. The PCM window panel reduces heat transfer through the window than the double-glazing panel. The application of the PCM window panel can considerably reduce the need for cooling and reduce overheating in buildings. Nevertheless, it is necessary to report an inappropriate location of the PCM inside the whole space of the window cavity. A nucleation agent or method should be used to place the PCM in order to prevent the formation of sediment in the window.


