Dynamic Integrated Resource Strategic Planning Model: A Case Study of China’s Power Sector Planning into 2050

1
School of Management Science and Engineering, Shanxi University of Finance and Economics, Shanxi 030006, China
2
School of Economics and Management, North China Electric Power University, Beijing 102206, China
3
State Grid Information Centre/State Grid Information & Telecommunication Co., Ltd., Beijing 100761, China
*
Authors to whom correspondence should be addressed.
Sustainability 2017, 9(7), 1177; https://doi.org/10.3390/su9071177
Submission received: 7 June 2017
/
Revised: 28 June 2017
/
Accepted: 3 July 2017
/
Published: 6 July 2017
(This article belongs to the Section Energy Sustainability)
Abstract
:This paper proposes a Dynamic Integrated Resource Strategic Planning (DIRSP) model based on a semi-Markov decision-making process. Considering the policy transfer probability matrix, we discuss the influence of different policy portfolios and input intensity on the timing and scale of low-carbon transition during the power planning process. In addition, we discuss various planning scenarios from a socio-technical system transition perspective. Scenarios are compiled to compare the pathways of power planning in China during 2015–2050 under different policies, including a typical reproduction pathway with unchanged policy that maintains the original coal-dominated technology pathway, a de-alignment/re-alignment pathway where renewable energy power technologies develop from niches to mainstream while the planning time for peak coal power moves ahead in 10–20 years due to subsidies to renewable and carbon tax policy, and the substitution and reconfiguration pathways in which renewable energy technologies compete with coal power in parallel, in which coal power will peak by 2020 while wind power and solar power will realize large-scale development by 2020 and 2030, respectively. Case study on power planning in China indicates that the methodology proposed in our study can enhance our understanding on the low-carbon transition process and the interaction between energy policy and transition pathway.
1. Introduction
Revolution of energy production and consumption, and construction of safe, stable, economic and clean modern energy industry is the only way for China to realize sustainable development. Among which, green and low-carbon power system transition holds the central position [1]. In 2015, China announced that its CO2 emissions will reach its peak in 2030 [2]. In response, the State Council and relevant government departments issued energy and power development planning, smart grid, energy interconnection and other plans for the 13th five-year planning (FYP) period. The Chinese government also introduced electric power system reform, smart grid development guidance, distribution network reconstruction planning and other programs to achieve energy conservation and emissions reduction and comprehensively promote energy and power system optimization.
First, compared with developed countries, for the electrification level or per capita electricity consumption, China’s power industry has a huge development potential. Second, to improve the proportion of clean energy and new energy in the primary energy supply, we should rely on the power industry to realize efficient energy conversion. Third, energy intensity reduction and energy efficiency improvement must be implemented for the specific policy of energy consumption. Finally, China’s power industry is unbalanced, uncoordinated and unsustainably. Therefore, it is necessary to deliver power system transition to achieve sustainable and low-carbon development.
The study of the transition process naturally takes into account the interaction between the technical and economic characteristics of various energy solutions and energy policies (systems), and the impact on the pathways and the effectiveness of energy systems. The impact of energy policy on the energy system is a complex nonlinear process. In view of the long periodicity of the power system transition, because various new energy technologies are still in the immature stage, how should the uncertainty of the new energy technology in the long-term power development planning and power policy optimization be dealt with? How should the cost dynamic characteristics be considered in the power planning? How should the economic costs, and environmental and ecological damage from the development of power planning with the lowest total social costs be better balanced?? Trying to provide some insights on these questions, the paper addresses power planning and power policy optimization by forming a power transition system of “transition pathway-policy interaction-technology optimization-scenario simulation”.
1.1. The Traditional Power Planning
Power planning is an important part of the National Economic Plan. It also plays an important role in promoting the healthy development of the power industry and coordinates the relationship between the power industry and the national economy. Zhong [3] analyzed and summarized the characteristics, methods and experiences of power planning in the United States, Japan, Australia, Russia and Western Europe. It is believed that the power planning should be well-coordinated with energy supply and economic development. Wang [4] argued that power planning should be analyzed for macroeconomic forecast based on the evaluation of various resources. Li et al. [5] considered the environmental factors as vital in power planning to avoid environmental pollution and ecological damage. Other researchers provided a comprehensive analysis and research on the sustainability and reliability of power planning, and discussed a series of problems in power planning under power market conditions [6,7,8,9].
1.2. The Integrated Resource Planning
After the oil crisis in the 1970s, the skyrocketing price of energy led to the rise of generation cost, and the environmental pressure continued to increase. In this context, the traditional power planning method, used to increase the power supply to meet power needs, faced serious challenges. The resources on the demand side, which can reduce electricity consumption and power demand, participate in power planning with the resources on the supply side. The planning idea is known as the integrated resource planning method (IRP) and this method has been widely accepted by majority of scholars and experts.
However, Bakken et al. [10] argued that IRP has lost its microeconomic foundation in the competitive power market, and the power generation enterprises must include the external cost into the total cost system to constantly implement the demand side management. Yilmazi et al. [11] studied IRP from a microscopic perspective, through the optimization model to demonstrate that the access of renewable energy can reduce traditional energy consumption considerably. Malik et al. [12] analyzed IRP in the southern Philippines from the investment perspective and considered that the benefits of implementing demand side management are far greater than the losses caused by insufficient supply. For the China case, Zeng et al. [13] studied the issue of China’s power planning considering demand side management and analyzed the cost advantage of IRP by using linear multi-objective planning. Zeng et al. [14] analyzed the existing problems on the management system and policy mechanisms in the implementation of IRP and put forward corresponding suggestions. Other researchers had also discussed the implementation of IRP in China [15,16,17,18,19,20].
1.3. The Integrated Resource Strategic Planning
With the deepening of power market reform, the monopolistic operation mode of power enterprises has been broken. It cannot meet the conditions for IRP and has also lost the theoretical basis of power demand side management. Hu et al. [21] thus considered the developmental background of power market and expanded the concept of IRP to a national level of Integrated Resource Strategic Planning (IRSP). Zhou et al. [22] constructed the multi-objective IRSP and carried out a case study in China. Hu et al. [23] argued that based on the concept of IRSP, China had significant potentials on energy conservation and emission reduction to create a balance in both power supply and power demand. Hu et al. [24] described the theoretical framework of IRSP combined with smart grid, and established the relevant analytical model for empirical analysis. Zhang et al. [25] thought that China could reduce the amount of carbon emissions through IRSP.
From the above analysis, we have saw that the power planning theory has shifted from the traditional resource planning on the supply side to IRSP, considering both supply and demand sides. However, Chinese researchers mainly focus on the planning method. The planning level is mainly concentrated on IRP and relatively little attention has been paid to IRSP research. Therefore, future research directions should focus on the following.
- (1)
- Dynamism: That is, considering the cost of various power technologies endogenously and dynamically, which is consistent with the cost rising trend of fossil energy in the resource exhaustion background, and also be consistent with the cost downward trend of new energy power technologies by technical learning accumulates.
- (2)
- Multi-objective planning: In the absence of internal accounting systems and standards for the external costs, it is necessary to incorporate the environmental impact of power generation as an objective function into the planning model. This is consistent with the target of “ecological civilization, beautiful China” raised in the 18th Party Congress of China.
- (3)
- Technical granularity elaboration: Future planning should consider a finer granularity for various technologies. This will not only guide practices better but also be conducive to realize the collaborative design of power policies.
This paper constructs a DIRSP model based on semi-Markov decision-making process considering uncertain policy, technology and cost conditions under the power system transition framework. Specifically, the structure of the model and specific optimization process are discussed in detail. The paper conducts a comprehensive case study of power planning in China during 2015–2050 and tries to answer two questions, namely “how to design the transition pathways for power system” and “how to effectively manage the transition process in consideration of the interactions between power policy and power planning”.
The remainder of the paper will be organized as follows: Section 2 provides an overview on transitions pathways and its overall framework. Section 3 presents the DIRSP model based on the semi-Markov decision process. Section 4 presents a case study for power planning in China covering 2015–2050 and Section 5 concludes to the paper.
2. Transition Pathways and Transition Framework
The transition pathway is a process of new technological innovation continuously competing with the current tech-social paradigm. The innovation is caused by both the incumbents and the new entrants in both cumulative and mutated ways and interaction of innovation can be both locally and globally. Thus, the paper divides the transition paths into five categories, including reproduction, transformation, substitution, reconfiguration, and de-alignment/re-alignment [26] (shown in Table 1).
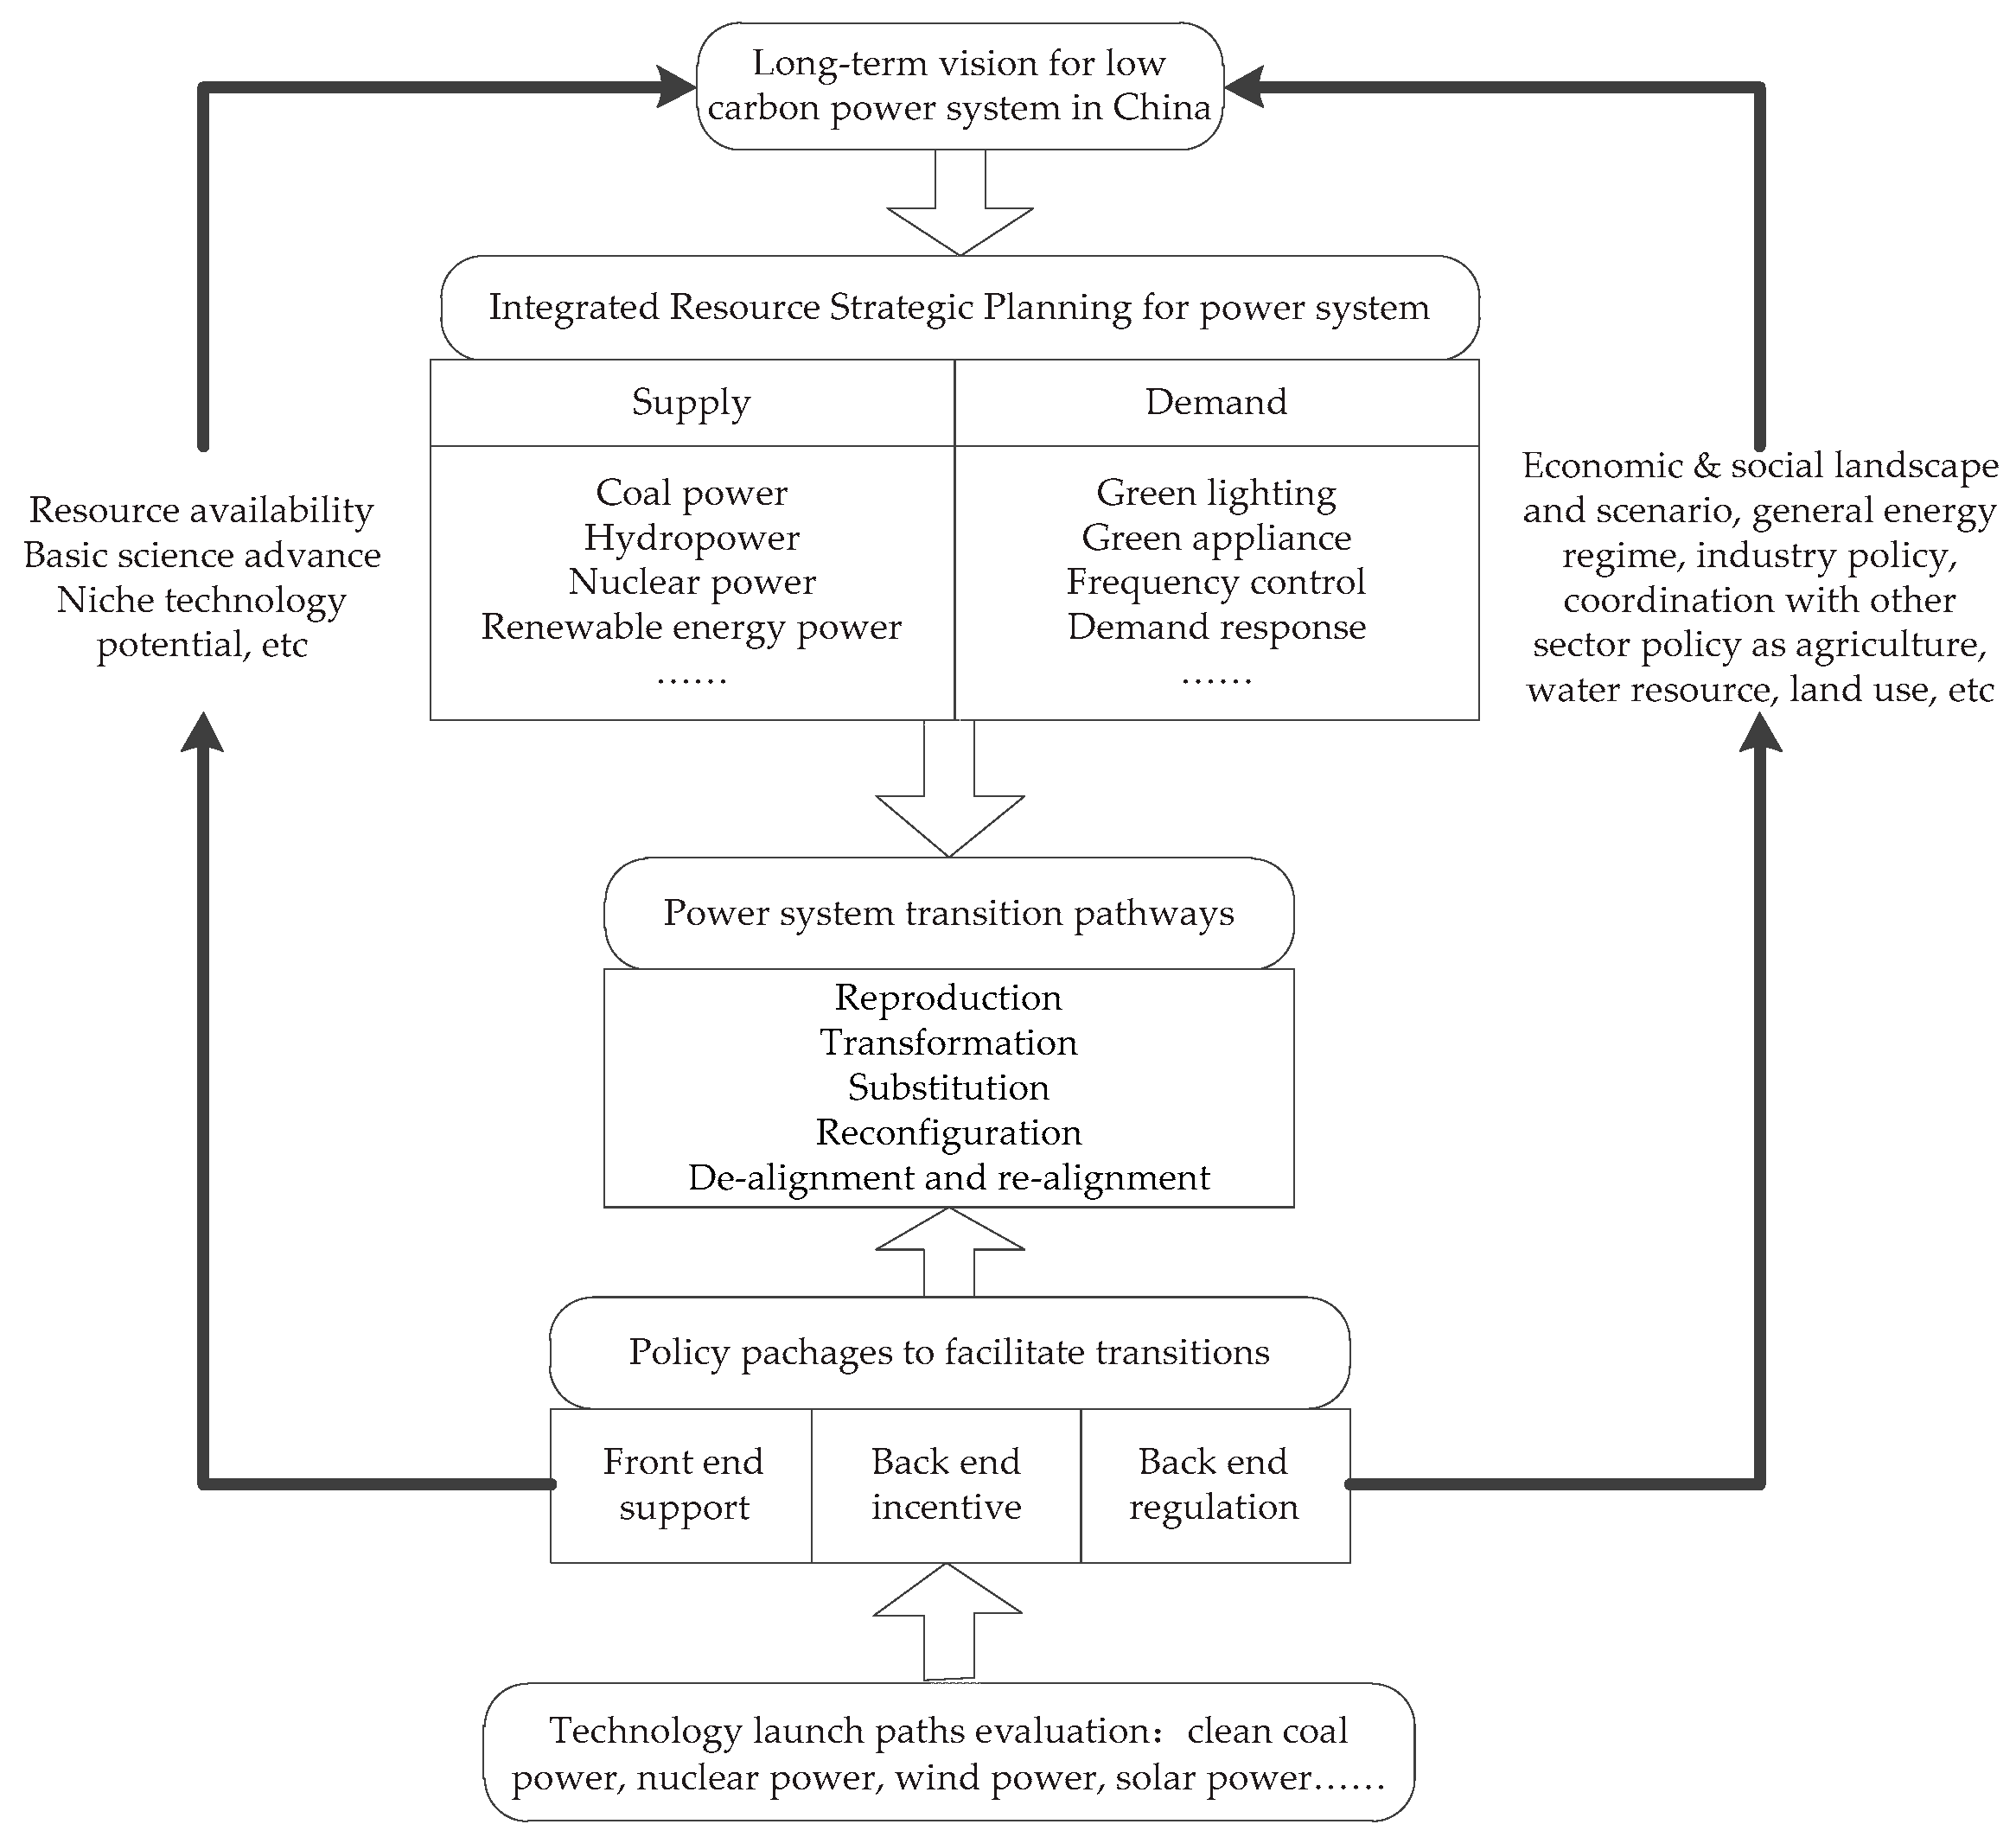
The overall framework for power transition is shown in Figure 1. The framework integrates the “top-down” long-term development vision, “bottom-up” power technology assessment and policy research, as well as the “middle layer” IRSP and implementation paths. The framework also organically integrates the institutional framework, technical pathways, development goals and power policy. For our purpose, in this paper, we focus on power planning under the impacts of energy policy portfolio to study the formation of transition pathways.
3. Dynamic Integrated Resource Strategy Planning Model Based on Semi-Markov Decision Process
Power planning is a dynamic optimization process. On the one hand, due to the power policy, the technical innovation speed and economy of different energy technologies will change endogenously. On the other hand, the power planning objectives will affect the input of energy policy portfolio and individual policy. Therefore, under the uncertainty of policy, technology and cost, power planning optimization is the key issue of the power system transition. In this paper, the dynamic integrated resource strategy planning (DIRSP) model is constructed based on a semi-Markov decision-making process. It considers the collaborative optimization of supply and demand side resources, taking into account the technical learning, economic cost and environmental cost of existing and emerging technologies under the action of policy transfer matrix. This helps to achieve the objectives and paths optimization of power planning in different policy portfolios and policy implementation intensity scenarios. It also assesses the policy adjustment needs and possible space to realize the objectives at various stages.
3.1. Model Analysis
Dynamic planning is one of the most commonly used mathematical models to solve the multi-stage decision optimization problem, which was proposed in the 1950s by American mathematicians, Bellman and his colleagues. The core of the dynamic planning method is the Bellman optimization principle [28]. As an optimal strategy for the whole process, regardless of past state and decisions made previously, subsequent decisions must constitute the optimal strategy. Therefore, dynamic planning has the advantage of turning an N-dimensional optimization problem into N one-dimensional optimization problem, and some additional constraints in the equation can make the solution easier.
Considering the advantages of dynamic planning and IRSP model, this paper establishes a DIRSP model based on semi-Markov decision process. Specifically, it divides the planning period into several stages and uses some heuristic rules to reduce the dimension and calculate the optimal power planning during the whole planning period. That is, achieving the objective of minimum total social costs under the constraints of growth power demand and a variety of technical and economic conditions during the whole planning period.
In this paper, the multi-stage power planning is a dynamic optimization planning, which has a certain initial state, a certain objective and an uncertain intermediate process. Thus, it needs the optimal pathway to the endpoint, and the criterion for the optimal pathway is minimum cost for the whole process. There is a correlation between stages. On the one hand, only achieving the previous stage, the next stage can be continued, and also it is irreversible. On the other hand, due to the time value and different power development level, the capital cost is different at different stages, even with the same decision-making. On this basis, the subsequent strategies will be formed and the objective function value will not be same.
3.2. Model Structure
The power planning is the installed capacity planning set for the minimum total social cost to meet the power demand. Due to the influence of uncertainties, such as policy and technology, the planning process cannot always lead to the optimal solution and may involve many optimization programs. The model structure is shown in Figure 2.
The optimization process of DIRSP model starts from the initial state, by setting the policy transfer probability matrix, to determine the policy set from the current state to the next state, under the influence of different policy sets and different generation costs of power technologies. In the planning process, priority is given to choose lowest cost resources and then choose the resource next to the lowest cost resource and so on to meet the power and load demand. Similarly, the planning iterates under the new policy set in the next planning stage, until the end of the planning period.
3.3. Objective Function of DIRSP Model
Semi-Markov decision-making process (SMDP) provides the basic theoretical support for MDP hierarchical decomposition. MDP only focuses on the order in which the actions are performed, regardless of the time required for action execution. MDP assumes that each action can be completed in a decision period. The number of periods required for SMDP to allow each action execution can be different, even in a probability distribution.
For the power planning, a dynamic optimization model based on multi-stage decision-making process usually includes the following elements:
- (1)
- Stage division: Per the characteristics of power planning, the paper takes the planning period as 2015–2050, with 2015–2020 as the first stage and subsequent 10-year periods as a stage. The investment is completed at the beginning of each year.
- (2)
- State variables: Here, is the state set of power system at the ith stage, state .
- (3)
- Decision-making strategy: The solution to the decision problem is the strategy, that is a mapping from the state set to the action set, i.e., . If adopting the policy set at the ith stage, is the kth policy from the policy set .
- (4)
- State transfer function: It is the evolution process of determining the state from one to another. , among is the probability of the state transferring to the state based on the policy . The random variable indicates the waiting time that the state executes the action . Thus, the state transfer function under the SMDP model gives the joint probability that the state executes the action over the time to transfer to the state .
- (5)
- Define the value function , that is, is the total social costs expectations of the state using the strategy , among is the xth state and is the initial state .
- (6)
- Recursive equation : Express in recursive form as:and,is the minimum total social cost of traditional power plants (TPPs) and energy-efficiency power plant (EPPs) during the planning period, is the ith year and is the end year of the planning, is the serial number of the power plant type, is the total amount of TPPs and EPPs type, is the total number of TPPs type, is the installed capacity for jth plant at ith year for TPPs, and, for EPPs, is peak clipping capacity for jth plant at ith year. is the unit investment cost for jth plant at ith year for EPPs, is the annual value of the initial capital expenditure for TPPs, is the annual value of the operation expenditure for TPPs, is the annual value of tax for TPPs, is annual utilization time (hours) for jth plant at ith year, is own usage rate, is the service life of the plant and r is discount rate. In addition, the levelized cost of electricity (LCOE) for TPPs is influenced by the state transfer function and LCOE as a significant link of state set, policy set and decision set is an important variable in model research.
3.4. Constraints of DIRSP Model
In the DIRSP model, on the one hand, it needs to consider the power demand, load reliability and other constraints to meet the social requirements of electricity. On the other hand, it is necessary to consider the constraints on the upper limits of annual installed capacity for every type of plants and pollutant emissions.
- (1)
- Power demand constraint: For every year during planning period, the sum of the total power generation from TPPs and the electricity conservation from EPPs minus power loss should be no less than the predicted electricity consumption.where N is the number of the type of plants, ηij is auxiliary loss for jth plant at ith year, and Ei is the predicted electricity consumption at ith year. Because EPPs are located on the demand side and electricity saving by them is the final consumption, line loss is not considered for them.
- (2)
- Load reliability constraint: The total installed generation capacity of the power sector, minus power loss during the process of generation, transmission and distribution, should be no less than the predicted power load that can meet the reliability constraint.where is the prediction of power load, which can make the social power to maintain stability for ith year.
- (3)
- Annual installation scale constraint of TPPs: Due to limited resource supply in a certain year and policy limitation, it is impossible to realize mass installation of TPPs in short term. Therefore, in the model limits are set for the annual installation scale of TPPs.where is the upper limit of capacity installation for jth plant at ith year.
- (4)
- Annual installation scale constraint of EPPs: Due to the technology, capital, energy saving potential and other limiting factors, it is also impossible to realize mass installation of EPPs in short term. Therefore, in the model, limits are set for the annual installation scale of various EPPs. For simplicity, we set a proportion of power load consumed by certain type of equipment as the constraint.where is the portion of EPPs in the total load consumed by certain types of equipment and is the prediction of power load for jth equipment at ith year.
- (5)
- Annual installation scale constraint of flexible power plants: From the power output characteristics, the power plants mainly used for dispatching include hydropower plants, pumped storage, coal power, centralized gas power and centralized solar power. In addition, these types of power plants not only operate the power generation but also adjust the power output according to the load curve to satisfy the power demand. Thus, the proportion of annual total installed capacity for flexible power plants cannot be less than the expected amount.where is the capacity installation of TPPs for jth plant at ith year, M is the types of flexible power plant, and is the proportion of flexible power plants in the total installed capacity.
- (6)
- Upper limits of pollutant emissions: The emissions of CO2, SO2 and NOx from fossil power plants should be less than the permitted upper limits every year during the planning period.where , , are the emission factors of CO2, SO2 and NOx, respectively; and , , and are the respective permitted upper limits for emissions of CO2, SO2 and NOx at the ith year.
3.5. Model Algorithm
Dynamic planning is often faced with the problem of “dimension curse.” This means the computational complexity on the dimension in state space increases exponentially. This paper uses the particle swarm-culture algorithm, as shown in Figure 3.
For the particle swarm algorithm, the global optimal value and the individual optimal value share the information to other particles and the information is a one-way flow. The whole searching and updating process is followed by the current optimal solution. Compared with the genetic algorithm, in most cases, all the particles may converge faster in the optimal solution. This is likely to be the local optimal solution, i.e., the “premature” phenomenon [29,30]. Thus, in order to use the faster converge ability, improve the global search ability and overcome early maturing, this paper introduces the particle swarm optimization algorithm into the cultural algorithm.
The particle swarm-culture algorithm consists of the main group space based on the particle swarm and the belief space constrained by the knowledge source. The two spaces can evolve in parallel in their respective groups. The lower-level main group space contributes the elite individual to the upper-level belief space, and the upper-level belief space evolves through four kinds of knowledge and contributes the elite individual to the lower-level group. This then forms a “double evolution-double promotion” mechanism to increase the diversity of particle groups, and avoid the “premature” phenomenon, thus achieving the purpose of improving the accuracy and efficiency of calculation.
In this paper, the idea of particle swarm-culture algorithm is to use the particles in the particle swarm space, after the position and speed evolution for main group space, to choose the better individual by accepting operation into the upper belief space. Then, the individual evolves through the upper constraints to form a guiding opinion and adjust the evolution direction, guide and influence the iteration of the main group space, so that it can be repeated until the iteration number of the whole algorithm is completed.
While the key points of the culture algorithm are designing the main group space and belief space, and the main group space is based on the particle swarm space. The weight and maximum speed are improved in the algorithm. The belief space is another more important aspect in this paper. For the characteristics of the power planning, two kinds of knowledge source constraints, namely, situation knowledge and standardized knowledge, are designed. The situation knowledge mainly refers to the power development policy and the standardized knowledge mainly refers to the power development target, which is used as the judgment criterion to adjust and optimize the power planning process. For example, the current state of power development meets the power target and continues to the next step, and, if it is not satisfied, it dynamically adjusts the corresponding policy tools and policy input until meeting the requirements and then proceeds to the next step.
4. Case Study for Power Planning in China
4.1. Scenario Description
4.1.1. Planning Period and the Resource Type
In our study, 2015 is base year and the planning period is from 2015 to 2050. Planning resources include two types of supply-side TPPs and demand side EPPs. TPPs include coal power, pumped storage, gas power, hydropower, nuclear power, wind power, solar photovoltaic (PV) power, centralized solar power (CSP) and biomass power. EPPs consist of seven types, green lighting, high-efficient motor, energy-saving transformer, frequency control equipment, ice storage air-conditioning (AC), green appliance and demand response. The actual technology of EPPs far exceeds these seven types, but because of the costs and operation of other EPPs being similar with these seven types, to facilitate the simulation, the study classifies other types into similar categories.
4.1.2. Model Parameters
- (1)
- Power demand parameter: Power demand is an important input variable for the planning. From our study in [31] and the actual demand during the past five years, it is predicted that total power consumption will amount to 7740–7989 TWh in 2020, total consumption will amount to 9610–10,539 TWh in 2030, total consumption will amount to 11,000 TWh in 2040 and total consumption will amount to 12,072–12,759 TWh in 2050.
- (2)
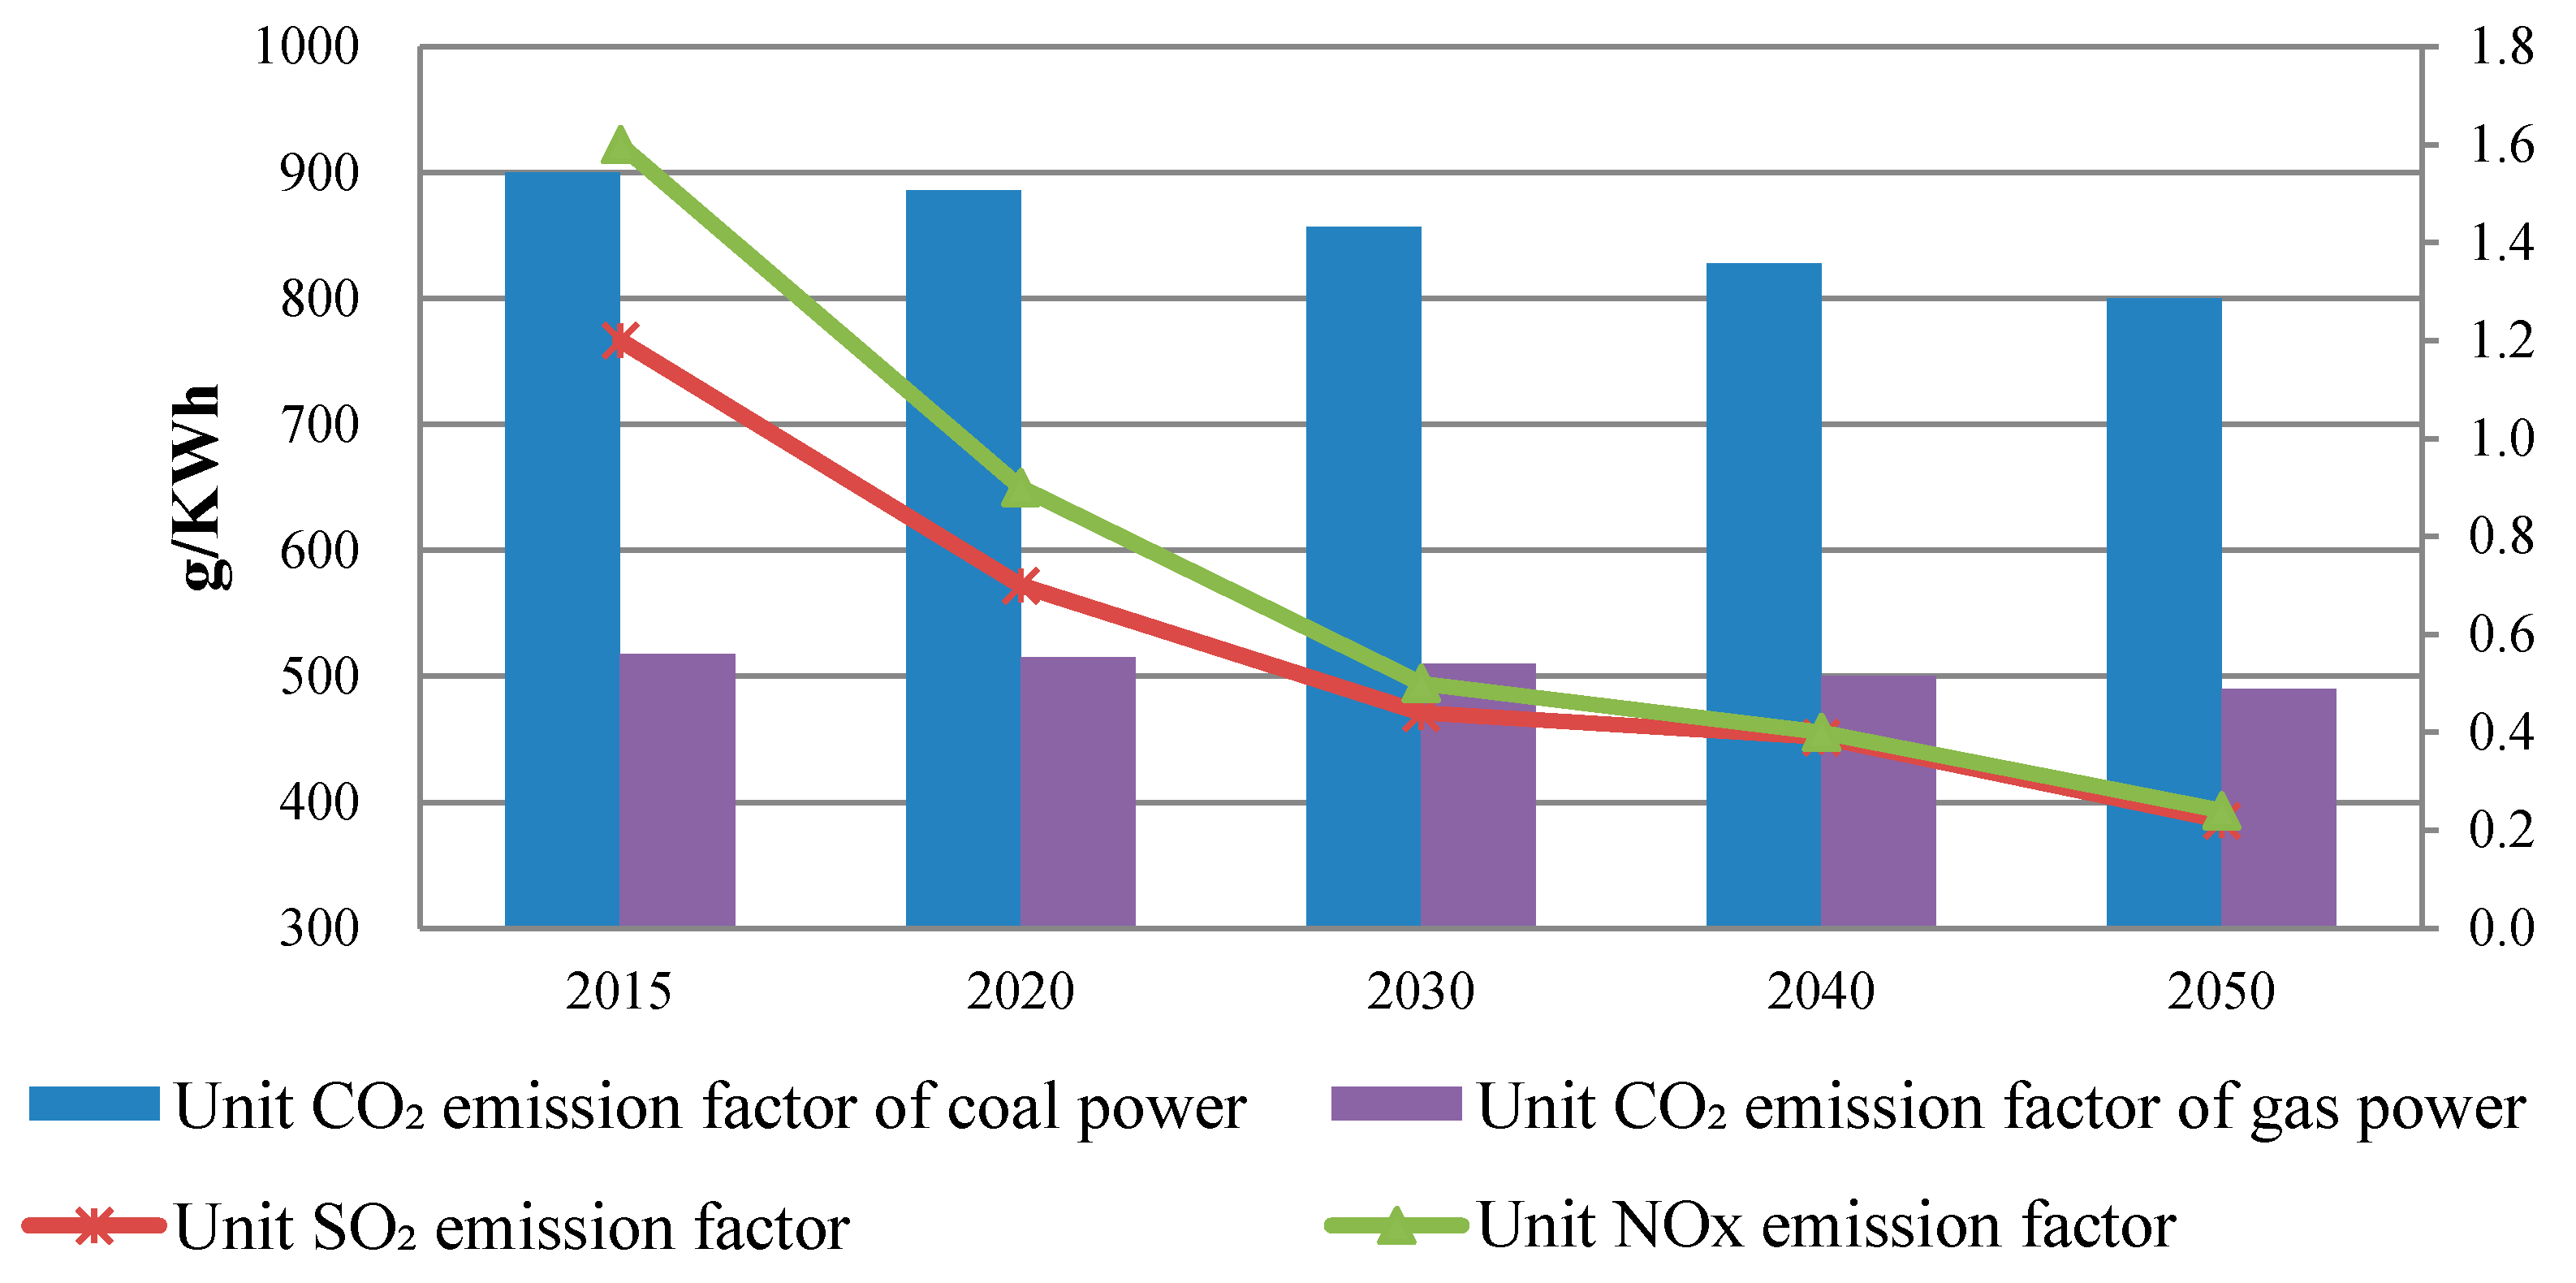
- Environmental parameters: The CO2 emission factors of coal power and gas power are estimated by the CO2 emissions from fuel combustion highlights 2016 [32], and the SO2 and NOx emission factor are sourced from annual development report of power industry in China [33]. The detailed environmental parameters are shown in Figure 4.
- (3)
- Annual operation hour of generation unit: The statistical data of the annual operation hour for TPPs are mainly based on the actual operation of the power plants [34], while for EPPs empirical estimation based on expert experience is used to determine their operation hours.
Table 2 shows some internal cost parameters in 2015. Since the determination of model parameters takes a lot of work, this paper mainly explains the application effect of the DIRSP model and mainly focuses on the comparative analysis. Therefore, the data on the internal cost of TPPs are mainly based on the electrical engineering quota design index in 2015, while the data of EPPs are derived from social surveys and empirical estimates.
4.2. Scenario Assumptions
The purpose of our case study is not simply for the planning of various power plants for the planning period. More importantly, with the variation of related external cost parameters, alternative pathways can be simulated in different scenarios, which can provide reference for the formulation of specific power development policy. Thus, the scenario design should be typical and representative, and refer to the energy development scale and give full consideration to the current development level and various uncertainties.
Scenario 1 (S1): Path 1 does not consider the carbon tax and solar PV tariff subsidies. The coal resource tax and environmental pollution tax have maintained the existing level. Path 2, based on Path 1, takes into account the solar PV tariff subsidies and the subsidies are 0.3, 0.25, 0.22, and 0.2 RMB/KWh in 2020–2050 with further control over the total pollutant emission for SO2 and NOx.
Scenario 2 (S2): Path 1 considers a high level of coal resource tax, environmental pollution tax and solar PV tariff subsidies. In addition, we consider a high level of carbon tax from 2020. Path 2, based on Path 1, incorporates the tariff subsidies for wind power, which are 0.15, 0.10, 0.10, and 0.10 RMB/KWh in 2020–2050.
Scenario 3 (S3): Path 1 considers a medium level of coal resource tax, environmental pollution tax and solar PV tariff subsidies. In addition, we consider a medium level of carbon tax from 2020. Path 2, based on Path 1, assumes that the nuclear power potential can be further developed, and the installed capacity can reach 60, 200, 300, and 400 GW, respectively—an increase in 2, 10, 10, and 20 GW from Path 1.
Scenario 4 (S4): Path 1 considers a low level of coal resource tax, environmental pollution tax and solar PV tariff subsidies. In addition, there is also a low level of carbon tax from 2020 onwards. Path 2, based on Path 1, assumes that the total coal consumption of power sector is limited to 1.43, 1.27, 1.2, and 1.05 billion tce.
4.3. Scenario Results
4.3.1. S1
From Table 3, Path 1 is based on the original policy set assumption in S1 to account for the LCOE, and take the LCOE into the DIRSP model based on the various constraints to plan the installed capacity for different types of power plants at each stage. Since negative incentive policies such as coal resource tax and environmental pollution tax have been maintained at the level of 2015, the policy set has not played a controlling role in the large-scale development of coal power. The LCOE for coal power is still the most economical compared to other power technologies. In Path 1, the installed capacity of coal power in 2030 will reach a peak of 1300 GW, after which it will gradually begin to show a downward trend. Coal power will have a substantial decommissioning during 2030–2040, and then drop to 1110 GW in 2050. As the important base load of power system, the costs of hydropower and nuclear power will be lower than coal power, so the installed capacity will reach their annual upper limits at each stage. As the essential peaking power sources, pumped storage and gas power can support the large-scale development of renewable energy power generation, so the peaking units need to match a certain scale. Due to the high cost of wind power, PV power, CSP and other renewable energy power generation, the installed capacity will reach their annual lower limits at the early planning stages. After 2030, with the positive effects of learn by researching and learn by doing, the economy efficiency of wind power and CSP will enhance unceasingly and the generation cost will be significantly lower than coal power, and begin large-scale development and application. Among them, the wind power will show the growth trend from 2030, but the installed capacity will not reach the upper limit. Further, the CSP units will reach the upper limit in 2030, but the scale of PV power will not increase until 2040. For EPPs, with low cost such as green-lighting, EE motor, green appliance and demand response, the annual installation will grow quickly and reach their annual limits, but with high cost as EE transformer and cool storage AC, there will be no growth. This shows that even with objective of minimizing internal cost, some demand side resources can be included in planning, or market mechanism solely can partly promote the deployment of EPPs.
In Path 2, on the one hand, China has actively implemented the clean power generation and emission control projects to achieve green, efficient and low-carbon development for coal power and control the environmental pollution. On the other hand, PV power will soon occupy the important position of the world’s energy consumption, not only to replace part of the traditional energy but also to become the world’s main energy supply. Thus, PV power will be more favorable policy support and further accelerate the rapid development and large-scale operation. Assuming Path 2 in addition to the original policy tools, the tariff subsidies for PV power will be taken to be 0.3, 0.25, 0.22 and 0.2 RMB/KWh during 2020–2050, and the total amount of pollutant emissions for SO2 and NOx will be further controlled. Through the comparison, it can be found that the installed capacity of coal power for Path 2 will peak in 2030 just like Path 1, but the peak value will reduce by 120 GW. Among these, the capacity will, respectively, reduce by 95.57 and 95.35 GW in path 2 in 2040 and 2050. The strategic position of CSP in China’s power structure is significantly improved and the potential is also huge. Through rapid development and large-scale application, the generation costs rapidly decline. After the low-cost resources are selected, to meet the power load and power demand for the whole society, CSP will begin to be included in the scope of resource selection. The CSP units will be planned at 13 GW in 2020 and the planning time ahead of 10 years than Path 1. In Path 2, due to the rapid decline of the cost for PV power in 2030, the installed capacity would increase by15.85 GW than in Path 1 at the same time, and the planning time will also be 10 years ahead of schedule. Through the optimization of the policy set, there will be 27.1, 347.8, 293.4, and 285.7 KWh in electricity savings during 2020–2050. In addition, through the effective control of pollutant emissions, SO2 emissions in Path 2 will decrease by 0.06, 0.25, 0.17, and 0.1 million tons compared to in Path 1 during 2020–2050, while NOx emissions will decrease by 0, 0.28, 0.17, and 0.1 million tons.
From the above analysis, S1 is a typical reproduction pathway, based on the current socio-technical paradigm, to continue and develop the existing institutional structure and operational model. The subject of the current paradigm will accelerate the application of progressive clean power generation technology and energy efficiency technology, and constantly adjust the paradigm rules to promote the infrastructure construction to deal with the external pressure and internal contradictions, so as to maintain the stability of the existing system. Thus, S1 is still maintaining a coal-based power development pathway, and the coal power as the mainstream supply to ensure the power demand. The installed capacity will have a large-scale development in 2030, reaching a peak of 1300 GW. From the economic point of view, due to the high cost, wind power, solar power and biomass power technologies will develop slowly in the absence of relevant policies to support. Thus, the renewable energy power technologies will be excluded and extruded by the mainstream coal power technology, and the installed capacity will maintain the current development level.
4.3.2. S2
From Table 4, Path 1 is based on the original assumption of S2, namely the high level of coal resource tax, environmental pollution tax, carbon tax and solar PV tariff subsidies, among this, the carbon tax will be levied from 2020. Thus, the LCOE of coal power will rise quickly since 2020. Benefiting from the tariff subsidies policy, the generation costs of PV power show the tendency of rapid decline. Due to the lower generation cost, the hydropower and nuclear power will be selected and included in the planning preferentially. Because of a high level of coal resource tax, environmental pollution tax and carbon tax, the fuel costs of coal power would significantly increase, considering that the external cost to lead the LCOE of coal power would rise quickly and play a certain inhibitory effect of large-scale installation of coal power.
In Path 1, the coal power units will reach a peak of 996 GW in 2020 and reduce to 945 GW in 2030, then down to 800 GW in 2050. With the highlighted prominence of environmental and energy issues, the country’s support for PV power will promote the rapid and healthy development, as well as to improve the market competitiveness for PV power industry. With the expansion of industrial scale and technological progress, the country will gradually reduce the price subsidies. Therefore, this paper assumes that the price subsidies standard is 0.3, 0.25, 0.25, and 0.22 RMB/KWh during 2020–2050. In 2020, the LCOE of PV power is still higher than that of hydropower, nuclear power, coal and wind power, and the installed capacity achieves the permitted lower limits. In 2030, the LCOE of PV power will be significantly lower than that of coal power. With certain market competitiveness, the PV power begins to give priority to the power planning. The installed capacity will rise from 42 GW in 2015 to 269 GW in 2030. In 2040, the economy of PV power will be more prominent, and the installed capacity will rapidly increase and reach the permitted upper limits. In addition, with the cost reduction after 2020, the competitiveness of CSP would have been improved and reached the upper limits. For EPPs, with low cost such as green-lighting, EE motor and demand response, priority into the selection scope of demand side resources and the installed capacity would have reached the upper limits.
In this scenario, such a low level of dispatched power supply can meet the needs of power systems. For instance, this can be seen by analyzing and comparing the power generation structure of several major new energy countries in Europe as published by IEA, including Denmark, Germany, Sweden and Finland. The dispatched power supply resources include four categories of coal power, hydropower (including pumped storage), gas power and CSP. From the 2012 level, in addition to Germany, the proportion of dispatched power generation for the remaining three countries are less than 50%, and the lowest is 48.08% for Denmark. Per the current technology level, the power generation structure of Denmark and other European countries can achieve such a level, indicating that in the scenario, due to several new energy accesses, the proportion of dispatched power is acceptable.
From the above analysis, in the de-alignment/re-alignment pathway of S2, the main paradigm subject is the innovator of technology niches. The deep de-alignment changes bring about the strong impact on the current paradigm, forcing the current paradigm to be eroded and destroyed. The emergence of multiple innovations makes the niches innovators compete with the current paradigm subject on resources, concern and legitimacy. The technology niches, through tackling and breaking, can promote the formation and stability of new socio-technical paradigm systems to replace the current socio-technical paradigm. For S2, the renewable energy power technologies break through the technology blockade, moving from being technology niches to mainstream technology. The installed capacity proportion of coal power is still large but in a series of negative external policies, the economic costs of coal power will gradually increase and electricity prices will no longer have a competitive advantage. Thus, the installed capacity of coal power will reach a peak of 996 GW in 2020 while the generation costs of renewable energy power, under the action of positive incentives such as electricity price subsidies, will gradually reduce. The installation will develop quickly after 2020 and continue to impact the mainstream of coal-based technology path, break through the technical blockade obstacles and force technology path change. Thus, coal power will gradually transform from the electricity provider subject to the capacity provider subject, as the peaking power supply of mainstream renewable energy power path.
4.3.3. S3
In Table 5, Path 1 is based on the original policy set assumptions of S3, levying the medium-level coal resource tax, environmental pollution tax, carbon tax and PV tariff subsidies, where the carbon tax will be levied from 2020 onwards. In Path 1, the installed capacity of coal power will reach a peak of 1020 GW in 2020, then drop to 860 GW in 2050, assuming the price subsidies for PV power are 0.2, 0.15, 0.15, 0.12 RMB/KWh during 2020–2050. The generation costs of PV power will still be higher than hydropower, nuclear power, coal power and wind power during 2015–2020, and the installed capacity of PV power will be consistent with the 2015 level. From 2030, the generation costs of PV power will be lower than coal power and in terms of economic competitiveness, and the PV resources will be selected and included in the power planning, while the installed capacity will rise from 42 GW in 2020 to 244 GW in 2030. The economy of wind power will be slightly better than solar PV power, so the planning time will be 10 years in advance of PV power. The installed capacity will rise from 130 GW in 2015 to 170 GW in 2020, and reach the permitted upper limits of 300 GW in 2030.
In Path 2, as the country encourages the development of clean energy, nuclear power has a natural advantage, and the power grid rarely requires and arranges the nuclear power plants to participate in peaking. Therefore, nuclear power in China’s power industry has played a role in the base load, and it has an important position in China’s future energy supply and demand balance. Assume that in Path 2, in addition to the original policy tools, the development potential of nuclear power further expands, and the permitted upper limits of installed capacity, respectively, can reach 60 GW, 200 GW, 300 GW, and 400 GW during 2020–2050. In the planning process, due to the obvious economy of hydropower and nuclear power, these two kinds of resources will be preferred and included in the planning scope and reach the permitted upper limits annual year. Therefore, in the acceleration development path of nuclear power, in the case other constraints remain unchanged, the additional installed capacity of nuclear power needs to be deducted from the coal power, which has the same effect as base load. During 2020–2050, the installed capacity of coal power in Path 2 will reduce by 11.88 GW, 12.80 GW, 13.52 GW, and 28.60 GW less than in Path 1. In Path 2, the development of coal power will slow down and the electricity gap will be filled in by wind power and PV power, the installed capacity of wind power will increase 9.52 GW compared to Path 1 in 2020, for PV power, it will increase 2.4 GW, 3.11 GW, and 7.73 GW compared to Path 1 during 2030–2050. Through the optimization of the policy set, during 2020–2050, the SO2 emissions will reduce by 0.04, 0.03, 0.02, and 0.03 million tons than in Path 1 and the NOx emissions will decrease by 0.05, 0.03, 0.02, 0.03 million tons than in Path 1.
Based on the above analysis, in the substitution and reconfiguration pathway of S3, it would achieve the substantive change of power structure. In addition to the current paradigm subject, renewable energy power enterprises, as the new participants into the power market through technological innovation, and based on the cumulative change brought about by economic or functional factors, will promote the structure adjustment for the current socio-technical paradigm, thereby leading to competition between the renewable energy power generation technology and current mainstream coal power technology. Therefore, under the influence of coal resource tax, pollutant emission tax, carbon tax and renewable energy electricity price subsidies, S3 shows that coal power will reach a peak in 2020, and after decreases year by year. Wind power and PV power will realize the rapid development in 2020 and 2030, respectively. In the macro background that the country develops the renewable energy, protects the environment and controls the greenhouse gas emissions, the internal and external motivation of renewable energy power will gradually increase to promote adjustment of the original socio-technical paradigm and constantly improve a series of norms, regimes and systems matched with the renewable energy power.
4.3.4. S4
From Table 6, Path 1 is based on the original policy set assumptions of S4, which is the low level of coal resource tax, environmental pollution tax, carbon tax and PV price subsidies. In Path 1, the installed capacity of coal power will reach a peak of 1060 GW, and then decrease to 920 GW in 2050 because of the large-scale units retired during 2040–2050. Through the price subsidies and economic incentives for PV power, assuming the price subsidies are 0.2, 0.1, 0.05, 0.05, and 0.02 RMB/KWh, the generation costs will still be higher than hydropower, nuclear power, coal power and wind power, and the installed capacity will be consistent with the 2015 level during 2015–2020. After 2030, the generation costs of PV power will still be higher than coal power. However, under the constraints of power demand and load balance, PV power will begin to be included in the power planning, and the installed capacity will reach 195 GW, but will not reach the permitted upper limits. Wind power will be 10 years in advance of PV power into the power planning and the installed capacity will reach 132 GW in 2020.
In Path 2, taking into account the growing environment pressure caused by the coal consumption, China has constantly put forward the requirements of coal consumption cap, assuming that, in Path 2, in addition to the original policy tools, the coal consumption of power sector will be restricted by 1.43, 1.27, 1.2, and 1.05 billion tce during 2020–2050. Thus, the installed capacity of coal power will reach by 1050 GW, 1010 GW, 990 GW, and 900 GW during 2020–2050 and reduce by 11.42 GW, 8.73 GW, 21.67 GW, and 12.64 GW compared to in Path 1. The reduction of coal power needs to construct an equal capacity of pump storage and gas power to meet the balance of power system. Pump storage and gas power will both reach the permitted upper limits to satisfy the peaking demand. The electricity vacancies will be filled up by the wind power and PV power, and the installed capacity of wind power in Path 2 will be 22 GW larger than Path 1 in 2020, and PV power will be 8.46 GW, 21.01 GW, 12.25 GW more than Path 1 during 2030–2050. Through the policy optimization, during 2020–2050, electricity will be saved by 32.6, 26.5, 63.8, and 36 KWh, and the SO2 emissions will reduce by 0.04, 0.02, 0.04, and 0.01 million tons than in Path 1, and the NOx emissions will decrease by 0.05, 0.02, 0.04, and 0.01 million tons than in Path 1.
From the above analysis, due to the smaller policy intensity compared with the S2 and S3, the installed capacity of coal power will reach a peak of 1070 GW in 2020, like S3, the wind power will realize a large-scale development from 2020. For PV power, it will start from 2030, but the capacity will be significantly lower than S3. Therefore, driven by the policy portfolio, the economy of renewable energy power technologies will continue to improve to achieve the commercial development and large-scale application in 2030, and get into the mainstream development path with coal power in parallel.
4.3.5. Comprehensive Analysis of Four Scenarios
Based on the scenario analysis in the planning process, the first option is to choose the resources with lowest generation costs, only when the capacity reaches the permitted upper limits, the resources with lower generation costs will be selected. Therefore, because of its low economic costs, resources such as hydropower, nuclear power, energy-saving lamps, energy-saving motor and others will first be included in the scope of power planning, and the renewable energy resources such as wind power and PV power will be included in the planning later due to the high cost. However, the installed capacity of energy-saving transformers, frequency converter and other EPPs will not show an upward trend and keep the 2015 level in the short term because of the higher investment and construction costs.
From the comparison of the four scenarios, in Table 7, for coal power, due to the slow development in S2, the installed capacity proportion accounts for 54.50% and it is reduced by 5.76% compared to S1 in 2020. In 2030, the proportion will be a further decline, accounting for 36.71% and 13.59% less than S1. For wind power, the proportion in the power structure will increase from 6.01% in 2020 to 7.53% in 2030 for S1. However, in S2, the wind power will achieve large-scale commercial applications in 2020, and the proportion in the power structure will increase from 10.61% in 2020 to 11.66% in 2030. For solar PV power, the proportion will maintain the level of less than 2% before 2040 in S1. After the economy has a certain competitive advantage, the proportion will increase to 4.63%. However, in S2, due to the subsidies policy, PV power will achieve the large-scale development and application by 2030 and the proportion will increase significantly from 1.64% in 2020 to 10.46% by 2030. Thus, in 2020–2050, the proportion of non-fossil energy power generation will be 28%, 34%, 38% and 40%, respectively, in S1. However, in S2, the proportion will be 29%, 44%, 46% and 48%. In addition, the proportion of renewable energy power (including wind power, PV power, CSP, biomass power) in S1 will be 8.20%, 12.18%, 26.86% and 30.80%, while in S2 the proportion will reach 13.89%, 25.61%, 35.26% and 38.70%, respectively.
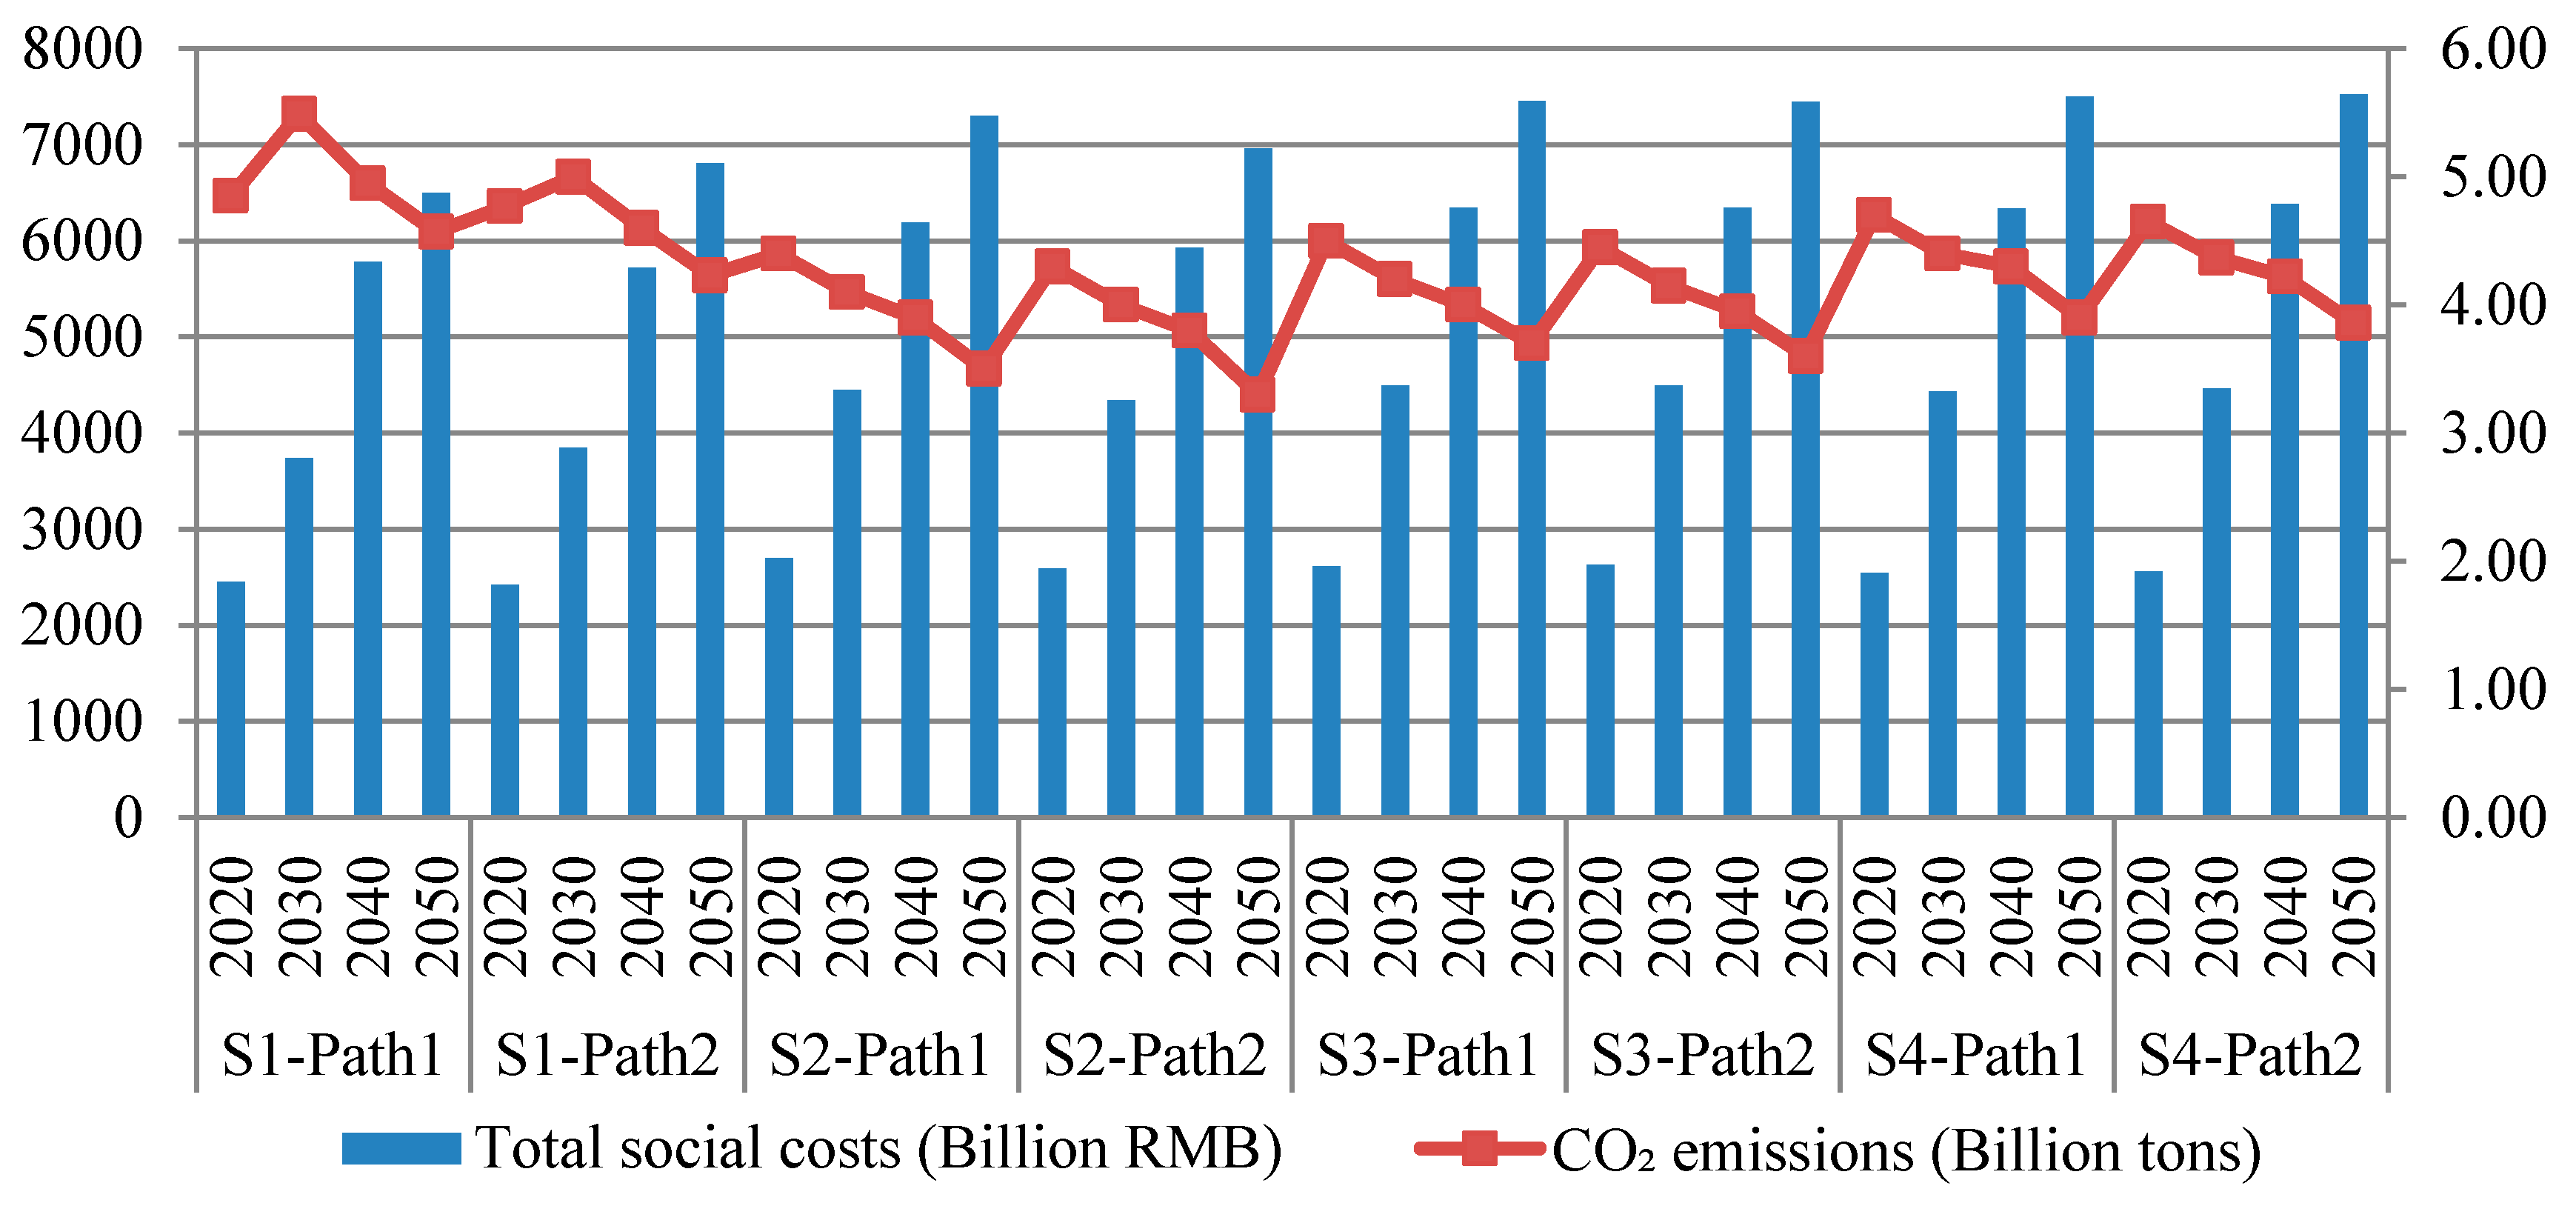
Figure 5 synthetically provides information on the total social costs in all scenarios. In 2020, the wind power and CSP have gradually included into the resource planning for S2, S3 and S4. Taking into account the high investment and construction costs of the emerging power technologies, the total social costs of S2 are the highest and will reach 2696 billion RMB, which are 246, 80, and 156 billion RMB higher than that of S1, S3 and S4, respectively. In 2030, the total social costs of S3 are 757, 48 and 58 billion RMB higher than that of S1, S2 and S4, respectively. Compared with S1, the installed capacity of wind power in other scenarios has reached the upper limit, and the PV power has realized the large-scale development by 2020. Due to the high construction cost of new power technologies, the total social costs are obviously higher. In 2040, the total social costs of S3 are 565, 154 and 11 billion RMB higher than that of S1, S2 and S4, respectively. In 2050, the majority of power sources have reached their upper limit of installed capacity, so the difference of the total social costs is mainly affected by the scale of the coal power and PV power. For S4, the installed capacity of coal power is higher than S2 and S3, and also it has considered the various taxes and external costs, so the total social costs of S4 is the highest by 7499 billion RMB.
Through the analysis and comparison, the evolution trend of CO2 emissions is largely determined by the planning of coal power. The CO2 emissions of S1 will reach the peak of 5.49 billion tons in 2030 and then show a rapid declining trend, and a significant decline in 2050 down to 4.57 billion tons. In S2, the CO2 emissions will reach a peak of 4.4 billion tons in 2020, a decrease of 1.09 billion tons from the peak of S1, and then show a slow decline after 2020, to 2.5 billion tons in 2050. For S3, the CO2 emissions are down from the peak of 4.5 billion tons in 2020 to 3.7 billion tons in 2050. For S4, the CO2 emissions are from the peak of 4.7 billion tons in 2020 down to 3.9 billion tons in 2050. Relative to S1, the CO2 emissions curves in other scenarios are relatively flat.
As a result, S1 would remain as the pathway dominated by coal power. In S2, under the optimization of a different policy portfolio, the input intensity is larger and alters the economic competitiveness between coal power and renewable energy power. The renewable energy technologies break through the technology blockade from niches and develop into mainstream, while coal power facilitates renewable energy deployment, promotes the transition of original socio-technical paradigm and improves the matching institutions and policies. In S3, the policy input intensity is moderate and the installed capacity of coal power would have reached its peak by 2020, while wind and PV will achieve large-scale development by 2020 and 2030, respectively. In S4, the policy input intensity is relatively weak and the development of renewable energy power is slower than in S3. Scenario studies based on DIRSP model clearly identifies the importance of policy intervention in the process of sustainable energy system transition.
4.3.6. Optimal Decision
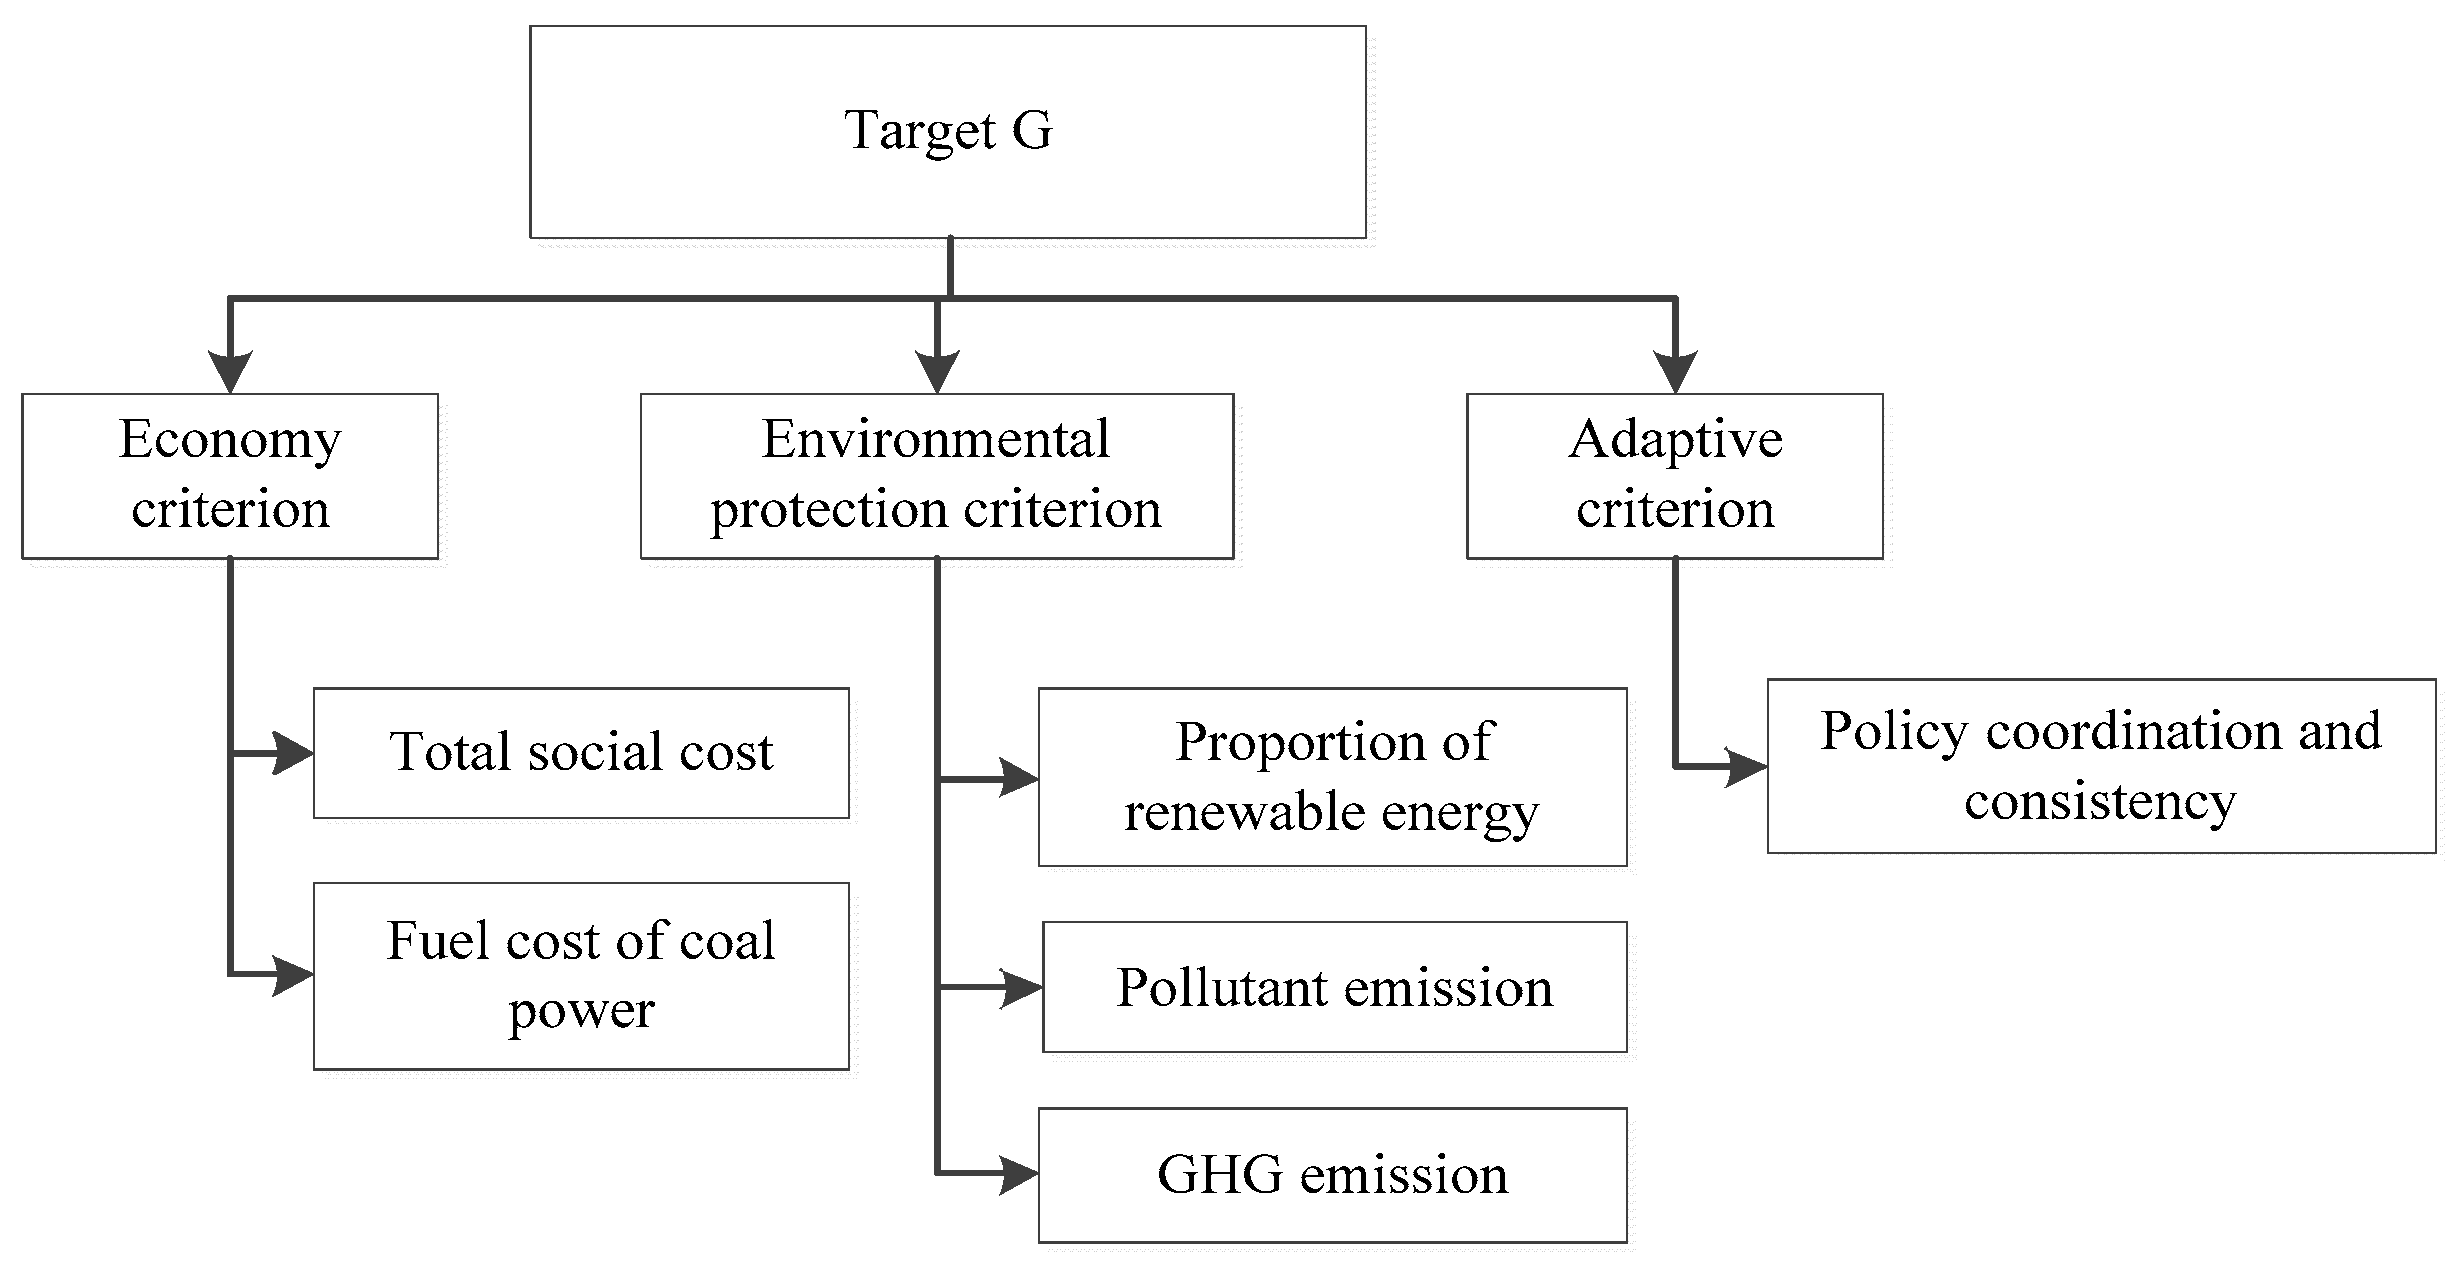
Based on the guidance of the new century energy security concept [35], the paper constructs the multi-attribute power planning decision system (Figure 6), and selects the six indexes, including the total social cost, the fuel cost of coal power, the proportion of renewable energy sources, the pollutant emissions, the GHG emissions and the policy coordination and consistency to determine the optimal decision planning. Through the analysis, the paper recommends S2 as the optimal decision planning to realize the collaborative optimization of power planning, power policy and the power system.
5. Conclusions
Transition to low-carbon energy system is a long and complicated process. To break the lock-in of existing high carbon energy system, new energy technologies must initiate, grow and then develop into the mainstream socio-technical paradigm. To achieving this, policy intervention is necessary to facilitate the entire process. Hence, a systematic method is needed to depict the interactions among technology, policy and transition pathway.
In this paper, we propose a Dynamic Integrated Resource Strategic Planning (DIRSP) model based on a semi-Markov decision-making process. Considering the policy transfer probability matrix, we discuss the influence of different policy portfolios and input intensity on the timing and scale of low-carbon transition during the power planning process. In addition, we discuss various planning scenarios from a socio-technical system transition perspective.
A case study for power planning in China during 2015–2050 is presented in the paper to demonstrate our methodology. Scenarios are compiled to compare the pathways of power planning in China under different policies, including a typical reproduction pathway with unchanged policy that maintains the original coal-dominated technology pathway, a de-alignment/re-alignment pathway where renewable energy power technologies develop from niches to mainstream while the planning time for peak coal power moves ahead in 10–20 years due to subsidies to renewable and carbon tax policy, and the substitution and reconfiguration pathways in which renewable energy technologies compete with coal power in parallel, in which coal power will peak by 2020 while wind power and solar power will realize large-scale development by 2020 and 2030, respectively. Our case results show that, with active policy support to renewable energy and externality remedy policy to discourage coal power at the early stage of the planning, with just moderate increase in the total social cost of power supply, substitution and reconfiguration pathways can be shaped in China’s power sector. The Case study indicates that the methodology proposed in this paper can enhance our understanding on the low-carbon transition process and the interaction between energy policy and transition pathway.
Acknowledgments
The authors would like to thank the anonymous reviewers for their useful comments and suggestions. The work reported in the paper is funded by the National Natural Science Foundation of China (71673085), the Beijing Municipal Social Science Foundation (16YJB027) and Youth Research Foundation of Shanxi University of Finance and Economics (QN-2017008).
Author Contributions
Yan Xu and Jiahai Yuan conducted the analysis and drafted the paper; and Huiming Xu collected the data for analysis.
Conflicts of Interest
The authors declare no conflict of interest.
References
- Yuan, J.; Xu, Y.; Hu, Z.; Yu, Z. Managing electric power system transition in China. Renew. Sustain. Energy Rev. 2012, 16, 5660–5677. [Google Scholar] [CrossRef]
- People Network. China—U.S. Joint Presidential Statement on Climate Change. Available online: http://politics.people.com.cn/n/2014/1112/c70731-26010508.html (accessed on 23 June 2017).
- Zhong, S. Characteristics of Foreign Electric Power Planning and Their Inspiration to China. East China Electr. Power 2010, 35, 1644–1647. [Google Scholar]
- Wang, X. New Philosophy and Method for Power Planning under Market Economy. Electr. Power 1999, 32, 8–10. [Google Scholar]
- Li, B.; Zhu, T.; Zhu, Z. Key Issues and Indicator System of Environmental Impact Assessment for Power Planning. Ecol. Econ. 2009, 12, 86–89. [Google Scholar]
- Cheng, H.; Chen, Z. The new concepts of electric power system planning. East China Electr. Power 1997, 22, 1–3. [Google Scholar]
- Feng, Y.; Ding, M.; Song, Y. Design and application of probabilistic evaluation software for generation planning. Power Syst. Technol. 2004, 28, 6–10. [Google Scholar]
- Elkarmi, F. Load research as a tool in electric power system planning, operation, and control—The case of Jordan. Energy Policy 2008, 36, 1757–1763. [Google Scholar] [CrossRef]
- Giatrakos, G.P.; Tsoutsos, T.D.; Zografakis, N. Sustainable power planning for the island of Crete. Energy Policy 2009, 37, 1222–1238. [Google Scholar] [CrossRef]
- Bakken, J.I.; Nigel, L. Integrated resource planning and enironmental pricing in a competitie and deregulated electricity market. Energy Policy 1995, 24, 239–244. [Google Scholar] [CrossRef]
- Yilmazi, P.; Hocaoglu, M.H.; Konukman, A.E.S. A pre-feasibility case study on integrated resource planning including renewable. Energy Policy 2008, 36, 1223–1232. [Google Scholar] [CrossRef]
- Malik, A.S.; Sumaoy, C.U. A case study of local integrated resource planning. Energy 2003, 28, 711–720. [Google Scholar] [CrossRef]
- Zeng, M.; Zhang, Y.; Wang, H.; Jia, J. A Linear Programming on Resource Combination Optimization Based on Integrated Resources Planning. Autom. Electr. Power Syst. 2007, 31, 24–28. [Google Scholar]
- Zeng, M.; Feng, Y.; Dong, J. Discussion on Comprehensive Electric Power Resources Planning according to Proposals on the Scientific Development Plan for the Electric Power Industry. Electr. Power Technol. Econ. 2007, 19, 5–7. [Google Scholar]
- Zeng, M. Integrated Resource Planning and Motivation Theory and Application; China Economic Press: Beijing, China, 2000; pp. 288–295. [Google Scholar]
- Yang, Z.; Lao, D. Integrated Resource Planning Methodology and Demand Side Management Techniques; China Electric Power Press: Beijing, China, 1996; pp. 1–63. [Google Scholar]
- Quan, S.; Lu, J.; Zeng, M.; Tian, K.; Yang, P. Integrated resource planning experience and enlightenment in developed countries. Power Demand Side Manag. 2009, 11, 77–80. [Google Scholar]
- Zhou, H. Consideration of How Electirc Utilities Use Integrated Resources Planning. Power Demand Side Manag. 2001, 3, 9–11. [Google Scholar]
- Hu, Z. IRP/DSM and Sustainable Development. Power Demand Side Manag. 2000, 2, 5–6. [Google Scholar]
- Kang, C.; Xiang, N.; Xia, Q. An introduction to integrated resource planning and its hot topics. Power Syst. Technol. 1997, 21, 19–24. [Google Scholar]
- Hu, Z. Brief introduction of integrated resources strategy planning. Power Demand Side Manag. 2008, 10, 1–4. [Google Scholar]
- Zhou, J.; Hu, Z.; Tian, J.; Xiao, X. A Power Integrated Resource Strategic Planning Model and Its Application. Autom. Electr. Power Syst. 2010, 34, 19–22. [Google Scholar]
- Hu, Z.; Wen, Q.; Wang, J.; Tan, X.; Nezhad, H.; Shan, B.; Han, X. Integrated Resource Strategic Planning in China. Energy Policy 2010, 38, 4635–4642. [Google Scholar] [CrossRef]
- Hu, Y.; Tan, X.; Yang, F.; Yang, M.; Wen, Q.; Shan, B.; Han, X. Integrated Resource Strategic Planning in China: Case study of energy efficiency in the Chinese power sector. Energy Policy 2010, 38, 6391–6397. [Google Scholar] [CrossRef]
- Zhang, N.; Hu, Z.; Zhou, Y.; Zheng, Y.; Zhang, J. Source-grid-load coordinated planning model considering randomness and fuzziness. Autom. Electr. Power Syst. 2016, 40, 39–44. [Google Scholar]
- Geels, F.W.; Schot, J. Typology of sociotechnical transition pathways. Res. Policy 2007, 36, 399–417. [Google Scholar] [CrossRef]
- Yuan, J.; Xu, Y.; Hu, Z. Delivering power system transition in China. Energy Policy 2012, 50, 751–772. [Google Scholar] [CrossRef]
- Group of Operations Research. Operations Research; Tsinghua University Press: Beijing, China, 2005. [Google Scholar]
- Zeng, T. Research on Substation Planning Based on Particle Swarm of Culture Algorithm. Master’s Thesis, Tianjing University, Tianjing, China, 2008. [Google Scholar]
- Huang, H.; Gu, X.; Liu, M. Research on Cultural Algorithm for Solving Nonlinear Constrained Optimization. Acta Autom. Sin. 2007, 33, 1115–1120. [Google Scholar]
- Yuan, J.; Xu, Y.; Lei, Q. Coal consumption control target in the power sector and implementation policy. Energy China 2015, 37, 11–17. [Google Scholar]
- International Energy Agency. CO2 Emissions from Fuel Combustion Highlights 2016, 2017. Available online: http://www.iea.org/publications/freepublications/publication/CO2-emissions-from-fuel-combustion-highlights-2016.html (accessed on 7 June 2017).
- China Electricity Council. 2015 Annual Development Report of Power Industry in China; China Market Press: Beijing, China, 2015. [Google Scholar]
- China Electricity Council. The Basic Data of Electricity Statistics in 2015, 2016. Available online: http://www.cec.org.cn/guihuayutongji/tongjxinxi/niandushuju/2016-09-22/158761.html (accessed on 7 June 2017).
- Du, W. Energy Revolution for Sustainable Future. J. Beijing Inst. Technol (Soc. Sci. Ed.) 2014, 16, 1–8. [Google Scholar] [CrossRef]
Figure 1.
Transition framework of power system.

Figure 2.
Model Structure.
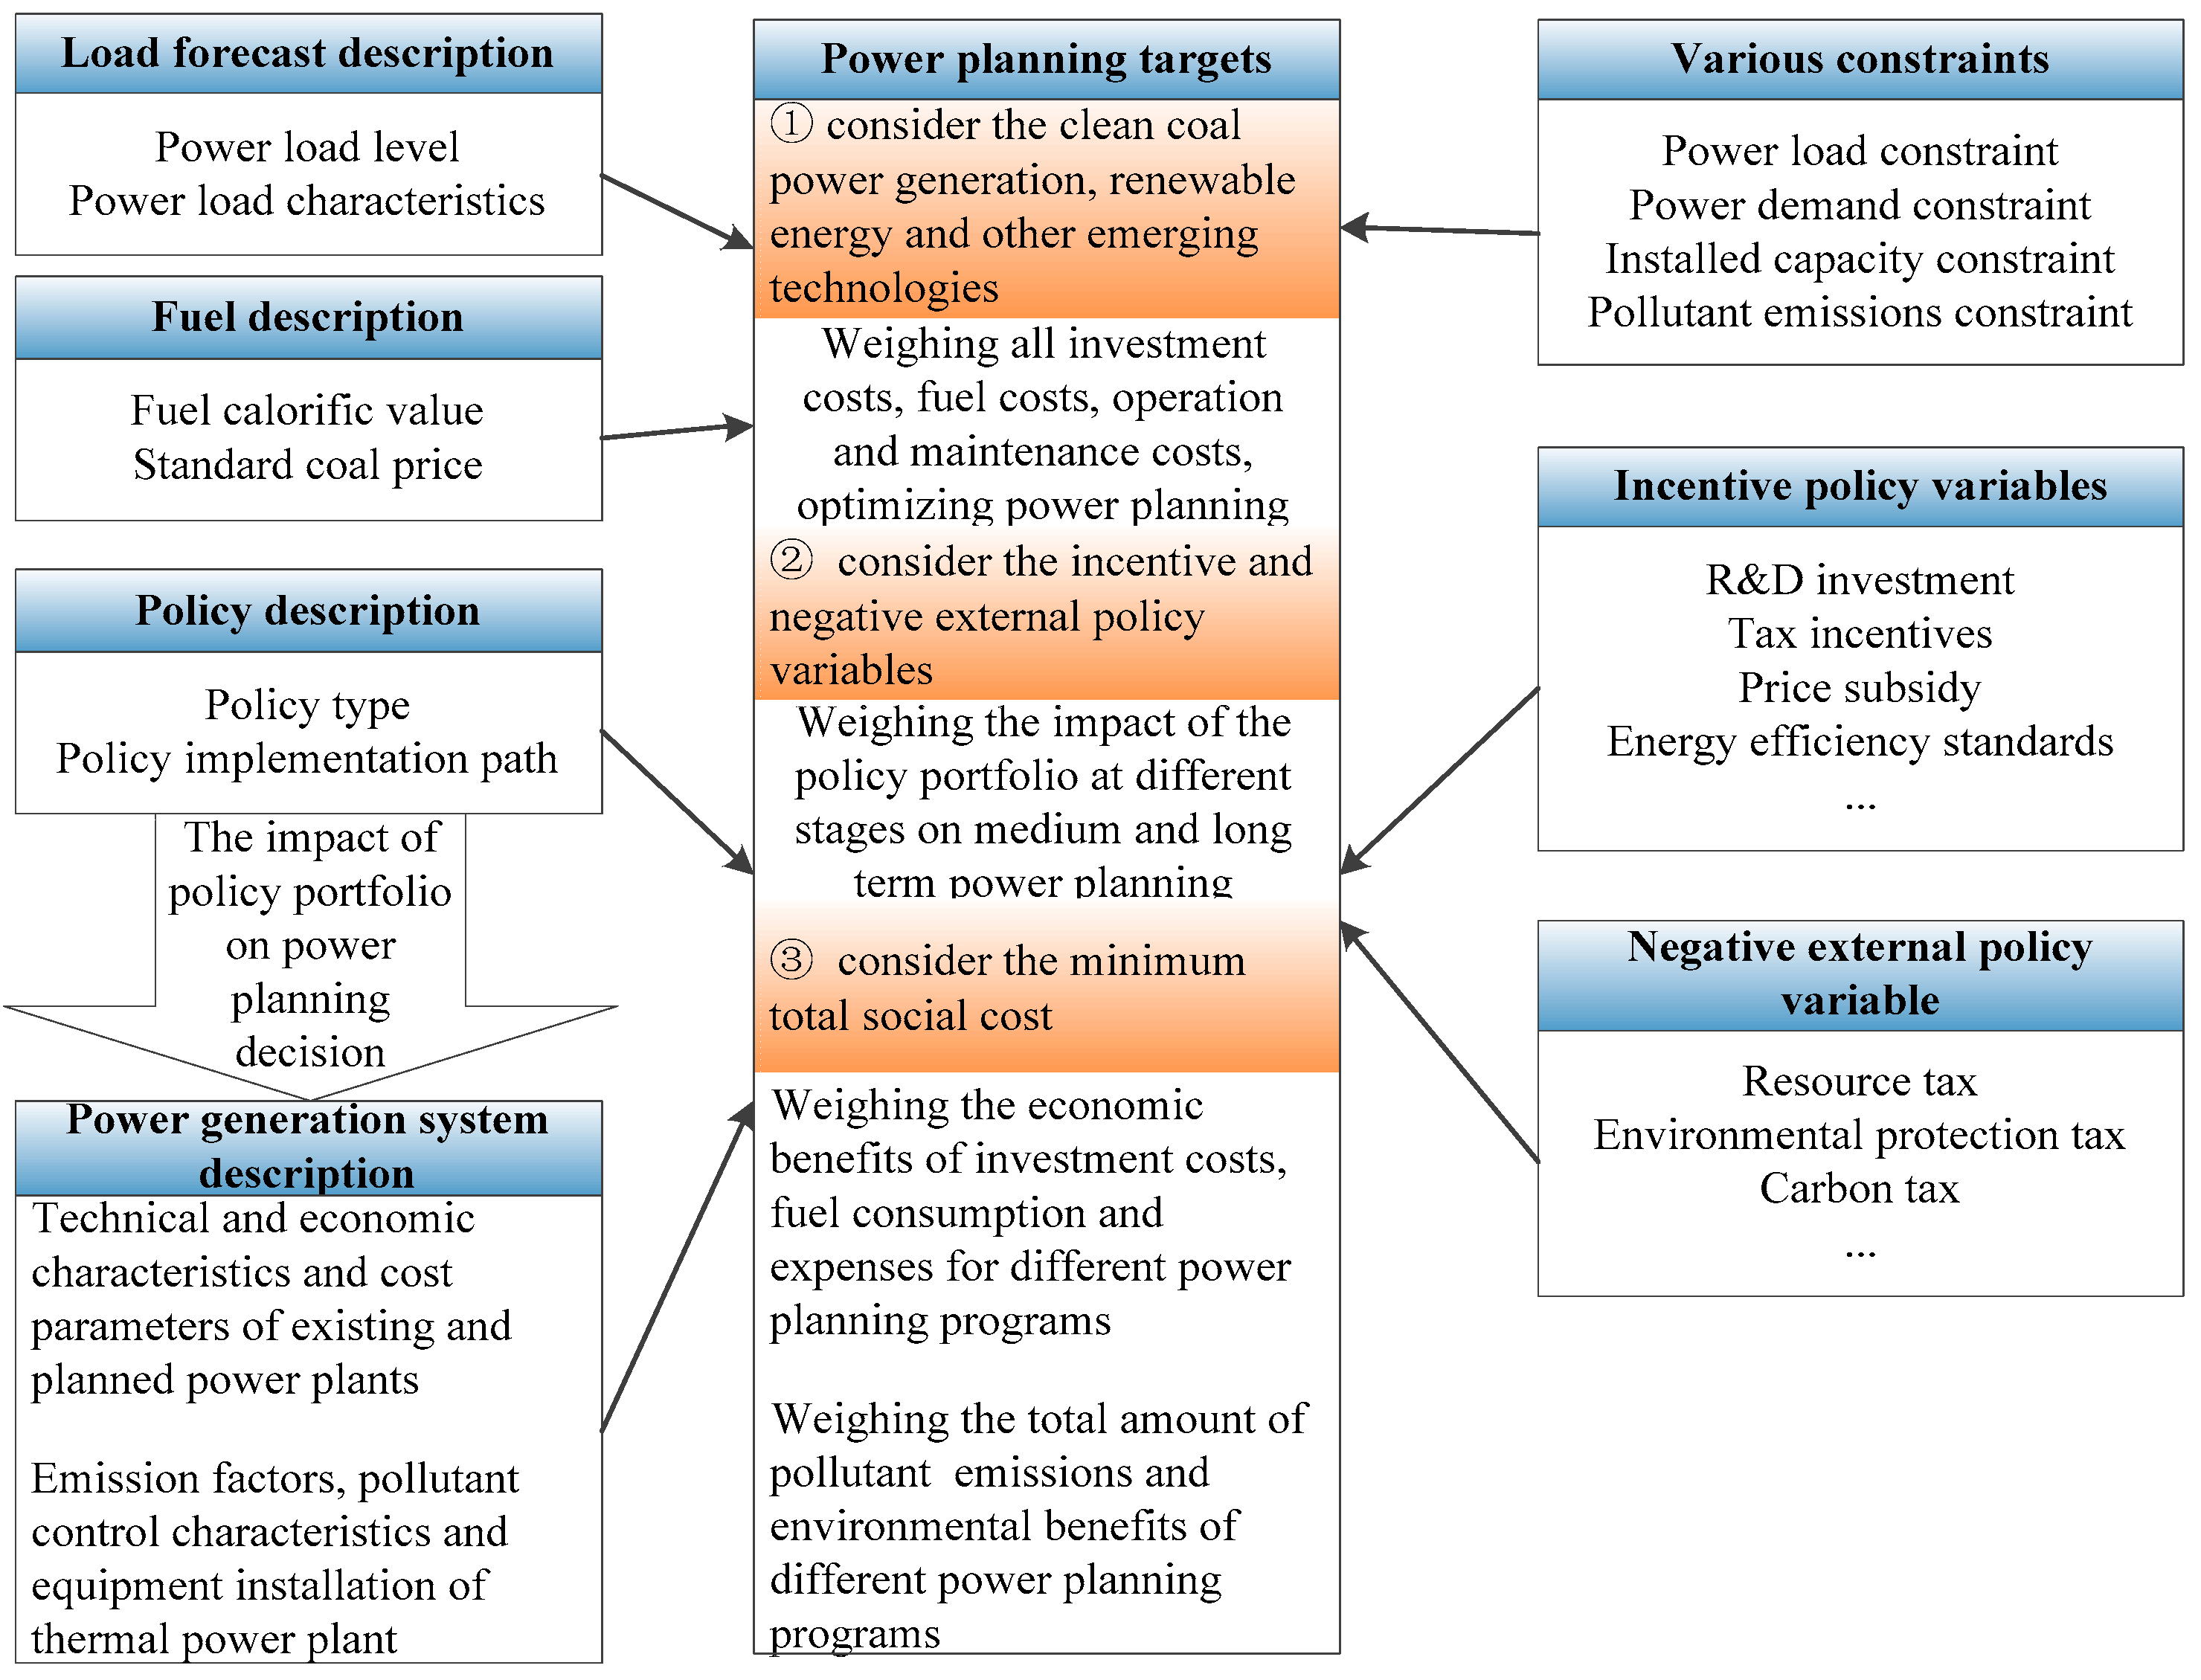
Figure 3.
Algorithm flow of Particle Swarm-Culture.

Figure 4.
Environmental Parameters of thermal power generation during 2015–2050.

Figure 5.
Total social costs and CO2 emissions of four scenarios in 2020–2050.

Figure 6.
Evaluation index for Multiple Attribute Decision System.


| Transition Pathway | Main Subject | Keywords |
|---|---|---|
| Reproduction: efficiency enhancement in coal-based large-scale power system | Current paradigm subject | Self-replication; Paradigm strengthen |
| Transformation: minor modifications to coal-based large-scale power system | Current paradigm subject and Outside groups | External pressure; Institutional power struggle; Paradigm rule adjustment |
| Substitution: technology substitution or power demand substitution within centralized power system | Incumbents and new entrants | Market competition; Power struggles between old and new companies |
| Reconfiguration: major modification to coal-based large-scale power system | Paradigm participants and suppliers | The cumulative changes of economy elements or functional elements result in new combinations and conventions |
| De-alignment and re-alignment: power system coevolves with hydrogen/fuel cell technologies | Niches innovators | Erosion and collapse, multiple innovations, uncertainties and changes to its understanding, new winners and more stability |
| Type | Installed Capacity (GW) | Service Life (Year) | Annual Operation Time (Hour) | Investment of Unit Capacity (RMB/Kw) |
|---|---|---|---|---|
| Hydropower | 296 | 40 | 3500 | 10,000 |
| Pumping | 23 | 25 | 800 | 4000 |
| Coal power | 899 | 30 | 4500 | 3850 |
| Gas power | 65 | 25 | 4000 | 3300 |
| Nuclear power | 27 | 50 | 7500 | 16,000 |
| Wind power | 130 | 20 | 2000 | 7500 |
| PV | 42 | 20 | 1600 | 10,000 |
| CSP | 0 | 20 | 3500 | 20,000 |
| Biomass power | 10 | 20 | 4500 | 7000 |
| Green lighting | 28 | 2 | 2500 | 440 |
| EE motor | 7 | 10 | 4000 | 1440 |
| EE transformer | 8 | 30 | 4000 | 15,200 |
| Frequency control | 8 | 10 | 2500 | 5000 |
| Ice storage AC | 2 | 10 | 800 | 2150 |
| Green appliance | 9 | 10 | 2000 | 3000 |
| Demand response | 18 | 1 | 100 | 0 |
Table 3.
Planning results in S1.
| Path 1 | Path 2 | ||||||||
|---|---|---|---|---|---|---|---|---|---|
| 2020 | 2030 | 2040 | 2050 | 2020 | 2030 | 2040 | 2050 | ||
| Installed capacity (GW) | Hydropower | 360 | 430 | 460 | 480 | 360 | 430 | 460 | 480 |
| Pumping | 60 | 150 | 220 | 300 | 60 | 150 | 220 | 300 | |
| Coal power | 1104 | 1300 | 1194 | 1110 | 1085 | 1175 | 1098 | 1014 | |
| Gas power | 100 | 200 | 270 | 350 | 100 | 200 | 270 | 350 | |
| Nuclear power | 58 | 190 | 290 | 380 | 58 | 190 | 290 | 380 | |
| Wind power | 130 | 195 | 600 | 800 | 130 | 300 | 600 | 800 | |
| Solar PV | 42 | 42 | 154 | 176 | 42 | 58 | 247 | 269 | |
| CSP | 0 | 70 | 110 | 150 | 13 | 70 | 110 | 150 | |
| Biomass power | 10 | 20 | 30 | 40 | 15 | 20 | 30 | 40 | |
| Green lighting | 76 | 120 | 150 | 180 | 76 | 120 | 150 | 180 | |
| EE motor | 7 | 18 | 22 | 25 | 7 | 18 | 22 | 25 | |
| EE transformer | 8 | 8 | 8 | 8 | 8 | 8 | 8 | 8 | |
| Frequency control | 8 | 8 | 8 | 8 | 8 | 8 | 8 | 8 | |
| Ice storage AC | 2 | 4 | 5 | 6 | 2 | 4 | 5 | 6 | |
| Green appliance | 9 | 12 | 37 | 43 | 9 | 12 | 37 | 43 | |
| Demand response | 30 | 40 | 50 | 60 | 30 | 40 | 50 | 60 | |
| SO2 emission/million tons | 3.95 | 2.96 | 2.50 | 1.38 | 3.89 | 2.71 | 2.33 | 1.28 | |
| NOx emission/million tons | 5.00 | 3.36 | 2.56 | 1.50 | 5.00 | 3.08 | 2.39 | 1.40 | |
Table 4.
Planning results in S2.
| Path 1 | Path 2 | ||||||||
|---|---|---|---|---|---|---|---|---|---|
| 2020 | 2030 | 2040 | 2050 | 2020 | 2030 | 2040 | 2050 | ||
| Installed capacity (GW) | Hydropower | 360 | 430 | 460 | 480 | 360 | 430 | 460 | 480 |
| Pumping | 60 | 150 | 220 | 300 | 60 | 150 | 220 | 300 | |
| Coal power | 996 | 945 | 909 | 805 | 973 | 919 | 882 | 748 | |
| Gas power | 100 | 200 | 270 | 350 | 100 | 200 | 270 | 350 | |
| Nuclear power | 58 | 190 | 290 | 380 | 58 | 190 | 290 | 380 | |
| Wind power | 194 | 300 | 600 | 800 | 200 | 300 | 600 | 800 | |
| Solar PV | 42 | 269 | 430 | 472 | 47 | 294 | 456 | 527 | |
| CSP | 15 | 70 | 110 | 150 | 15 | 70 | 110 | 150 | |
| Biomass power | 15 | 20 | 30 | 40 | 15 | 20 | 30 | 40 | |
| Green lighting | 76 | 120 | 150 | 180 | 76 | 120 | 150 | 180 | |
| EE motor | 7 | 18 | 22 | 25 | 7 | 18 | 22 | 25 | |
| EE transformer | 8 | 8 | 8 | 8 | 8 | 8 | 8 | 8 | |
| Frequency control | 8 | 8 | 8 | 8 | 8 | 8 | 8 | 8 | |
| Ice storage AC | 2 | 4 | 5 | 6 | 2 | 4 | 5 | 6 | |
| Green appliance | 9 | 12 | 37 | 43 | 9 | 12 | 37 | 43 | |
| Demand response | 30 | 40 | 50 | 60 | 30 | 40 | 50 | 60 | |
| SO2 emission/million tons | 3.59 | 2.25 | 2.00 | 1.08 | 3.51 | 2.20 | 1.96 | 1.03 | |
| NOx emission/million tons | 4.62 | 2.55 | 2.06 | 1.18 | 4.52 | 2.50 | 2.01 | 1.12 | |
Table 5.
Planning results in S3.
| Path 1 | Path 2 | ||||||||
|---|---|---|---|---|---|---|---|---|---|
| 2020 | 2030 | 2040 | 2050 | 2020 | 2030 | 2040 | 2050 | ||
| Installed capacity (GW) | Hydropower | 360 | 430 | 460 | 480 | 360 | 430 | 460 | 480 |
| Pumping | 60 | 150 | 220 | 300 | 60 | 150 | 220 | 300 | |
| Coal power | 1020 | 970 | 936 | 862 | 1008 | 958 | 922 | 834 | |
| Gas power | 100 | 200 | 270 | 350 | 100 | 200 | 270 | 350 | |
| Nuclear power | 58 | 190 | 290 | 380 | 60 | 200 | 300 | 400 | |
| Wind power | 171 | 300 | 600 | 800 | 180 | 300 | 600 | 800 | |
| Solar PV | 42 | 244 | 404 | 416 | 42 | 247 | 407 | 424 | |
| CSP | 15 | 70 | 110 | 150 | 15 | 70 | 110 | 150 | |
| Biomass power | 15 | 20 | 30 | 40 | 15 | 20 | 30 | 40 | |
| Green lighting | 76 | 120 | 150 | 180 | 76 | 120 | 150 | 180 | |
| EE motor | 7 | 18 | 22 | 25 | 7 | 18 | 22 | 25 | |
| EE transformer | 8 | 8 | 8 | 8 | 8 | 8 | 8 | 8 | |
| Frequency control | 8 | 8 | 8 | 8 | 8 | 8 | 8 | 8 | |
| Ice storage AC | 2 | 4 | 5 | 6 | 2 | 4 | 5 | 6 | |
| Green appliance | 9 | 12 | 37 | 43 | 9 | 12 | 37 | 43 | |
| Demand response | 30 | 40 | 50 | 60 | 30 | 40 | 50 | 60 | |
| SO2 emission/million tons | 3.67 | 2.30 | 2.05 | 1.14 | 3.63 | 2.27 | 2.03 | 1.11 | |
| NOx emission/million tons | 4.72 | 2.61 | 2.10 | 1.24 | 4.67 | 2.58 | 2.08 | 1.21 | |
Table 6.
Planning results in S4.
| Path 1 | Path 2 | ||||||||
|---|---|---|---|---|---|---|---|---|---|
| 2020 | 2030 | 2040 | 2050 | 2020 | 2030 | 2040 | 2050 | ||
| Installed capacity (GW) | Hydropower | 360 | 430 | 460 | 480 | 360 | 430 | 460 | 480 |
| Pumping | 60 | 150 | 220 | 300 | 60 | 150 | 220 | 300 | |
| Coal power | 1068 | 1021 | 1017 | 919 | 1056 | 1013 | 995 | 907 | |
| Gas power | 100 | 200 | 270 | 350 | 100 | 200 | 270 | 350 | |
| Nuclear power | 60 | 190 | 290 | 380 | 60 | 190 | 290 | 380 | |
| Wind power | 132 | 300 | 600 | 800 | 154 | 300 | 600 | 800 | |
| Solar PV | 42 | 195 | 325 | 361 | 42 | 203 | 346 | 373 | |
| CSP | 15 | 70 | 110 | 150 | 15 | 70 | 110 | 150 | |
| Biomass power | 15 | 20 | 30 | 40 | 15 | 20 | 30 | 40 | |
| Green lighting | 76 | 120 | 150 | 180 | 76 | 120 | 150 | 180 | |
| EE motor | 7 | 18 | 22 | 25 | 7 | 18 | 22 | 25 | |
| EE transformer | 8 | 8 | 8 | 8 | 8 | 8 | 8 | 8 | |
| Frequency control | 8 | 8 | 8 | 8 | 8 | 8 | 8 | 8 | |
| Ice storage AC | 2 | 4 | 5 | 6 | 2 | 4 | 5 | 6 | |
| Green appliance | 9 | 12 | 37 | 43 | 9 | 12 | 37 | 43 | |
| Demand response | 30 | 40 | 50 | 60 | 30 | 40 | 50 | 60 | |
| SO2 emission/million tons | 3.83 | 2.40 | 2.19 | 1.19 | 3.79 | 2.38 | 2.15 | 1.18 | |
| NOx emission/million tons | 4.92 | 2.73 | 2.25 | 1.30 | 4.88 | 2.71 | 2.21 | 1.29 | |
Table 7.
Power structure of four scenarios in 2015–2050.
| % | S1 | S2 | ||||||||
|---|---|---|---|---|---|---|---|---|---|---|
| 2015 | 2020 | 2030 | 2040 | 2050 | 2015 | 2020 | 2030 | 2040 | 2050 | |
| Hydropower | 20.91 | 19.65 | 16.64 | 13.82 | 12.68 | 20.90 | 19.69 | 16.71 | 13.86 | 12.71 |
| Pumping | 1.66 | 3.28 | 5.80 | 6.61 | 7.92 | 1.66 | 3.28 | 5.83 | 6.63 | 7.94 |
| Coal power | 60.23 | 60.26 | 50.30 | 35.87 | 29.31 | 60.25 | 54.50 | 36.71 | 27.38 | 21.31 |
| Gas power | 4.33 | 5.46 | 7.74 | 8.11 | 9.24 | 4.32 | 5.47 | 7.77 | 8.13 | 9.27 |
| Nuclear power | 2.06 | 3.17 | 7.35 | 8.71 | 10.04 | 2.06 | 3.17 | 7.38 | 8.74 | 10.06 |
| Wind power | 7.93 | 6.01 | 7.53 | 18.03 | 21.13 | 7.93 | 10.61 | 11.66 | 18.08 | 21.18 |
| Solar PV | 2.16 | 1.64 | 1.16 | 4.63 | 4.65 | 2.16 | 1.64 | 10.46 | 12.96 | 12.49 |
| CSP | 0.00 | 0.00 | 2.71 | 3.31 | 3.96 | 0.00 | 0.82 | 2.72 | 3.31 | 3.97 |
| Biomass power | 0.72 | 0.55 | 0.77 | 0.90 | 1.06 | 0.72 | 0.82 | 0.78 | 0.90 | 1.06 |
| S3 | S4 | |||||||||
| Hydropower | 20.90 | 19.68 | 16.70 | 13.86 | 12.70 | 20.90 | 19.67 | 16.69 | 13.85 | 12.70 |
| Pumping | 1.66 | 3.28 | 5.83 | 6.63 | 7.94 | 1.66 | 3.28 | 5.82 | 6.62 | 7.94 |
| Coal power | 60.25 | 55.77 | 37.69 | 28.19 | 22.82 | 60.25 | 58.33 | 39.65 | 30.61 | 24.32 |
| Gas power | 4.32 | 5.47 | 7.77 | 8.13 | 9.26 | 4.32 | 5.46 | 7.76 | 8.13 | 9.26 |
| Nuclear power | 2.06 | 3.17 | 7.38 | 8.74 | 10.06 | 2.06 | 3.28 | 7.38 | 8.73 | 10.05 |
| Wind power | 7.93 | 9.35 | 11.65 | 18.07 | 21.17 | 7.93 | 6.71 | 11.65 | 18.06 | 21.16 |
| Solar PV | 2.16 | 1.64 | 9.49 | 12.17 | 11.02 | 2.16 | 1.64 | 7.56 | 9.79 | 9.55 |
| CSP | 0.00 | 0.82 | 2.72 | 3.31 | 3.97 | 0.00 | 0.82 | 2.72 | 3.31 | 3.97 |
| Biomass power | 0.72 | 0.82 | 0.78 | 0.90 | 1.06 | 0.72 | 0.82 | 0.78 | 0.90 | 1.06 |
© 2017 by the authors. Licensee MDPI, Basel, Switzerland. This article is an open access article distributed under the terms and conditions of the Creative Commons Attribution (CC BY) license (http://creativecommons.org/licenses/by/4.0/).
Share and Cite
MDPI and ACS Style
Xu, Y.; Yuan, J.; Xu, H. Dynamic Integrated Resource Strategic Planning Model: A Case Study of China’s Power Sector Planning into 2050. Sustainability 2017, 9, 1177. https://doi.org/10.3390/su9071177
AMA Style
Xu Y, Yuan J, Xu H. Dynamic Integrated Resource Strategic Planning Model: A Case Study of China’s Power Sector Planning into 2050. Sustainability. 2017; 9(7):1177. https://doi.org/10.3390/su9071177
Chicago/Turabian StyleXu, Yan, Jiahai Yuan, and Huiming Xu. 2017. "Dynamic Integrated Resource Strategic Planning Model: A Case Study of China’s Power Sector Planning into 2050" Sustainability 9, no. 7: 1177. https://doi.org/10.3390/su9071177
Note that from the first issue of 2016, this journal uses article numbers instead of page numbers. See further details here.