1. Introduction
One of the pillars of the European energy and climate change policy is the creation of the internal energy market. Third party access, unbundling and liberalisation are the basis of this approach [
1]. Energy would flow freely across borders, so that customers would be indifferent as to the source of their supplies, and suppliers would compete across the entire European market. However, after several liberalisations of the electricity market, the evolution of the energy price has not been as expected and the energy policies from the different countries do not agree to clarify the future competitiveness of the sector. Furthermore, the EU States are developing different energy and climate policies in the framework of Kyoto Protocol [
2]. The policies can be considered complementary if each tool is aimed at correcting a market failure or overlapping if they reduce the overall effects that each instrument stand-alone could generate in the market. Several such works study these interactions between energy and climate policies [
3,
4,
5,
6,
7].
For example, the EU Emissions Trading System (EU ETS) for CO
2, which is a cornerstone of the European Union’s policy to combat climate change, is a cost-effective tool for reducing greenhouse gas emissions [
8]. It covers about half of CO
2 emissions in all EU member states, 40% of total greenhouse emissions, and involves about 11,500 factory installations [
9]. This system works on the “cap and trade” principle. An annual “cap”, or limit, is set on the total amount of certain greenhouse gases that can be overall emitted. The allowances are allocated to individual installations, such that the sum of the allowances does not exceed the cap [
10]. The European Union Allowances (EUAs) give polluters the right to emit one tonne of CO
2. Emitters that chose to pollute more than the allowances they received, have to purchase extra allowances in the open market from firms that used less EUAs than they received and vice versa. Despite being auctioned off from 2013 onwards, EUAs were granted for free to firms during the initial two phases of the EU ETS (2005–2012). Oestreich and Tsiakas [
10] found that firms that received free EUAs during the first years of the scheme significantly outperformed firms that did not. This “carbon premium”, mainly explained by the higher cash flows due to the free allocation of EUAs, was present for an initial transitional period and considered as one-off event. On the other hand, Lund et al. [
11] estimated that the impact on the total cost remained below 2% for almost all the industries subjected to the EU ETS during the period 2008–2012, considering both the direct cost related to CO
2 reduction requirements and the indirect increase in the electricity price. However, the influence on stock market returns was not analysed. In this sense, Bushnell et al. [
12] demonstrated that in response to the dramatic allowance price drop in April 2006 (50%), stock prices also fell for firms in carbon and electricity intensive industries directly and indirectly related to EU ETS. They concluded that investors are more concerned with the potential revenue reduction of emissions trading on product prices (as firms passed through the opportunity costs of EUAs obtained for free), rather than just the negative compliance costs, which is contrary to the climate change mitigating intention of the EU ETS. They also suggest that, although for clean firms in dirty industries revenue effects are larger than the increase in regulatory costs, those firms directly or even indirectly impacted by CO
2 costs may need little compensation and that it is their customers who will be most affected.
In this sense, the ETS Directive states that the industries considered to be exposed to a significant risk of “carbon leakage”, receive special treatment to support their competitiveness [
13]. This term refers to the sectors likely to relocate their installations to other more-flexible countries in terms of climate policies. However, State Members are not obliged to make effective this compensation or to establish a minimum incentive. The controversial effects of this policy on carbon leakage and industry competitiveness are being criticised [
14,
15]. If these sectors cannot dilute the additional costs incurred through the establishment of more efficient processes or higher selling prices, these expenses would have a direct impact in their profitability and competitiveness. It is crucial to ensure that the CO
2 emissions reduction is not the result of a slow deindustrialisation [
1]. Therefore, energy price, uncertainty in energetic legislation and capital availability are substantial limitations that affect energy intensive industries in Europe. A strategic energy management is essential nowadays to maintain the economic competitiveness of energy intensive industries [
16]. The energy-intensive manufacturing industries, need to analyse not only the technical aspects, but also the current and future situation of the electric energy market in Europe, with the aim of ensuring long term sustainability.
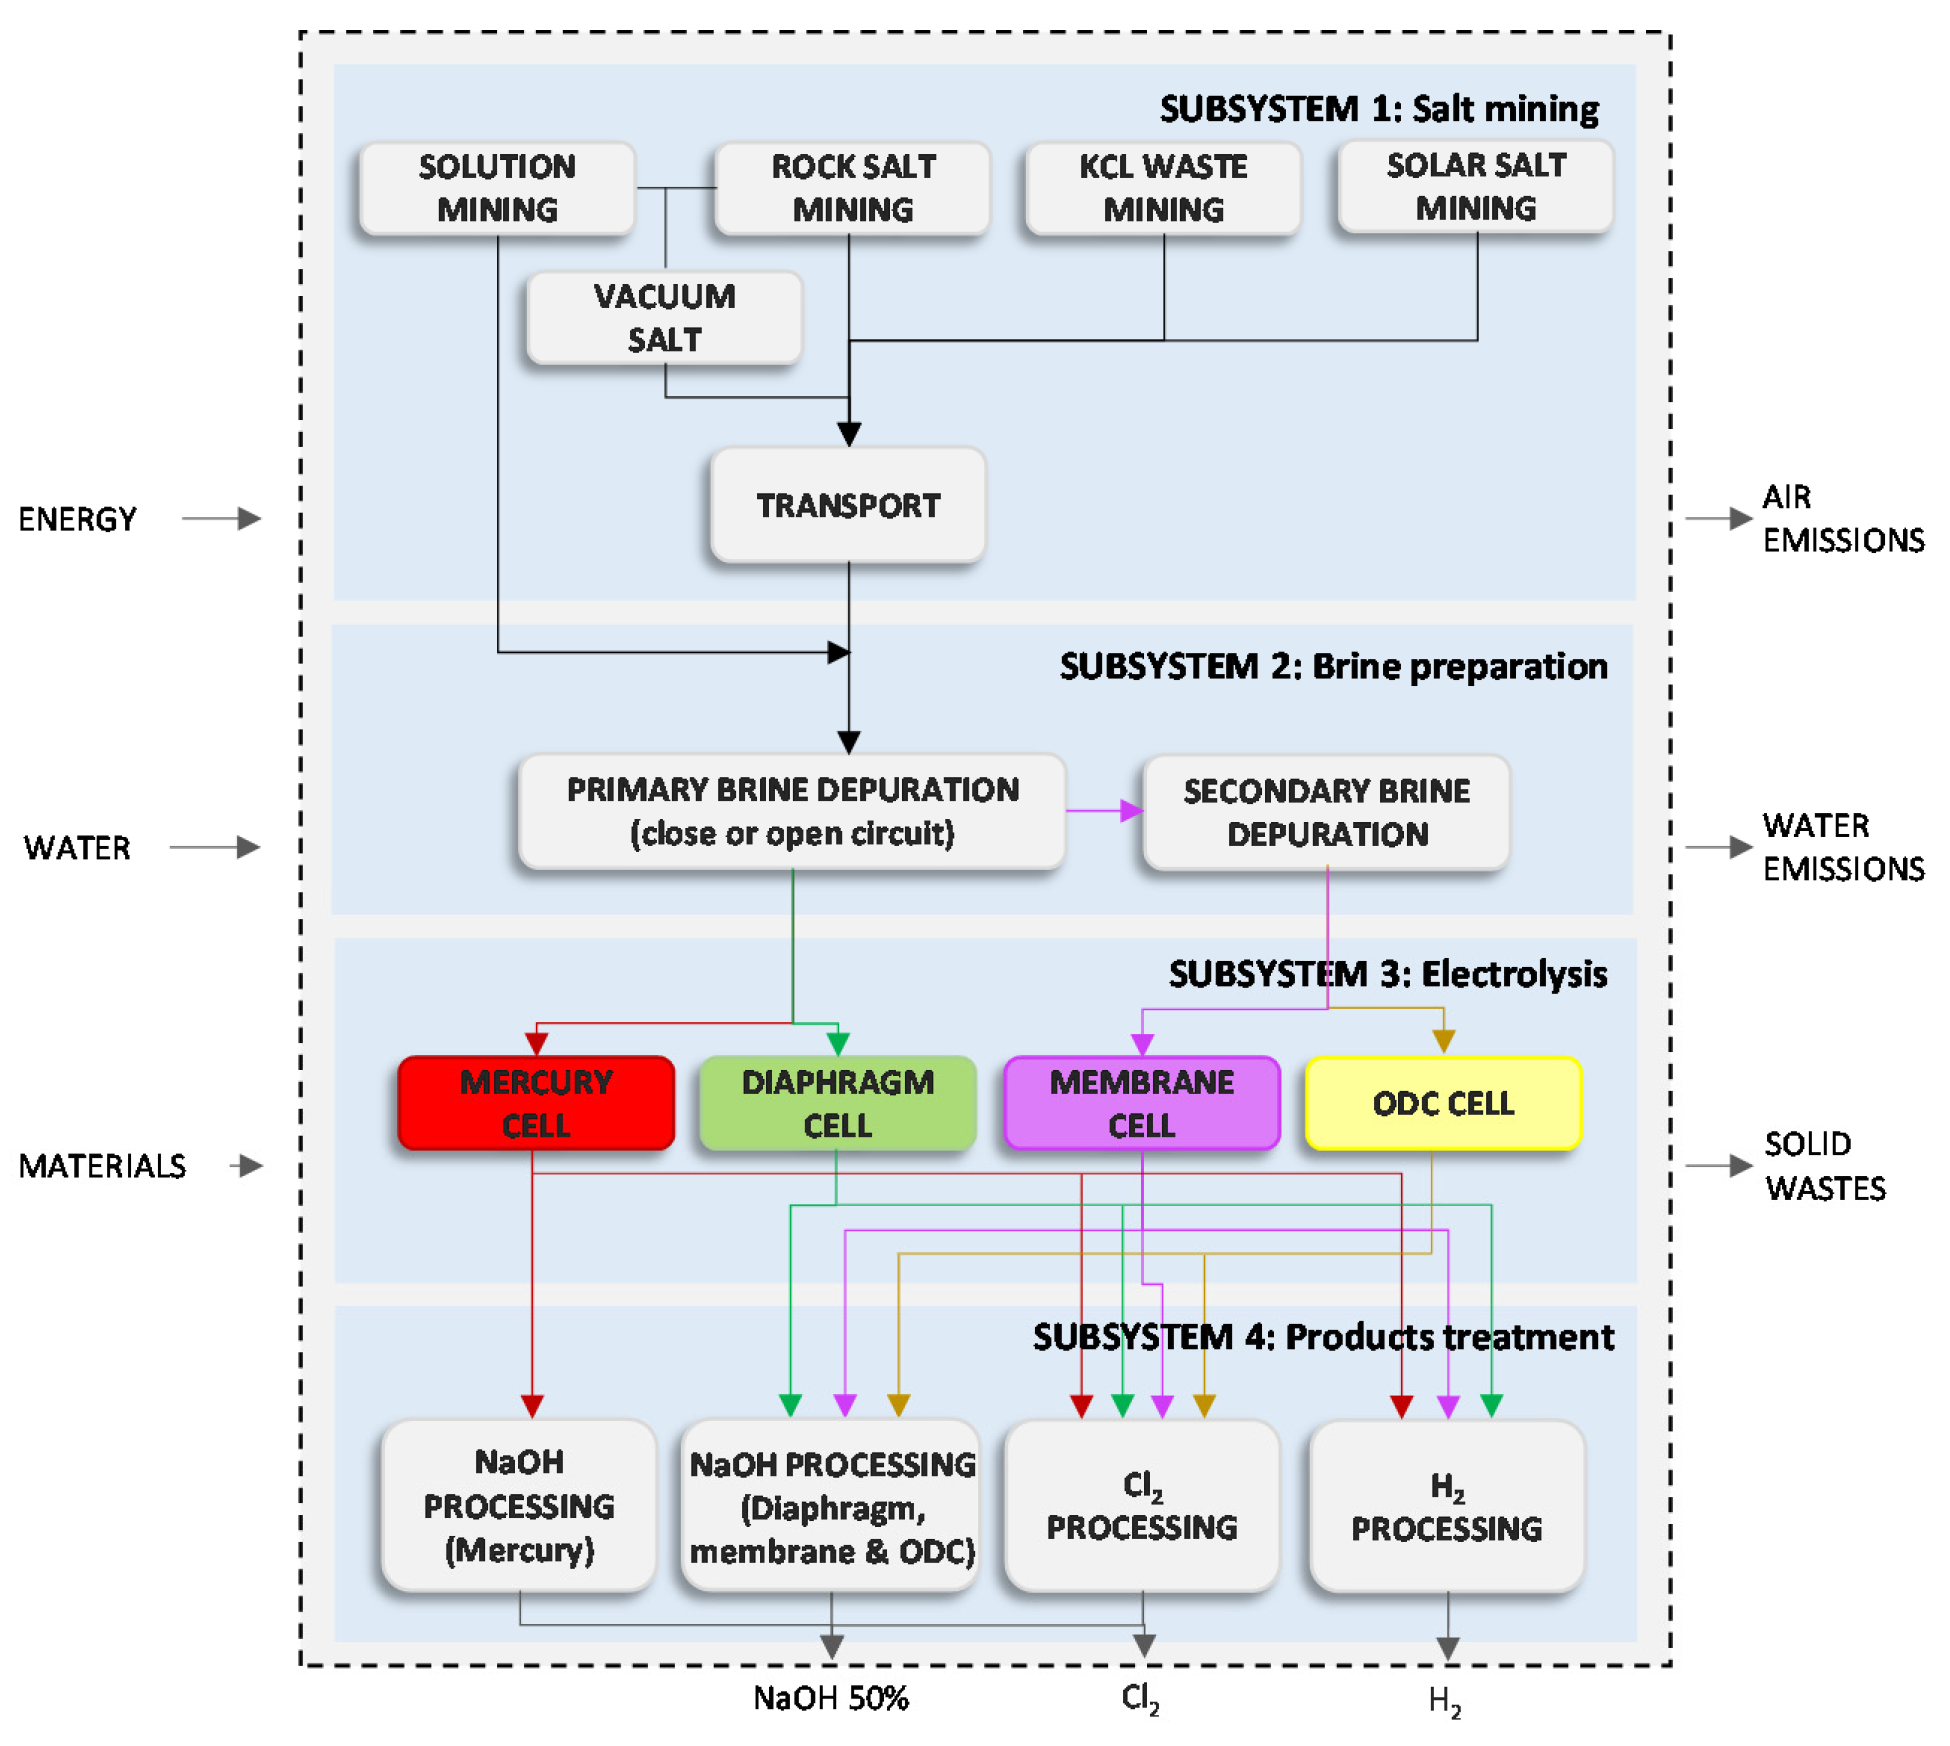
An example of energy intensive industry indirectly affected by the EU ETS and exposed to carbon leakage is the chlor-alkali sector [
17]. It produces chlorine, sodium/potassium hydroxide and hydrogen by the electrolysis of brine. Because electricity is a main input for this process, its price contributes to half of the production costs [
18]. Therefore, it is a critical factor in the global competitiveness of European producers [
19]. In fact, this sector has experienced an increase in the expenses around 10% of the production value indirectly due to EU ETS [
11]. Currently, the chlor-alkali process is mainly represented by three conventional technologies: mercury cell, diaphragm cell and membrane cell and the emergent oxygen depolarised cathode (ODC) cell [
20]. The main chlorine application in Europe is the production of polyvinyl chloride (PVC) from ethylene dichloride (EDC) as intermediate. In fact, 33.3% of chlorine consumption in EU countries was directly addressed to PVC manufacture in 2012 [
21]. Chlorine is a hazardous substance that could create serious transport problems, potentially reducing the ability to replace national production by imports [
22]. However, it is transported long-distance and traded in terms of chlorine derivatives, such as EDC, a globalised product used worldwide. Therefore, EDC is an excellent product to represent and analyse the vulnerability of the chlor-alkali market.
For that reason, the aim of this work is to assess the vulnerability of the European chlor-alkali industry to chlorine replacement by imported EDC. An energetic, economic and environmental sustainability assessment will be conducted to study and compare the current available technologies to the emerging ODC technique. Several studies discussing the environmental sustainability of the chlor-alki sector were compiled in a previous work [
20]. This bibliographic review of the state of the art showed the existing gap regarding the nexus energy–environment–economy of this energy demanding industry highlighting the novelty and interest of this paper.
2. Materials and Methods
Both environmental and economic domains are essential pillars of the multi-dimensional concept of sustainability [
23,
24]. Since sustainable development aims to achieve economic prosperity while maintaining environmental protection, to achieve sustainability in practice, society must support strategies oriented towards sustainable economic activities [
25]. The implementation of policies aimed to the reduction of environmental impacts such as the EU ETS specially affects to the energy intensive industries, which require for a specific sustainability-oriented assessment. Hence, this work proposes an Energetic, Economic and Environmental Sustainability Assessment (EEESA) methodology to study the triple dimension described. As there is no specific methodology to conduct energetic-economic-environmental sustainability assessments, the EEESA methodology is adopted as far as possible to follow the life cycle assessment (LCA) guidelines [
26,
27]. LCA is a powerful tool to evaluate the environmental loads of a product or a service throughout its life cycle [
28]. The importance of such tool lies in the consideration of all the stages of an activity (i.e., from the extraction of raw materials to the return of wastes to the ground) and not just the most immediate and visible outcome [
29]. Other studies can be found in the literature based on LCA approach to assess sustainability dimensions other than environmental [
30,
31,
32]. This methodology is presented as a valuable and comprehensive decision-support tool that can be used by manufacturers and other stakeholders of the chlor-alkali industry.
In order to assess the energetic, economic and environmental sustainability of the chlor-alkali sector, the trading opportunities are taken as criteria. This criterion assesses the vulnerability of the business network as well as the risks it is exposed to by considering the number of national and/or international companies in the trade network and their related consumption data [
33].
In this way, the EEESA methodology is based on four main variables (
X3,i,j):
X3,1,j, electricity consumption impact category (ECI);
X3,2,j, thermal consumption impact category (TCI);
X3,3,j, salt consumption impact category (SCI); and
X3,4,j, H
2 valorisation impact category (HCI). The first two metrics can be applied to any system under study, while the two latter are case-specific indicators for the chlor-alkali sector. EEESA methodology complements the environmental sustainability assessment methodology proposed in [
34], which is based on two variables: natural resources usage (
X1,i,j) and environmental burdens generated (
X2,i,j). To simplify the analysis in this work,
X3,i,j will be referred hereafter as
Xi.
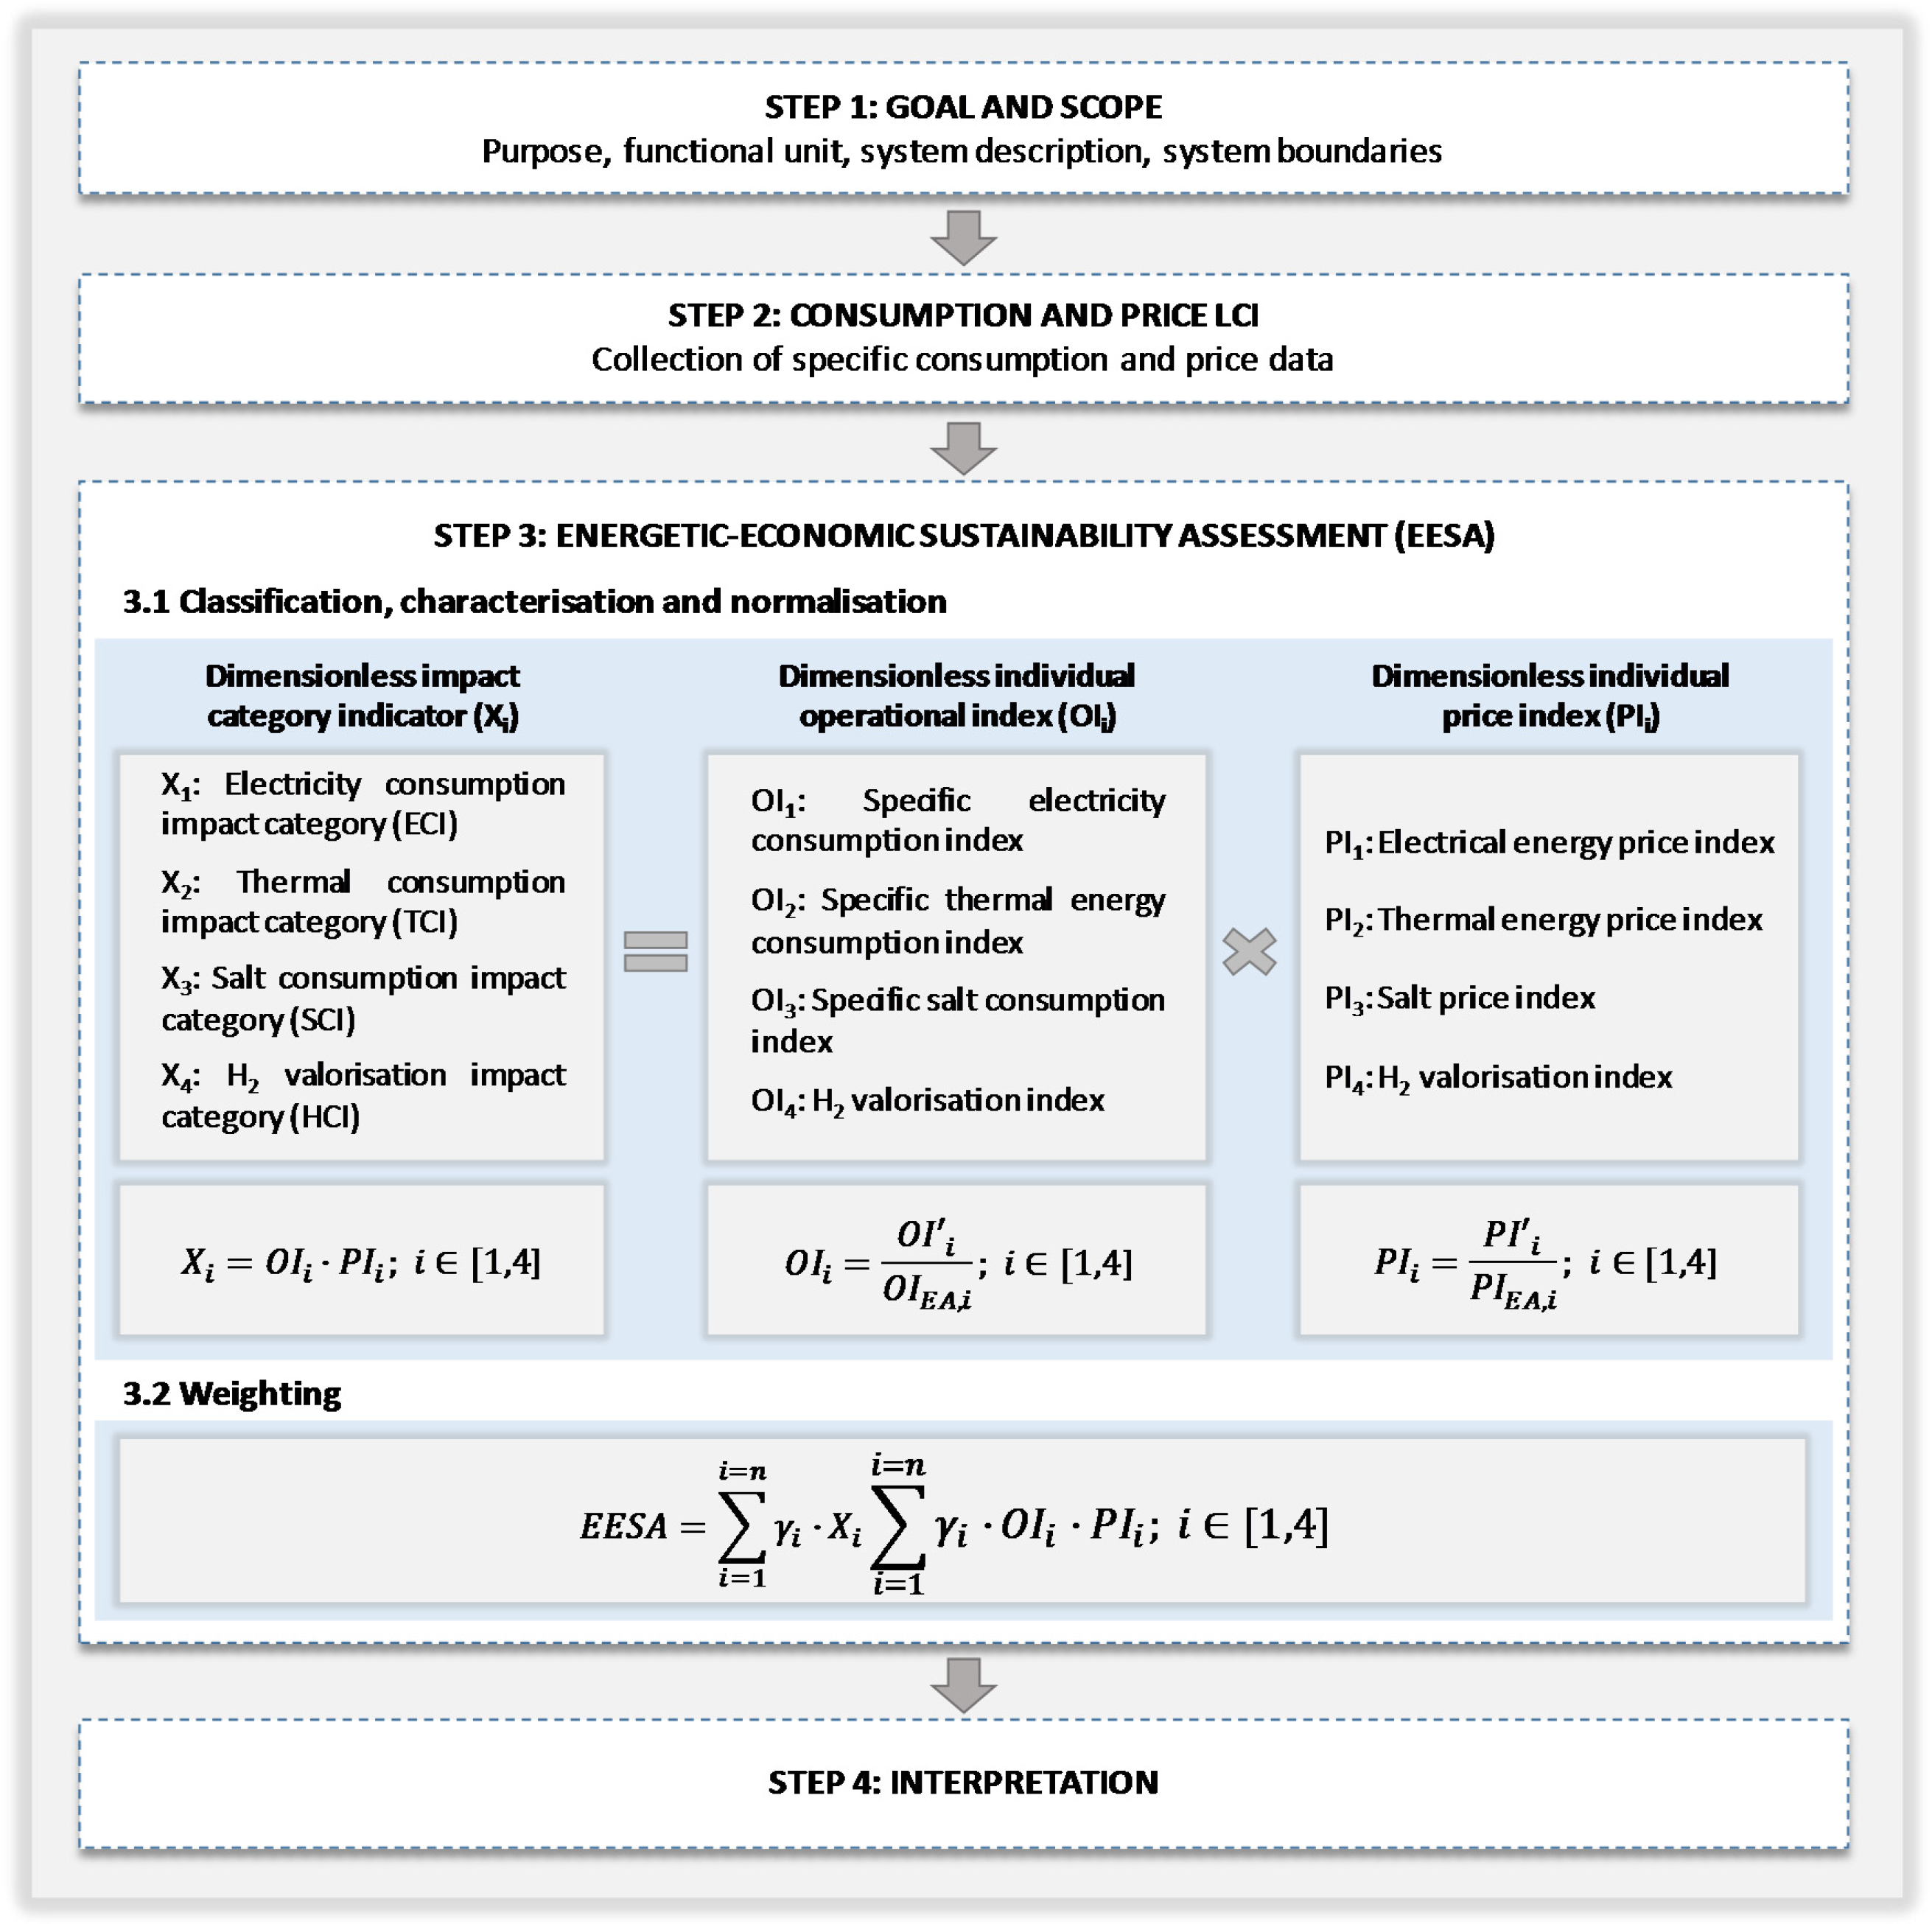
As
Figure 1 outlines, these metrics are obtained as a result of the integration of two different sets of indexes: individual operational indexes (
OIi) and individual price indexes (
PIi). The former are based on the technological options of the chlor-alkali process and the operation conditions of the different scenarios under study, such as current density or hydrogen valorisation rate. The latter are based on energy and raw material prices.
Since in the chlor-alkali sector there is no possibility of independently control the production of the three products, all the data and equations in the study are referred to the mixed tonne, which consists of 1 tonne of chlorine, 1.1 tonnes of caustic soda (sodium hydroxide) and 0.03 tonnes of hydrogen [
20].
EEESA methodology comprises the four following steps (
Figure 1): definition of the goal and scope, life cycle inventory (LCI) of the main consumptions and prices, energetic, economic and environmental impact assessment (EEEIA) and interpretation.
As states the ISO 14040 and 14044 [
26,
27], the first stage gathers the definition of the purpose, functional unit, system description and system boundaries. In the second step, the main mass, energy and prices inputs and outputs must be collected. The EEEIA that will be bellow described must be followed by the results interpretation.
2.1. Classification, Characterisation and Normalisation
In this section, the individual operational and price indexes required for the determination of variables
Xi are defined, as well as its corresponding reference terms for normalisation. The distance to a reference method is used for the normalisation procedure [
35], as shown in Equations (1) and (2):
where
OIEA,i and
PIEA,i are the European average reference values for the specific consumption (
OI’
i) and price (
PI’i) of index
i, respectively.
2.1.1. Dimensionless Individual Operational Index ()
Specific Electricity Consumption Index (OI1)
OI1 is related to the electricity consumed by the electrolytic technology. The specific electric energy consumption of the scenario under study (
OI’
1) is used for the determination of this index. The average electricity consumption of the chlor-alkali industry is taken as reference for the normalisation (
OIEA,1). It is based on the average value for each technology reported in the Best Available Techniques Document or BREF document [
21].
Considering the European situation in 2014 (23% mercury, 62% membrane and 15% diaphragm according to Eurochlor report [
36]), this reference value is estimated at 2.83 MWh/t ECU. It must be highlighted that this value should be revised in the next years to be adapted to the European situation achieved after the transformation that the chlor-alkali industry is undergoing. This transitional period is mainly due to the December 2017 deadline stated by the European Commission for the phase out of mercury process in EU [
37].
Specific Thermal Energy Consumption Index (OI2)
The consumption of thermal energy related to caustic soda concentration is gathered in this metric.
OI’
2 is defined by the specific thermal energy consumption expressed as t steam/t ECU. The average value of the European data reported in the BREF document is again taken as reference for normalisation (
OIEA,2), which is estimated at 0.92 t steam/t ECU [
21].
Specific Salt Consumption Index (OI3)
The consumption of salt as raw material is included in this index.
OI’
3 is the specific consumption of salt expressed as t salt/t ECU. The reference value employed for normalisation (
OIEA,3) is the European average consumption of salt displayed in the BREF and is 1.7 t salt/t ECU [
21].
H2 Valorisation Index (OI4)
This index establishes the hydrogen valorisation rate of the conventional technologies.
OI’
4 defines the hydrogen valorisation percentage for the scenario under study, expressed as a decimal. The European average percentage also expressed as parts per unit is the reference value used for the normalisation (
OIEA,
4). According to the BREF, it is 90% [
21].
2.1.2. Dimensionless Individual Price Index (PIi)
Electrical Energy Price Index (PI1)
The price related to electric energy in each scenario is described by this index. Being subjected to carbon leakage risk, the chlor-alkali sector is entitled to receive a financial support to compensate the indirect costs incurred as a result of ETS Directive [
17]. This compensation is included in the methodology proposed to assess the regional differences related to the different compensation intensities.
Based on the guidelines stated by the EU ETS [
13], the financial support may not exceed 85% of the eligible costs and its quantity depends on each country. Hence, the eligible quantity (
EQ) is calculated according to Equation (3):
where
EFt is the CO
2 emission factor, expressed as t CO
2/MWh in the year
t. This value is taken from the European reference and is estimated at 0.76 t CO
2/MWh [
13].
PEA,t–1 is the long-term price for the emissions allowance in the year
t − 1 and is considered as 6.18 €/t CO
2 [
38].
E is the reference value for the electricity consumption efficiency, which is assumed as 2.46 MWh/t ECU [
13]. Finally,
BO refers to the baseline output, which is the average production at the installation over the reference period. A value of 200 kt/year is taken for this variable.
Once the eligible costs are estimated, the intensity of the aid (€/MWh) can be defined according to the specific electricity consumption of each scenario. The percentage of the eligible costs that are granted is represented by the parameter
η as is described in Equation (4):
where
Pt is the production of the year
t under study.
The result of Equation (4) is used in Equation (5) to correct the electricity price according to the financial support delivered by ETS Directive.
where
P’
1,c is the corrected price for the electricity consumed in the scenario under study and the value used for the determination of
PI1.
To normalise this value, the Platts Pan-European Power (PEP) index is used [
39]. The PEP index is a demand-weighted day-ahead base load index of all European electricity assessments. This index describes price trends for Europe’s free electricity markets as a whole and is taken as global reference to fix the prices of a wide range of energy commodities such as crude oil, natural gas and electricity. The European Commission’s Market Observatory for Energy applies this index to assess the competitiveness of the European energy with regard to other world regions. Since 2012, the PEP index has followed a downward trend. However, since 2014, it is stabilised at around 45 €/MWh [
40]. The PEP value reported in November 2015, which is 47.28 €/MWh [
39] is taken as reference (
PIEA,1).
Thermal Energy Price Index (PI2)
This index is based on the price of the steam required in the chlor-alkali process. For normalisation purposes, a European average price is taken as reference. In this sense, cogeneration shares around 50% of the European steam production (50%), followed by the use of industrial boilers (40%) [
41]. However, no data are available for the European average price of steam.
Since the main variable affecting steam price is the cost of the fuel used in its production, the reference value is estimated on the basis of the natural gas cost. The Commission’s Market Observatory for Energy identifies the Platts Gas Contract Indicator (GCI) as reference for monitoring the natural gas price in Europe. Hence, the European average price of steam (
PIEA,2) is determined as follows (Equation (6)):
where the GCI value published in November 2015 as 22.54 €/MWh [
42] represents the natural gas cost (
CNG).
ηboiler is the boiler efficiency assumed at 85%.
Esteam is the energy required for the production of 1 tonne of steam expressed as MWh/t steam.
Salt Price Index (PI3)
In Europe, the salt business is shared mainly by three dominant companies: Akzo Nobel, ESCO and Salins, which also hold an important captive demand for chlor-alkali and sodium carbonate production. Salt manufacturers can be classified into companies that mainly meet the requirements of the described captive market and companies that supply to the open market.
Salt prices are significantly affected by the type and purity of salt requirements. For example, prices reported in January 1998 were as low as 10 €/tonne for captive brine or as high as 50 €/tonne for vacuum salt in the open market [
43].
No more data are available. Consequently, the distribution of the European demand and the previous described prices are used to calculate the normalised salt price index. In this sense, a 41.8% of chlor-alkali manufacturers employ brine as raw material, while a 37.7% require vacuum salt [
36]. Hence, the European average salt price (
) is estimated at 28.25 €/tonne. Thus, PI
3 can be calculated considering the salt price (
) of the scenario under study (€/tonne).
H2 Valorisation Price Index (PI4)
Hydrogen valorisation represents an improvement in the competitiveness of the chlor-alkali process. The impact of such procedure is directly related to the valorisation price of the by-product. This price is in turn affected by the valorisation option applied.
The replacement of natural gas by hydrogen as fuel source is the valorisation technique considered in this study, as it is nowadays the most representative option. In this case, the hydrogen added-value is then directly related to the natural gas price. The price of valorised hydrogen is calculated on the basis of the equivalent calorific content, as shown in Equation (7).
where HHV is the high heating value of each fuel.
The European average price of hydrogen (PIEA,4) is calculated using Equation (7) and the European average price of natural gas previously defined in the thermal energy price index.
Once the individual operational indexes and the individual price indexes have been calculated, the impact category indicators
Xi can be estimated as follows (Equation (8)):
2.2. Weighting
Composite indicators are usually the most straightforward tool to aid decision-making. Different weights can be assigned to indicators to reflect their economic significance (collection costs, coverage, reliability and economic reason), statistical adequacy, cyclical conformity, speed of available data, etc. [
44]. Hence, weighting procedure ranks the different indicators according to their relative importance, having a larger effect in the outcome of the composite index the indicators to which a higher significance is attributed. This is the reason why the weighting scheme applied needs to be explicit and transparent [
45]. Weighting procedure implies a subjective valuation, which is particularly sensitive to complex, interrelated and multidimensional processes.
There is no consensus in a universal weighting methodology. This should not discourage the use of aggregated indexes, but raise awareness about the risks of presenting any composite index as objective. At best, it indicates a set of priorities that has been informed by popular or experts’ judgements [
46]. Analysts reward with higher weighting values the indicators that are considered as more influential. However, attention should be paid to the existence of correlations among factors or use weights derived from principal components analysis to avoid the double counting problems when several indicators are representing the same behaviour. Indicators could also be weighted based on the opinion of a group of experts representing different stakeholders [
44].
After reviewing the different weighting methodologies such as principal components analysis, factors analysis and “benefit of the doubt” [
35], it is concluded that they cannot be applied to the chlor-alkali system. The reason lies in the parsimonious and regional sensitive character of these methods, which belies the dynamic and transitional nature of the chlor-alkali process.
To determine the weighting values of the chlor-alkali system, the European average price of the mixed tonne (
EAPECU) is estimated using the normalisation values described for the determination of the individual operational and price indexes (Equation (9)):
where
OIEA,i and
PIEA,i are the specific European average consumption and price references for the individual operational and price indexes
i, respectively.
αi is the coefficient factor for the impact category
i. It is equal to the unit, excepting for the hydrogen valorisation impact category (
α4), where –0.0285 is assumed based on the mass hydrogen production defined in ECU. The negative value refers to the potential benefit of valorising this co-product.
EAPECU is further used to estimate the weighting factors for each impact category
i, as stated in Equation (10).
These weighting factors, as well as the normalisation values used for the individual indexes, are dynamic parameters that should be periodically revised. The current situation of the chlor-alkali sector regarding technologies, number and capacity of installations is in full transition and it will require some years before a stable position is achieved. Moreover, regarding prices, revision is an inherent and usual operation owing to market fluctuations.
The energetic-economic-environmental sustainability index is thus a composite index integrated by impact indicators
Xi according to Equation (11):
4. Energetic, Economic and Environmental Impact Assessment (EEEIA)
First, a preliminary impact assessment based on the resource path of the ESA methodology is conducted [
34]. As can be seen in
Figure 4, mercury technology represented by S1 results the less environmentally sustainable technology, which agrees with specific consumptions data from
Table 2. The second largest environmental impacts are obtained for diaphragm technology (S4), which is the technology that requires more energy after mercury cell. As can be seen from the comparison between S2 and S3, the thermal energy consumption presents a significant influence in the results obtained and is responsible of a 20% increase of NR usage in S3. This is mainly due to the two-effect configuration assumed for NaOH concentration in S3, which is a higher energy intensive processes than the three-effect evaporation assumed in S2. Consequently, S2 integrates the best environmentally performing technology, which is currently the best available technology according to the BREF document [
21]. Furthermore, this scenario illustrates the effect of using salt sourced from KCl waste, which is a more sustainable salt process than vacuum salt production and constitutes an important example of circular economy.
Regarding the emergent ODC technology (S5), the results obtained differ from what was expected. Although the electric energy consumption for this scenario is lower than the electrolysis requirements for membrane technology (S2 and S3), the environmental results are worse than for S2. This is mainly due to the lack of hydrogen production in ODC technology, which could otherwise be used to produce electricity in fuel cells, as it is assumed for the rest of technologies. In addition, this technology needs pure oxygen as raw material. Both issues challenge the environmental sustainability of this scenario.
Once the environmental impact of the energy consumption was assessed by means of LCA methodology, the study is extended to the energy and economy nexus using the EEESA approach. As preliminary approximation, it is first assumed that the salt price is independent of the quality requirements of each technology and equal to €25 per tonne of salt.
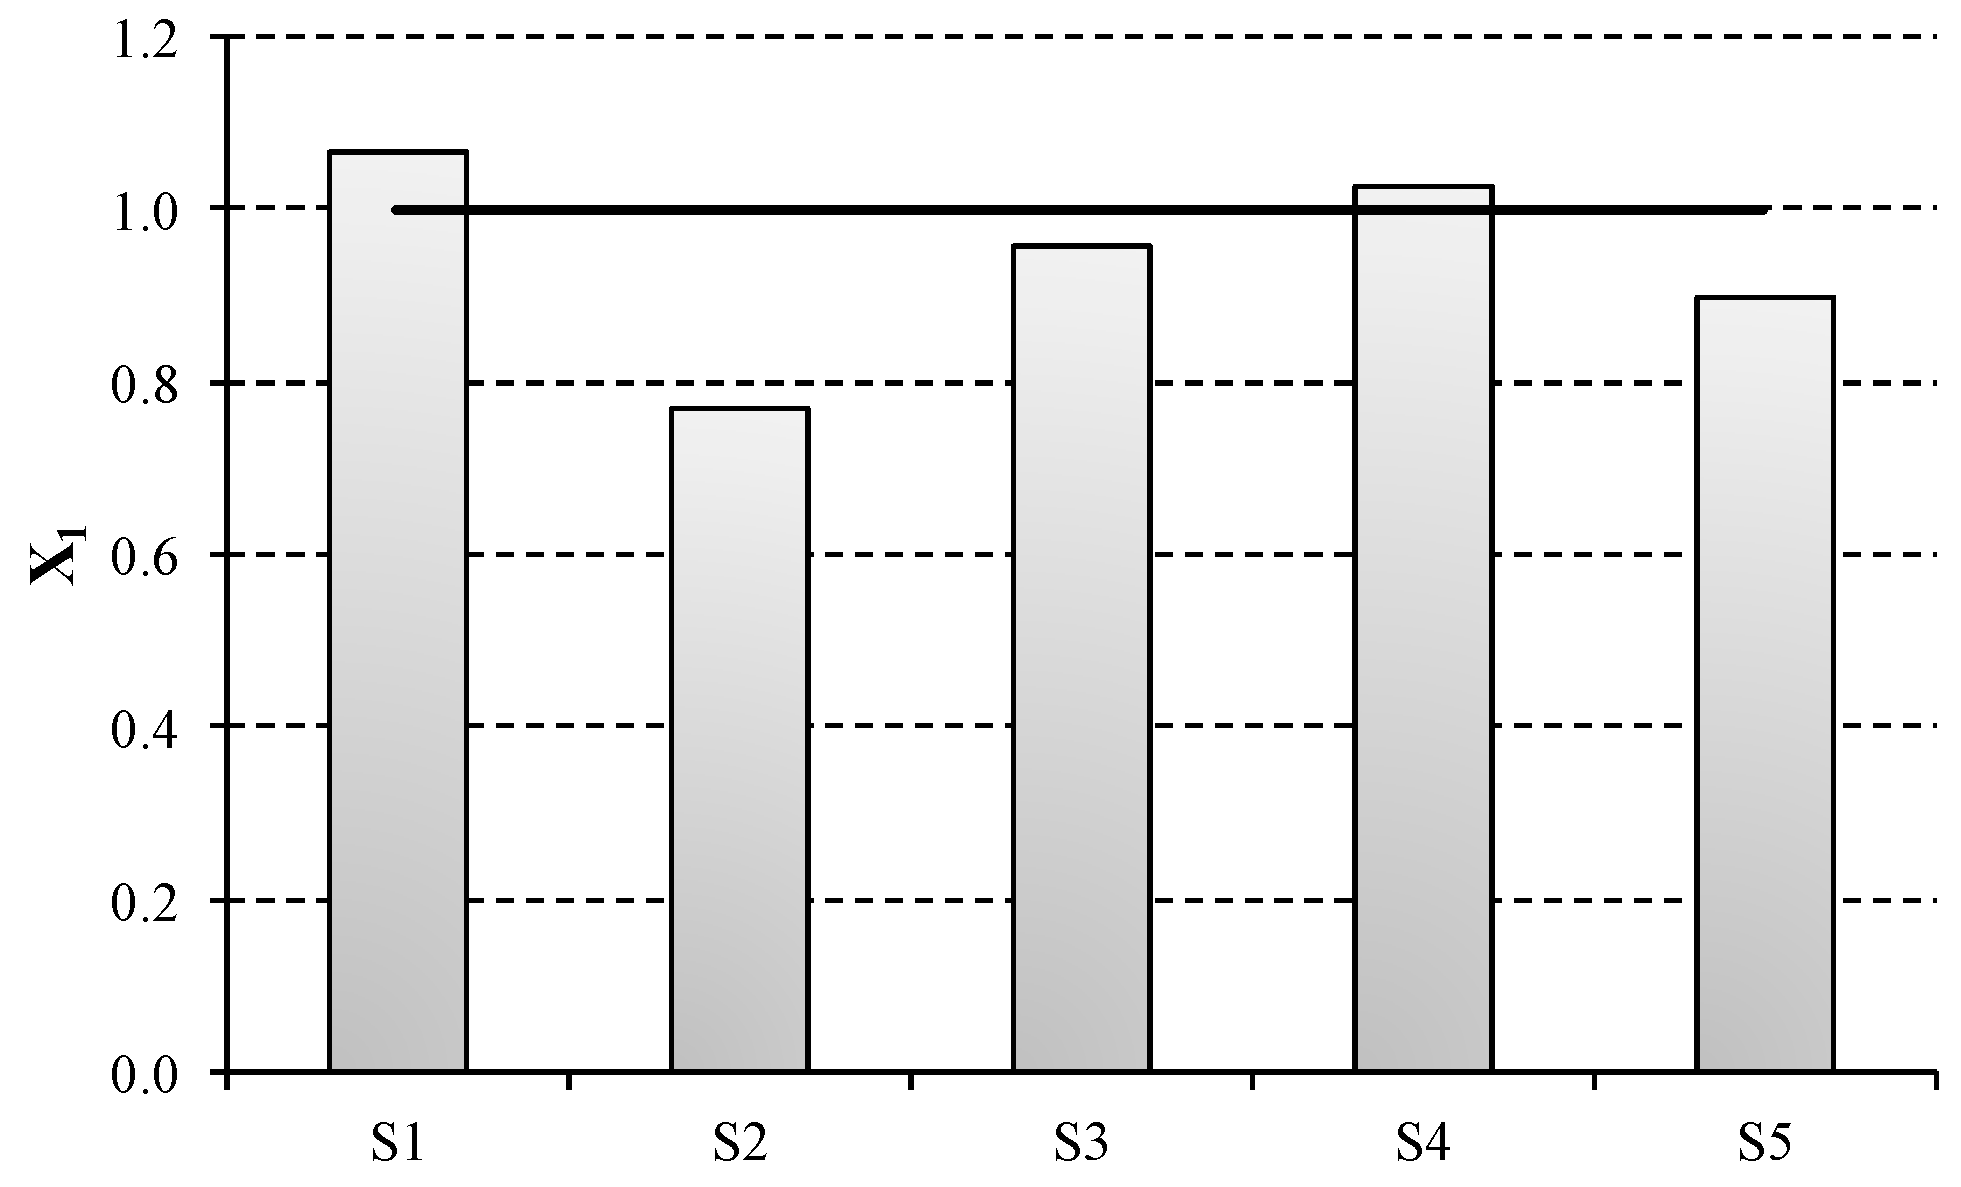
Table 4 outlines the results obtained for variables
Xi in the scenarios under study. As shown by the electricity consumption impact metric (
X1), the higher energy intensive scenarios are penalised regarding the compensation expected. This is due to the fact that the eligible quantity is calculated using 2.46 MWh/t ECU as reference value for an efficient electricity consumption, which is lower than the current European average (2.83 MWh/t ECU).
Regarding the thermal consumption impact category, which is described by X2, two opposite situations are observed. On the one hand, the minimum consumption of steam is represented by S1 because mercury technology produces directly 50% NaOH and does not require further purification. Conversely, X2 for S4 is on average three times greater than for the rest of the scenarios. This is due to the lower NaOH concentration delivered by diaphragm cell, which results in higher steam requirements for achieving 50% NaOH.
No significant differences are observed for salt consumption category (X3), as the specific consumption of salt is similar in every scenario. Regarding the hydrogen valorisation impact category, the same results are observed for S1–S4, as the same valorisation rate is assumed. However, it must be highlighted that this value is zero for S5, as ODC technology does no co-produce hydrogen.
To obtain the composite EEESA index, the previous indicators are weighted using the factors described in Equation (10). As can be appreciated in
Table 5, the weighting factor for
X4 is negative, as the valorisation of hydrogen presents a positive effect in the energetic, economic and environmental sustainability of the process. Hence, the higher the valorisation indicator is, the more sustainable the process is.
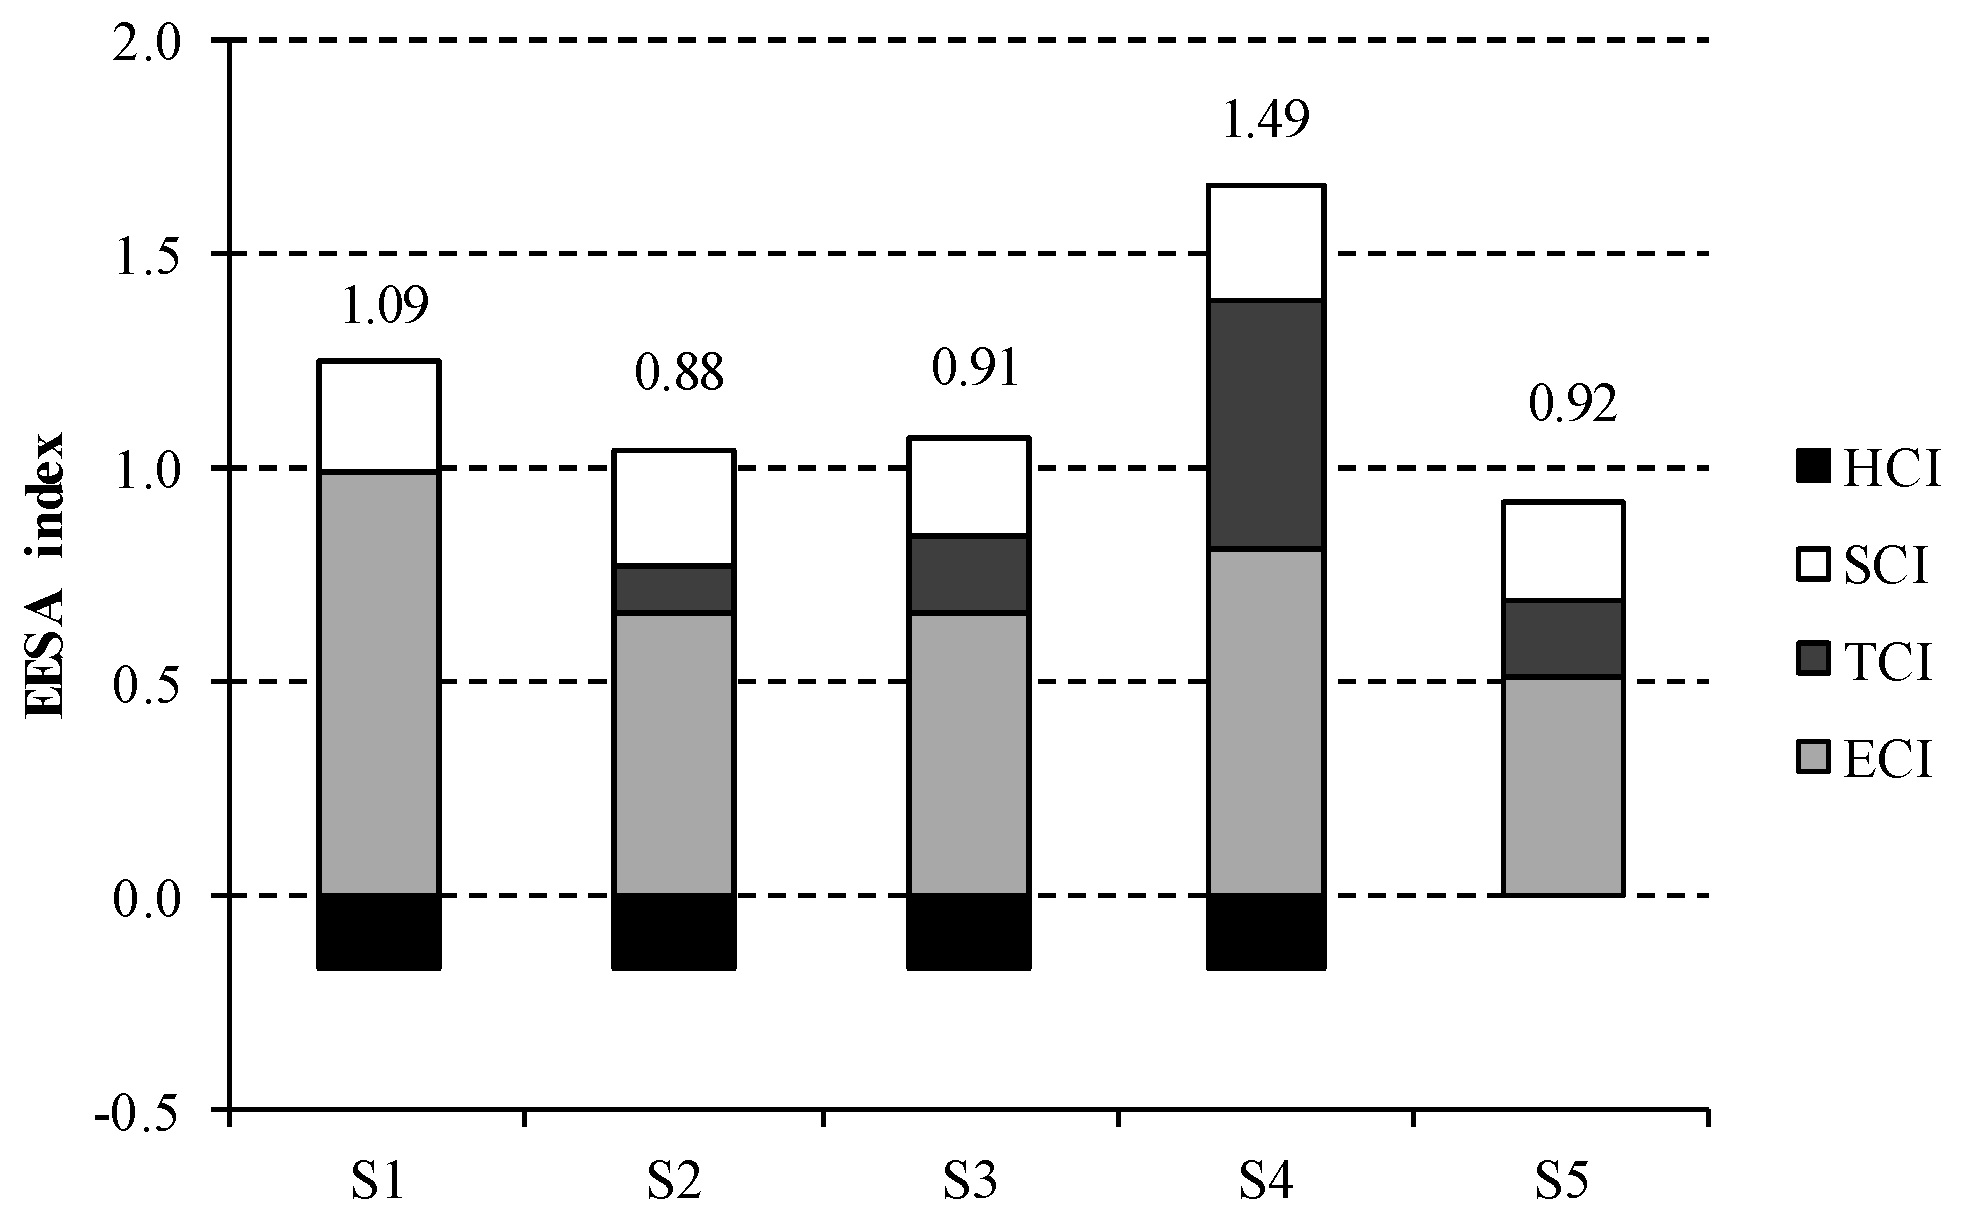
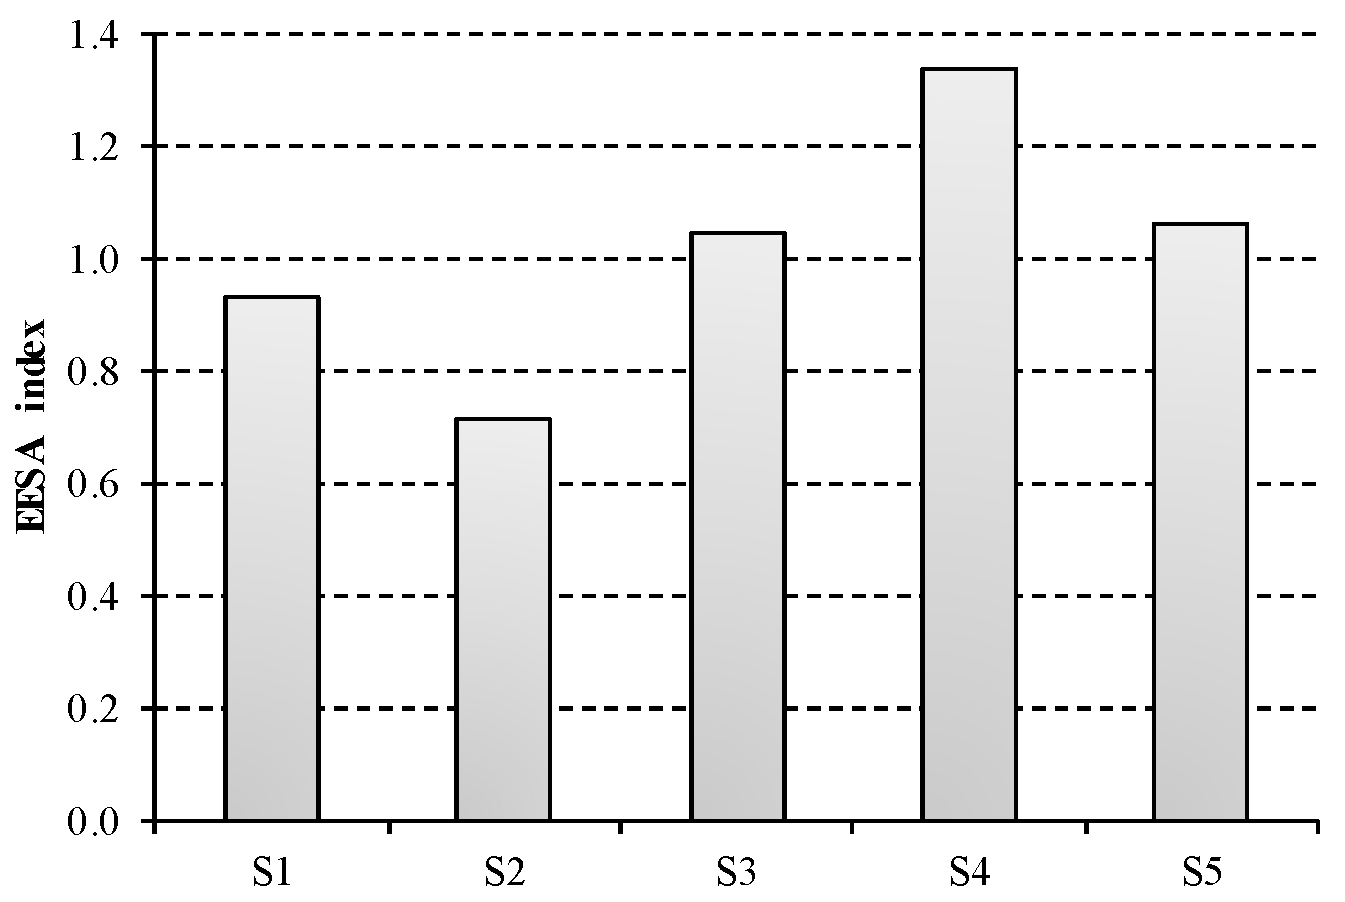
Results for the composite EEESA index are displayed in
Figure 5. S4 presents the largest value for EEESA index and thus is the less sustainable option. This is mainly due to the steam consumption for NaOH purification, which accounts for nearly 40% of the total impact. Conversely, this contribution is lower than 20% for the rest of scenarios under study, being zero for S1. The most favourable option in terms of energetic, economic and environmental sustainability is represented by S2, which describes membrane technology using three-effect evaporation for NaOH concentration. A slightly worse composite index is obtained for this technology in S3, due to the higher thermal consumption for two-effect evaporation than for the three-effect process.
The main hotspot of the chlor-alkali industry is clearly the electricity consumption, which contributes 90% to S1, while it amounts on average to 74% in S2 and S3 and 55% in S4 and S5. In this sense, it should be noted the non-existent advantage of ODC technology, described by S5, with regard to bipolar membranes in S2 and S3. Although the electricity consumption (ECI) is reduced when using ODC technology, the lack of hydrogen co-production involves a significant penalty in the sustainability of this system. While this scenario is not credited, the valorisation of hydrogen as fuel implies a reduction in the sustainability index for the rest of technological options. This remarks the fact that hydrogen valorisation is an essential issue to take into account in decision-making process.
Mercury technology, described by S1, is strongly dependent on electricity price owing to its large energy intensive nature. However, the total impact of mercury technique benefit from the lack of steam requirements, as its EEESA index is just 9% greater than the European average.
Finally, the contribution of salt consumption is not negligible as it is estimated at 25% on average. This is the reason why a further assessment considering the salt price attached to the corresponding quality requirement of each technology is needed.
4.1. Sensitivity Analysis
4.1.1. Influence of the Salt Price according to the Quality Requirements for Each Technology
This section describes a more realistic pricing situation for SCI. The price of salt can vary substantially according to its quality. In this work, 10 €/t salt is considered for salt from KCl waste and brine, while 40 €/t salt is used for vacuum salt.
Figure 6 shows the results obtained for EEESA index under this assumption. Again, the most sustainable option is S2. The use of salt manufactured by a less energy intensive process benefits S1 and S2, where KCl waste is employed. In this sense, a competitive advantage is acquired by mercury scenario in comparison to S3 and S5, where vacuum salt is used. In particular, a 31% reduction in the total EEESA impacts is observed from S3 to S2, which is mainly due to the replacement of vacuum salt by KCl waste.
Diaphragm technology is still the worst scenario. Despite using brine as raw material, its large electric and thermal energy consumption does not compensate the reduction in the price of salt.
4.1.2. Influence of Energy Intensification for Diaphragm Technology
Diaphragm technology is significantly affected by the consumption of steam. It should be remembered that this technology is usually located closely to other production processes that employ caustic soda without further purification stages. However, this involves an increase in the requirements of salt of the processes.
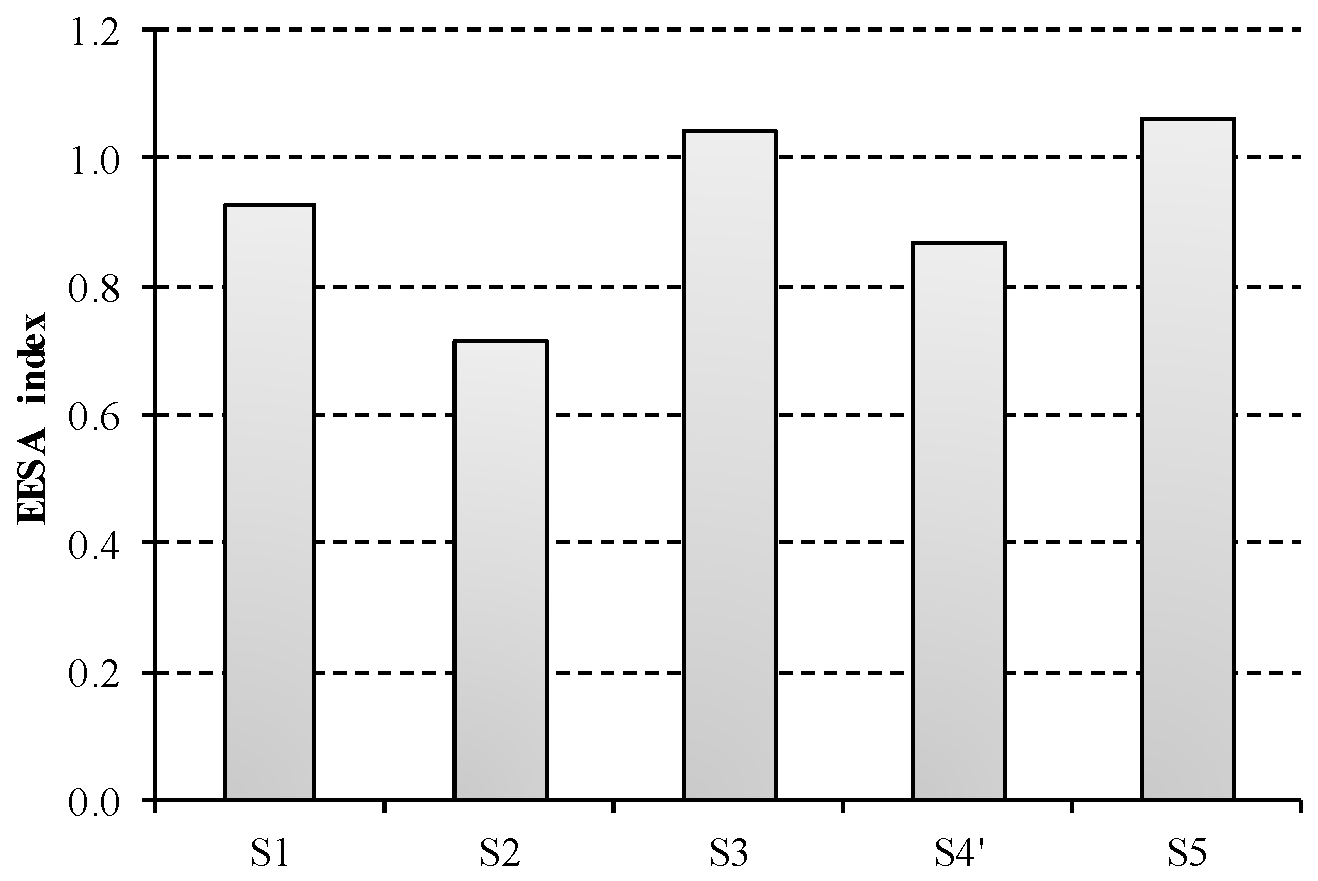
Table 6 outlines the inventory related to this third assessment. In this case, a diaphragm installation without NaOH purification is considered. Henceforth, the consumption of salt is assumed to be twice the value employed in the previous subsections. Price discrimination for salt quality is again considered.
The results obtained for this assessment show that the energetic, economic and environmental sustainability of the process is substantially improved (
Figure 7). The total impact of diaphragm technology is significantly reduced (34%) from 1.33 to 0.87 when energy intensification is considered. Then, S4 reduces its impact below S1 and turn into the second most favourable option. Conversely, S3 and S5 become the less sustainable scenarios.
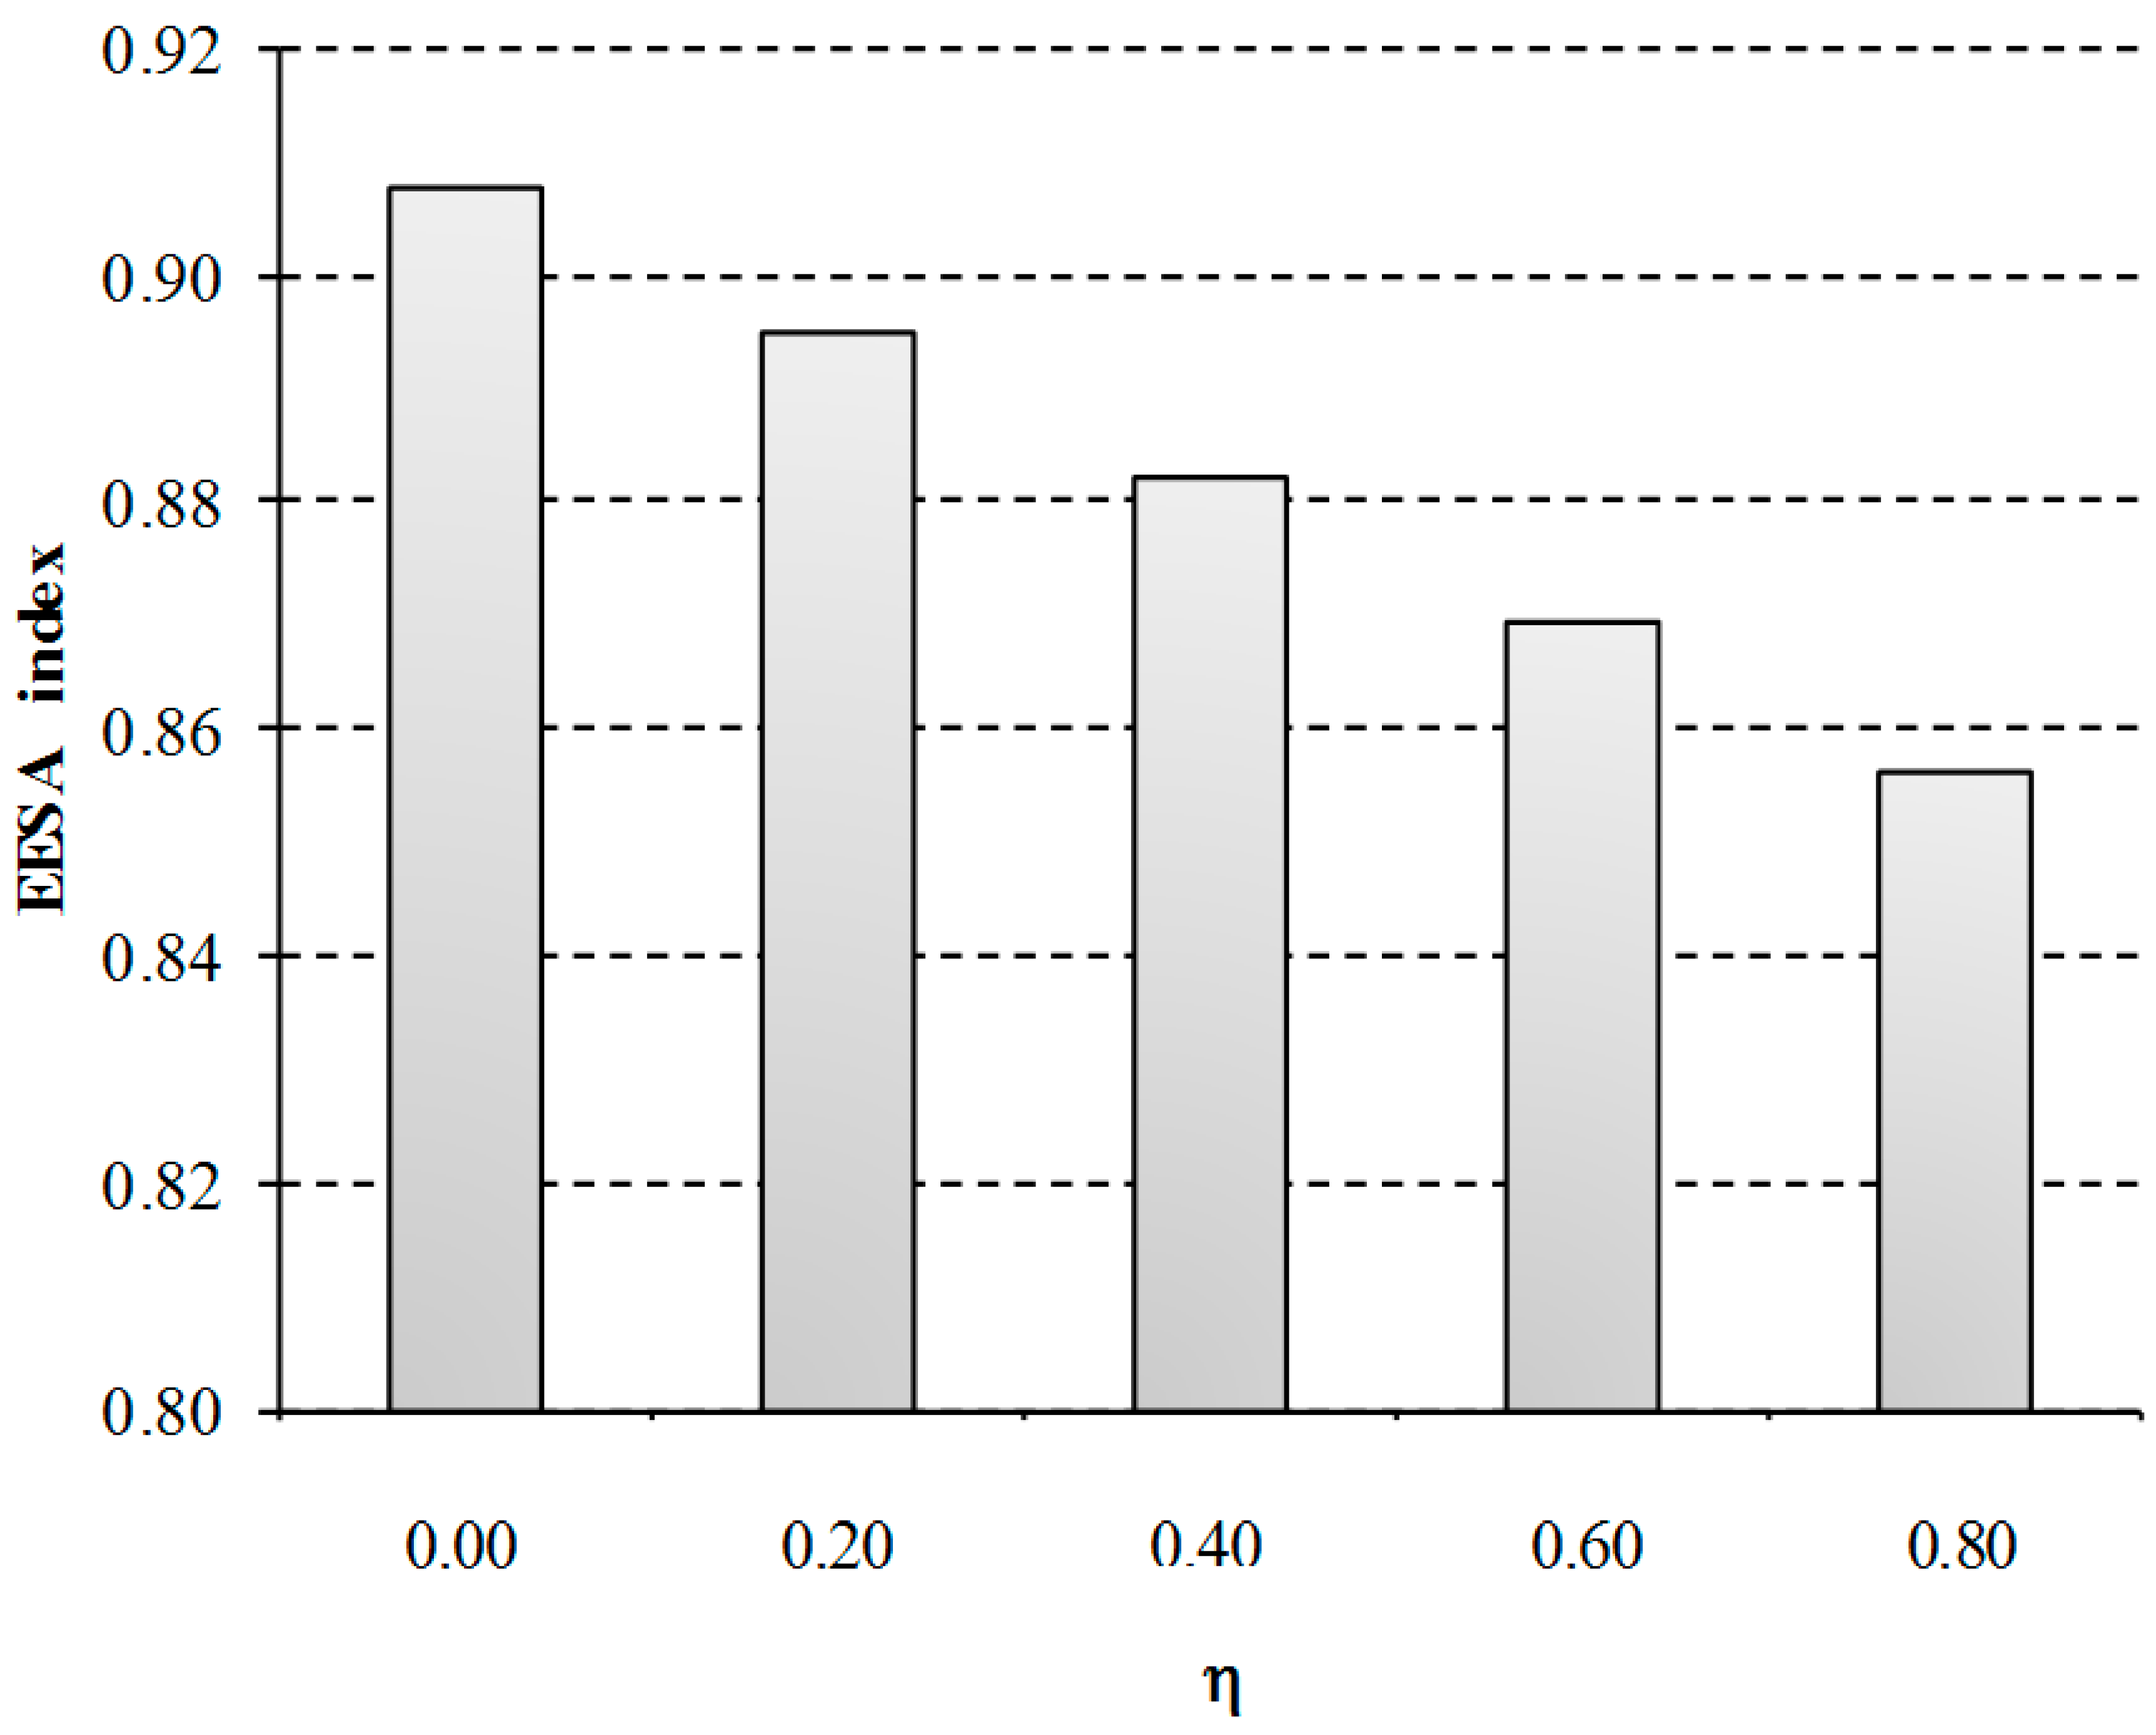
4.1.3. Influence of the Compensation for Indirect Costs of the EU ETS on the Energetic, Economic and Environmental Sustainability of Chlor-Alkali Industry
S2, which describes membrane technology, is taken as reference to assess the influence of the compensation intensity for indirect costs of the EU ETS. In this sensitivity analysis, five scenarios are considered assuming that the compensation received ranges from 0% to 80%. This range has been selected since financial support cannot exceed 85% of the eligible costs based on the EU ETS guidelines [
13].
As can be observed in
Figure 8, the composite EEESA index is affected by the indirect costs of the EU ETS according to the financial support received. The cost of the electricity is indirectly reduced from 55 to 51 €/MWh as the percentage of compensation is increased, which involves a 6% reduction of the total impact when the maximum compensation is assumed (80%). This differentiation in the granting of compensation may affect the trading opportunities of the process. For example, the aid currently granted in Spain is below 7.5% of the compensation needs (estimated at 77 million €), while the same companies are receiving the maximum compensation in other States such as Germany, Netherlands, United Kingdom, Belgium and France [
48]. This results in a 5.4% increase of the total EEESA impacts of Spanish installations with regard to these countries.
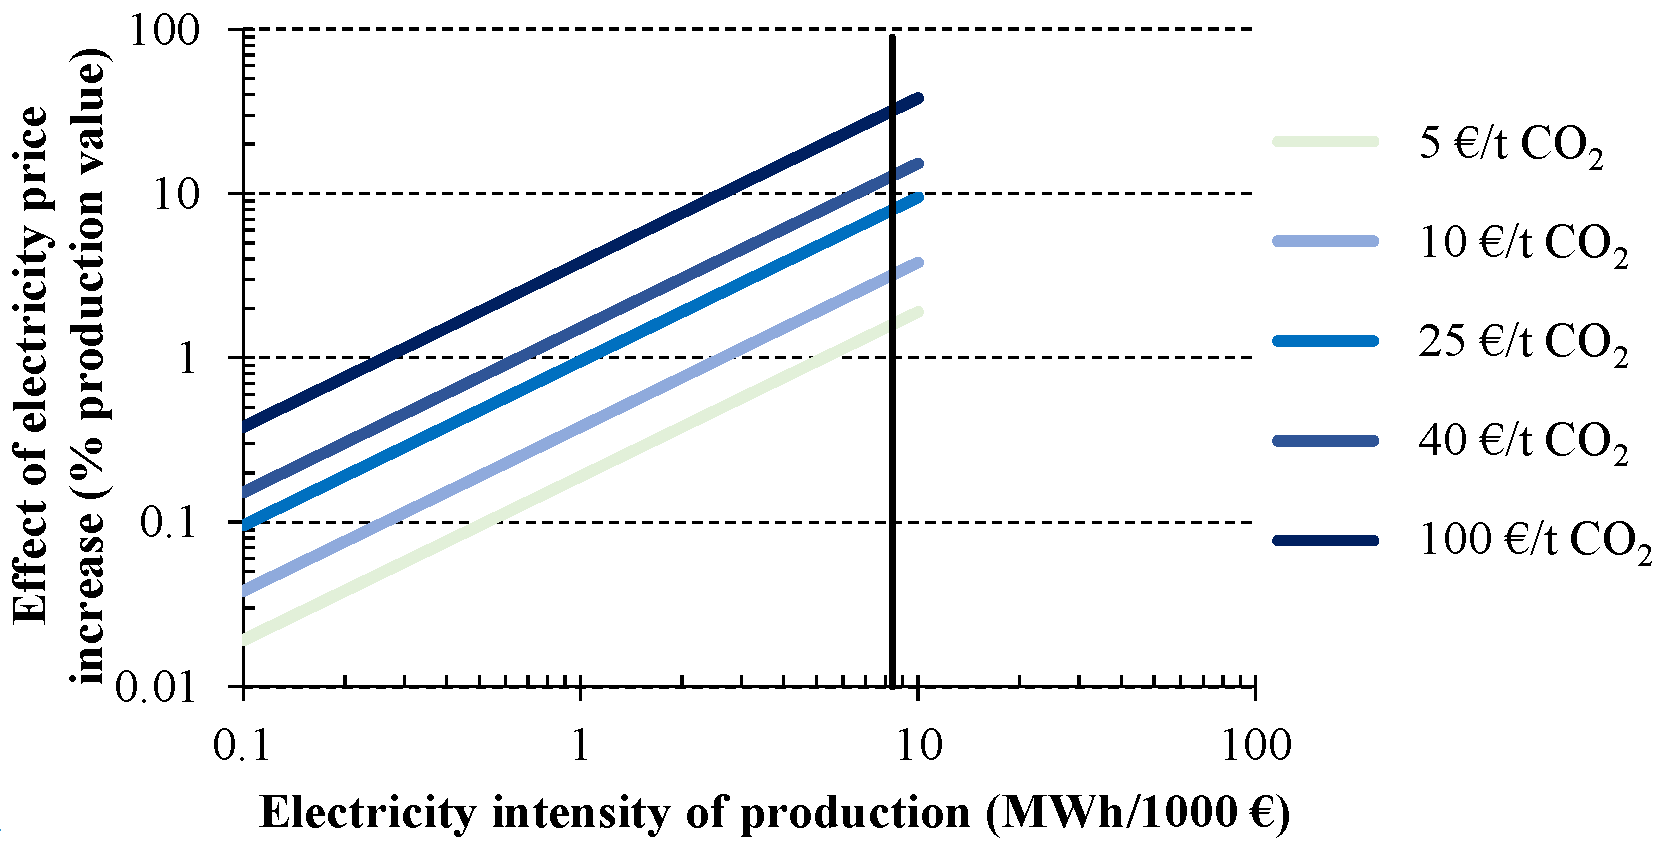
4.1.4. Influence of the CO2 Emission Allowance Prices on the Energetic, Economic and Environmental Sustainability of Chlor-Alkali Industry
The reduction of CO
2 emissions in the power sector can be reflected in the electricity price and indirectly results in an additional energy costs to the industry (
Cindirect). This influence can be expressed as a percentage of the production value according to Equation (12):
where
I is the electricity intensity of production (MWh/1000 €),
PEUA is the price of the CO
2 European emission allowance stated by the EU ETS (€/t CO
2),
EF is the emission factor (t CO
2/MWh) and
ε is the elasticity in the indirect costs transfer to the electricity price [
11].
The influence of the indirect costs due to the probable electricity price increase from the CO
2 emission trading system is shown in
Figure 9. Again, S2 is taken as reference for this analysis. An elasticity value of 0.5 €/MWh per 1 €/t CO
2 is assumed to describe the average situation observed [
11]. The price of CO
2 emissions is ranged from 5 to 100 € per tonne of CO
2. For example, considering a 25 €/t CO
2 price for the CO
2 emission allowance, involve an extra cost of 1% for an electricity intensity of production around 0.8 MWh/1000 € (e.g., cement industry) or 4% for a level of intensity close to 3 MWh/1000 € (e.g., high energy-intensity steel making). Moving to 40 €/t CO
2 results in a further impact rise, although it remains under 4% of production value except for industries with an electricity intensity higher than 3 MWh/1000 €. Such is the case of chlorine industry, represented in
Figure 9 by a vertical line (8.6 MWh/1000 €). Increases over the production value from 2% to 30% are observed when emission allowance prices from 5 to 100 €/t CO
2 are assumed, respectively.
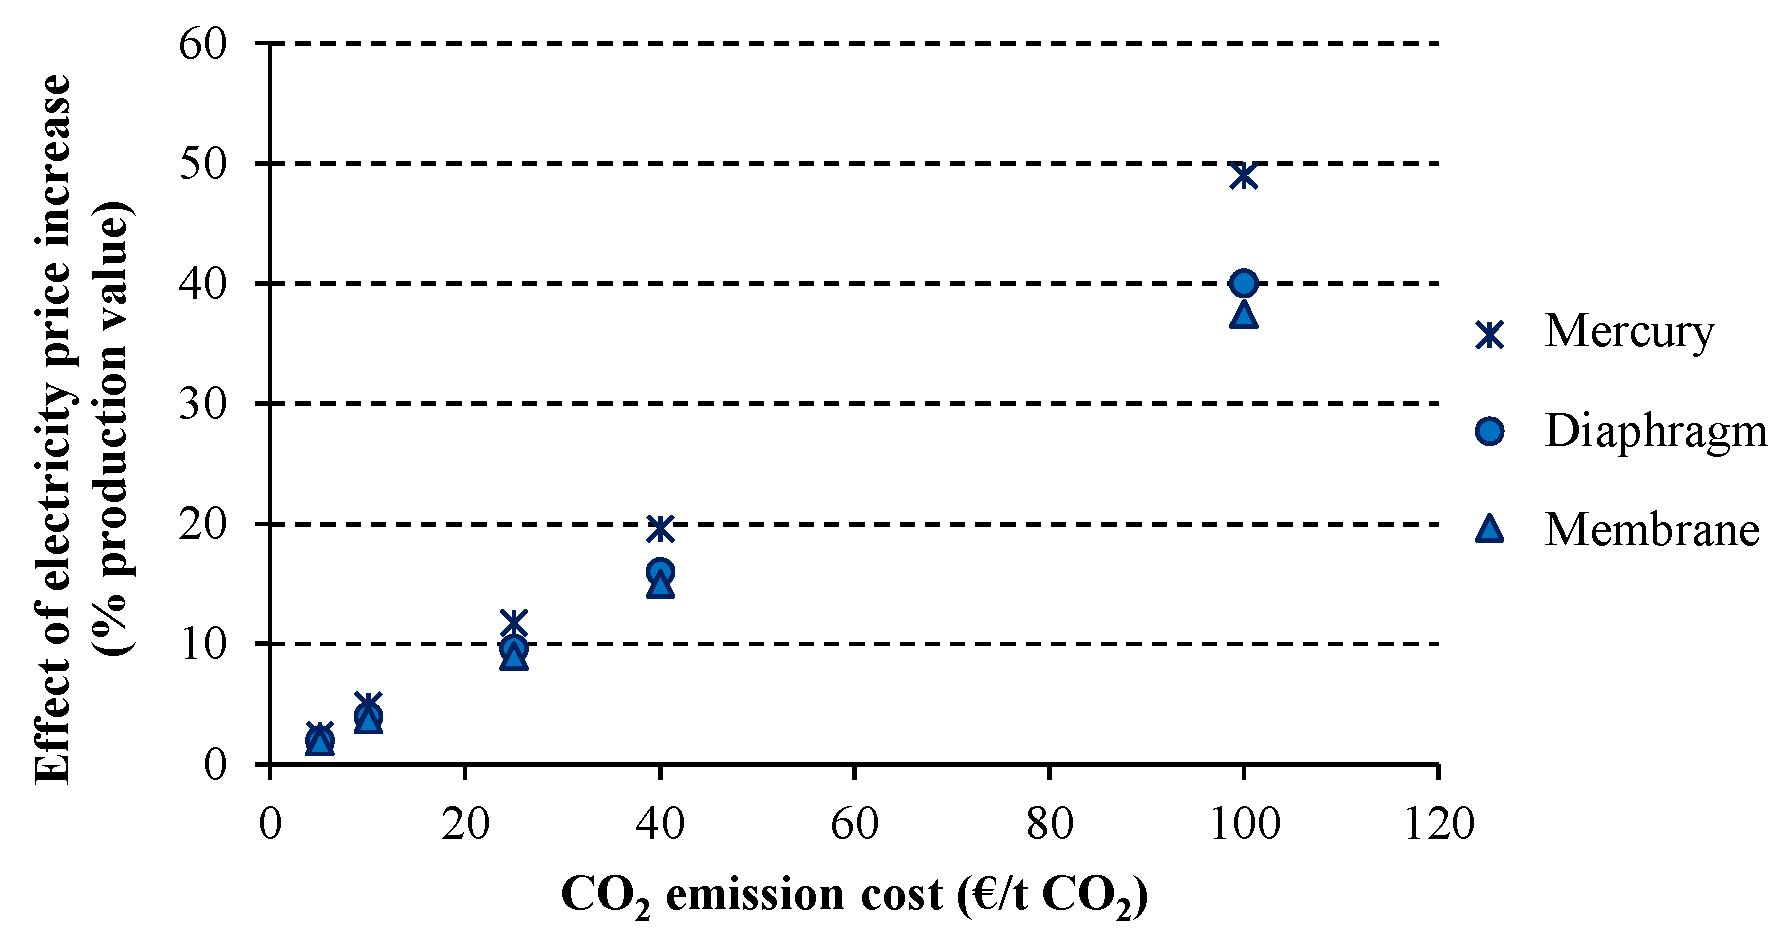
The indirect costs effect related to EU ETS are studied for each electrolytic technology of the chlor-alkali industry in
Figure 10. While membrane and diaphragm technologies are similarly influenced by the CO
2 emission costs, mercury technique presents a larger effect due to its higher energy intensity. For example when the CO
2 emission price is 25 €/t CO
2, the percentage over the production value is 9.6% and 9% for diaphragm and membrane, respectively, while 11.8% is observed for mercury technique. This influence becomes higher as the assumed price for the CO
2 emissions is increased.
To assess the sensitivity of the chlor-alkali process to the emission allowance price in terms of environmental sustainability, the analysis of EEESA index without indirect costs compensation is proposed.
The indirect costs can be translated into the percentage increase of electric energy price as follows:
Therefore, the electricity price index is modified as described in Equation (13):
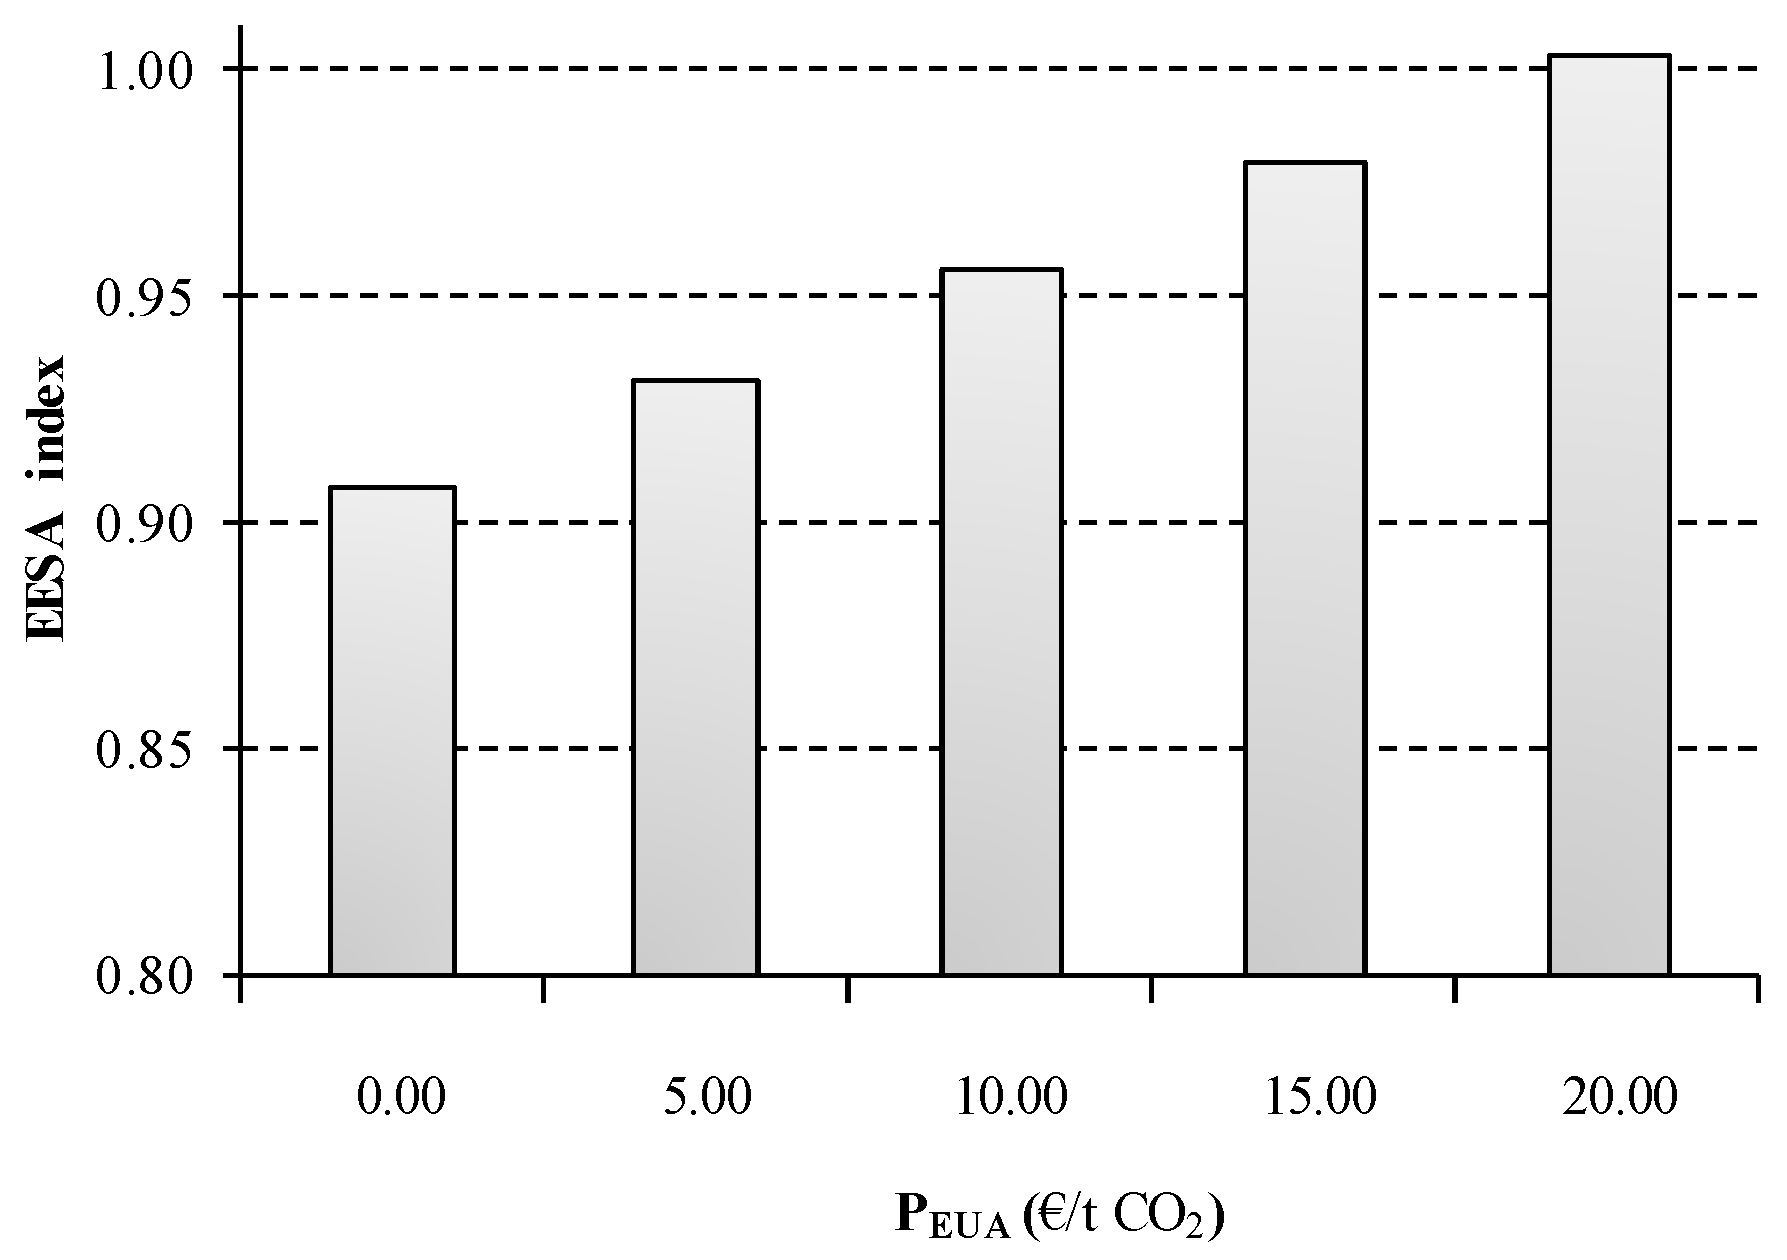
As can be observed in
Figure 11, the CO
2 emission trading system presents an important effect in the energetic, economic and environmental sustainability of the process. Assuming a EUA price of 20 €/t CO
2 involves a 14% indirect increase in the electricity price index of the scenario under study. As was previous described, the composite index is substantially affected by the electricity price of the process owing to the energy intensive nature of the chlor-alkali process. Consequently, the sustainability of S2 becomes 10% worse when the EUA price is raised to €20. Hopefully, a more moderate value is currently attached to EUA price (6.18 €/t CO
2), resulting in an increase of 2.6% over the base case scenario.
5. Conclusions
A detailed analysis to identify the main variables affecting the production costs of the chlor-alkali European sector is conducted. Based on these variables, an Energetic, Economic and Environmental Sustainability Assessment (EEESA) methodology is proposed to assess the vulnerability of the European chlor-alkali industry to chlorine replacement by DCE. The variables are integrated into a composite index that describes the energetic, economic and environmental sustainability of current and emerging technologies of the sector against the European average.
The vulnerability of the process depends on the operational conditions attached to specific consumptions and on the energy and raw material prices. Assuming no price discrimination for salt quality, the more vulnerable scenarios are those with higher energy demand: mercury and diaphragm technologies. The former is due to the electric consumption, while the latter is related to steam requirements for NaOH concentration. However, the salt price, which is a function of the quality requirements, influences significantly the energetic, economic and environmental sustainability of the process within scenarios describing the same technology. In particular, around a 30% reduction in the total EEESA impact is observed when vacuum salt is replaced by KCl waste.
The European emission trading system (EU ETS) indirectly affects the energetic, economic and environmental sustainability of the chlor-alkali industry due to the transfer of the CO2 emission allowance costs to the electricity price. Results suggest that the effect of the EUA price can involve until a 9% indirect increase over the production value for chlor alkali technologies when a 25 €/t CO2 is assumed. This effect is a 30% larger on mercury technology than on membrane and diaphragm techniques due to its higher energy intensity. Hopefully, a more moderate EUA value is currently adopted (6.18 €/t CO2), resulting in only a 2.6% increase. On the other hand, results suggest that the indirect costs compensation tool established by the EU ETS may reduce the total impact by 6% when the maximum compensation for the eligible costs is assumed. However, the different States’ policies lead to an increasing imbalance among the different regions. While some States are receiving the maximum compensation, others such as Spain do not reach 7.5% of the compensation needs for the same companies. Therefore, it is important to maintain a good balance between compensation grants and EUA prices in order to preserve the European homogenous competitiveness.
Hydrogen valorisation also emerges as an important variable influencing the energetic, economic and environmental sustainability of the chlor-alkali industry. Hence, the expected competitiveness of the emergent ODC technology may be challenged by the lack of hydrogen production.
In this study, it is concluded that, under a LCA approach, the environmental performance of the chlor-alkali industry has a similar tendency as the energetic-economic performance. Hence, it can be stated that a complex indicator that agglomerates this two LCA domains, can provide a very complete view of different plants behaviour and help the chlor-alkali sector on decision making in new investments or improvement projects that raise, for example, valuations in their processes.
Within the framework of constant industry restructuring, caused by environmental regulations and the adjustment of the capacity available to the current demand situation, emergent technology cannot be considered as an optimal option for the chlor-alkali sector. Furthermore, in view of the energetic, economic and environmental sustainability results and the high investment costs related, it is likely that the ODC technology does not acquire a predominant position in Europe in the mid-term.


 and
and 


