
Trend Analysis of Water Poverty Index for Assessment of Water Stress and Water Management Polices: A Case Study in the Hexi Corridor, China


Abstract
:1. Introduction
2. Materials and Methods
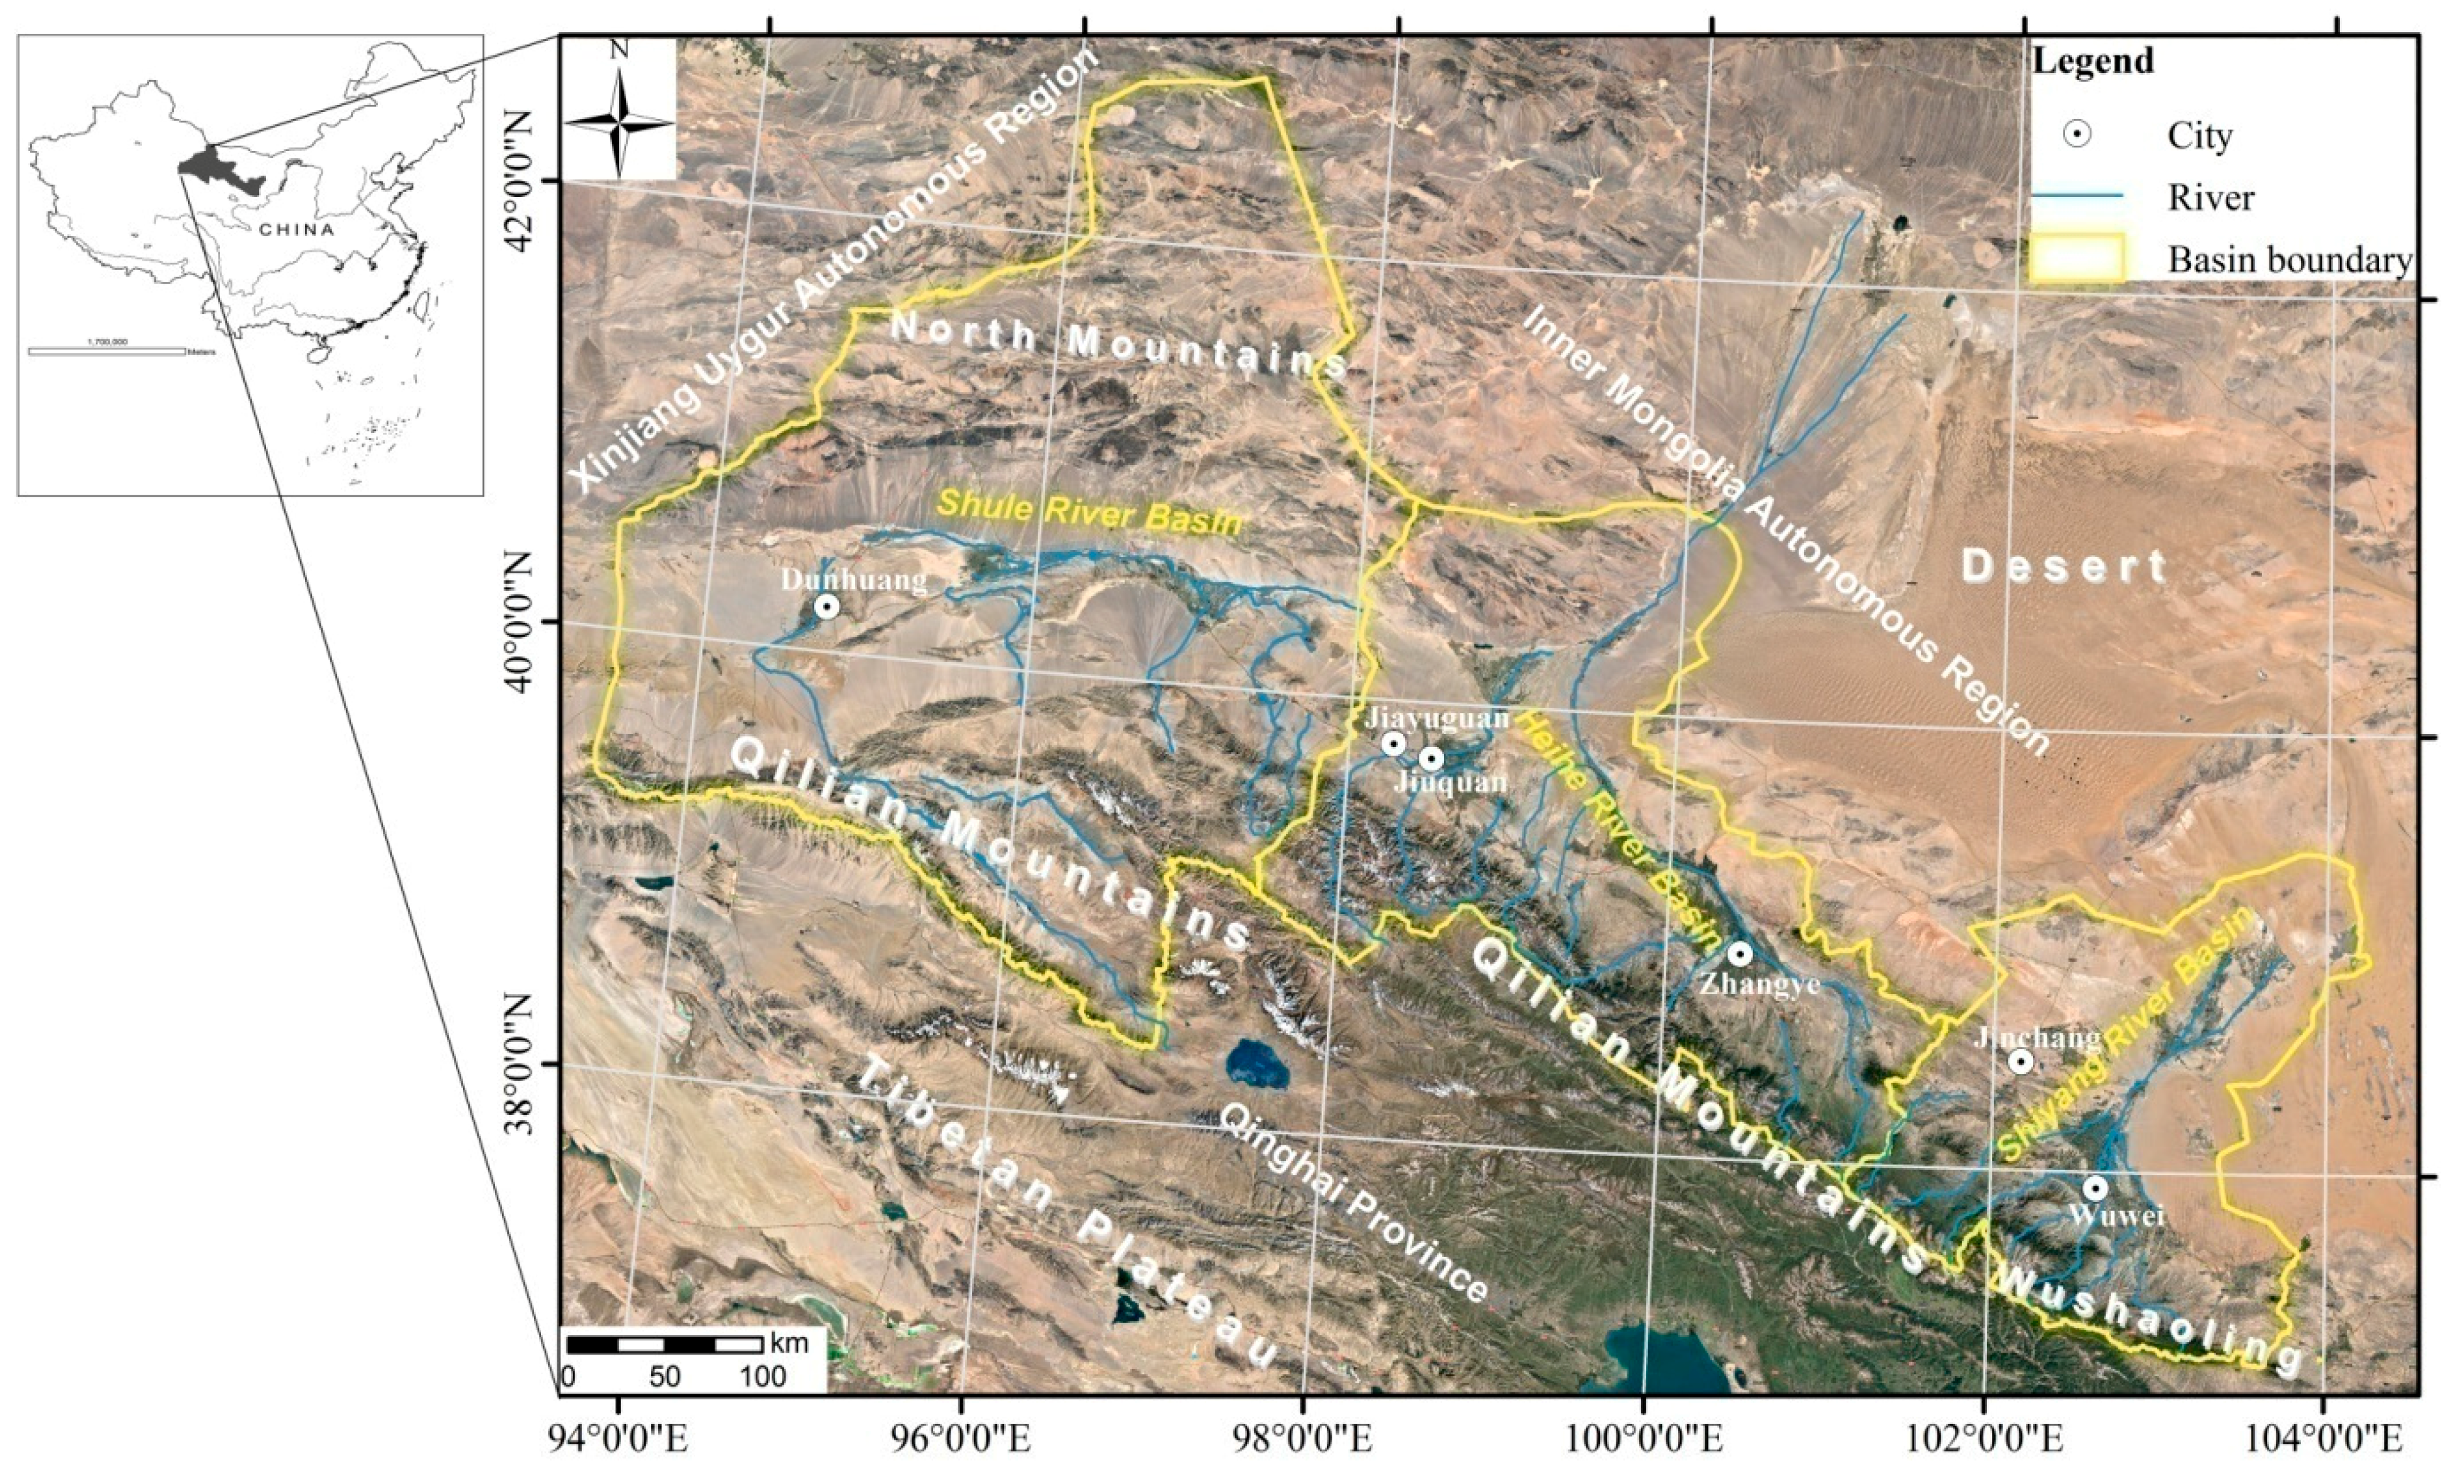
2.1. Study Area
2.2. Water Poverty Index (WPI)
2.3. Selection and Normalization of WPI
3. Results
3.1. Temporal Variation of the Components and Comparisons made among Basins
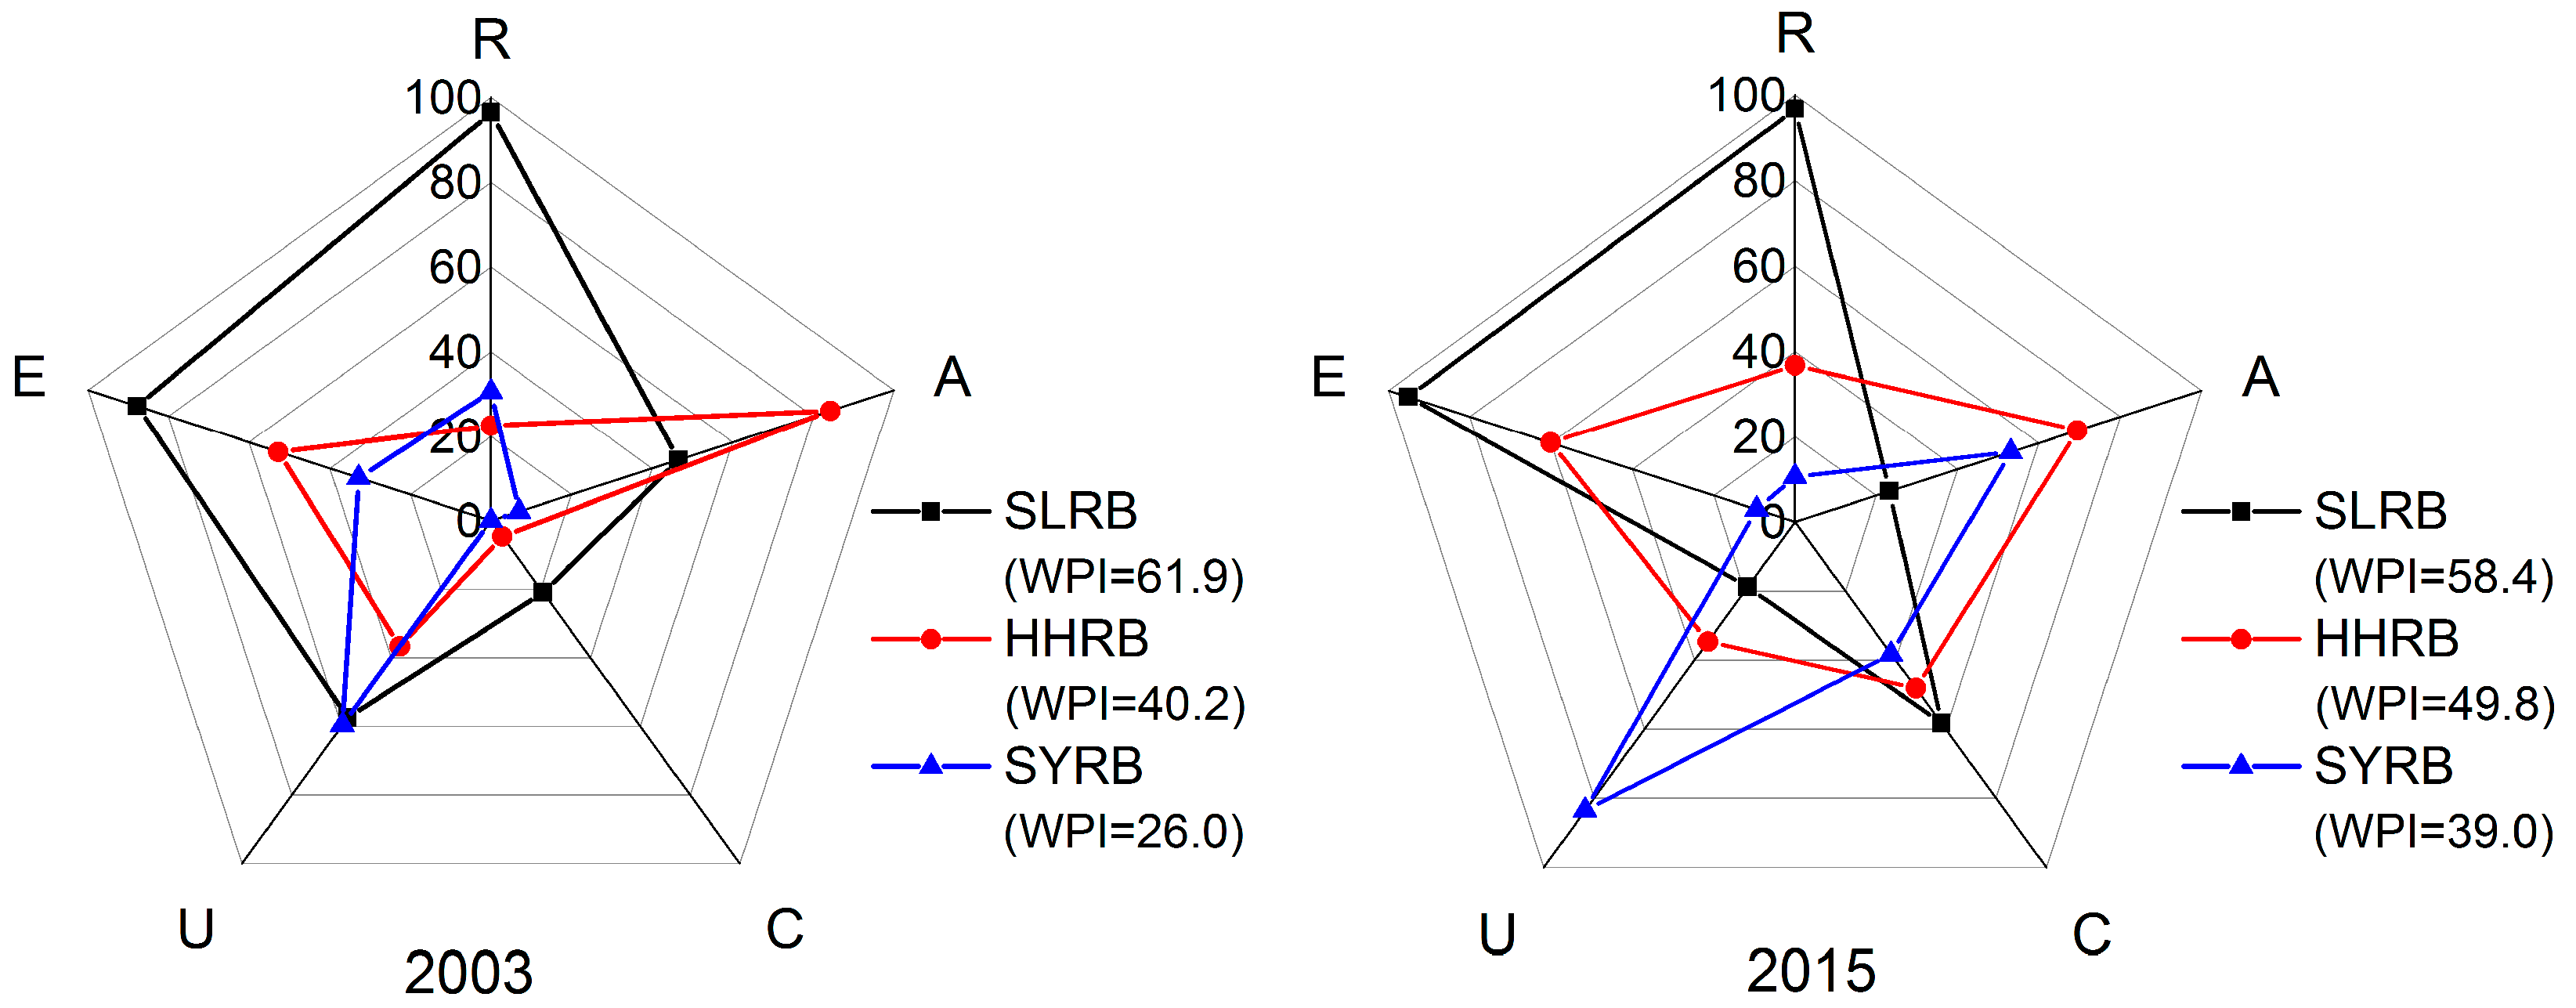
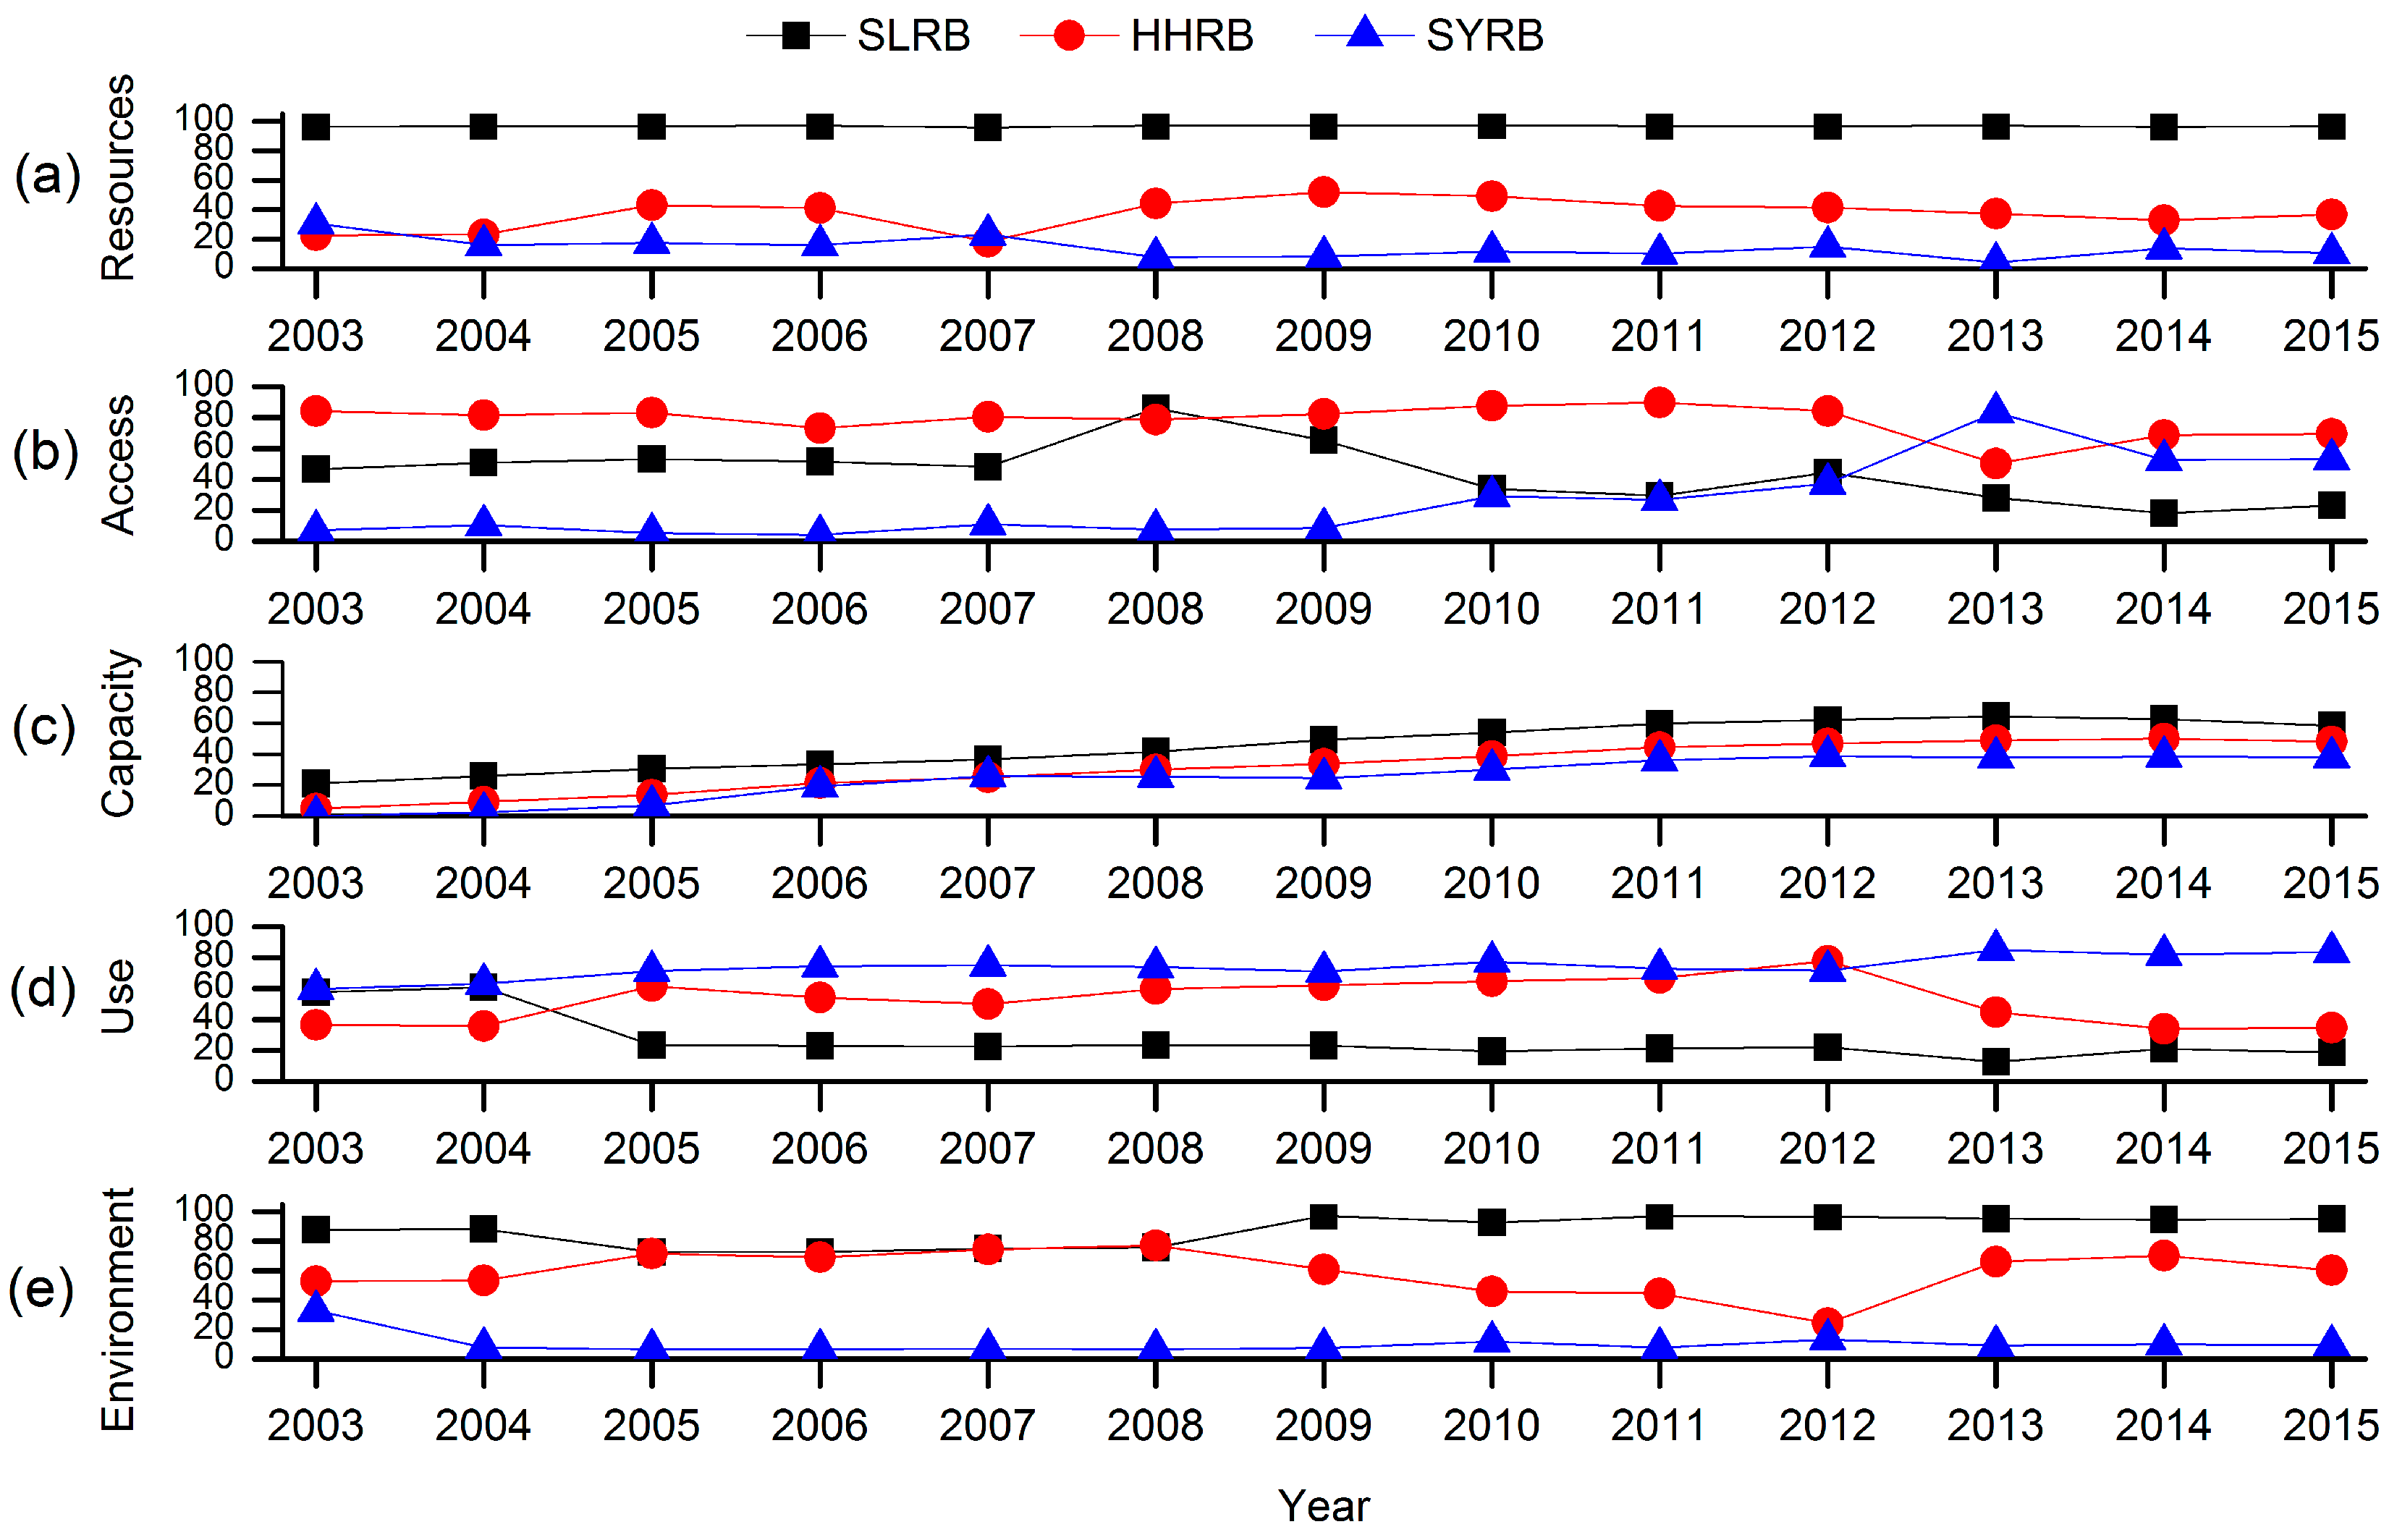
- Resources component: Based on Figure 2a, the water resources conditions in SLRB are better than in the other basins. In contrast, the SYRB represents a disastrous situation in terms of water resources. SLRB shows that the range between the highest and the lowest value was about 1.2; this indicates a stable water situation, especially in respect to the range found for both HHRB and SYRB, which attained values of 33.7 and 26.5, respectively. For HHRB, the resource component appears to fluctuate significantly and shows two periods of relatively high scores (>41) for 2005–2006 and 2008–2012. However, the graph also shows that the availability of water has been declining after a peak value found in 2009. In SYRB, the changes appear to occur in two stages; one that shows a decreasing stage (2003–2008), and the other a slight increasing stage (2008–2015). However the values of the first stage are higher than the later stage.
- Access component: The access component (Figure 2b), representing infrastructure to access water resources, stands at odds with the resources component, for which HHRB reveals the best water condition. Except for 2008, the index remains remained persistently higher than the SLRB. Interestingly, there is a decline after the year 2012. For the SYRB, this component shows an increase especially after the year 2009, with a dramatic rise in the score from 2009 (=8.6) to 53.1 in 2015. It is also noticeable that the curve for SLRB rises before the year 2008, but it exhibits a steep decline afterwards. This suggests that the infrastructure conditions in SYRB are improving more than in a trend noted for SLRB.
- Capacity component: The capacity to access water resources, as shown in Figure 2c, appears to be increasing on a year to year basis at least up till the year 2013. Interestingly, after the year 2013, the growth of this component for HHRB and SYRB became slower in terms of the change in the gradient of the line. Overall, in terms of the lowest to the highest value for the basins, the trend follows SLRB > HHRB > SYRB, indicating that SLRB has the largest while SYRB has the smallest capacity to access the water resources.
- Use component: Figure 2d shows the utilization (usage) of water resources, whereby the SYRB has the highest level and the greatest efficiency of water use. As such, the values for this component registered an increase of 25.3 during the present study period. In fact, HHRB shows the fastest-growing trend during the period 2005 to 2012 compared to the other study basins, although this appeared to fall rapidly after the year 2012. For SLRB, this component was relative higher in first two years, although its value declined and remained persistently low after the year 2004. This result indicates that better water utilization plans should be implemented in this basin to reduce the proportion of agricultural water resource consumption and, consequently, to increase the water use efficiency in the SLRB.
- Environment component: In this component, significant differences in the pollution of the surface water and the groundwater supply can be noted among the three study basins. From the changes in Figure 2e, we note that the environmental integrity in the SLRB appears to be the best since the score is the highest compared to the other components. However, the scores for the HHRB are generally better than those for the SYRB, except for the year 2012 when they were almost at par. It is important to note that, for HHRB, environmental pressure can be seen to fluctuate significantly. In fact, the changing processes driving this component in the SYRB appeared to be similar to its resources component (Figure 2a) that has two stages; one that is a decreasing phase (2003–2008) and the other that is a slightly increasing phase (2008–2015).
3.2. Temporal Variations of Water Poverty Situation
3.3. Spatio-Temporal Changes in WPI and the Components
4. Discussion
4.1. Outcomes of Polices on Settling Water Poverty
4.2. Issues and Challenges of WPI used to Assess Water Stress and Water Management Polices
5. Conclusions
Acknowledgments
Author Contributions
Conflicts of Interest
References
- Brack, W.; Dulio, V.; Agerstrand, M.; Allan, I. Towards the review of the European Union Water Framework management of chemical contamination in European surface water resources. Sci. Total Environ. 2017, 576, 720–737. [Google Scholar] [CrossRef] [PubMed]
- Rijsberman, F. Can develpoment of water resources reduce poverty. Water Policy 2003, 5, 399–412. [Google Scholar]
- Wilk, J.; Jonsson, A.C. From water poverty to water prosperity—A more participatory approach to studying local water resources management. Water Resour. Manag. 2013, 27, 695–713. [Google Scholar] [CrossRef]
- Iglesias, A.; Quiroga, S.; Moneo, M.; Garrote, L. From climate change impacts to the development of adaptation strategies: Challenges for agriculture in Europe. Clim. Chang. 2012, 112, 143–168. [Google Scholar] [CrossRef]
- Ludwig, R.; Roson, R.; Zografos, C.; Kallis, G. Towards an inter-disciplinary research agenda on climate change, water and security in Southern Europe and neighboring countries. Environ. Sci. Policy 2011, 14, 794–803. [Google Scholar] [CrossRef]
- Milano, M.; Reynard, E.; Koplin, N.; Weingartner, R. Climatic and anthropogenic changes in Western Switzerland: Impacts on water stress. Sci. Total Environ. 2015, 536, 12–24. [Google Scholar] [CrossRef] [PubMed]
- Kharrazi, A.; Akiyama, T.; Yu, Y.; Li, J. Evaluating the evolution of the Heihe River basin using the ecological network analysis: Efficiency, resilience, and implications for water resource management policy. Sci. Total Environ. 2016, 572, 688–696. [Google Scholar] [CrossRef] [PubMed]
- Jemmali, H.; Abu-Ghunmi, L. Multidimensional analysis of the water-poverty nexus using a modified Water Poverty Index: A case study from Jordan. Water Policy 2016, 18, 826–843. [Google Scholar] [CrossRef]
- El-Gafy, E.D. The water poverty index as an assistant tool for drawing strategies of the Egyptian water sector. Ain Shams Eng. J. 2015. [Google Scholar] [CrossRef]
- Lawrence, P.; Meigh, J.; Sullivan, C. The Water Poverty Index: An international Comparison; Keele Economics Research Papers; Keele University: Newcastle, UK, 2002; pp. 1–24. [Google Scholar]
- Pandey, V.P.; Manandhar, S.; Kazama, F. Water poverty situation of Medium-sized River Basins in Nepal. Water Resour. Manag. 2012, 26, 2475–2489. [Google Scholar] [CrossRef]
- Pires, A.; Morato, J.; Peixoto, H.; Botero, V.; Zuluaga, L.; Figueroa, A. Sustainability assessment of indicators for integrated water resources management. Sci. Total Environ. 2017, 578, 139–147. [Google Scholar] [CrossRef] [PubMed]
- Sullivan, C.A. Calculating a Water Poverty Index. World Dev. 2002, 30, 1195–1210. [Google Scholar] [CrossRef]
- Sullivan, C.A.; Meigh, J.R.; Giacomello, A.M. The Water Poverty Index: Development and application at the community scale. Nat. Resour. Forum 2003, 27, 189–199. [Google Scholar] [CrossRef]
- Heidecke, C. Development and Evaluation of a Regional Water Poverty Index for Benin; International Food Policy Research Institute (IFPRI): Washingtion, DC, USA, 2006; pp. 1–55. [Google Scholar]
- Sullivan, C.A.; Meigh, J. Integration of the biophysical and social sciences using an indicator approach: Addressing water problems at different scales. Water Resour. Manag. 2007, 21, 111–128. [Google Scholar] [CrossRef]
- Kini, J. Inclusive Water Poverty Index: A new tool for helping local water and sanitation services planning. Water Policy 2016. [Google Scholar] [CrossRef]
- Dickson, S.E.; Schuster-Wallace, C.J.; Newton, J.J. Water security assessment indicators: The rural context. Water Resour. Manag. 2016, 30, 1567–1604. [Google Scholar] [CrossRef]
- Pérez-Foguet, A.; Garriga, G.R. Analyzing Water Poverty in Basins. Water Resour. Manag. 2011, 25, 3595–3612. [Google Scholar] [CrossRef]
- Li, X.; Wan, J.; Jia, J.L. Application of the Water Poverty Index at the districts of Yellow River Basin. Adv. Mater. Res. 2011, 250–253, 3469–3474. [Google Scholar] [CrossRef]
- Van Ty, T.; Sunada, K.; Ichikawa, Y.; Oishi, S. Evaluation of the state of water resources using Modified Water Poverty Index: A case study in the Srepok River basin, Vietnam–Cambodia. Int. J. River Basin Manag. 2010, 8, 305–317. [Google Scholar] [CrossRef]
- Mogheir, Y.; Aiash, M. Evaluation of Gaza Strip water situation and Water National Plans using international Water Poverty Index (WPI). Int. J. Emerg. Tech. Adv. Eng. 2013, 3, 396–404. [Google Scholar]
- Manandhar, S.; Pandey, V.P.; Kazama, F. Application of Water Poverty Index (WPI) in Nepalese Context: A case study of Kali Gandaki River Basin (KGRB). Water Resour. Manag. 2012, 26, 89–107. [Google Scholar] [CrossRef]
- Jemmali, H.; Sullivan, C.A. Multidimensional analysis of water poverty in MENA Region: An empirical comparison with physical indicators. Soc. Indic. Res. 2014, 115, 253–277. [Google Scholar] [CrossRef]
- Franks, T.; Cleaver, F. Water governance and poverty: A framework for analysis. Progr. Dev. Stud. 2007, 291–306. [Google Scholar] [CrossRef]
- Mlote, S.D.M.; Sullivan, C.; Meigh, J. Water Poverty Index: A tool for integrated water managemen, Water Demand Management for Sustainable Development. In Proceedings of the 3rd Conference on Symposium, Dar es Salaam, Tanzania, 30–31 October 2002. [Google Scholar]
- Vyver, C. Water Poverty Index Calculation: Additive or multiplicative function? J. S. Afr. Bus. Res. 2013, 1–11. [Google Scholar] [CrossRef]
- Sullivan, C.; Meigh, J.; Lawrence, P. Application of the Water Poverty Index at different scales: A cautionary tale. Water Int. 2006, 31, 412–426. [Google Scholar] [CrossRef]
- Pan, Y.H.; Gu, C.J.; Ma, J.Z.; Zhang, T.S.; Zhang, H. Water Poverty Index in the inland river basins of Hexi Corridor, Gansu province. Adv. Mater. Res. 2014, 864–867, 2371–2375. [Google Scholar] [CrossRef]
- Zhang, H.; Ding, J.F.; Wang, J.F. Application of Water Poverty Index at three inland river basins in Hexi Corridor. Yellow River 2012, 34, 42–44. (In Chinese) [Google Scholar]
- Xiao, S.C.; Li, J.X.; Xiao, H.L.; Liu, F.M. Comprehensive assessment of water security for inland watersheds in the Hexi Corridor, Northwest China. Environ. Geol. 2008, 55, 369–376. [Google Scholar] [CrossRef]
- Zhang, R.; Zhang, R.J.; Duan, Z.H.; Tan, M.L.; Chen, X.H. The assessment of water stress with the Water Poverty Index in the Shiyang River Basin in China. Environ. Earth Sci. 2012, 67, 2155–2160. [Google Scholar] [CrossRef]
- Wang, F.; Mu, X.; Li, R.; Fleskens, L.; Stringer, L.C.; Ritsema, C.J. Co-evolution of soil and water conservation policy and human-environment linkages in the Yellow River Basin since 1949. Sci. Total Environ. 2015, 508, 166–177. [Google Scholar] [CrossRef] [PubMed]
- Comprehensive Development Project of Agriculture Irrigation and Inhabitant Resettlement in Shule River Basin Passed the Acceptance Check of the Ministry of Environmental Protection of the People’s Republic of China. Available online: http://www.gsslh.cn/lydt/lyyx/201111/3868.html (accessed on 30 November 2011).
- Cheng, G.D.; Li, X.; Zhao, W.Z.; Xu, Z.M.; Feng, Q.; Xiao, S.C.; Xiao, H.L. Integrated study of the water–ecosystem–economy in the Heihe River Basin. Natl. Sci. Rev. 2014, 1, 413–428. [Google Scholar] [CrossRef]
- Qiao, L.X; Shi, G.A. The implementation of unified water transfer in Heihe Basin. In China’s Water Conservancy Development Report; China Water Power Press: Beijing, China, 2005. [Google Scholar]
- Major Treatment Planning of Shiyang River Basin in Wuwei Pass the Acceptance. Available online: http://www.gs.xinhuanet.com/shiyanghe/2016-03/03/c_1118225596.htm (accessed on 3 March 2016).
- Chen, L.; Shi, P.; Wei, W. Water Poverty temporal-spatial differentiation in the Shi Yang River Basin. Res. Sci. 2013, 35, 1373–1379. [Google Scholar]
- Gleick, P.H. On methods for assessing water-resource risks and vulnerabilities. Environ. Res. Lett. 2015, 10, 111003. [Google Scholar] [CrossRef]
- Booysen, F. An overview and evaluation of composite indices of composite indices of development. Soc. Indic. Res. 2002, 59, 115–151. [Google Scholar] [CrossRef]
- Nickum, J.E. Irrigated area figures as bureaucratic construction of knowledge: The case of China. Int. J. Water Resour. D 2003, 19, 249–262. [Google Scholar] [CrossRef]
- Pulido-Calvo, I.; Gutiérrez-Estrada, J.C.; Savic, D. Heuristic modelling of the water resources management in the Guadalquivir River Basin, Southern Spain. Water Resour. Manag. 2012, 26, 185–209. [Google Scholar] [CrossRef]
- Santos, J.; Portela, M.M.; Pulido-Calvo, I. Previsão de secas na primavera em Portugal Continental com base em indicadores climáticos de larga escala. Ing. Agua 2015, 11, 211–227. [Google Scholar] [CrossRef]
- Silva, W.T.P.; Vieira, L.T.Q.; Rosa, D.M.S.; Campos, M.M.; Santos, A.A.; Souza, M.A.A. Otimização multiobjetivo de sistema de abastecimento de água rural. Ing. Agua 2016, 20, 217–232. [Google Scholar] [CrossRef]
- Saville, C.R.; Miller, G.R.; Brumbelow, K. Using envision to assess the sustainability of groundwater infrastructure: A case study of the Twin Oaks Aquifer Storage and Recovery Project. Sustainability 2016, 8, 501. [Google Scholar] [CrossRef]


| Study Basin | Name of Policy/Objective/Executive Period/Investment (Million US $) | Measures |
|---|---|---|
| SLRB | Comprehensive Development Project of Agriculture Irrigation and Inhabitant Resettlement in Shule River Basin: Empowered 7.5 × 10⁴ peasantry in central and western Gansu Province to SLRB to eliminate poor living conditions from 1996 to 2006; 295.1 | Inhabitant resettlement; Water infrastructure; Sustainable agricultural and economic developmental. |
| Comprehensive Planning of Rational Utilization of Water Resources and Ecological Protection in Dunhuang: Discharged 78 × 106 m3 of water to West Lake Nature Reserve in Dunhuang from Shuangta reservoir by 2015, and the water drained into the nature reserve must be more than 38 × 106 m3/year by 2020; from 2011 to 2020; 708 | Water-saving transformation in irrigation district; Ecological construction. | |
| HHRB | Ecological Water Transfer Project: To curb ecological deterioration downstream, an additional 2.55 × 10⁸ m3 water was discharged upstream to make sure its inflow reached 9.5 × 10⁸ m3 when 15.8 × 10⁸ m3 runoff from upstream; from 2000 to 2015 | Water transfer; Water-efficient agricultural practices; Grazing bans; Relocation/resettlement of herdsmen. |
| Building a Water-saving Society in Zhangye: (hold 91% of population and 95% of croplands of HHRB) Improve the carry capacity of water resources to achieve the win-win goal of ecological water transfer and regional development in HHRB; from 2002 to 2005 | Reform of water rights system; Control the total water resources; Readjust the industrial structures; Water-saving transformation in irrigation district. | |
| SYRB | Grain for green project in Minqin: Improve the ecological environment and maintain the survival and development of local area; from 2002 to 2013 | Convert cropland to forest and grassland; Afforest on waste land. |
| Shiyang River Basin Management Plan: Address water shortage, eco-environmental deterioration, and poverty in SYRB; Prevent Minqin from becoming the second ‘Lop Nur’; from 2007 to 2020; 712 | Water distribution plans and water quota; Improvement of irrigation canals; Closure of wells in irrigation, restriction on water use on cultivated lands; Develop facility agriculture and animal husbandry+fruit industry. |
| Basin | Area (km2) | Population (104 Person) | Groundwater Contributions to Water Budget (%) | Ratio of Irrigation Water (%) | Water Use Intensity (%) |
|---|---|---|---|---|---|
| SLRB | 169,983 | 50.4 | 21.9 | 82.3 | 76 |
| HHRB | 59,354 | 198.7 | 27.0 | 83.6 | 138 |
| SYRB | 40,687 | 223.2 | 32.4 | 85.3 | 146 |
| Components | Subcomponents/Unit | Indicators | Subcomponents Calculation |
|---|---|---|---|
| Resources (R) | R1: Per capita water availability(m3/yr) R2: Per ha water availability (m3/ha/yr) | a: water availability b: population c: cultivated land d: year-end reservoir water storage e: annual runoff f: effective irrigation area g: water-saving irrigation area h: actual irrigation area i: irrigation water consumption j: industrial water consumption k: total water supply l: GDP m: grain yield n: annual wastewater discharge o: groundwater supply | R1 = a/b ; if xij > 1700, YR1 = 1; if xij < 500, YR1 = 0. R2 = a/c |
| Access (A) | A1: % year-end reservoir water storage A2: % irrigation of cultivated land A3: % water-saving irrigation area | A1 = d/e A2 = f/c A3 = g/h | |
| Capacity (C) | C1: per capita GDP ($/person) | C1 = l/b ; min = $100, max = $40,000; | |
| Use (U) | U1: % irrigation water consumption U2: % industrial water consumption U3: output value of per m3 of water ($/m3) U4: grain yield of per m3 of water (kg/m3) | U1 = i/k U2 = j/m U3 = l/p U4 = m/i | |
| Environment (E) | E1: % pollution of surface water E2: % groundwater supply | E1 = n/e E2 = o/k |
| Year | WPI of SLRB | Compare to the Safe Value | Compare to WPI of China (48 ≤ WPI < 56) | WPI of HHRB | Compare to the Safe Value | Compare to WPI of China (48 ≤ WPI < 56) | WPI of SYRB | Compare to the Safe Value | Compare to WPI of China (48 ≤ WPI < 56) |
|---|---|---|---|---|---|---|---|---|---|
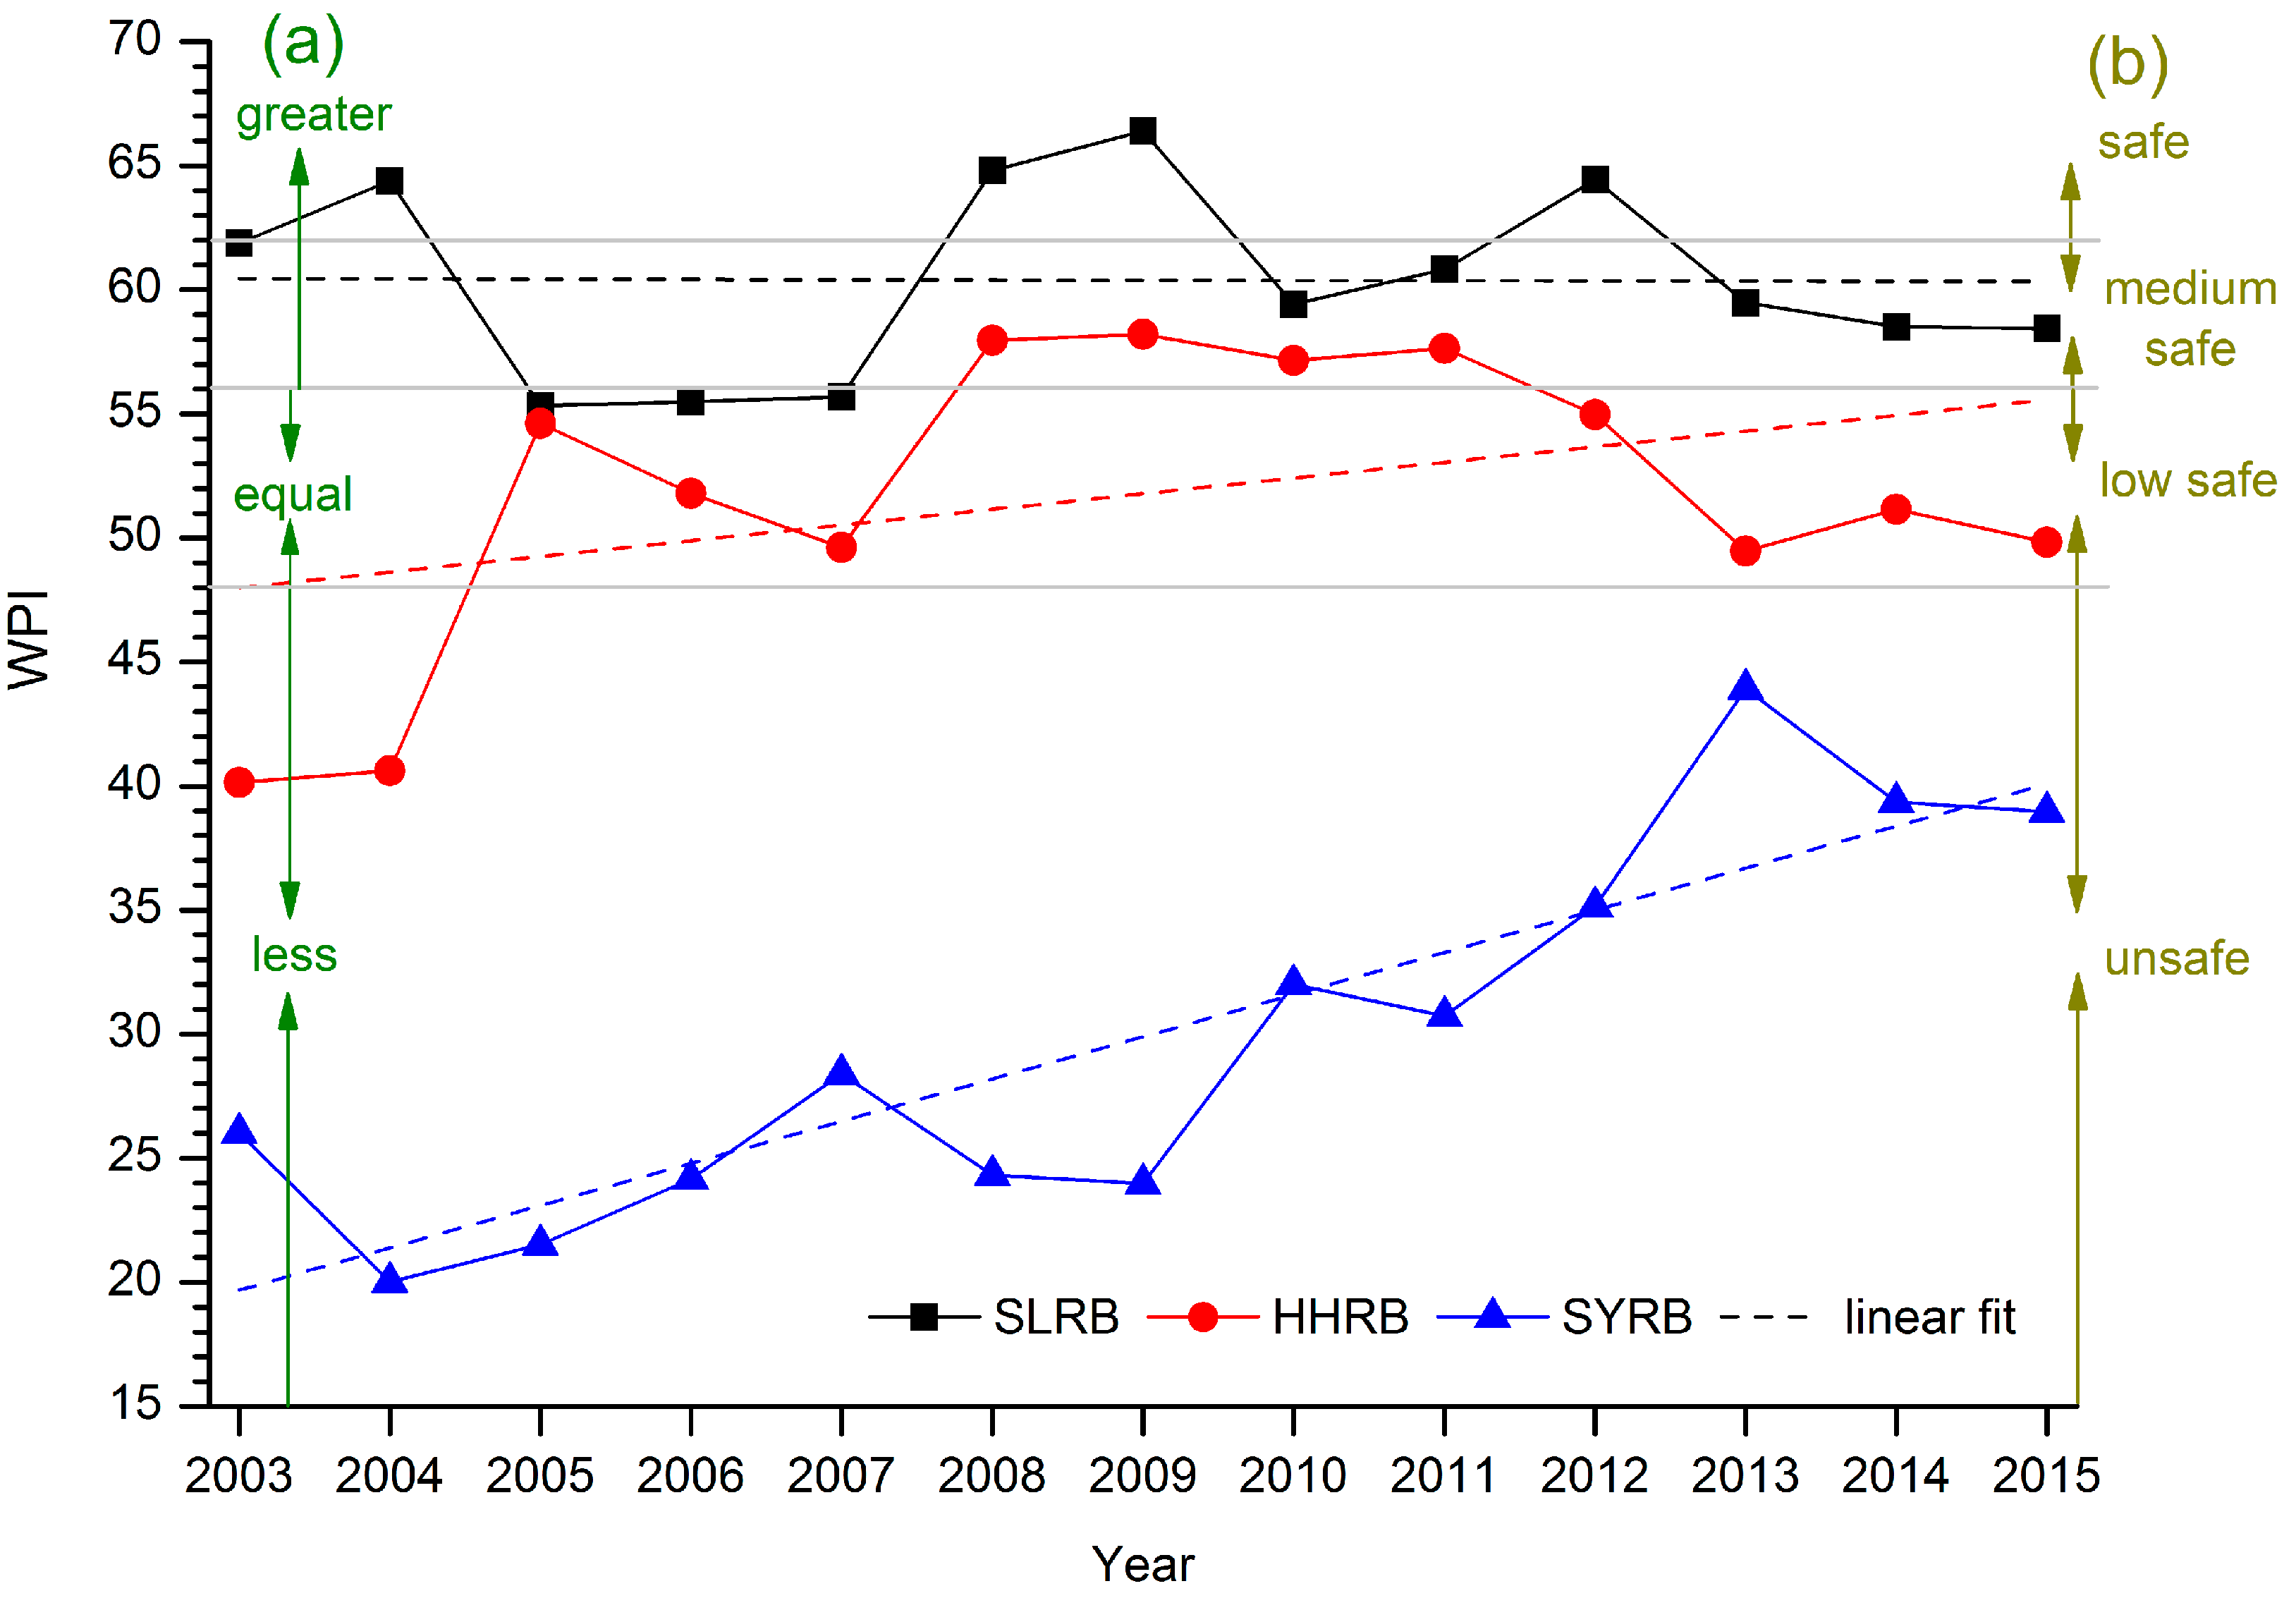
| 2003 | 61.9 | medium safe | greater | 40.2 | unsafe | less | 26.0 | unsafe | less |
| 2004 | 64.4 | safe | greater | 40.6 | unsafe | less | 20.0 | unsafe | less |
| 2005 | 55.3 | low safe | equal | 54.6 | low safe | equal | 21.5 | unsafe | less |
| 2006 | 55.5 | low safe | equal | 51.8 | low safe | equal | 24.2 | unsafe | less |
| 2007 | 55.7 | low safe | equal | 49.6 | low safe | equal | 28.4 | unsafe | less |
| 2008 | 64.8 | safe | greater | 58.0 | medium safe | greater | 24.3 | unsafe | less |
| 2009 | 66.4 | safe | greater | 58.2 | medium safe | greater | 24.0 | unsafe | less |
| 2010 | 59.4 | medium safe | greater | 57.2 | medium safe | greater | 32.0 | unsafe | less |
| 2011 | 60.8 | medium safe | greater | 57.6 | medium safe | greater | 30.7 | unsafe | less |
| 2012 | 64.4 | safe | greater | 55.0 | low safe | equal | 35.1 | unsafe | less |
| 2013 | 59.5 | medium safe | greater | 49.5 | low safe | equal | 43.9 | unsafe | less |
| 2014 | 58.5 | medium safe | greater | 51.2 | low safe | equal | 39.4 | unsafe | less |
| 2015 | 58.4 | medium safe | greater | 49.8 | low safe | equal | 39.0 | unsafe | less |
© 2017 by the authors. Licensee MDPI, Basel, Switzerland. This article is an open access article distributed under the terms and conditions of the Creative Commons Attribution (CC BY) license (http://creativecommons.org/licenses/by/4.0/).
Share and Cite
Huang, S.; Feng, Q.; Lu, Z.; Wen, X.; Deo, R.C. Trend Analysis of Water Poverty Index for Assessment of Water Stress and Water Management Polices: A Case Study in the Hexi Corridor, China. Sustainability 2017, 9, 756. https://doi.org/10.3390/su9050756
Huang S, Feng Q, Lu Z, Wen X, Deo RC. Trend Analysis of Water Poverty Index for Assessment of Water Stress and Water Management Polices: A Case Study in the Hexi Corridor, China. Sustainability. 2017; 9(5):756. https://doi.org/10.3390/su9050756
Chicago/Turabian StyleHuang, Shan, Qi Feng, Zhixiang Lu, Xiaohu Wen, and Ravinesh C. Deo. 2017. "Trend Analysis of Water Poverty Index for Assessment of Water Stress and Water Management Polices: A Case Study in the Hexi Corridor, China" Sustainability 9, no. 5: 756. https://doi.org/10.3390/su9050756
APA StyleHuang, S., Feng, Q., Lu, Z., Wen, X., & Deo, R. C. (2017). Trend Analysis of Water Poverty Index for Assessment of Water Stress and Water Management Polices: A Case Study in the Hexi Corridor, China. Sustainability, 9(5), 756. https://doi.org/10.3390/su9050756