
Urban Policies and Mobility Trends in Italian Smart Cities


DICAAR—Department of Civil and Environmental Engineering and Architecture, University of Cagliari, Cagliari 09123, Italy
*
Author to whom correspondence should be addressed.
Sustainability 2017, 9(4), 494; https://doi.org/10.3390/su9040494
Submission received: 16 February 2017
/
Revised: 8 March 2017
/
Accepted: 22 March 2017
/
Published: 25 March 2017
(This article belongs to the Special Issue Urban Sustainability and Planning Support Systems)
Abstract
:This study uses indicators to evaluate the progress made by Italian cities in the smart mobility sector, in order to understand how these cities have approached the new guidelines imposed by the European Union, and how they have implemented the European changes. Specifically, this study analyses the evolution of public transportation systems, using a sample of twenty-two Italian cities for three successive time periods (2005, 2010, and 2015). The outcomes identified are then linked to funding provided for the implementation of projects related to smart mobility in the cities studied, in order to verify possible correlations between the growth of these services and European and national financial investments. The data analysis shows remarkable progress in the field of sustainable mobility, especially between 2010 and 2015 as well as how this progress is linked to significant financial support that favours the realization of projects related to smart mobility.
1. Introduction
Sustainable mobility is a key concept in the research literature [1,2,3,4,5,6], and especially in public debates on major European and international initiatives on smart cities. National and international policies have increasingly been focused on issues of urban development, environmental sustainability, and mobility and transport. These issues are also the main themes of the Horizon 2020 Strategy [7]. By setting targets for the reduction of carbon dioxide (CO2) emissions, the European Union (EU) has drafted a series of guidelines and undertaken urban policy initiatives linked to sustainability, energy efficiency, renewable energy, and green mobility [8,9,10,11,12,13]. Most of these measures are supported by structured financing related to a study of global trends that are constantly being analysed by the European Strategy and Policy Analysis System (ESPAS). The ESPAS provides a framework for cooperation and consultation at the administrative level, between the European Parliament, the European Commission, the EU Council, and the European External Action Service, with the Committee of the Regions (CoR) and the European Economic and Social Committee (EESC) as observers. The objective of this project is “to identify the main global trends, assess their implications, and review the resulting challenges and policy options confronting decision-makers”, on medium- and long-term trends [14]. The ESPAS 2015 document reveals that five key issues are affecting global trends for the near future: population growth; economic and political weight shifting towards Asia; the technological revolution; climate change and resource management; and the interdependence of countries that lack the capacity for global governance, where issues of sustainable mobility are transversal. These trends are changing the practice of urban planning, to the extent that today a new approach is needed, namely an approach that “combines social, technological, democratic and sustainable aspects of urban life revolving around innovative and democratic urban governance” [15]. Komninos conducted a broad analysis of this new way of governing the city [16], and highlights key aspects of the city of the future, where science, technology, and innovation, strengthened by knowledge and creativity, are the new governance models.
Today, the main objective of the EU strategy is to implement sustainable transport policies. There are two facets to solving problems related to development, planning, and urban management. First, planners must study and analyse new transport methods. Second, planners must consider that outcomes will also be significantly influenced by how people respond to new transport methods. Cities and local authorities play crucial roles in the implementation of this strategy. In Europe, incentives for low-emission vehicles are already being implemented, by encouraging modal shifts to active travel (cyclists and pedestrians), public transport and/or joint mobility, using means such as cycling, car-sharing and car-pooling, that help reduce traffic congestion and lower pollution levels.
For this reason, the authors have decided to conduct an analysis of the development of sustainable mobility at the national level, to assess how Italy is adapting to the implementation of smart mobility policies, and how effectively it is providing its expertise to the organizations that are beginning to adopt this new way of looking at mobility. This research evaluates the progress that has been made in the field of smart mobility by twenty-two Italian cities—with at least one city per region. It analyses key aspects of sustainable mobility such as public transport, cycle lanes, bike sharing, and car sharing. Some indicators (such as the number of stalls available for interchange parking) were considered for 2010 and 2015 as were the number of stalls available for electric cars in 2015, because complete data were not available for all years. For this reason, these indicators have been considered only as part of a second synthetic indicator analysis that analyses this range of years.
This analysis used quantitative indicators to assess infrastructural facilities in relation to the urban area and the resident population. In addition, the study compared the funding for smart mobility projects and the consequent evolution in the field of mobility in the sample cities. Doing so allowed us to assess the extent to which national and European investments have led to improvements related to smart mobility. To summarize this study’s findings, the paper has been organized into five sections. Section 2 discusses sustainable mobility as a topic of great interest for urban development. Section 3 summarizes the research that has been undertaken to evaluate urban development and mobility, and analyses the main projects, the EU, and the national funding that has encouraged this development. Section 4 describes the methods used to conduct this research, which involved analysing pertinent variables and their respective indicators, the cities surveyed, and how the smart mobility indicator was generated. Section 5 discusses the results obtained by analysing the changes that occurred in the context of smart mobility between 2005/2010 and 2010/2015 for each variable. This section also considers the results that emerged using the synthetic index of smart mobility, by assessing whether the financing the cities in this study had received contributed to improved mobility. Section 6 presents the study’s findings, and provides reflections on future mobility research.
2. General Concepts
2.1. Sustainable Mobility and Urban Development
The transportation sector has the greatest impact on cities’ energy consumption and pollution levels. With reference to the European Union’s twenty-seven countries, Staricco [17] notes that 25% of greenhouse gas emissions, and more than 30% of the total energy consumed in 2010, was due to the transportation sector. It is significant that over 90% of these results are from non-renewable sources. Furthermore, urban mobility accounts for 40% of transportation’s CO2 emissions [17] (p. 342).
For these reasons, sustainability is a key concern for modern transportation systems [18], and so for urban planning. Modern urbanization is leading to the continuous expansion of urban areas, and the consequent strengthening of the commuting phenomenon that generates increased demands for mobility while creating congestion. This increases the time spent travelling, the pollution created, and the predilection for private vehicles over public transport. These problems have resulted in a degradation of the quality of life of citizens. They have also led to an increase in the number of road accidents—which have a strong impact on public spending—and they have contributed to a lack efficient transportation that has increased operating costs and the time spent travelling [19].
Italy—a country in which the lack of valid alternative transportation has fostered private ownership of a high number of road motor vehicles—has the second highest number of private vehicles registered in Europe, with 604 vehicles per 1000 inhabitants. In addition, private cars are responsible for 66% of the travel that occurs on Italy’s roads. Precisely for this reason, the National Law 28 December 2015, No. 221 (officially published on 18 January 2016, No. 13) that prescribes the “Environmental dispositions to promote the green economy measures and the excessive use of natural resources containment” (Disposizioni in materia ambientale per promuovere misure di green economy e per il contenimento dell’uso eccessivo di risorse naturali) is particularly important for Italy. This law includes the provision of funds equivalent to 35 million euro for municipalities with more than 100,000 inhabitants, to finance sustainable transportation projects that will limit traffic and pollution. These projects include the following: the construction of bike paths, walking and bus initiatives, car pooling, car sharing, and bike sharing; the creation of protected routes for travel, to and from school, on foot or by bicycle; the development of educational information on road safety; and traffic avoidance programs, workshops and educational tours funded with sustainable means.
What has emerged from the various reports of the European Commission in recent years is the awareness that investments in infrastructure or in the green technologies research field are not the only means for achieving the above objectives, and that investments must be accompanied and supported by towns capable of governing place-based urban transformations, and by widespread actions that will raise government awareness of its responsibility for improving urban life [20]. According to Yigitcanlar, Fabian, and Coiacetto [21], “authorities are strongly involved in transportation development for several reasons including the need for long range planning to reserve rights-of-way for future development, the huge financial investment and the consideration of negative external effects. Thus, transportation development is sensitive to political priorities” [21] (p. 29). In addition, Yigitcanlar [22] argues that the ability to intervene and coordinate responses to economic, environmental, and governance problems must be constantly monitored, as these problems have become more and more pressing issues in the current debates on cities. He also declares that knowledge of urban agendas has become a vital tool for urban development planning.
2.2. Differences between Sustainable Mobility and Smart Mobility
Based on the above arguments, and given that the authors argue that mobility cannot be considered smart if it is not sustainable, the most substantial difference between sustainable mobility and smart mobility is that smart mobility is an integrated system comprised of several projects and actions all aimed at sustainability. This could be compared to the administration of drugs by smart delivery systems (smart transport) from periphery to the central nervous system of the human body (smart mobility), in order to improve the whole system [23,24].
Therefore, the authors posit that sustainable mobility can be considered as one component of smart mobility, and according to Lyons [25], there exists “a lack of consensus in terms of smart cities and a paucity of literature seeking to make sense of smart urban mobility”.
Smart mobility is often presented as one of the main options for more sustainable transport systems, and it has a remarkable breadth of content and implications, because of the large number of variables with which it is connected. It is possible to identify many studies focused on individual applications in the literature, while it is more difficult to find studies that provide a holistic view of these and related actions [26]. Benevolo et al. [26] (p. 16) state that smart mobility “could also be seen as a set of coordinated actions addressed at improving the efficiency, the effectiveness and the environmental sustainability of cities. In other words Smart Mobility could consist of a hypothetically infinite number of initiatives often (but not always) characterized by the use of ICT”.
The main aspect of smart mobility is connectivity; thanks to connectivity and big data, users can transmit all the traffic information in real time, and public administrators can simultaneously conduct dynamic management. Data related to mobility may change constantly (e.g., data on available parking spaces, traffic conditions, accidents, train or bus delays), and may be communicated immediately to the mobile app users, to ensure a smart, easy, and smooth trip.
Today, people need access to various urban services; numerous examples from various cities have shown that improved accessibility cannot be achieved using motorized traffic, but by creating sustainable transport alternatives (such as smart bike sharing systems, electric car sharing, public transport, and cycling mobility). Smart mobility has many advantages. It helps to reduce a city’s traffic congestion and improve traffic safety. The use of smart transport systems also leads to significant social benefits, and therefore economic and environmental aspects are key to ensuring sustainability in urban development.
3. Current Urban Development Issues Related to Mobility
3.1. Evaluation Processes for Sustainable Urban Development
Improving urban sustainability and mobility has been the EU’s central theme for several years. The EU has encouraged policies and paid increasing attention to sustainable mobility projects and the integration of new forms of mobility, with the objective of significantly reducing pollution in major cities [27,28,29,30]. According to Pieralice and Trepiedi [31] (p. 2), “In order to influence the policies of local authorities, it is necessary to have some means indicative of the mobility phenomenon”. In his study, he identified a sustainability index that could be used to evaluate environmental sustainability by analysing the modal changes, and how they affected mobility and the environment. This tool could help governments assess good practices in urban centres over time. Therefore, one activity that can help cities achieve the EU’s objectives is constantly evaluating and monitoring cities’ progress, and so gathering sufficient knowledge of the investments needed to improve the quality of life in urban areas.
This performance assessment can be made using the key indicators that will guide municipalities in the development of strategies to make smarter and more sustainable cities [32]. The performance evaluation process can be divided into three main phases of analysis: measurement, management, and evaluation. According to FORMEZ PA [33] (p. 6) “Performance is the result that is obtained conducting a particular activity. The elements of definition of the performance are: (i) the result, expressed ex ante as a target and ex post as an outcome; (ii) the body to whom this result is due; and (iii) the activity that is put in place by the body to achieve the result”. Numerous studies analyse the development and performance of cities using indicators, after which they compare them with each other and assess progress [34,35,36,37,38,39,40]. Among the problems these studies surely encounter are the incomplete availability of data, and the difficulty of weighing indicators with different units of measure, and combining them to obtain a single indicator [41]. There are a growing number of studies in the literature that present benchmarking methods and analyses that compare various methodologies, to verify which major investments in the field of smart cities are optimal [42,43].
Useful tools for conducting analyses on cities and their evolution include data collection platforms such as European Smart Cities [44], ICitylab [45], the sustainable mobility observatory in Italy (Osservatorio mobilità sostenibile in Italia) [46], and Agenda Urbana [47]. They make historical data available for cities on different types of variables and indicators, allowing them to be evaluated and compared. One of the first platforms has been European Smart Cities, built by the Vienna University of Technology in collaboration with Planning for Energy Efficient Cities (PLEEC), based on a study by Giffinger et al. [48] that provides full information regarding what innovations are occurring in the urban environments of European cities. The ICitylab platform—Towards Smart Cities (Verso le città intelligenti)—collects and evaluates annual data from all of the project’s partner cities, and generates a ranking for each analysed variable (2016 the analysed fields are economy, governance, environment, living, people, mobility, and legality). It then creates a general indicator that defines an annual ranking of Italy’s smart cities. The platform, Sustainable Mobility Observatory in Italy (Osservatorio mobilità sostenibile in Italia), realized by Euromobility under the patronage of the Italian Ministry of Environment and Protection of Land and Sea, exclusively analyses the field of mobility for fifty Italian cities with more than 100,000 inhabitants. These analyses, conducted using indicators and subsequently a ranking, led various cities to identify their strengths and weaknesses, to evaluate other urban areas, and to allocate resources in areas that needed improvements.
Another interesting platform is “Agenda Urbana”, which includes all the initiatives and funding made available to local administrations for the implementation of projects in a smart view. Collecting the best experiences in the field of smart cities on one platform is very important for stimulating learning, sharing information, and ensuring that best practices can be replicated in all cities.
3.2. Projects and Funding Related to Urban Development and Sustainable Mobility
As mentioned above, in recent years the European Union’s interest in urban issues has grown considerably, and it has directed most of the funding dedicated to urban development projects (such as the Horizon 2020 Strategy) to this sector. This study aims to evaluate how smart mobility has developed from 2005 to the present, and to verify the possible correlations between the development of smart mobility and the funding made available by the European Union or by Italy.
Gargiulo, Pinto, and Zucaro [49] summarize the main funding and strategic programs for urban and spatial development, and many of these also affect some of the cities used as case studies for this study, as defined in paragraph 3.2. The major funders include the following: (i) the European Regional Development Fund (ERDF) that supports regional and local development by co-financing investments in different sectors (such as research, development and innovation, information and communication technologies, energy, transportation, and sustainable urban development infrastructure; (ii) the European Social Fund (ESF) that promotes employment, education and training, social inclusion, and improving the efficiency of public administration; and (iii) the Cohesion Fund (CF) that supports projects in the energy sector, in energy efficiency, and the use of renewable energies. It is designated for Member States whose per capita GDP is less than 90% of the community average.
Other examples are the Trans-European Transport Network (TEN-T) that aims to develop the priority network for road transport, for inland waterways and seaports, and high-speed rail, and the LIFE program, which is a tool intended to support the environment, nature conservation, and climatic actions in projects across the EU. Among the most significant national programs in the field of smart mobility are the Structural Funds ‘Smart Cities and Communities and Social Innovation’, the National Funds for System Innovations in Local Authorities (ELISA Program), and the project titled Sustainable Urban Mobility and Cultural Heritage (Mobilità Urbana Sostenibile e Attrattori culturali (M.U.S.A)).
The ELISA Program [50] finances the implementation of projects developed by local authorities, preferably aggregates with each other. Its objectives are: (i) “to encourage the digitization of administrative activity”; (ii) “to ensure the overall growth of the territories”; (iii) “to reduce the digital divide in small municipalities and in mountain areas”; (iv) “to ensure the sustainability of the results for the benefit of citizens and businesses”; (v) “to enhance the area and at the same time improve the national system”; (vi) “to ensure the standardisation of design parameters, through models of application and the possibility of their replicability throughout the national territory”; and (vii) to demonstrate the coherence of local authorities’ actions with regional plans. In the field of mobility, this program aims to achieve the integrated management of logistics and infomobility in local public transport, in urban and suburban domains, for public and private mobility.
The M.U.S.A project [51] is aimed at encouraging the development of policies and innovative interventions in economic, social, and environmental sectors, where sustainable mobility plays a significant role, and particularly in the urban regions of the Convergence Objective—Calabria, Campania, Puglia, and Sicily. To further exemplify that sustainable mobility is today a fundamental aspect of urban development, it should be noted that the entity’s investment amounted to €820,513,992, involved 80 municipalities in the Italian territory alone, and realized 245 projects. This work is supported by the Italian Smart Cities platform, which demonstrates the particular interest of administrations in the theme of cycling mobility (64 projects), shared mobility (31 projects), pedestrian mobility (21 projects), and local public transportation improvements (45 projects).
This research analysed the previously described platforms—which facilitated the implementation of state of the art projects—and the funding dedicated to smart mobility, and then assessed whether these investments are actually producing positive outcomes in the cities analysed.
4. Methodology
4.1. Case Studies Selection
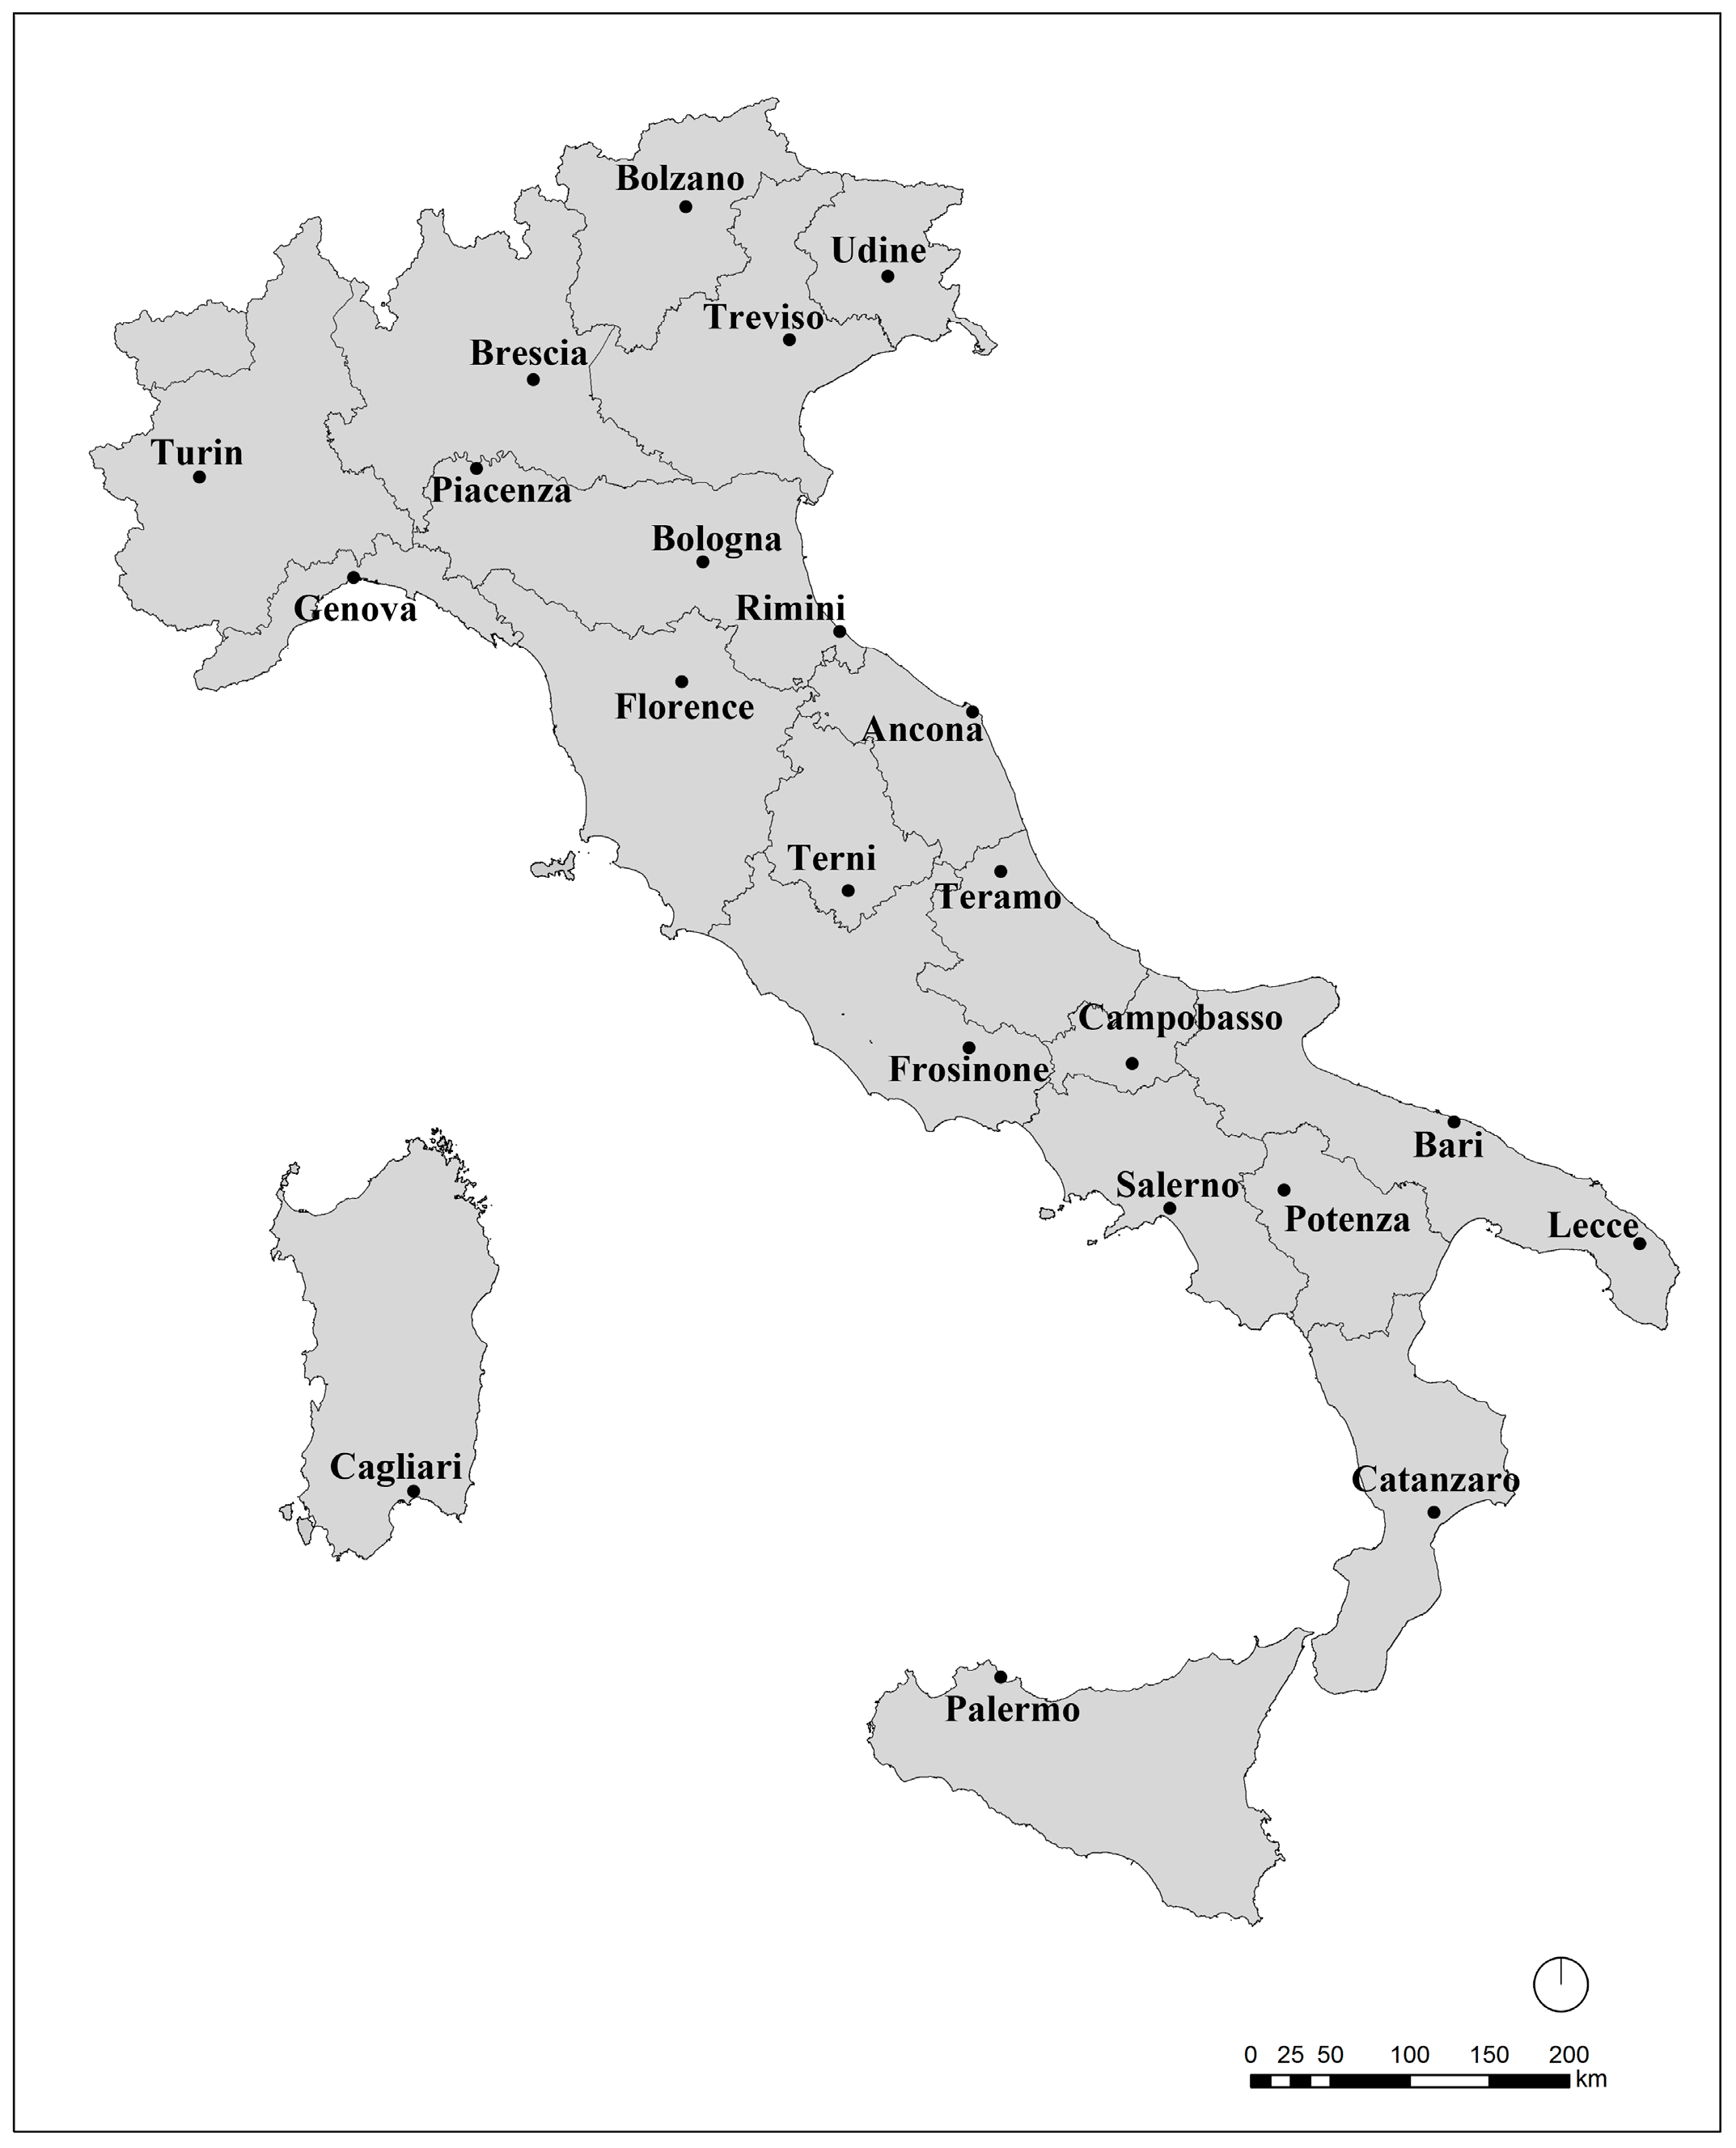
The authors analysed the Italian context with the objective of identifying one city per region (Figure 1) with an urban extension of between 50 and 250 square kilometres, which is representative of an average Italian city. Several different cities have been combined for this study, because the focus of our research is to analyse the spatial distribution of the transport network, and Turin, for example, is an urban reality with a good transport system. In addition, attention was focused on those cities that shared the most data for the selected indicators. The Valle d’Aosta region was excluded from this study’s sample, because it has no cities with the urban extension selected for this study. The final selection was based on two fundamental principles: (1) the relative availability of data to identify a sufficient number of specific indicators; and (2) a size that facilitated the comparison of data between cities.
The data analysed for this study came from different sources, and included official sites of the public transportation companies, bike sharing and car sharing data for each selected city, the online sites of the different municipalities, and studies of the National Institute of Statistics (Istituto Nazionale di Statistica) on “Quality Education of Urban Environment” and “Urban Mobility” [52,53].
4.2. Selection and Use of Indicators
According to Garau, Masala, and Pinna [6,38], four variables were used to study the main aspects of mobility in the Italian cities selected, and to measure changes to sustainable mobility. The first variable was Public Transport, which is comprised of the indicators Bus Network Density (the number of kilometres of the network in the territorial extension and the Demand for Public Transport (the number of passengers per year in relation to the number of inhabitants). The variable Cycle Lanes was composed of the indicators Cycle Lanes Density (the kilometres of the cycle paths network in relation to the territorial extension), and Cycle Lanes per Ten Thousand Inhabitants (the kilometres of cycle paths per 10,000 inhabitants). The third variable is Bike Sharing, which is comprised of a Bicycle Station Density indicator, and the number of Bicycles per 10,000 Inhabitants indicator, which, respectively, quantify the number of stations on the territorial extension and the number of bicycles per 10,000 inhabitants. The last variable concerns Car Sharing, which is composed of the Station Indicator, which quantifies the number of stations per 10,000 inhabitants, and the Car Indicator, which quantifies the number of cars per 10,000 inhabitants, which respectively measure the number of car sharing stations in each municipality and the number of cars per 10,000 inhabitants. Each of these indicators is used to analyse each variable from a city and a population perspective.
Among all the indicators considered, the number of stalls in the existing interchange parking and the number of electric cars have only been analysed for the year 2015, because no data were available for 2005/2010. For this reason, in the comparison of the cities, these two indicators have only been used for 2015.
The analysis and development of indicators was completed for each city. For purposes of illustration, Table 1 summarizes the collection of absolute values for the city of Cagliari for all four variables (Public Transport, Cycle Lanes, Bike Sharing, and Car sharing) for the years 2005, 2010, and 2015. Table 1 also shows the relative changes between the ranges for 2005/2010 and 2010/2015, for which the +, −, and = signs refer to improving, worsening, or no change in data, respectively.
Once the data had been processed for all the cities, it was possible to compare the indicators using different units of measurement by normalizing the values using a measuring scale, which, at the authors’ discretion, ranged from a minimum of 0.01 to a maximum of 10.00. Formula (1), as follows, was used for standardising indicators:
where
xir = {[x − min(xi)]/[max(xi) − min(xi) ]} × 10
- xir = standardised indicator;
- x = indicator;
- min(xi) = minimum value of the indicator; and
- max(xi) = maximum value of the indicator.
According to Mazziotta, Mazziotta, Pareto, and Vidoli [54], a smart mobility synthetic index is created by merging the indicators for each variable, using the arithmetic mean, and subsequently aggregating the definitive indicators for each variable, using the geometric mean. The use of two different means implicitly assumes that there is some interchange ability between the elementary indicators belonging to the same variable, and that there is instead a lower substitutability among the variables that contribute to determining the total synthetic index.
The generic formula for the arithmetic mean is:
x = (x1 + x2 +…+ xn)/n
The generic formula for the geometric mean is:
x = (x1 × x2 × x3 ×…× xn )^ (1/n)
5. Analysis of Results
5.1. Analysis of Single Variables
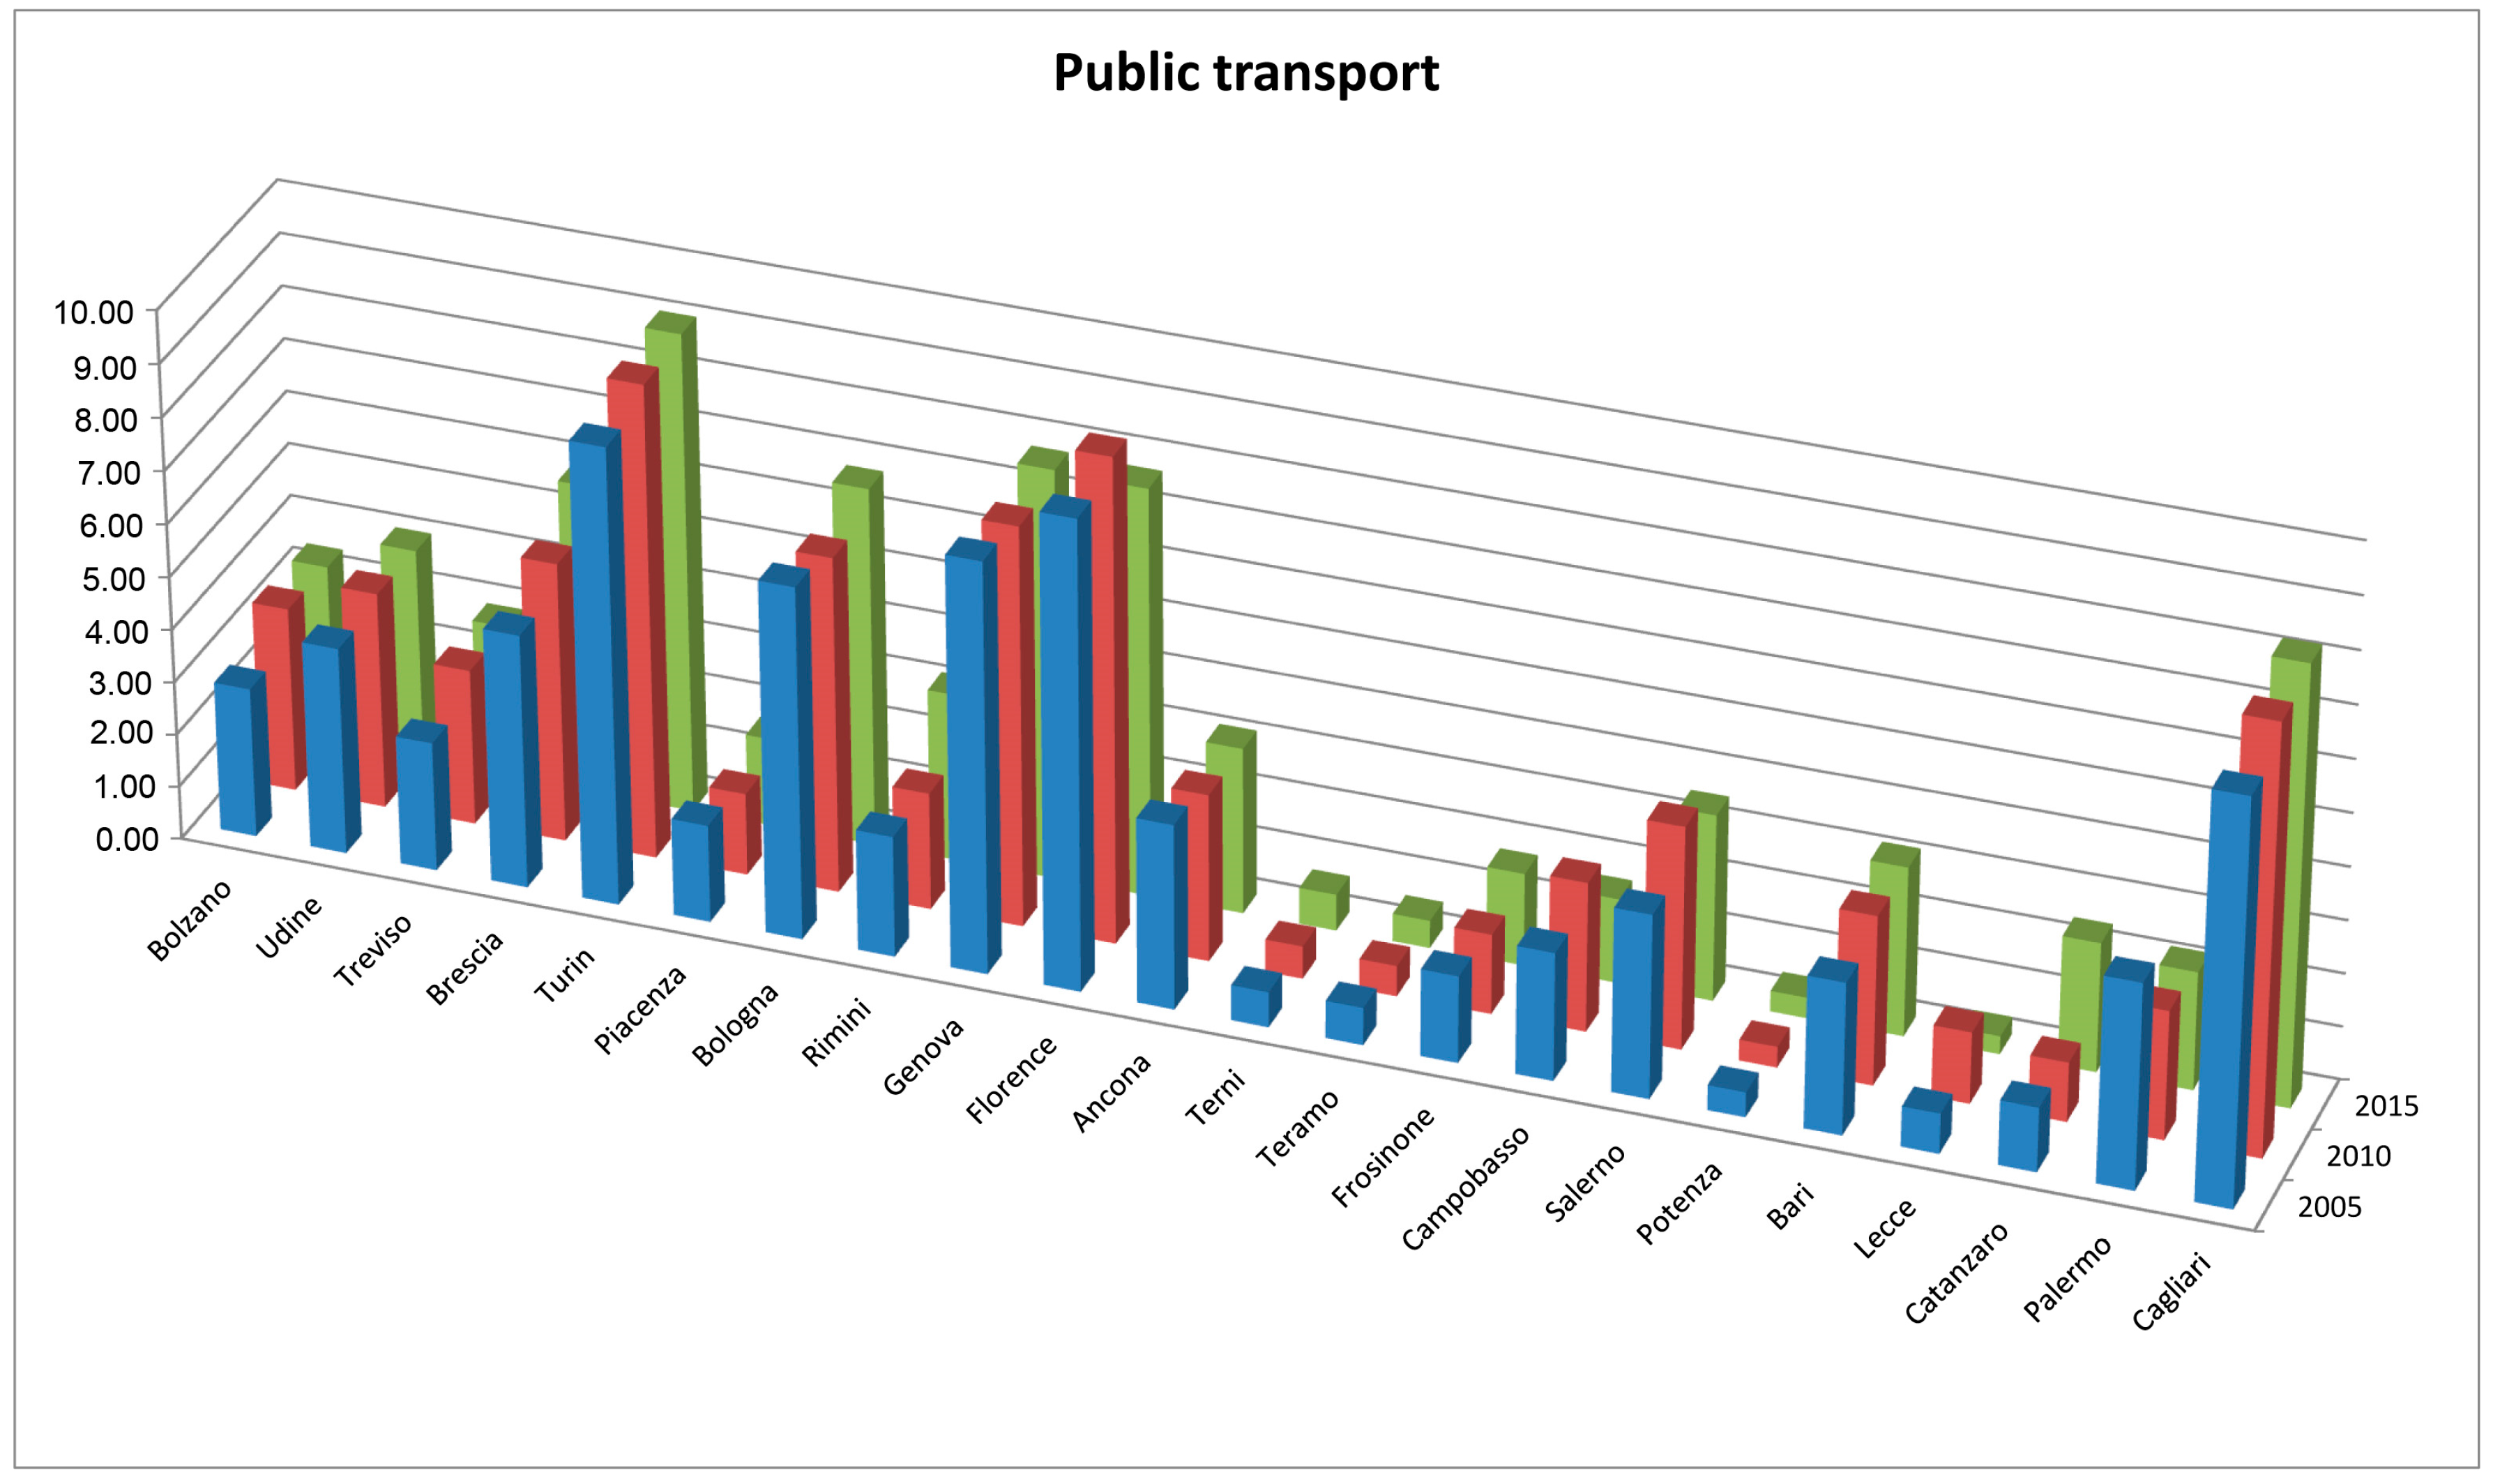
By applying the methodology described above for the years 2005, 2010, and 2015, the authors obtained the results presented in Figure 2, Figure 3, Figure 4 and Figure 5, which illustrate the situation for each variable. The first variable analysed is the Local Public Transport, which is present in each of the cities studied, and has had very positive values since 2005. From analysing the Local Public Transport variable, it is apparent that in early 2005, northern Italy (and especially Turin, Bologna, and Genoa), had better public transportation services than central-southern Italy, which had much lower values. In central Italy, Florence had the best public transport, provided a very useful service, and continues to grow in terms of traffic information systems.
Cagliari is the only city in the South to stand out, because the administration and the transport company operating the service have paid a great deal of attention to this service. Overall, this variable is the one that experienced less significant changes (Figure 2, and Table 2). While the demand for public transport has remained almost constant over the years, the use of technological tools for mobile information—such as electric poles at bus stops, applications for smartphones from which users can buy tickets, check the bus transit times and receive communications on route changes—is improving in all cities.
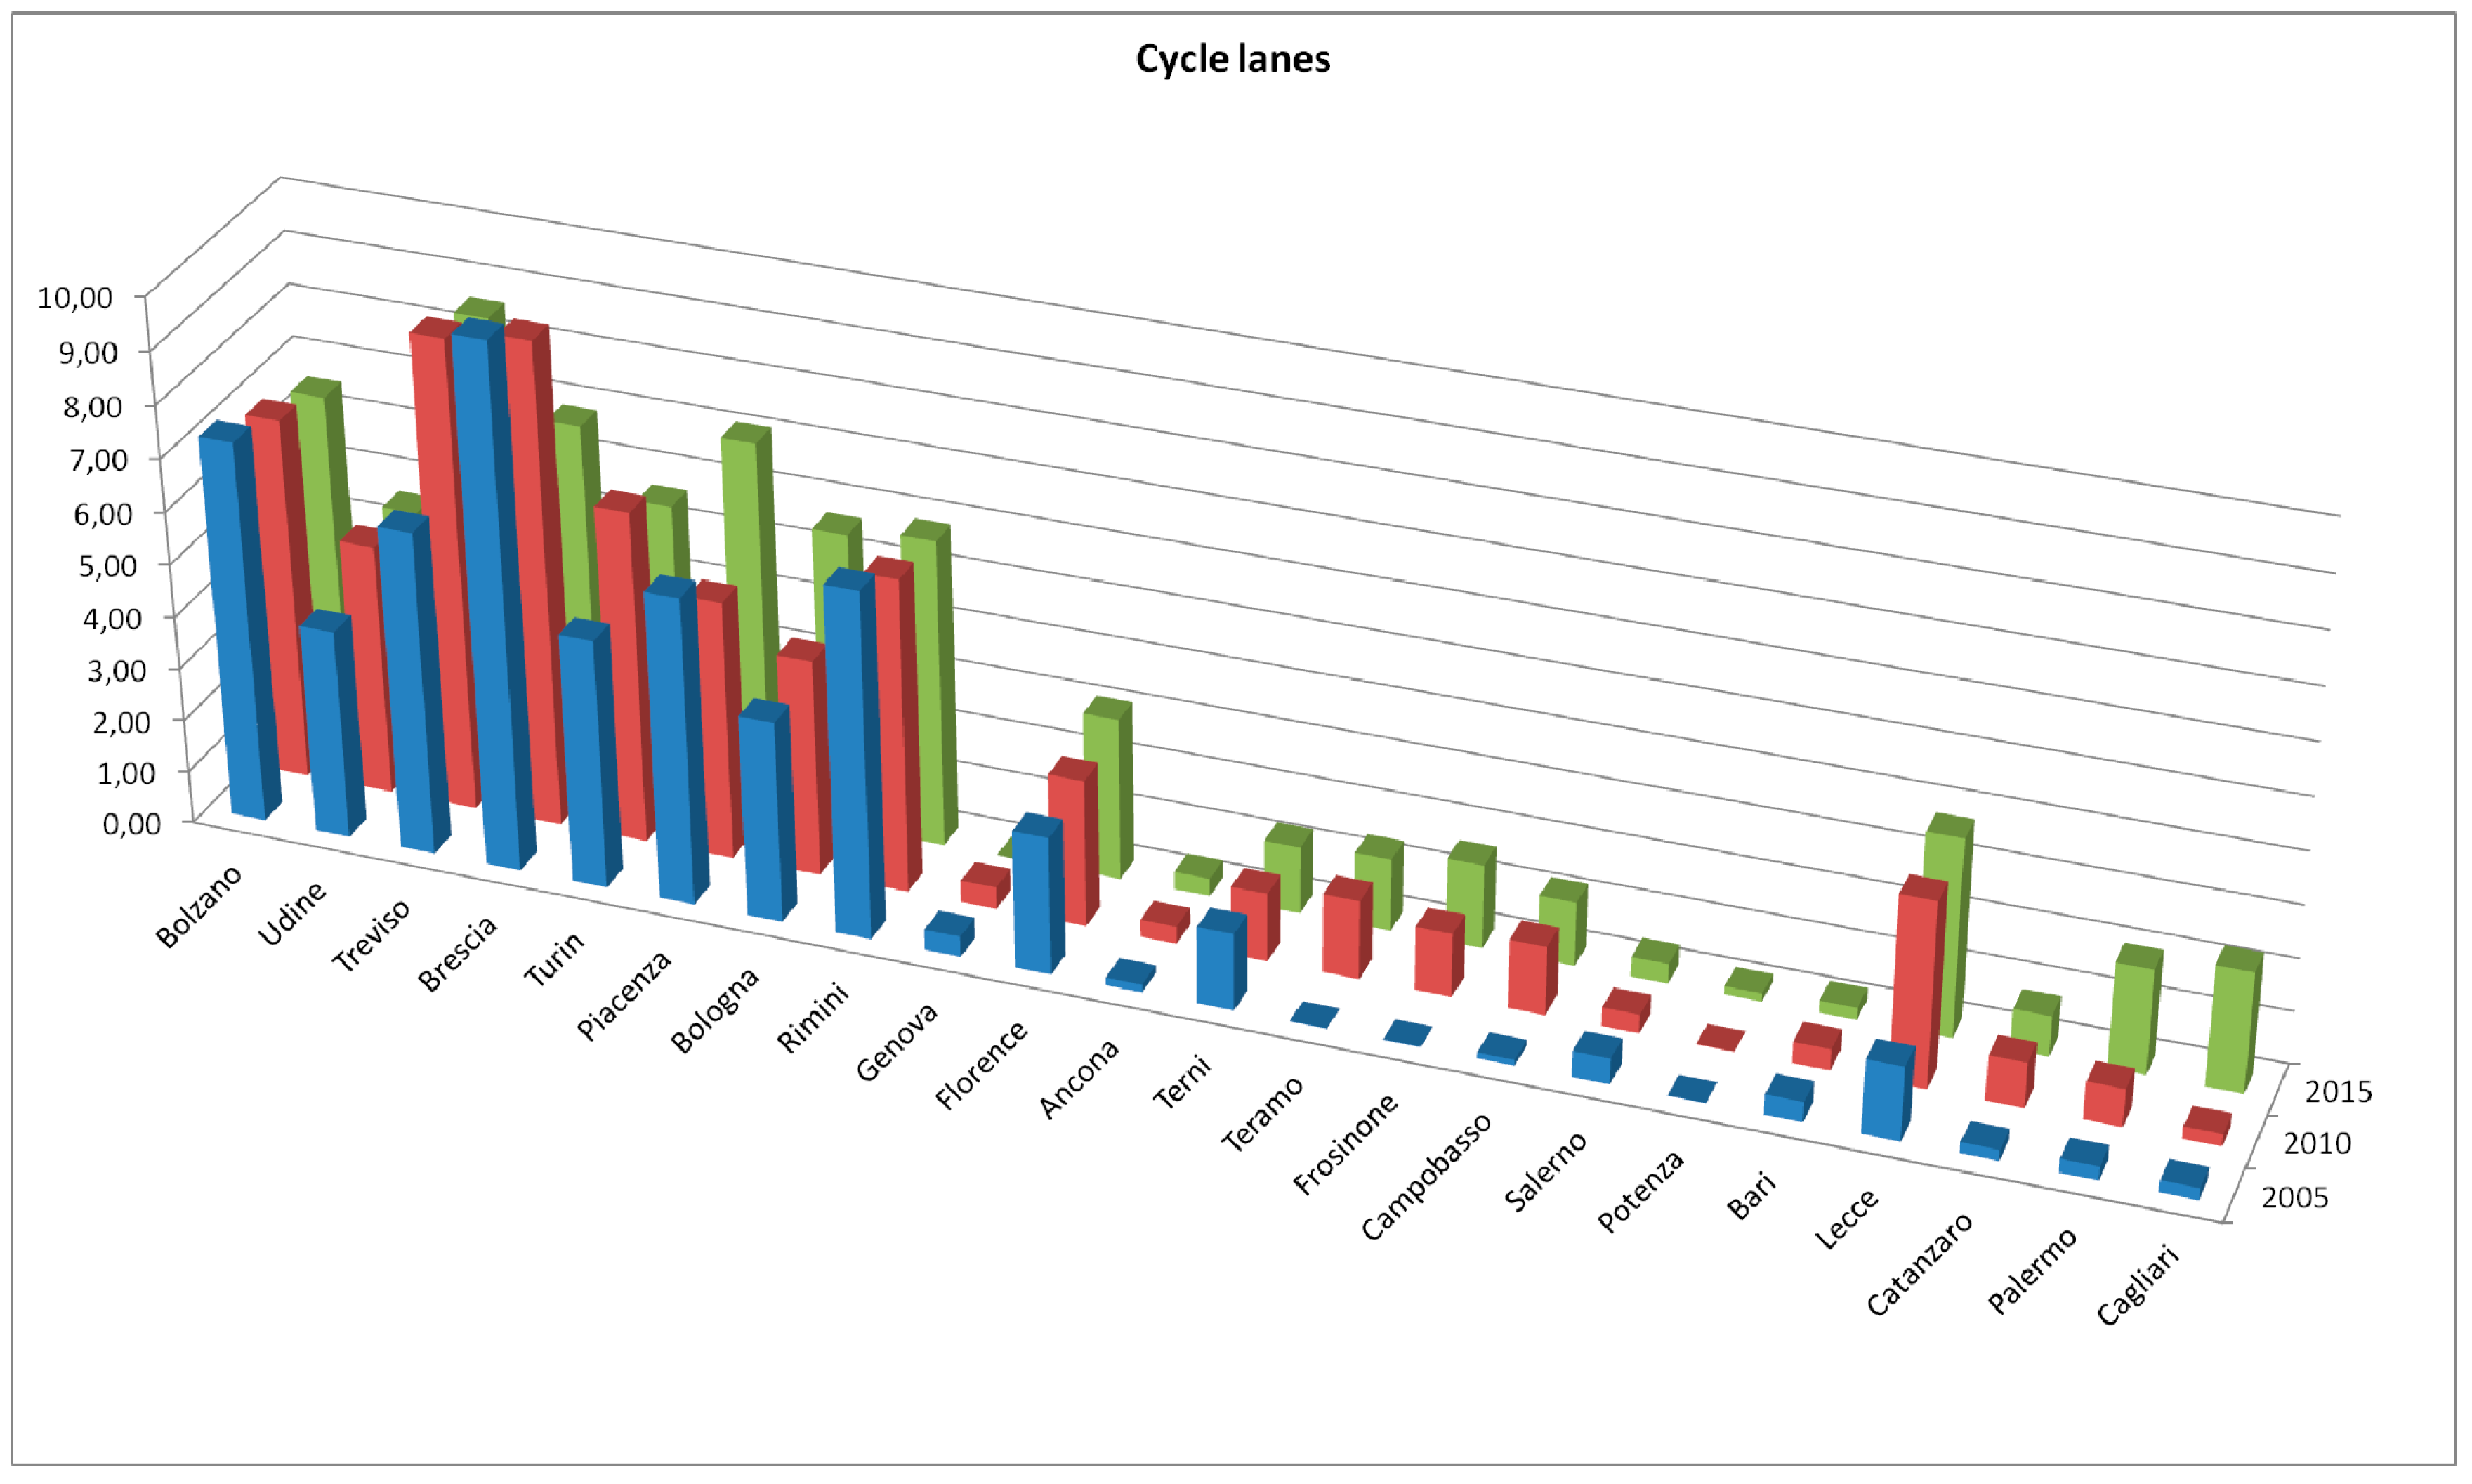
With reference to the Cycle Lanes variable (Figure 3, and Table 3), a clear gap between northern and central-southern Italy is evident as early as 2005. Not considering some of the northern Italian cities that are slightly worse—Udine, Brescia, and Bolzano—the northern cities are characterized by a greater development of bike paths. With regard to central Italy, however, there was a slight increase in the extent of bike paths from 2005 to 2010, while other cities—such as Ancona, Teramo, and Terni—have reduced their kilometres of cycle paths. Bike paths in the south, represented by Cagliari and Palermo, have been extended, and compared to 2005, there has been a great increase in the infrastructure for bicycle paths, thanks largely to the many incentive policies for bike mobility.
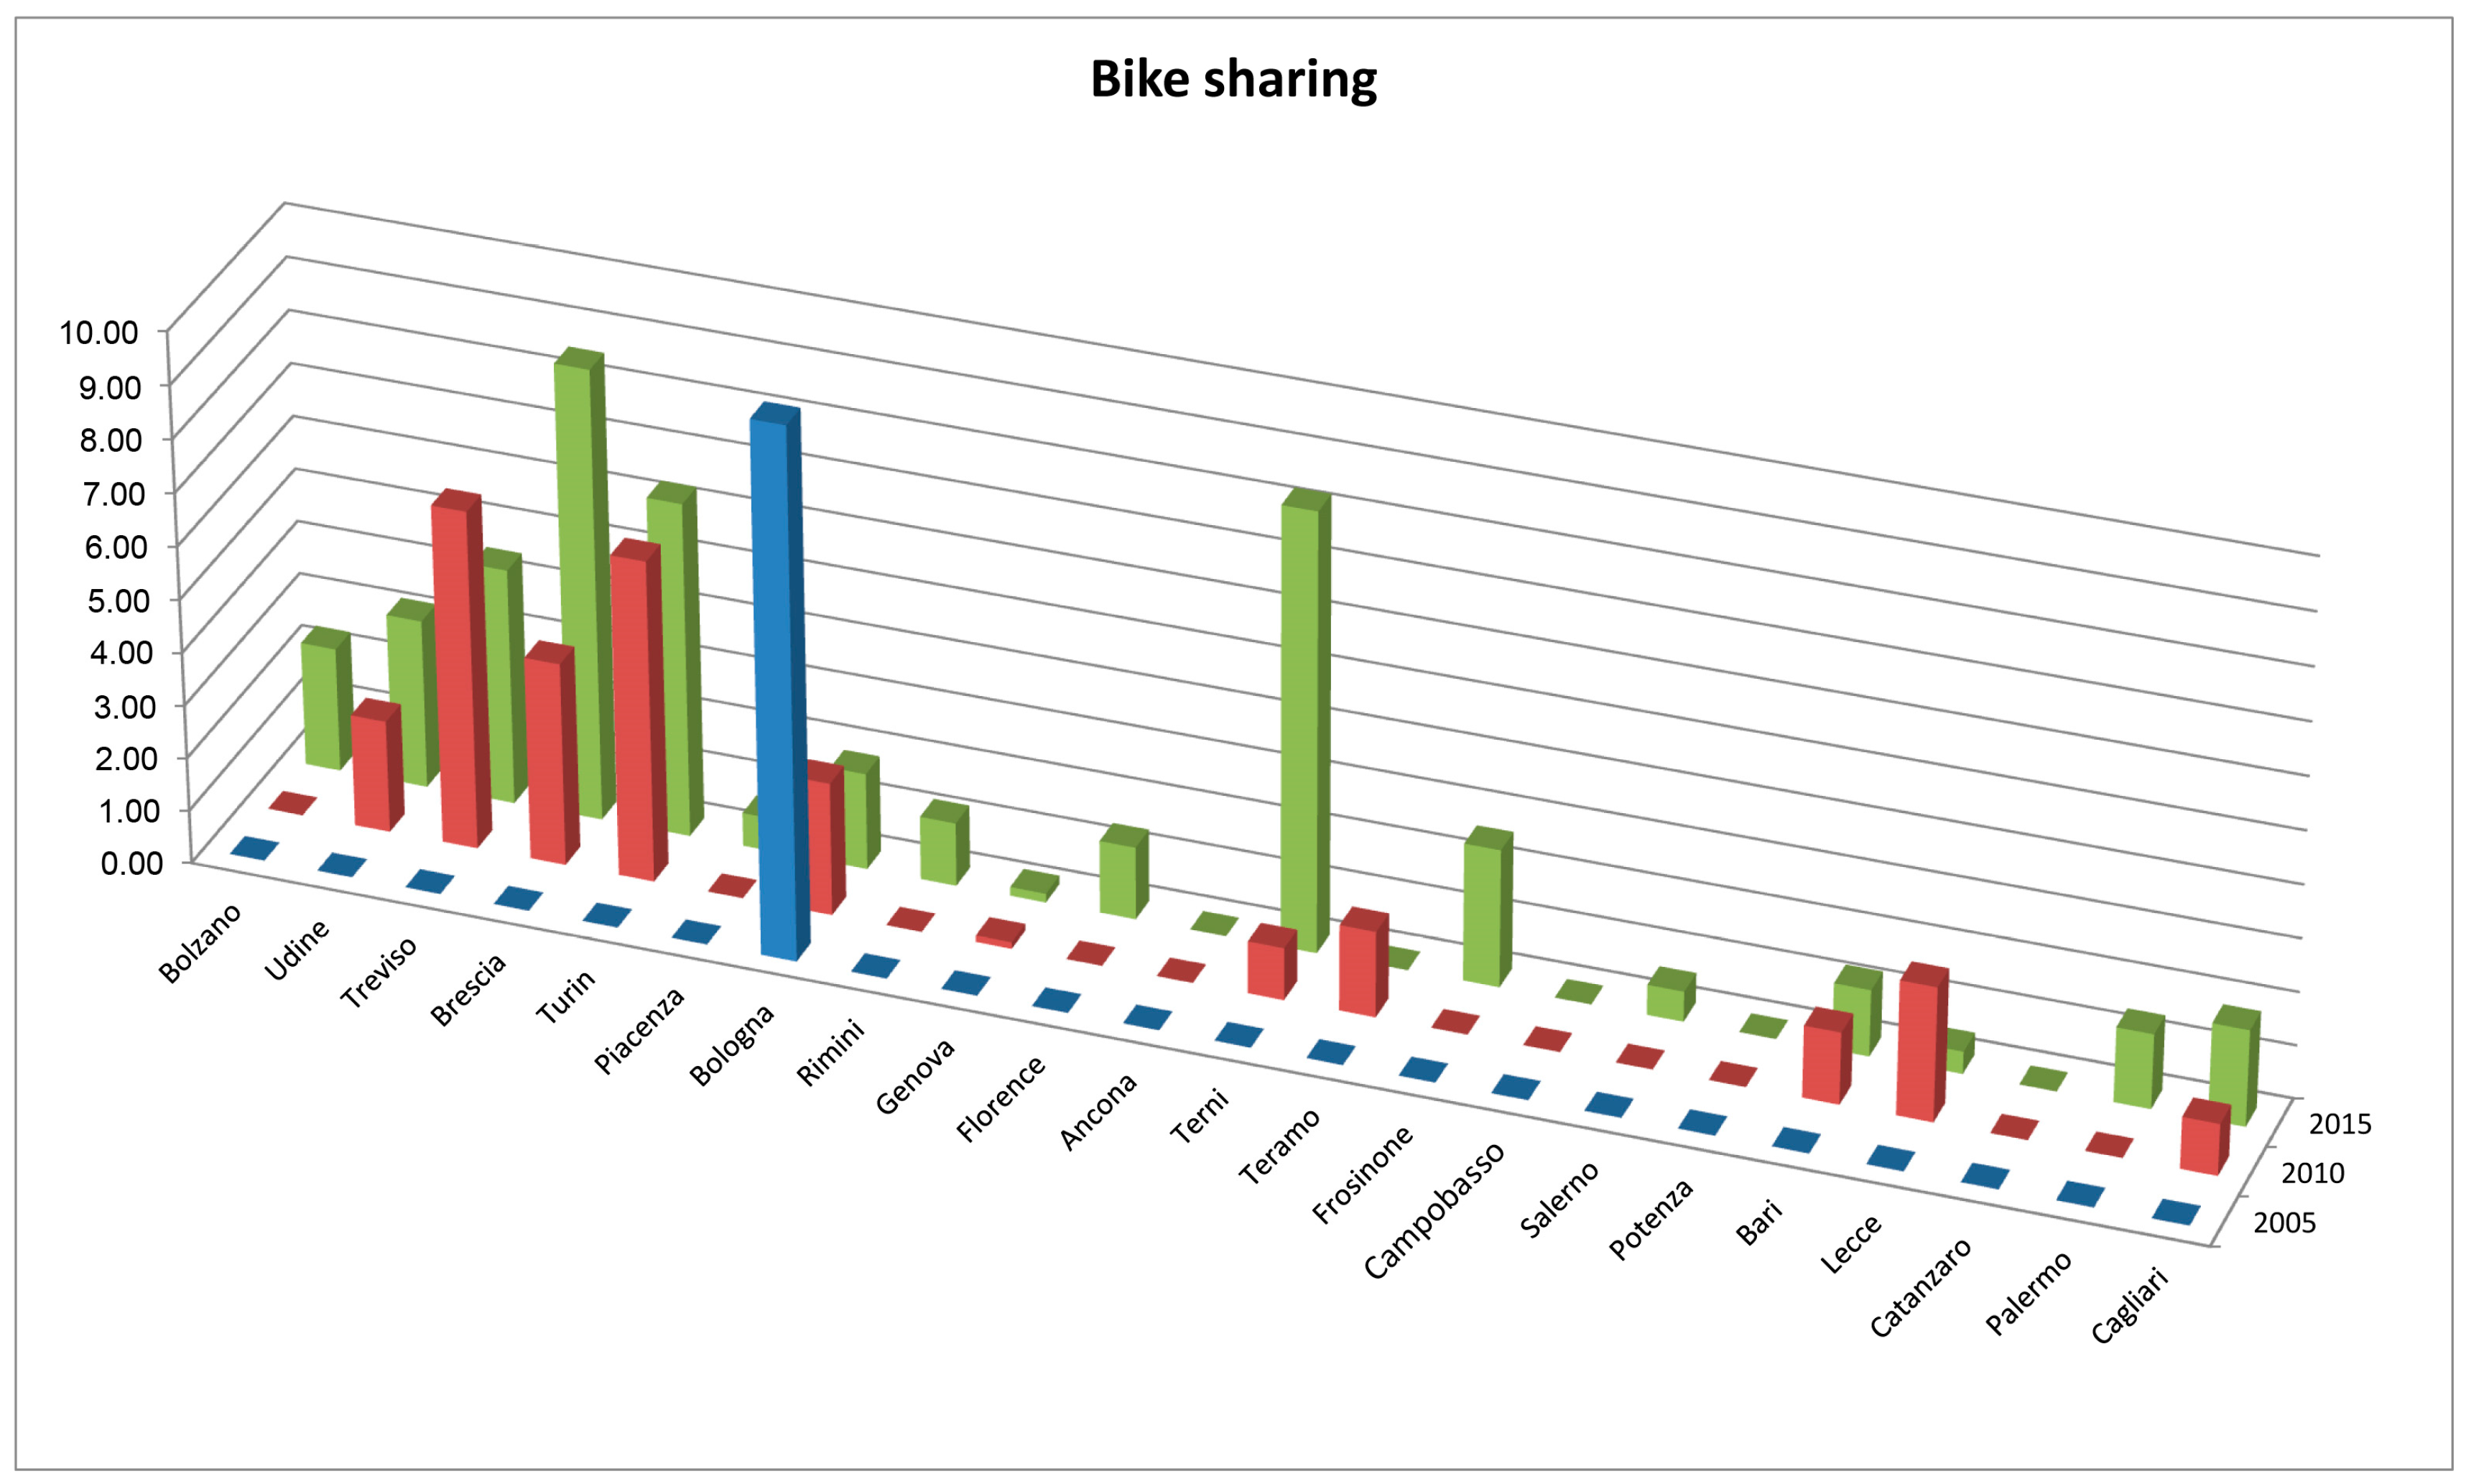
Bike Sharing is one of many shared mobility services that has been taking hold in different Italian cities in recent years. Regarding this variable, in 2005 this service was available only in the city of Bologna (Figure 4 and Table 4). By 2010, the service had spread to almost all northern Italian cities in the study’s sample (Udine, Treviso, Brescia, and Turin), in two cities of central Italy (Terni and Teramo), and in three southern cities (Bari, Lecce, and Cagliari). The strongest growth occurred in 2015, with an overall increase in the budget for this service. In the cities where Bike Sharing is available, the number of bicycles and stations now available has been increased. Several cities do not yet offer this service, but plans to develop it have been drafted by municipal administrations (Ancona, Campobasso, Potenza, and Catanzaro). Their objective is to provide this service soon, thanks to funding that will be provided by the National Law 28 December 2015, No. 221 mentioned in paragraph 1.
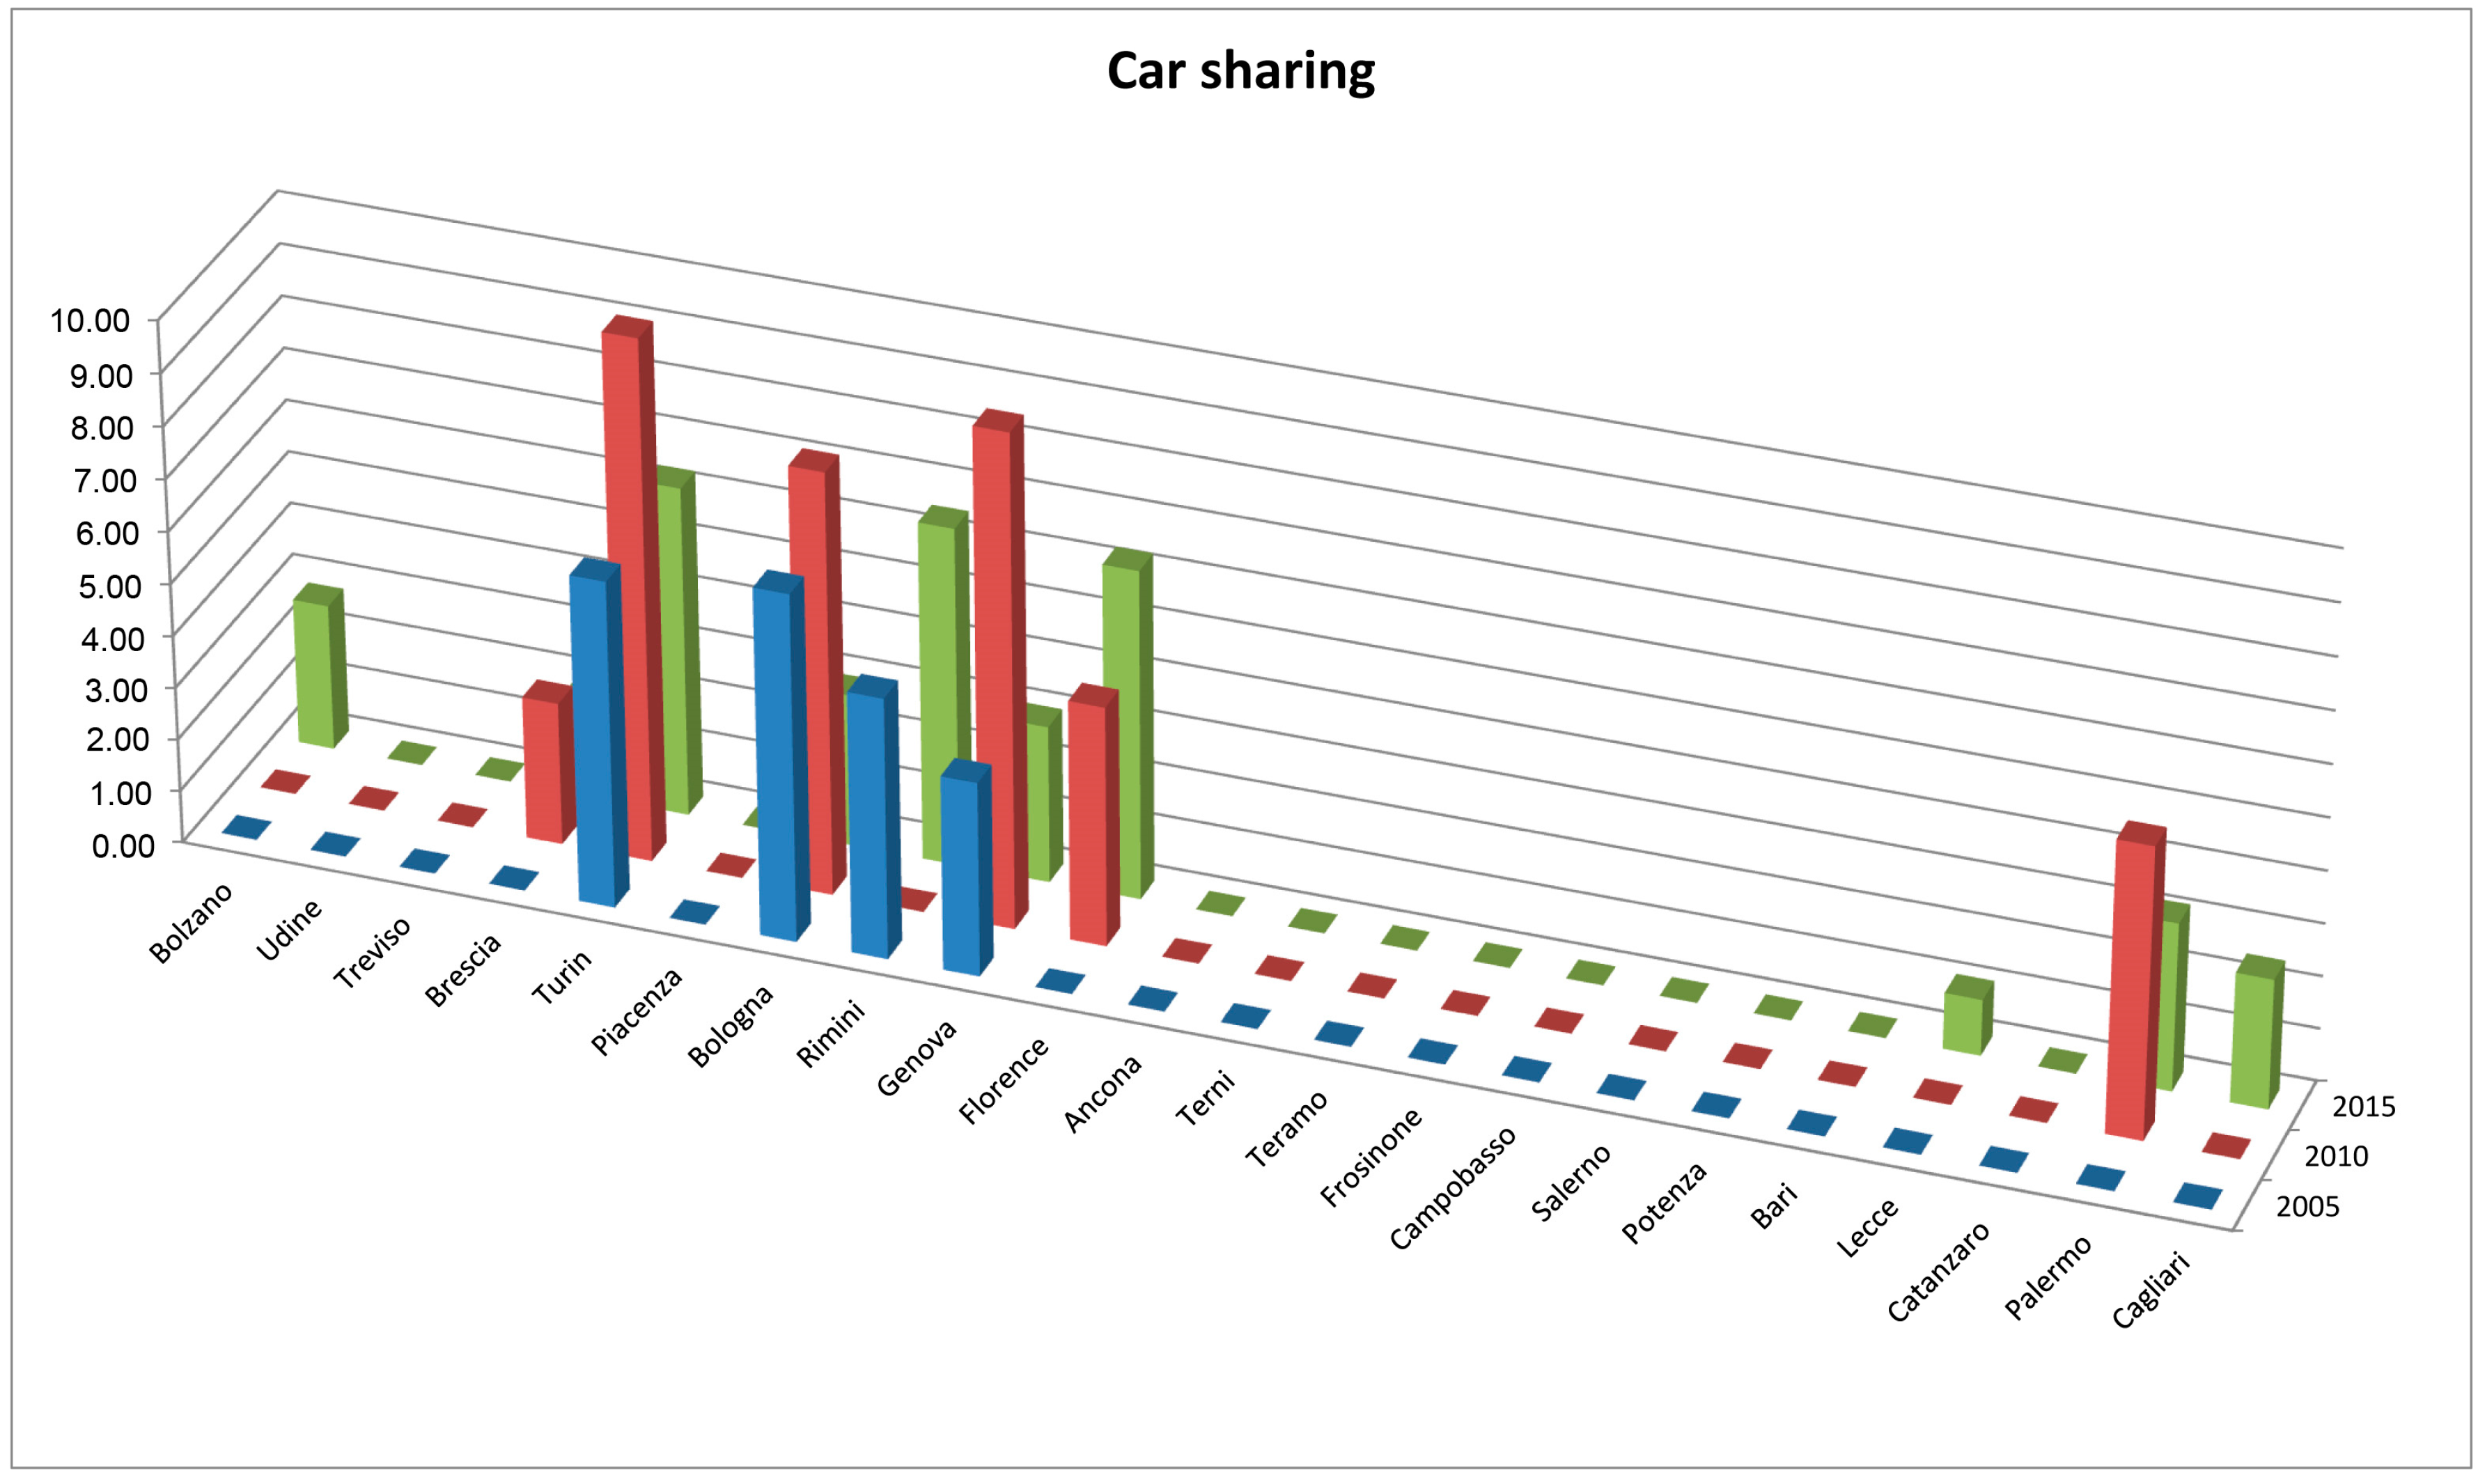
The last variable analysed is Car Sharing, a service that in recent years has been made available in many cities, due to funding that has been provided to encourage sustainable mobility (Figure 5 and Table 5). As of 2005, this service was available in only four cities (Turin, Bologna, Rimini, and Genoa). By 2010, the availability of this service had increased in these cities, with the exception of Rimini, and the service had been initiated in Brescia and Palermo, the first city in southern Italy with this service. By 2015, the service was being offered in three other cities—two in the south and one in northern Italy (Lecce, Cagliari, and Bolzano). Car Sharing is developing rapidly, because planners intend to offer fleets of electric cars, which are less polluting. The spread of Car Sharing, however, cannot ignore the presence of a good collective public transportation service, as the latter is regarded as a complementary, and not an alternative, service.
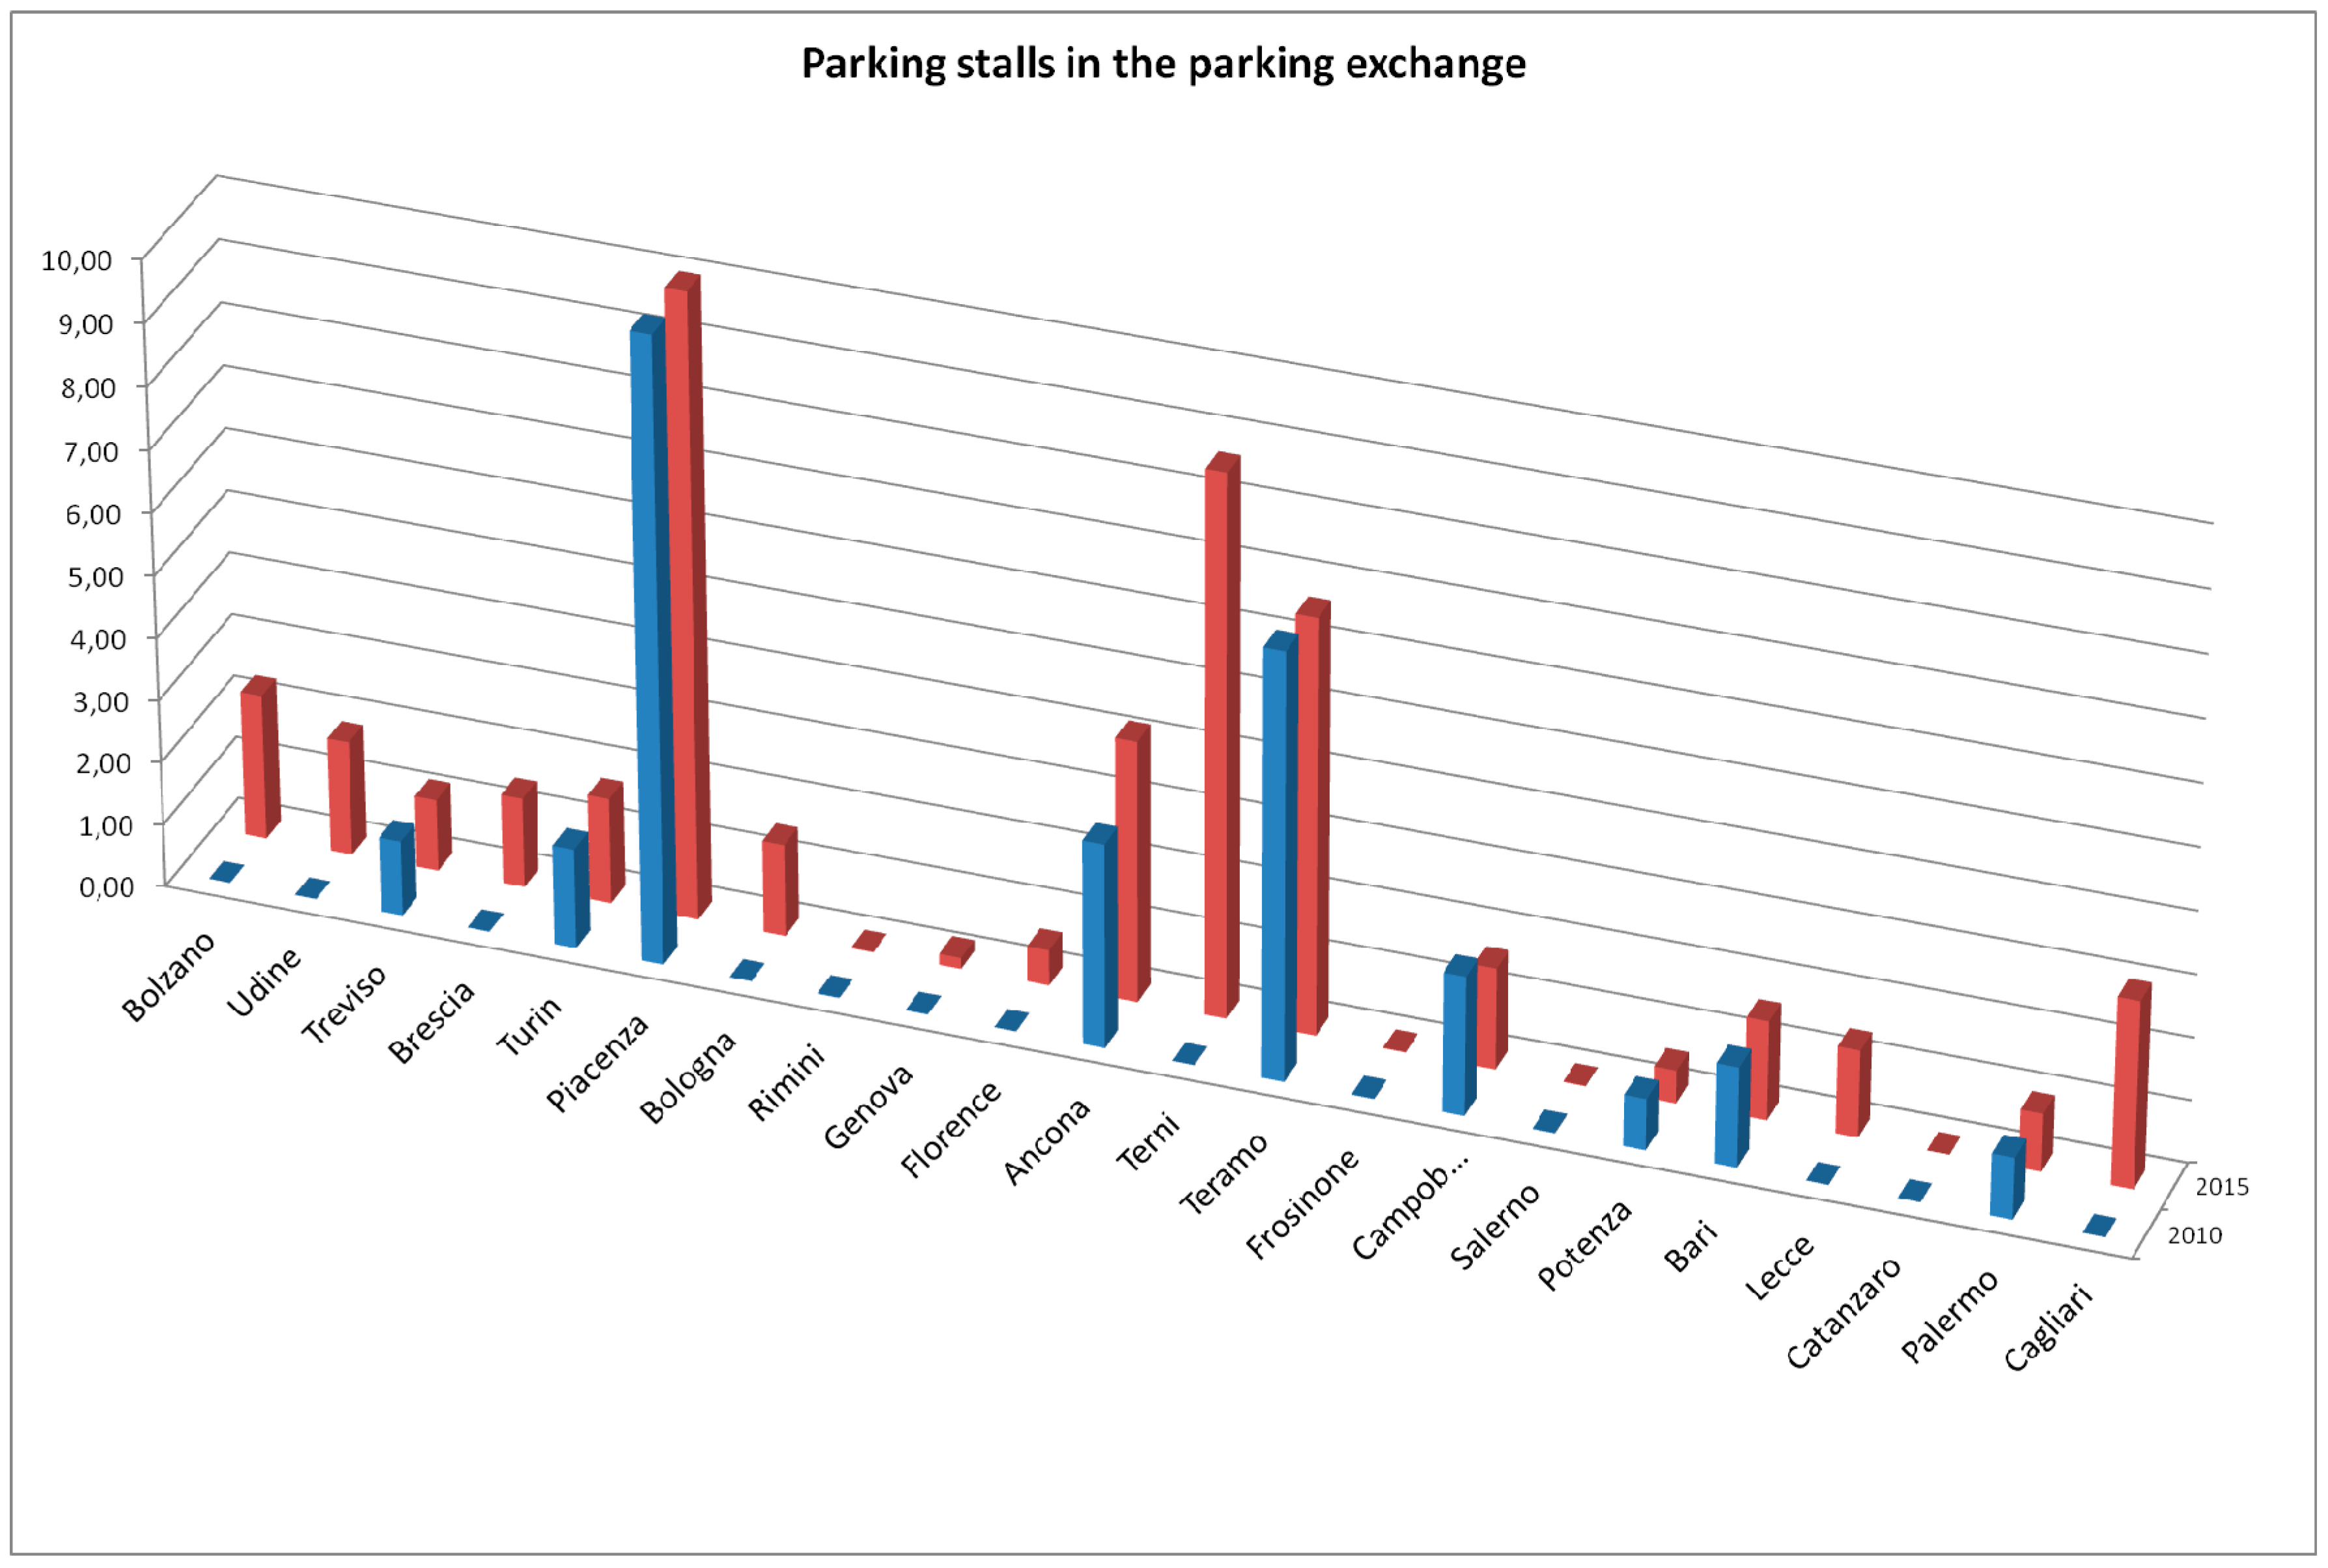
The other aspect to be analysed concerns the estimated number of parking stalls in the cities’ interchange parking (Figure 6 and Table 6). This service is available in most cities, except for Rimini, Frosinone, and Salerno. Table 6 summarises all the values for the years 2010 and 2015. It was not possible to collect data for previous years (2005), since they are not available in the data collection systems analysed (ISTAT). As for 2010, the service was also available in the cities of Bolzano, Udine, Bologna, Florence, Terni, Lecce, Catanzaro, and Cagliari, but data are not available. In any case, this service is growing, and especially in recent years, as part of an intermobility system intended to encourage people to leave their private vehicles in the parking lots, which are usually situated near stations (trains, buses, and car or bike sharing), which benefits other smart transportation modes.
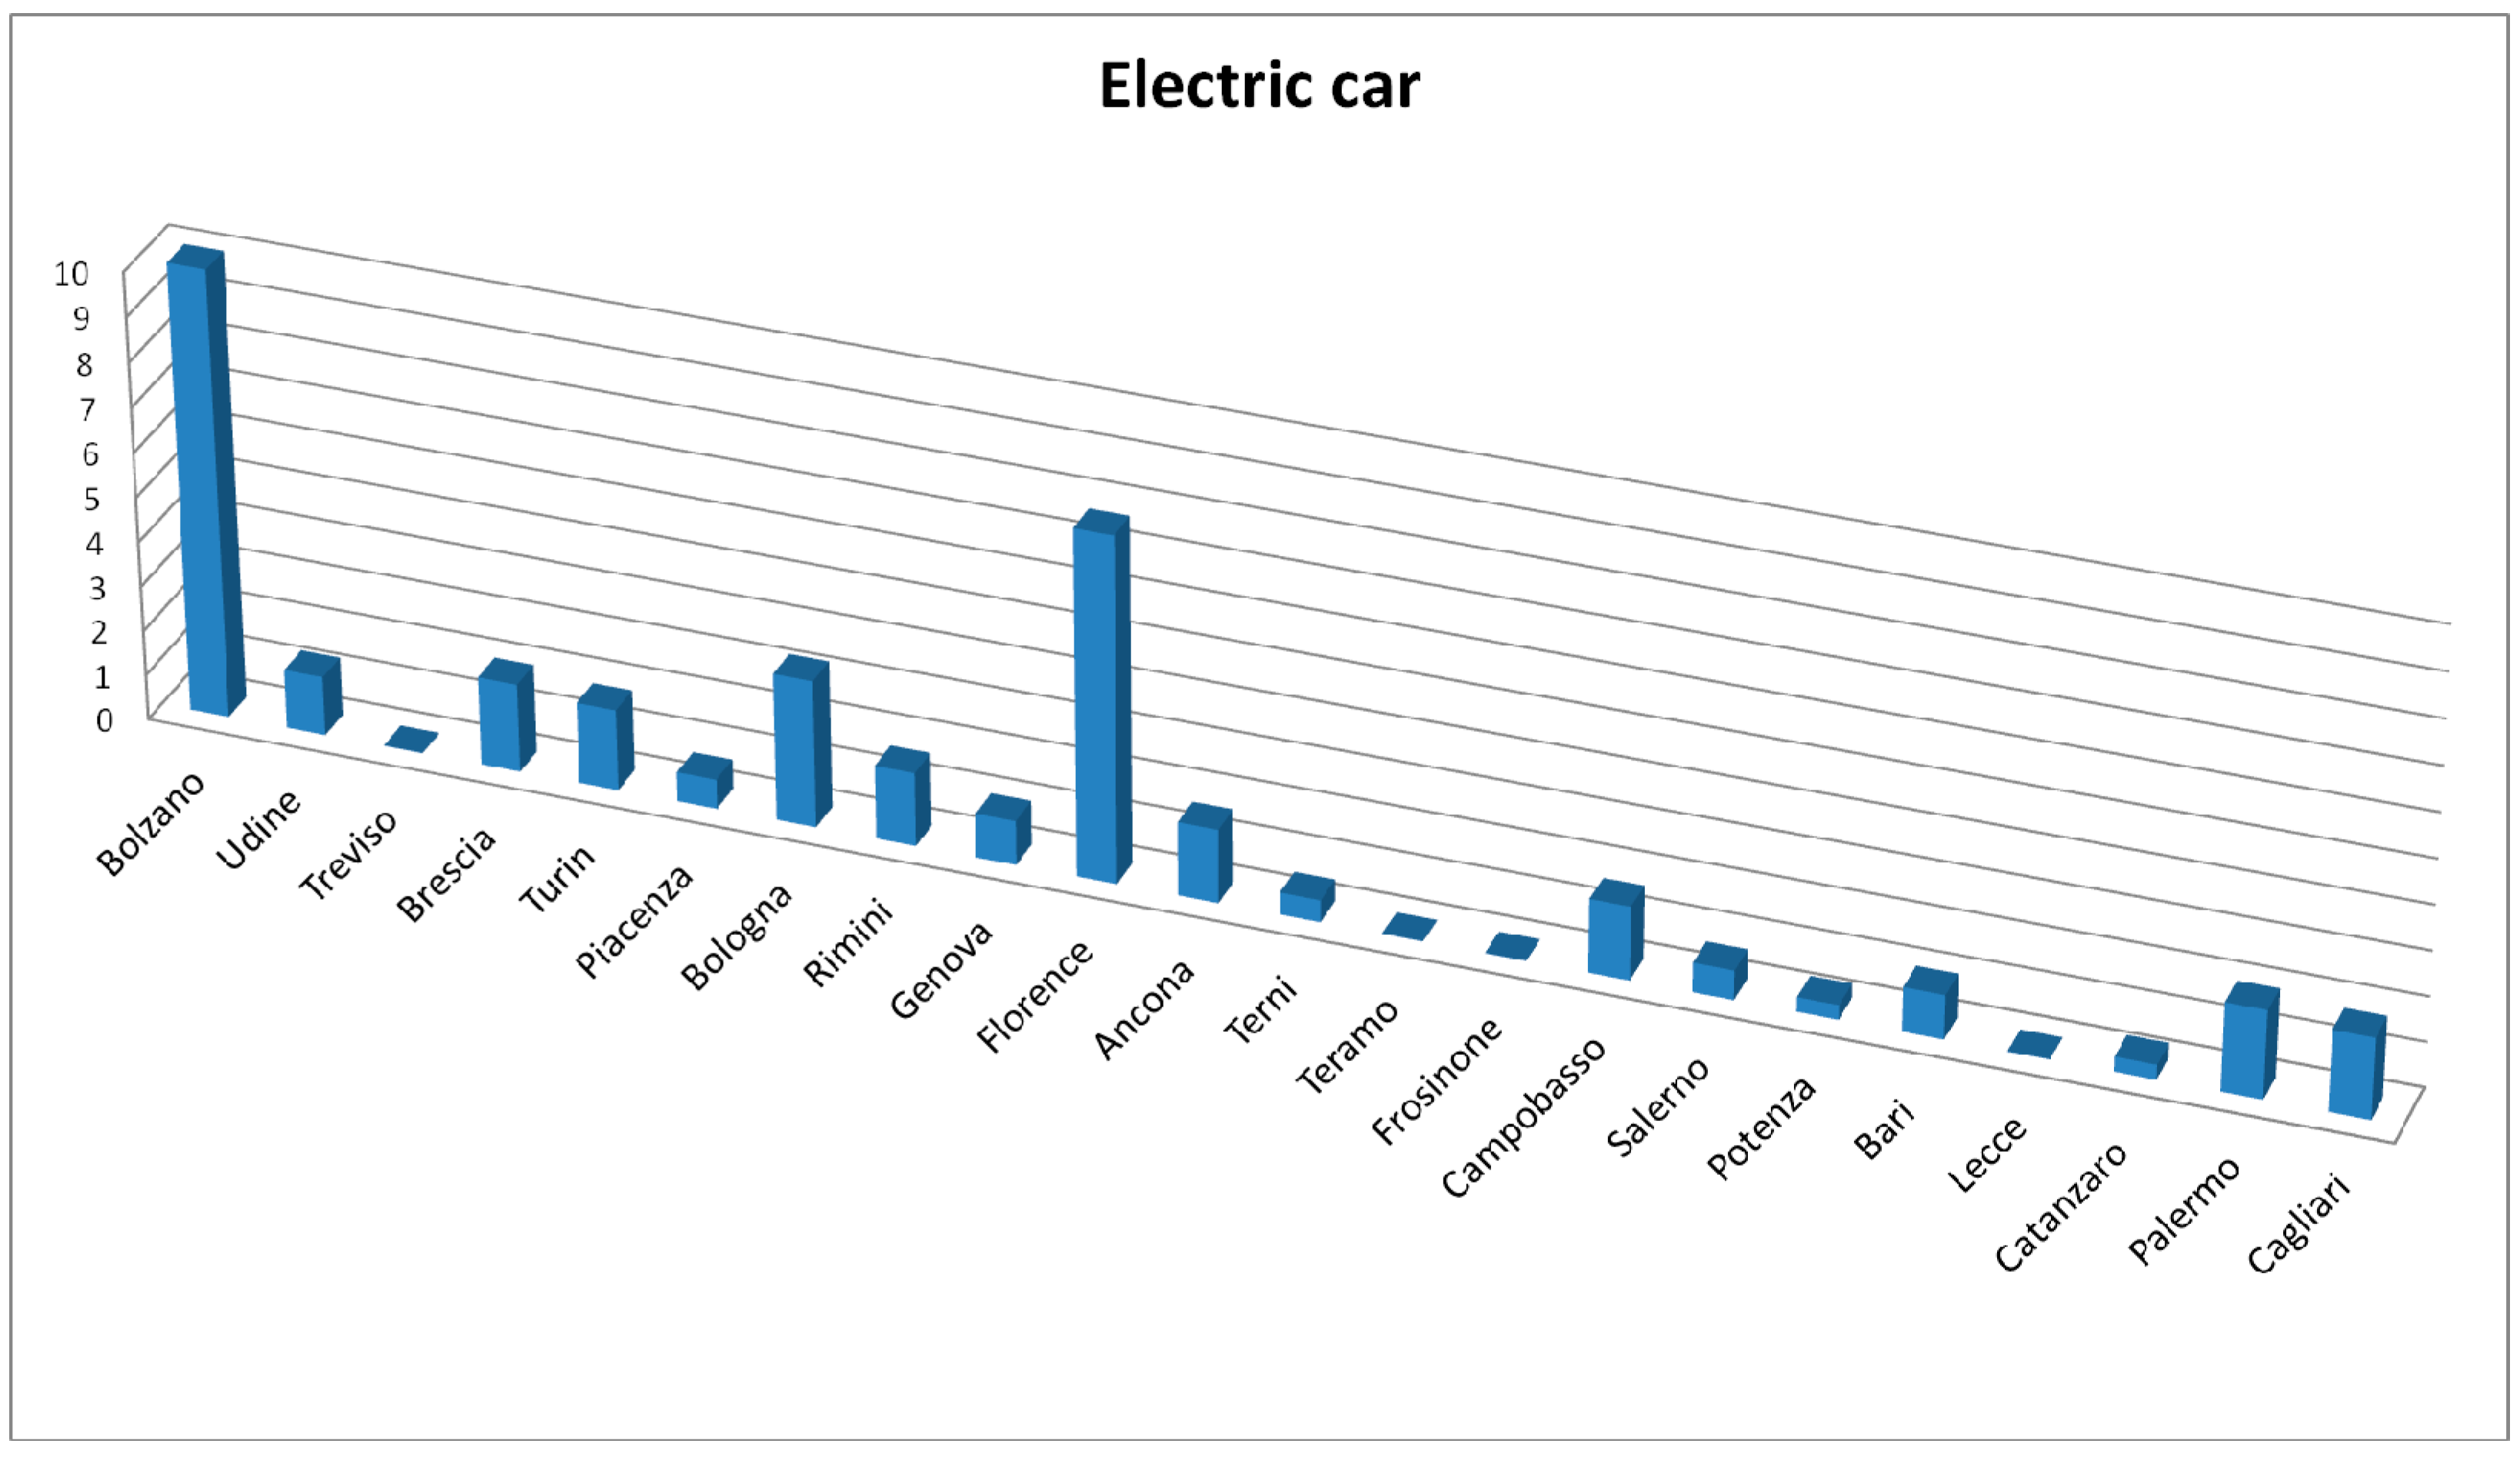
Another consideration relates to electric mobility (Figure 7 and Table 7). This aspect is still underdeveloped in Italy, as electric vehicles make up only 0.01% of the fleets in the 22 cities under study [44]. Cities with a higher percentage are Bolzano and Florence, while Treviso, Teramo, and Frosinone do not have any electric vehicles. A possible reason for this trend may be related to the cost of an electric vehicle, which, despite its various stated benefits, is still high for an average user. The authors believe that this measure should be considered for future developments, because over the next few years there could be a major development in this mode of transport. For example, today most of the companies that manage the car sharing services are investing many resources to change the fleet from combustion vehicles to electric ones.
5.2. Analysis of Smart Mobility Index
The analysis of each variable has allowed the development of a synthetic index (Smart Mobility Index), obtained by using the geometric means of the four variables, which measures the smart mobility of the cities studied. Figure 8 depicts synthetic indicator data for each city, ordered geographically (north, central, and south), for the years 2005, 2010, 2015. We note a larger endowment and—considering the years 2005, 2010, and 2015—significant growth, especially in northern Italy.
Central Italy has had fewer changes, and only Florence, Terni, and Frosinone have undergone significant improvements. Regarding the southern cities of Lecce and above, Cagliari and Palermo are notable for improvements, especially in 2015. The results illustrate that southern Italy pays for a significant delay in the organization of transportation, and that the concrete actions related to soft mobility have occurred recently, or are still operating on a preliminary basis, unlike most of Italy’s northern cities, where a number of years have been spent planning for soft mobility, and some initiatives have already been implemented.
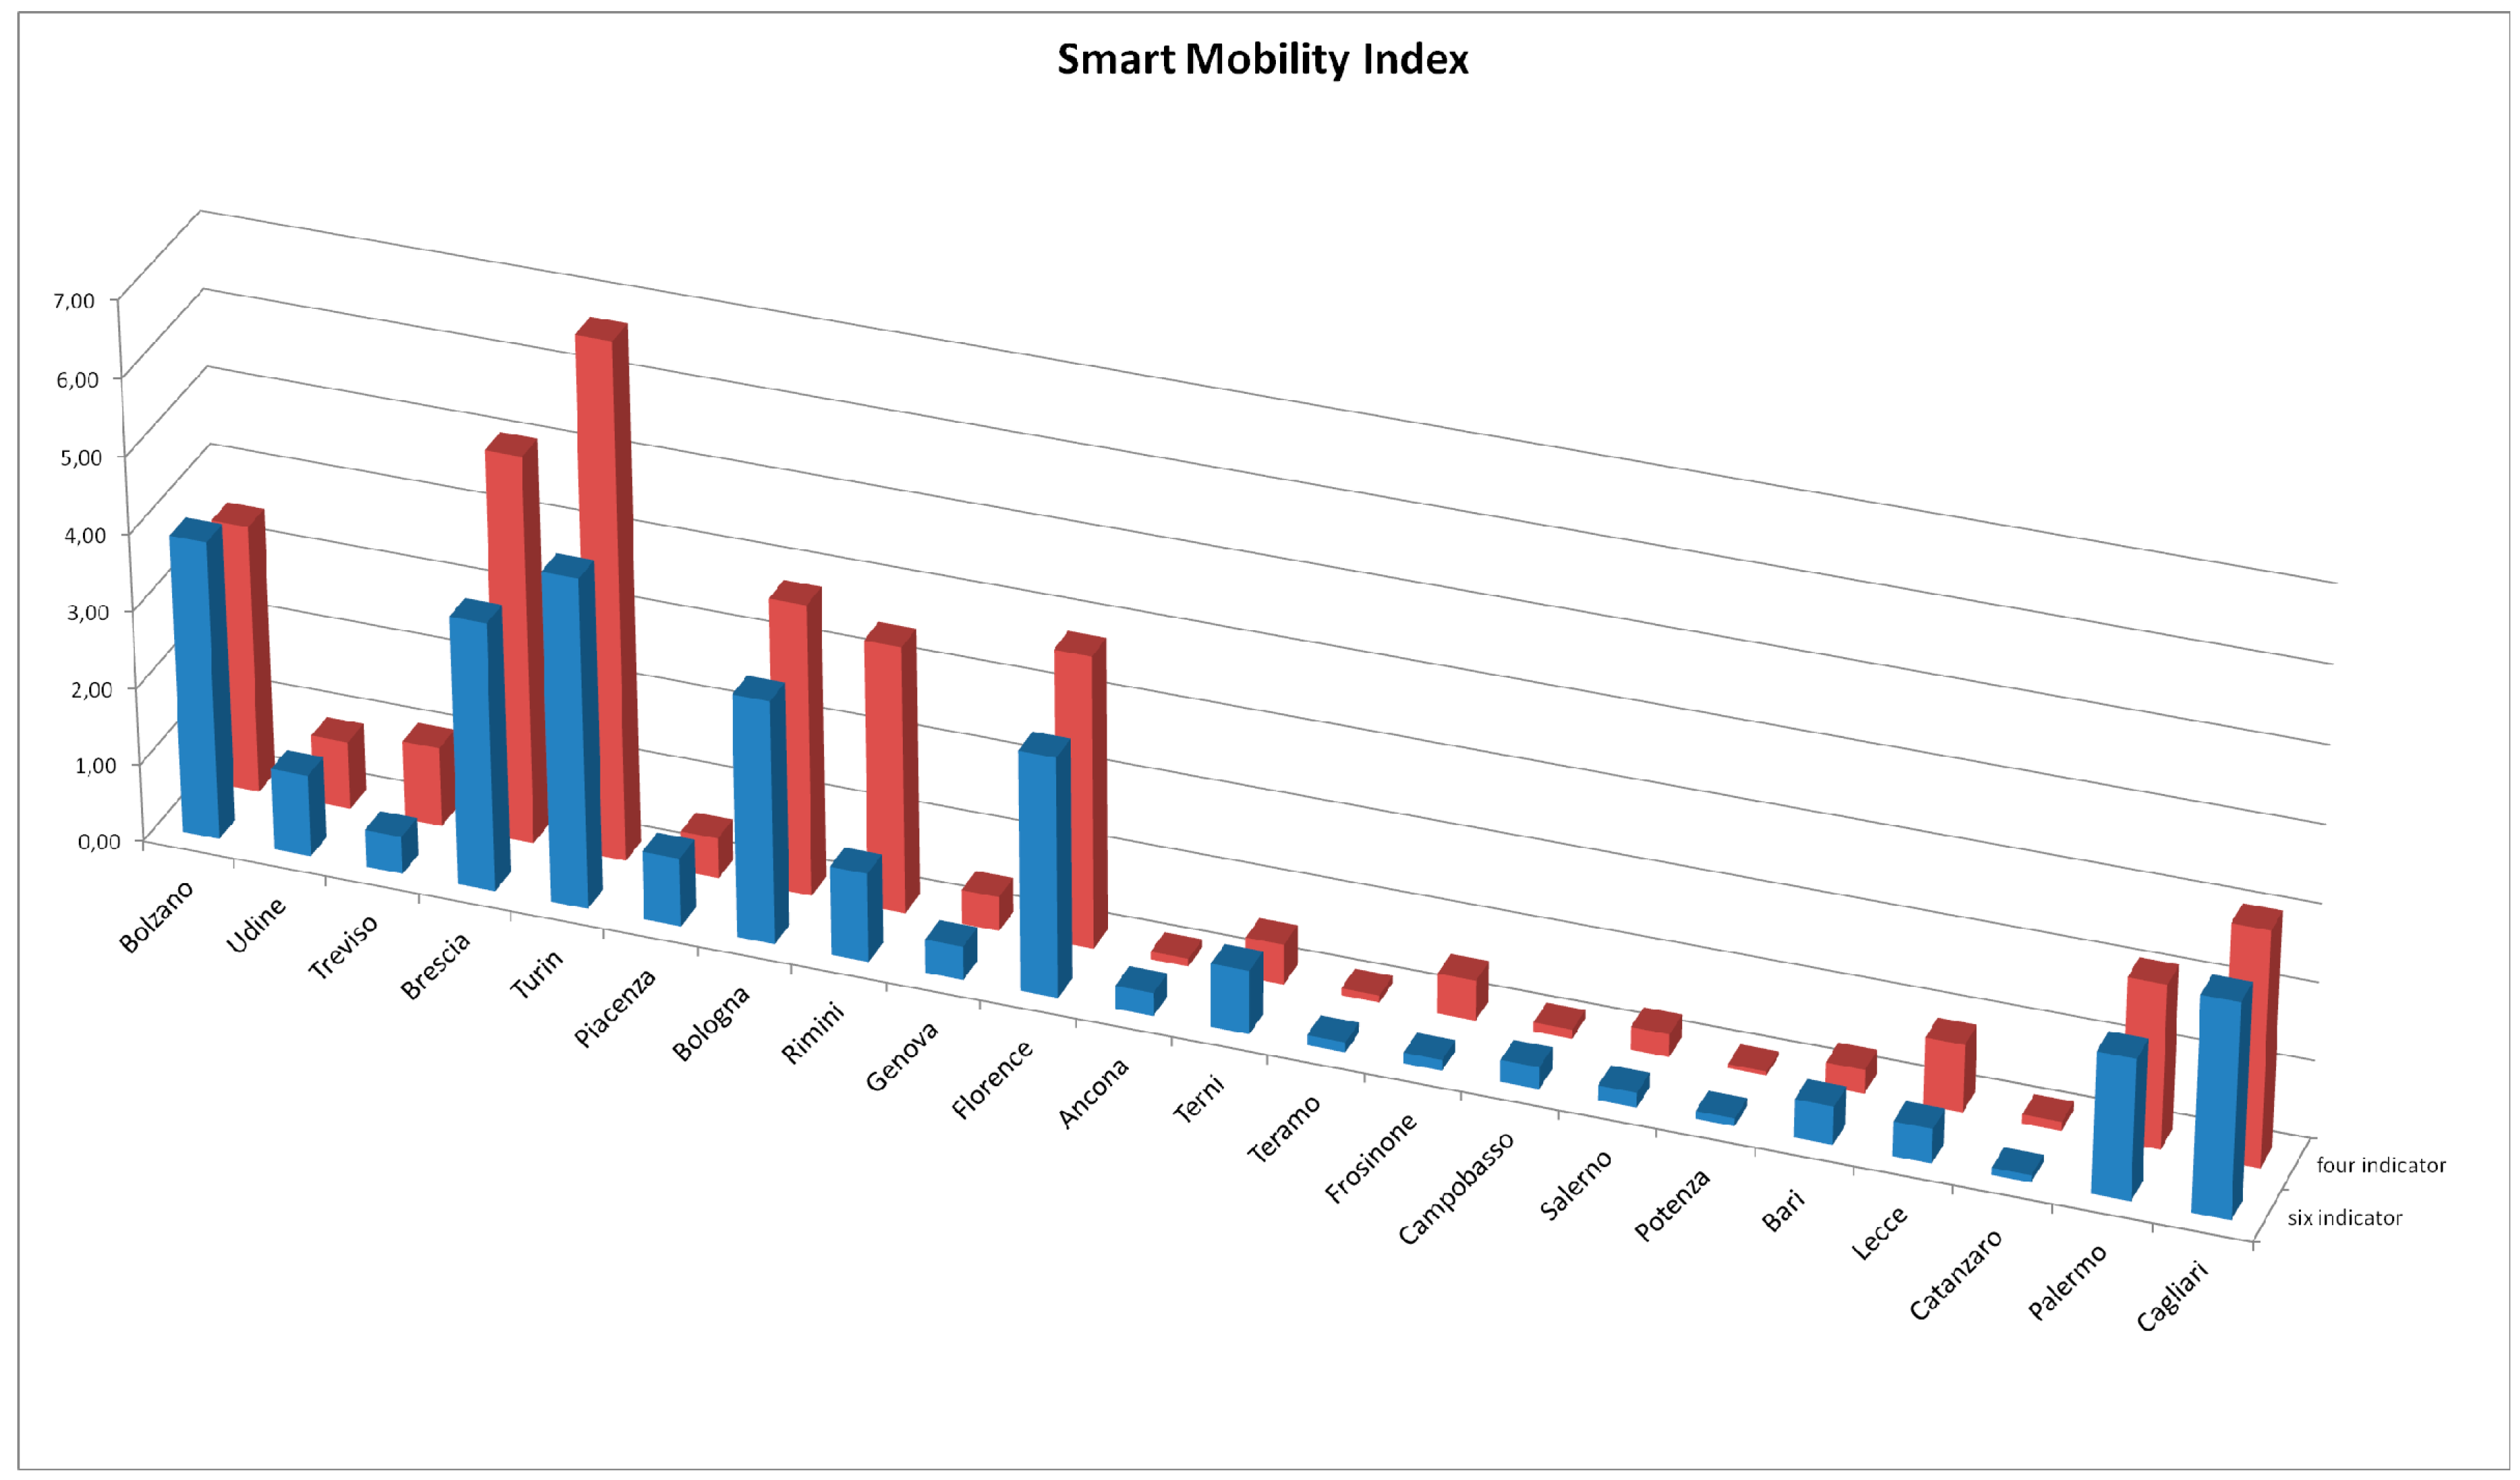
Subsequently, only 2015 data from the Smart Mobility Index were compared: the Smart Mobility Index with four variables (Public Transport, Cycle Lanes, Bike Sharing, and Car Sharing), and the Smart Mobility Index with six variables (Public Transport, Cycle Lanes, Bike Sharing, and Car Sharing and Stalls for Interchange Parking and Electric Cars).
Figure 9 shows that these last two indicators increased the level of smart mobility in the cities of Bolzano, Udine, Piacenza, Ancona, Terni, Teramo, Campobasso, Potenza, and Bari. While Genoa, Florence, Frosinone, Salerno, Lecce, and Catanzaro have slightly lower values, a clear break occurs in Treviso, Brescia, Turin, and Rimini, where the level of smart mobility is considerably lower. Probably these lower values depend on the fact that the indicators are related to population, and therefore the cities with more inhabitants must maintain a high service level in order not to receive a lower score relative to a city with a smaller population.
Future research will be undertaken to develop a more complete Smart Mobility Index, by updating the indicators on the basis of the services that are being developed in urban areas, such as all mobile information systems (public transport, private, and intermodal), mobility management systems, and electronic payment services.
5.3. Correlation between Finance and Growth
The Agenda Urbana platform [47] allowed the authors to analyse how many projects have been activated, and how much funding has been received for smart mobility. The selected Italian northern cities have achieved total financing amounting to €82,315,557.27, the selected central Italian cities €43,543,307.02, and the selected southern ones’ total financing is €250,764,386.
In detail, for the city of Udine, €373,382 was allocated for the realization of a project; Treviso launched eight projects (including four zero-cost projects) with a total budget of €4,295,032; Brescia allocated €164,621 for two projects (one with no available budget); Turin allocated €76,016,336 to launch eight projects (one at no cost); and Genoa has activated two projects with a budget of €1,466,186, and seven as zero-cost projects. Piacenza and Bologna have each activated only one project, both at zero cost. Florence has received funding of €36,172,674 for twelve projects, including two at zero cost; Terni has launched three projects with a budget of €7,370,632. Regarding southern Italy, the city of Salerno activated a zero cost project, Bari received a budget of €188,098,650 for ten projects, while Lecce facilitated nine projects (including four at zero cost), with a budget of €3,090,000, and Cagliari activated eight projects with total funding of €59,575,736. With regard to Bolzano, Rimini, Teramo, Frosinone, Campobasso, Potenza, and Catanzaro, the platform does not mention projects related to smart mobility.
An analysis of the projects and the smart mobility indicator reveals that Florence, Bari, Lecce, and Cagliari are the cities that have had significant improvements in sustainable mobility. This is probably due to the strong interest of the administrators that have activated significant projects in this field. The case of Bolzano is particularly interesting, and it is regarded in Italy as a best practice in mobility. Even though it has on-going projects, it greatly improved mobility from 2010 to 2015, probably because it had made related investments in previous years. Another case concerns Genoa, where, despite having activated nine projects, it experienced a decline in performance that was probably caused by the interruption of some services that will become available again once projects are completed. Udine, Treviso, and Brescia have maintained a performance that is almost unchanged, despite also having received some funding. Bologna and Turin regressed somewhat from 2010 to 2015, but Turin, in particular, is investing resources in projects that will surely lead to a strong improvement. Cities with active projects still need to be constantly monitored, to assess whether the investments made are resulting in actual improvements.
6. Conclusions
The purpose of this study was to analyse the main aspects of smart mobility for twenty-two Italian cities for 2005, 2010, and 2015. In addition, the Agenda Urbana platform provided data that allowed the researchers to identify the type and extent of funding received by the cities, to assess whether major investments, from both EU funds and national funds, led to growth in the field of smart mobility. Although it is known that the improvement or deterioration of a city’s performance is related to other factors, such as social and cultural aspects, this research is devoted to analysing single aspects of mobility, and the funding dedicated to it.
An overall improvement is apparent from the data analysed, especially in the 2010/2015 period, probably due to greater interest on the part of the authorities, the development of competent bodies to implement sustainable policies, and the imposition of European regulations pertaining to the reduction of CO2 emissions in urban areas. Shared mobility is certainly one of the greatest revolutions of urban mobility in recent years, and bike and car sharing have become established as a new paradigm of urban transport.
The analysis of funding highlighted differences in the ability to activate projects in urban areas, and improve sustainable mobility. Some of these improvements have been in place for a short time, and their results are not yet fully visible or measurable, but in cities like Cagliari, Florence, Bari, and Lecce, a significant improvement in mobility is now evident, compared to 2010. Italian city managers must continue to engage in the realization of sustainable mobility plans targeted at the optimization and promotion of public transport and collective mobility, from a perspective that is increasingly oriented toward environmental sustainability. To limit car use—now a major cause of congestion and pollution in cities—and increase sustainable mobility, a network of services should be built that covers the whole urban area. These alternative types of mobility can be encouraged and made more widespread—thanks to the use of technology that encompasses the development of advanced booking systems and mobile payments with a high level of usability for end users.
This research, which analyses the progress of mobility in 22 Italian cities, has encountered a limit: in Italy, only large cities share data, and it is therefore difficult to evaluate the complete situation for all Italian cities. The compilation of spatial data is a key aspect of how a smart city is structured. It is essential therefore, that all cities (even those with data that are not encouraging), share their data so that best practices can be identified and applied in other urban contexts, and that the other practices, the less positive ones, receive targeted interventions, in order to address the less positive factors. The sharing of knowledge, structured on the basis of scientific data is crucial for the realization of information campaigns for citizens, who are the real beneficiaries of the city. This can generate significant improvements to the sustainability of the territory orienting behaviours, consumer choices and lifestyles of citizens.
A possible future application may be developed by constantly monitoring changes in all the cities, and upgrading the use of the industry indicators analysed, so as to be able to address public administrators’ actions in those areas that are lacking or need to be improved. As for future research, it would be interesting to conduct a similar comparison, and to correlate all the specific aspects of a city, such as its environment, energy sources, society, citizens’ habits, and cultural aspects. In addition, another interesting aspect could be to focus on the actions of governance that have brought the city to a real improvement in terms of sustainability and smartness. This would allow defining an order of priority actions to be taken in specific urban areas, saving resources. Research based on a study of indicators can be applied in several interdisciplinary areas related to the development and planning of cities, and can also be replicated in European and international contexts.
Acknowledgments
This study was supported by the MIUR (Ministry of Education, Universities and Research [Italy]) through a project entitled Governing tHe smart city: a gOvernance-centred approach to SmarT urbanism—GHOST (Project code: RBSI14FDPF; CUP Code: F22I15000070008), financed with the SIR (Scientific Independence of Young Researchers) program. We authorize the MIUR to reproduce and distribute reprints for Governmental purposes, notwithstanding any copyright notations thereon. Any opinions, findings and conclusions or recommendations expressed in this material are those of the authors, and do not necessarily reflect the views of the MIUR.
Author Contributions
This paper is the result of the joint work of the authors. “Analysis of single variables“, and “Analysis of Smart Mobility Index” were written jointly by the authors. Francesco Pinna wrote the “Methodology”, and the “Correlation between finance and growth”. Francesca Masala wrote “General concepts”. Chiara Garau wrote the “Introduction”, “Current urban development issues related to mobility”, and the “Conclusions”.
Conflicts of Interest
The authors declare no conflict of interest. The founding sponsors had no role in the design of the study, the collection, analyses, or interpretation of the data, in writing the manuscript, or in the decision to publish the results.
References
- Litman, T.; Burwell, D. Issues in sustainable transportation. Int. J. Glob. Environ. Issues 2006, 6, 331–347. [Google Scholar] [CrossRef]
- Kenworthy, J. The eco-city: Ten key transport and planning dimensions for sustainable city development. Environ. Urban. 2006, 18, 67–85. [Google Scholar] [CrossRef]
- Banister, D. The sustainable mobility paradigm. Transp. Policy 2008, 15, 73–80. [Google Scholar] [CrossRef]
- Zhang, M.; Yazdani, B. Paradigm change of mobility in the twenty-first century. J. Sustain. Mobil. 2014, 1, 9–18. [Google Scholar] [CrossRef]
- Niglio, R.; Comitale, P.P. Sustainable urban mobility towards smart mobility: The case study of Bari area, Italy. TeMA J. Land Use Mobil. Environ. 2015, 8, 219–234. [Google Scholar]
- Garau, C.; Masala, F.; Pinna, F. Cagliari and smart urban mobility: Analysis and comparison. Cities 2016, 56, 35–46. [Google Scholar] [CrossRef]
- European Commission. Horizon 2020 Work Programme 2014–2015. 11. Smart, Green and Integrated Transport Revised. 10 December 2013. Available online: http://ec.europa.eu/research/participants/data/ref/h2020/wp/2014_2015/main/h2020-wp1415-transport_en.pdf (accessed on 2 February 2017).
- European Commission. Green Paper: Towards a New Culture for Urban Mobility; COM (2007) 551 Final; European Commission: Brussels, Belgium, 2007. [Google Scholar]
- European Commission. Action Plan on Urban Mobility; COM (2009) 490 Final; European Commission: Brussels, Belgium, 2009. [Google Scholar]
- European Commission. White Paper: Roadmap to a Single European Transport Area—Towards a Competitive and Resource Efficient Transport System; COM (2011) 144 Final; European Commission: Brussels, Belgium, 2011. [Google Scholar]
- European Commission. Together towards Competitive and Resource-Efficient Urban Mobility; COM (2013) 913 Final; European Commission: Brussels, Belgium, 2013. [Google Scholar]
- European Commission. A European Strategy for Low-Emission Mobility; COM (2016) 501; European Commission: Brussels, Belgium, 2016. [Google Scholar]
- European Commission. European Political Strategy Center Strategic Notes towards Low-Emission Mobility—Driving the Modernisation of the EU Economy. 2016. Available online: https://ec.europa.eu/epsc/sites/epsc/files/strategic_note_issue_17.pdf (accessed on 24 March 2017).
- European Strategy and Policy Analysis System. ESPAS (2015) Global Trends to 2030: Can the EU Meet the Challenges Ahead? An inter-institutional EU project with the participation of the European Parliament, the Council of the European Union, the European Commission and the European External Action Service; European Strategy and Policy Analysis System: Brussels, Belgium, 2015; pp. 1–82. Available online: http://europa.eu/espas/pdf/espas-report-2015.pdf (accessed on 10 September 2016).
- Anttiroiko, A.V. Urban Planning 2.0. Int. J. E Plan. Res. 2012, 1, 16–30. Available online: http://www.academia.edu/2161282/Urban_Planning_2.0 (accessed on 12 September 2016). [CrossRef]
- Komninos, N. The Age of Intelligent Cities: Smart Environments and Innovation-for-All Strategies; Routledge: London, UK; New York, NY, USA, 2014; Available online: http://www.routledge.com/books/details/9781138782198/ (accessed on 10 September 2016).
- Staricco, L. Smart mobility: Opportunità e condizioni. TeMA J. Land Use Mobil. Environ. 2013, 6, 341–354. [Google Scholar]
- Jiménez Herrero, L.M. Transport and mobility: The keys to sustainability. March 2011. Available online: http://www.fgcsic.es/lychnos/en_EN/articles/transport_and_mobility (accessed on 24 March 2017).
- Cheba, K.; Kiba-Janiak, M.; Saniuk, S.; Witkowski, K. Modeling transportation preferences of urban residents: The case of Poland. In Internet of Things. IoT Infrustructures; Giaffreda, R., Cagáňová, D., Li, Y., Riggio, R., Voisard, A., Eds.; Springer: Berlin, Germany, 2015; pp. 78–83. [Google Scholar]
- La Rocca, R.A. Mobilità sostenibile e stili di vita. Trimest. Lab. Territ. Mobil. Ambient. TeMALab 2011, 4, 29–42. [Google Scholar]
- Yigitcanlar, T.; Fabian, L.; Coiacetto, E. Challenges to urban transport sustainability and smart transport in a tourist city: The Gold Coast, Australia. Open Transp. J. 2008, 2, 29–46. [Google Scholar] [CrossRef]
- Yigitcanlar, T. Innovating urban policymaking and planning mechanisms to deliver knowledge-based agendas: A methodological approach. Int. J. Knowl. Based Dev. 2014, 5, 253–270. [Google Scholar] [CrossRef]
- Pardridge, W.M. Blood-brain barrier endogenous transporters as therapeutic targets: A new model for small molecule CNS drug discovery. Expert Opin. Ther. Targ. 2015, 19, 1059–1072. [Google Scholar] [CrossRef] [PubMed]
- De Luca, M.A.; Lai, F.; Corrias, F.; Caboni, P.; Bimpisidis, Z.; Maccioni, E.; Di Chiara, G. Lactoferrin-and antitransferrin-modified liposomes for brain targeting of the NK3 receptor agonist senktide: Preparation and in vivo evaluation. Int. J. Pharm. 2015, 479, 129–137. [Google Scholar] [CrossRef] [PubMed]
- Lyons, G. Getting smart about urban mobility—Aligning the paradigms of smart and sustainable. Transportation Research Part A: Policy and Practice. Transp. Res. Part A 2016. [Google Scholar] [CrossRef]
- Benevolo, C.; Dameri, R.P.; D’Auria, B. Smart Mobility in Smart City. In Empowering Organizations Enabling Platforms and Artefacts; Volume 11 of the Series Lecture Notes in Information Systems and Organisation; Springer: Heidelberg, Germany, 2016; pp. 13–28. [Google Scholar]
- Bertolini, L. Integrating mobility and urban development agendas: A manifesto. disP Plan. Rev. 2012, 48, 16–26. [Google Scholar] [CrossRef]
- Enoch, M. Sustainable Transport, Mobility Management and Travel Plans; Routledge: Abingdon, UK, 2012. [Google Scholar]
- Bos, R.; Straatemeier, T.; Temme, R. Joint accessibility design: Strategic urban development plan Breda 2030. In Proceedings of the Joint Conference: CITTA 7th Annual Conference, COST TU1002 Final Conference, Oporto, Portugal, 23–24 October 2014; pp. 1–22. [Google Scholar]
- Cervero, R. Transport Infrastructure and the Environment in the Global South: Sustainable Mobility and Urbanism. J. Perenc. Wil. Kota 2014, 25, 174–191. Available online: http://journals.itb.ac.id/index.php/jpwk/article/viewFile/1286/820 (accessed on 24 March 2017). [CrossRef]
- Pieralice, E.; Trepiedi, L. Città Europee e mobilità urbana: Impatto delle scelte modali. Riv. Econ. Polit. Trasp. 2015, 2, 1–42. Available online: http://www.openstarts.units.it/dspace/bitstream/10077/11197/1/REPoT_2015(2)-2_PIERALICE-TREPIEDI.pdf (accessed on 24 March 2017).
- ITU-T (International Telecommunication Union). Overview of Key Performance Indicators in Smart Sustainable Cities. Available online: https://www.google.com/webhp?sourceid=chrome-instant&ion=1&espv=2&ie=UTF-8#q=Overview+of+key+performance+indicators+in+smart+sustainable+cities (accessed on 24 March 2017).
- Formez, P.A. Dipartimento Funzione Pubblica. Il Ciclo di Gestione Della Performance—Esperienze e Leading Practice; 2012. Available online: http://qualitapa.gov.it/fileadmin/mirror/i-valperf/materiali/1.2_Il_ciclo_di_gestione_della_performance_negli_enti_locali_-_Leading_practice.pdf (accessed on 15 September 2016).
- Zhu, J. Quantitative Models for Performance Evaluation and Benchmarking: Data Envelopment Analysis with Spreadsheets; International Series in Operations Research & Management Science; Springer: Berlin, Germany, 2014. [Google Scholar]
- Giffinger, R.; Haindlmaier, G.; Kramar, H. The role of rankings in growing city competition. Urban Res. Pract. 2010, 3, 299–312. [Google Scholar] [CrossRef]
- Debnath, A.K.; Chin, H.C.; Haque, M.M.; Yuen, B. A methodological framework for benchmarking smart transport cities. Cities 2014, 37, 47–56. [Google Scholar] [CrossRef]
- EY. Rapporto Smart City Index 2016. Available online: http://www.ey.com/Publication/vwLUAssetsPI/EY-smart-city-index-2016/$FILE/2016-EY-smart-city-index.pdf (accessed on 24 March 2017).
- Garau, C.; Masala, F.; Pinna, F. Benchmarking smart urban mobility: A study on Italian cities. In Computational Science and Its Applications—ICCSA 2015, Lecture Notes in Computer Science; Gervasi, O., Murgante, B., Misra, S., Gavrilova, M.L., Rocha, A.M.A.C., Torre, C., Apduhan, B.O., Eds.; Springer: Heidelberg, Germany, 2015; Volume 9156, pp. 612–623. [Google Scholar]
- Da Cruz, N.F. A Brief Inquiry into the Uses of Measurement and Benchmarking in Local Governance. LSE Cities Working Papers Research Stand 03: Urban Governance and Institutional Frameworks. 2016. Available online: https://files.lsecities.net/files/2016/04/daCruzNF-working_paper-measurement_and_benchmarking.pdf (accessed on 2 February 2017).
- Salvia, M.; Cornacchia, C.; Di Renzo, G.C.; Braccio, G.; Annunziato, M.; Colangelo, A.; Orifici, L.; Lapenna, V. Promoting smartness among local areas in a Southern Italian region: The Smart Basilicata Project. Indoor Built Environ. 2016, 25, 1024–1038. [Google Scholar] [CrossRef]
- Albino, V.; Berardi, U.; Dangelico, R.M. Smart cities: Definitions, dimensions, performance, and initiatives. J. Urban Technol. 2015, 22, 3–21. [Google Scholar] [CrossRef]
- Moreno Pires, S.; Fidélis, T.; Ramos, T.B. Measuring and comparing local sustainable development through common indicators: Constraints and achievements in practice. Cities 2014, 39, 1–9. [Google Scholar] [CrossRef]
- Anthopoulos, G.L.; Janssen, M.; Weerakkody, V. Comparing smart cities with different modeling approaches. In Proceedings of the 24th International Conference on World Wide Web, WWW ’15 Companion, New York, NY, USA, 18–22 May 2015; pp. 525–528. [Google Scholar]
- European Smart Cities. Available online: http://www.smart-cities.eu/?cid=-1&ver=3 (accessed on 8 February 2017).
- ICitylab. Available online: http://www.icitylab.it/il-rapporto-icityrate/edizione-2015/dati-2015/ (accessed on 8 February 2017).
- Osservatorio Mobilità Sostenibile in Italia. Available online: http://www.xn--osservatorio50citt-wrb.it/ (accessed on 8 February 2017).
- Agenda Urbana. Available online: http://www.agendaurbana.it/ (accessed on 24 March 2017).
- Giffinger, R.; Fertner, C.; Kramar, H.; Kalasek, R.; Pichler-Milanović, N.; Meijers, E. Smart Cities: Ranking of European Medium-Sized Cities; Vienna University of Technology: Vienna, Austria, 2007. [Google Scholar]
- Gargiulo, C.; Pinto, V.; Zucaro, F. EU smart city governance. TeMA J. Land Use Mobil. Environ. 2013, 6, 356–370. [Google Scholar]
- ELISA Program. Available online: http://www.programmaelisa.it/Programma_Elisa.aspx (accessed on 30 September 2016).
- M.U.S.A Project. Available online: http://www.musainnovazione.it/index.php?option=com_content&view=article&id=53&Itemid=230 (accessed on 30 September 2016).
- 2014. Available online: http://www.istat.it/it/archivio/129010 (accessed on 30 September 2016).
- ISTAT (Istituto Nazionale di Statistica). Ambiente Urbano: Gestione Ecocompatibile e Smartness. 2014. Available online: http://www.istat.it/it/archivio/141296 (accessed on 30 September 2016).
- Mazziotta, C.; Mazziotta, M.; Pareto, A.; Vidoli, F. La costruzione di un indicatore sintetico di dotazione infrastrutturale: Metodi e applicazioni a confronto. In Proceedings of the XXIX Conferenza Italiana di Scienze Regionali, Bari, Italy, 24–26 September 2008. [Google Scholar]
Figure 1.
Italian cities selected for the ranking.

Figure 2.
Public Transport variable.

Figure 3.
Cycle lanes variable.

Figure 4.
Bike Sharing variable.

Figure 5.
Car sharing variable.

Figure 6.
Indicator of parking stalls in the parking exchange.

Figure 7.
Electric Car indicator.

Figure 8.
Dissemination of the Smart Mobility Index in Italian cities.

Figure 9.
Comparison of Smart Mobility Index to four and six indicators in Italian cities.


Table 1.
Analysis of Cagliari’s smart mobility.
| Cagliari | ||||||
|---|---|---|---|---|---|---|
| Variables | Indicator | year | ||||
| 2005 | 2010 | 2015 | Range 2005–2010 | Range 2010–2015 | ||
| Public transport | IBND | 362.36 | 362.36 | 364.65 | = | + |
| IDPT | 211.50 | 259.21 | 260.49 | + | + | |
| Cycle lanes | ICLD | 2.30 | 2.30 | 17.43 | = | + |
| ICLI | 0.12 | 0.13 | 0.97 | = | + | |
| Bike sharing | IBSD | 0.00 | 4.65 | 11.62 | + | + |
| IBPI | 0.00 | 2.23 | 6.80 | + | + | |
| Car sharing | ICI | 0.00 | 0,00 | 0.65 | = | + |
| ISI | 0.00 | 0.00 | 0.97 | = | + | |
| IBND: Indicator of Bus network density | ||||||
| IDPT: Indicator of Demand for public transport | ||||||
| ICLD: Indicator of Cycle lanes density | ||||||
| ICLI: Indicator of Cycle lanes for ten thousand inhabitants | ||||||
| IBSD: Indicator of Bicycle station density | ||||||
| IBPI: Indicator of Bicycle per thousand inhabitants | ||||||
| ICI: Indicator of Car for ten thousand inhabitants | ||||||
| ISI: Indicator of Station for ten thousand inhabitants | ||||||
Table 2.
Values of Public Transport indicator.
| Public Transport | ||||||
|---|---|---|---|---|---|---|
| Cities | IBND—Bus Network Density (km/Square Kilometres) | IDPT—Demand for Public Transport (Passengers per Years/Inhabitants) | ||||
| 2005 | 2010 | 2015 | 2005 | 2010 | 2015 | |
| Bolzano | 120.39 | 133.00 | 138.45 | 111 | 147 | 137 |
| Udine | 241.75 | 283.22 | 282.83 | 99 | 102 | 91 |
| Treviso | 162.16 | 162.16 | 161.93 | 71 | 106 | 98 |
| Brescia | 195.19 | 256.62 | 244.51 | 165 | 174 | 204 |
| Turin | 505.26 | 546.21 | 523.55 | 184 | 210 | 215 |
| Piacenza | 85.26 | 85.26 | 79.25 | 83 | 76 | 80 |
| Bologna | 203.51 | 209.83 | 220.79 | 248 | 249 | 262 |
| Rimini | 109.90 | 13.34 | 190.41 | 91 | 86 | 96 |
| Genoa | 305.40 | 305.40 | 852.23 | 247 | 261 | 235 |
| Florence | 437.46 | 504.83 | 366.50 | 230 | 240 | 231 |
| Ancona | 163.61 | 163.61 | 163.89 | 120 | 116 | 109 |
| Terni | 65.88 | 65.88 | 65.71 | 38 | 40 | 38 |
| Teramo | 53.68 | 53.68 | 53.39 | 46 | 44 | 36 |
| Frosinone | 202.04 | 202.04 | 202.80 | 13 | 16 | 18 |
| Campobasso | 179.69 | 228.57 | 106.45 | 61 | 67 | 62 |
| Salerno | 249.66 | 320.56 | 325.80 | 74 | 89 | 41 |
| Potenza | 92.54 | 92.54 | 90.06 | 15 | 16 | 10 |
| Bari | 234.08 | 241.65 | 265.78 | 54 | 79 | 57 |
| Lecce | 120.39 | 176.18 | 75.93 | 14 | 21 | 15 |
| Catanzaro | 107.78 | 107.78 | 198.71 | 42 | 44 | 54 |
| Palermo | 211.86 | 214.63 | 212.34 | 113 | 55 | 37 |
| Cagliari | 362.36 | 362.36 | 364.65 | 211 | 259 | 260 |
Table 3.
Values of Cycle Lanes indicator.
| Cycle Lanes | ||||||
|---|---|---|---|---|---|---|
| Cities | ICLD—Cycle Lanes Density (km/100 Square Kilometres) | ICLI—Cycle Lanes for Ten Thousand Inhabitants (km/10,000 Inhabitants) | ||||
| 2005 | 2010 | 2015 | 2005 | 2010 | 2015 | |
| Bolzano | 72.60 | 95.50 | 100.21 | 3.90 | 4.84 | 4.94 |
| Udine | 38.80 | 63.87 | 73.29 | 2.18 | 3.48 | 3.99 |
| Treviso | 54.10 | 107.05 | 109.57 | 3.66 | 7.25 | 7.28 |
| Brescia | 107.00 | 132.83 | 134.82 | 5.03 | 6.24 | 6.21 |
| Turin | 77.60 | 134.40 | 146.68 | 1.12 | 1.92 | 2.13 |
| Piacenza | 35.40 | 55.48 | 64.61 | 4.22 | 4.86 | 7.47 |
| Bologna | 45.50 | 64.96 | 85.55 | 1.71 | 2.43 | 3.12 |
| Rimini | 44.90 | 57.48 | 63.59 | 4.52 | 5.56 | 5.85 |
| Genoa | 0.00 | 0.54 | 0.54 | 0.00 | 0.02 | 0.05 |
| Florence | 35.20 | 49.70 | 89.91 | 0.98 | 1.38 | 2.41 |
| Ancona | 0.90 | 2.70 | 3.44 | 0.11 | 0.33 | 0.42 |
| Terni | 6.10 | 7.83 | 8.59 | 1.19 | 1.47 | 1.62 |
| Teramo | 0.00 | 6.54 | 6.54 | 0.00 | 1.82 | 1.82 |
| Frosinone | 0.00 | 11.70 | 17.08 | 0.00 | 1.13 | 1.72 |
| Campobasso | 0.90 | 11.60 | 11.78 | 0.07 | 1.27 | 1.34 |
| Salerno | 5.40 | 5.40 | 7.52 | 0.24 | 0.23 | 0.33 |
| Potenza | 0.00 | 0.00 | 1.00 | 0.00 | 0.00 | 0.26 |
| Bari | 4.70 | 6.39 | 5.11 | 0.17 | 0.23 | 0.18 |
| Lecce | 4.60 | 16.80 | 18.67 | 1.20 | 4.21 | 4.81 |
| Catanzaro | 1.30 | 8.50 | 8.87 | 0.15 | 0.79 | 0.81 |
| Palermo | 3.80 | 13.30 | 43.63 | 0.09 | 0.32 | 1.03 |
| Cagliari | 2.30 | 2.30 | 46.48 | 0.12 | 0.21 | 2.59 |
Table 4.
Values of Bike Sharing indicator.
| Bike Sharing | ||||||
|---|---|---|---|---|---|---|
| Cities | IBSD—Bicycle Station Density (n° Station/100 Square Kilometres) | IBPI—Bicycle for Ten Thousand Inhabitants (n° Bicycle/10,000 Inhabitants) | ||||
| 2005 | 2010 | 2015 | 2005 | 2010 | 2015 | |
| Bolzano | 0.00 | 0.00 | 2.13 | 0.00 | 0.00 | 27.95 |
| Udine | 0.00 | 7.67 | 20.44 | 0.00 | 1.16 | 1.68 |
| Treviso | 0.00 | 11.93 | 18.74 | 0.00 | 4.00 | 3.51 |
| Brescia | 0.00 | 11.33 | 27.27 | 0.00 | 13.69 | 56.93 |
| Turin | 0.00 | 104.68 | 117.99 | 0.00 | 32.15 | 70.45 |
| Piacenza | 0.00 | 0.00 | 2.49 | 0.00 | 0.00 | 0.38 |
| Bologna | 17.68 | 16.95 | 18.42 | 4.45 | 13.29 | 13.55 |
| Rimini | 0.00 | 0.00 | 16.61 | 0.00 | 0.00 | 7.04 |
| Genoa | 0.00 | 2.83 | 2.83 | 0.00 | 2.13 | 1.25 |
| Florence | 0.00 | 0.00 | 10.69 | 0.00 | 0.00 | 45.52 |
| Ancona | 0.00 | 0.00 | 0.00 | 0.00 | 0.00 | 0.00 |
| Terni | 0.00 | 2.36 | 6.61 | 0.00 | 2.66 | 3.48 |
| Teramo | 0.00 | 3.93 | 0.00 | 0.00 | 4.36 | 0.00 |
| Frosinone | 0.00 | 0.00 | 12.81 | 0.00 | 0.00 | 10.75 |
| Campobasso | 0.00 | 0.00 | 0.00 | 0.00 | 0.00 | 0,00 |
| Salerno | 0.00 | 0.00 | 5.01 | 0.00 | 0.00 | 1,77 |
| Potenza | 0.00 | 0.00 | 0.00 | 0.00 | 0.00 | 0.00 |
| Bari | 0.00 | 12.78 | 18.74 | 0.00 | 2.03 | 1.83 |
| Lecce | 0.00 | 2.94 | 4.61 | 0.00 | 7.37 | 10.62 |
| Catanzaro | 0.00 | 0.00 | 0.00 | 0.00 | 0.00 | 0.00 |
| Palermo | 0.00 | 0.00 | 5.60 | 0.00 | 0.00 | 6.19 |
| Cagliari | 0.00 | 4.65 | 11.62 | 0.00 | 2.23 | 6.80 |
Table 5.
Values of Car Sharing indicator.
| Car Sharing | ||||||
|---|---|---|---|---|---|---|
| Cities | ISI—Station for Ten Thousand Inhabitants (n° Station/10,000 Inhabitants) | ICI—Car for Ten Thousand Inhabitants (n° Car/10,000 Inhabitants) | ||||
| 2005 | 2010 | 2015 | 2005 | 2010 | 2015 | |
| Bolzano | 0.00 | 0.00 | 0.57 | 0.00 | 0.00 | 1.51 |
| Udine | 0.00 | 0.00 | 0.00 | 0.00 | 0.00 | 0.00 |
| Treviso | 0.00 | 0.00 | 0.00 | 0.00 | 0.00 | 0.00 |
| Brescia | 0.00 | 0.31 | 0.56 | 0.00 | 0.31 | 0.56 |
| Turin | 0.38 | 0.97 | 0.87 | 0.61 | 1.37 | 4.46 |
| Piacenza | 0.00 | 0.00 | 0.00 | 0.00 | 0.00 | 0.00 |
| Bologna | 0.29 | 0.82 | 0.80 | 0.80 | 1.06 | 1.06 |
| Rimini | 0.67 | 0.00 | 2.10 | 0.89 | 0.00 | 1.56 |
| Genoa | 0.25 | 0.95 | 0.91 | 0.33 | 1.25 | 0.88 |
| Florence | 0.00 | 0.43 | 0.55 | 0.00 | 0.65 | 5.25 |
| Ancona | 0.00 | 0.00 | 0.00 | 0.00 | 0.00 | 0.00 |
| Terni | 0.00 | 0.00 | 0.00 | 0.00 | 0.00 | 0.00 |
| Teramo | 0.00 | 0.00 | 0.00 | 0.00 | 0.00 | 0.00 |
| Frosinone | 0.00 | 0.00 | 0.00 | 0.00 | 0.00 | 0.00 |
| Campobasso | 0.00 | 0.00 | 0.00 | 0.00 | 0.00 | 0.00 |
| Salerno | 0.00 | 0.00 | 0.00 | 0,00 | 0.00 | 0.00 |
| Potenza | 0.00 | 0.00 | 0.00 | 0,00 | 0.00 | 0.00 |
| Bari | 0.00 | 0.00 | 0.00 | 0,00 | 0.00 | 0.00 |
| Lecce | 0.00 | 0.00 | 0.11 | 0,00 | 0.00 | 0.85 |
| Catanzaro | 0.00 | 0.00 | 0.00 | 0.00 | 0.00 | 0.00 |
| Palermo | 0.00 | 0.69 | 0.60 | 0.00 | 0.55 | 1.86 |
| Cagliari | 0.00 | 0.00 | 0.65 | 0.00 | 0.00 | 0.97 |
Table 6.
Values of the Indicator of parking stalls in the parking exchange.
| Cities | Parking Stalls in the Parking Exchange | |
|---|---|---|
| ISPI—Parking Stalls Interchange (n° Stalls/1.000 Inhabitants) | ||
| 2010 | 2015 | |
| Bolzano | - | 10.16 |
| Udine | - | 8.00 |
| Treviso | 5.11 | 5.02 |
| Brescia | 0.00 | 6.27 |
| Turin | 6.80 | 7.40 |
| Piacenza | 42.61 | 43.76 |
| Bologna | - | 6.45 |
| Rimini | 0.00 | 0.00 |
| Genoa | 0.00 | 0.77 |
| Florence | - | 2.49 |
| Ancona | 13.90 | 18.27 |
| Terni | - | 37.90 |
| Teramo | 29.09 | 29.09 |
| Frosinone | 0.00 | 0.00 |
| Campobasso | 9.49 | 7.08 |
| Salerno | 0.00 | 0.00 |
| Potenza | 3.50 | 2.30 |
| Bari | 6.81 | 6.93 |
| Lecce | - | 6.08 |
| Catanzaro | - | - |
| Palermo | 4.20 | 4.06 |
| Cagliari | - | 13.08 |
Table 7.
Values of electric vehicles in the fleet indicator.
| Cities | Percentage of Electric Vehicles in the Fleet (%) |
|---|---|
| 2015 | |
| Bolzano | 0.061 |
| Udine | 0.008 |
| Treviso | - |
| Brescia | 0.012 |
| Turin | 0.011 |
| Piacenza | 0.004 |
| Bologna | 0.02 |
| Rimini | 0.01 |
| Genoa | 0.006 |
| Florence | 0.047 |
| Ancona | 0.01 |
| Terni | 0.003 |
| Teramo | - |
| Frosinone | - |
| Campobasso | 0.001 |
| Salerno | 0.004 |
| Potenza | 0.002 |
| Bari | 0.006 |
| Lecce | - |
| Catanzaro | 0.002 |
| Palermo | 0.012 |
| Cagliari | 0.011 |
© 2017 by the authors. Licensee MDPI, Basel, Switzerland. This article is an open access article distributed under the terms and conditions of the Creative Commons Attribution (CC BY) license (http://creativecommons.org/licenses/by/4.0/).
Share and Cite
MDPI and ACS Style
Pinna, F.; Masala, F.; Garau, C. Urban Policies and Mobility Trends in Italian Smart Cities. Sustainability 2017, 9, 494. https://doi.org/10.3390/su9040494
AMA Style
Pinna F, Masala F, Garau C. Urban Policies and Mobility Trends in Italian Smart Cities. Sustainability. 2017; 9(4):494. https://doi.org/10.3390/su9040494
Chicago/Turabian StylePinna, Francesco, Francesca Masala, and Chiara Garau. 2017. "Urban Policies and Mobility Trends in Italian Smart Cities" Sustainability 9, no. 4: 494. https://doi.org/10.3390/su9040494
Note that from the first issue of 2016, this journal uses article numbers instead of page numbers. See further details here.