Article

Vulnerability Analysis of Urban Drainage Systems: Tree vs. Loop Networks

School of Hydraulic Engineering, Dalian University of Technology, Dalian 116024, China
*
Author to whom correspondence should be addressed.
Sustainability 2017, 9(3), 397; https://doi.org/10.3390/su9030397
Submission received: 16 January 2017 / Accepted: 23 February 2017 / Published: 7 March 2017

Abstract

:
Vulnerability analysis of urban drainage networks plays an important role in urban flood management. This study analyzes and compares the vulnerability of tree and loop systems under various rainfall events to structural failure represented by pipe blockage. Different pipe blockage scenarios, in which one of the pipes in an urban drainage network is assumed to be blocked individually, are constructed and their impacts on the network are simulated under different storm events. Furthermore, a vulnerability index is defined to measure the vulnerability of the drainage systems before and after the implementation of adaptation measures. The results obtained indicate that the tree systems have a relatively larger proportion of critical hydraulic pipes than the loop systems, thus the vulnerability of tree systems is substantially greater than that of the loop systems. Furthermore, the vulnerability index of tree systems is reduced after they are converted into a loop system with the implementation of adaptation measures. This paper provides an insight into the differences in the vulnerability of tree and loop systems, and provides more evidence for development of adaptation measures (e.g., tanks) to reduce urban flooding.

1. Introduction

Urban drainage systems are an increasingly important part of urban infrastructure that conveys stormwater and wastewater away from urban areas and contributes to the general well-being of the urban population [1,2,3,4,5,6]. However, there are pressing challenges in design and operation of urban drainage systems due to climate change, urbanization, population increase and demographic change. These are imposed on top of everyday disturbances and system failures, such as pipe corrosion, pipe blockage and pump failure. The development of adaptive drainage networks implies that they can effectively provide the required level of service not only during standard operating conditions, but also during unexpected, critical and extreme conditions which are likely to occur in a long term period. Therefore, there is a need to investigate the vulnerability of urban drainage networks, understand their performance under a number of extreme conditions, and develop adaptation measures to maintain and even improve system performance in a long term period.
Vulnerability originates in the study of natural disasters and measures the degree of adverse effects of disasters on systems [7,8]. Liverman (1990) noted that “vulnerability has been related or equated to concepts such as resilience, marginality, susceptibility, adaptability, fragility, and risk” [9], so vulnerability may mean different things to different people. A structure is vulnerable when a small threat leads to disproportionately large failure consequences. In this study, the vulnerability of urban drainage systems is defined as the degree to which a system is susceptible to, or unable to cope with, adverse effects when subject to exceptional conditions, such as pipe blockage.
Vulnerability analysis is an important analytical tool that has been applied to a number of diverse fields such as climate change impact assessment, natural disaster management, environmental protection, land use management, communications and networking, industrial production and sustainable development, water distribution systems [10,11,12,13,14,15,16,17,18]. For example, Davidson and Shah (1997) developed a comprehensive urban Earthquake Disaster Risk Index that allows direct comparison of the relative overall earthquake disaster risk of cities worldwide, and describes the relative contribution of various factors to that overall risk [11]. Turvey (2007) put forward a spatial methodology for vulnerability assessment in developing countries by constructing a composite vulnerability index [12]. Ezell (2007) developed an Infrastructure Vulnerability Assessment Model to quantify the vulnerability of water supply systems [19]. However, vulnerability analysis has not been widely applied in real-world applications and in particular there are few attempts in the field of urban drainage systems.
Vulnerability analysis can contribute to the development of mitigation measures to reduce the consequences of the threats. In fact, vulnerability analysis is normally conducted from identifying various threats that may occur, testing the response of the system, and identifying the weakest components. In the field of water distribution systems, different quantitative analysis methods have been developed for vulnerability assessment, such as probability and statistics methods, comprehensive index methods, Markov Latent Effects modeling methods [14,19,20,21,22,23,24,25,26,27,28,29,30]. For example, Murray et al. (2004) developed a probability and statistics method which can be used to assess the vulnerability of a water utility to a large range of contamination attacks [26]. Ezell (2007) developed a comprehensive index method (i.e., deterrence, detection, delay, and response) which can also be used to quantify the vulnerability of the systems by establishing the comprehensive evaluation index [19]. Pinto et al. (2010) introduced the theory of vulnerability of water pipe network (TVWPN) which is to help design water pipe networks (WPN) more robust against damage to the pipelines [31].
The above evaluation models have played an important role in the vulnerability analysis of water distribution systems, but there were a few studies for urban drainage systems [2,32,33,34,35,36,37,38]. For example, Moderl et al. (2009) developed the VulNetUD method, which is for GIS-based identification of vulnerable sites of urban drainage systems using hydrodynamic simulations undertaken using EPA SWMM [32]. Poulter et al. (2008) presented an application of graph theoretic algorithms to efficiently investigate network properties relevant to the management of a large artificial drainage system in coastal North Carolina, USA [33]. Some studies focused on the structure or hydraulic conditions of a single pipe in order to make safety evaluation [39], though a higher order of failure is considered in few studies [40]. However, few vulnerability assessment studies investigate the vulnerability of the entire drainage systems [41], especially the comparative analysis of the vulnerability for pipe networks which have different layouts, such as tree and loop drainage systems. Though loop drainage systems are not common, there are still many loop networks in reality [34,36,42,43,44]. For example, Yongwon et al. (2015) stated that “loops are easily found in urban catchments not just for water supply pipe networks, but also for stormwater drainage pipe networks” [42], and investigated the behavior of a fully looped network for a given rainfall event using the Storm Water Management Model.
This paper aims to analyze the vulnerability of tree and loop drainage systems to structural failure represented by pipe blockage. Mitigation measures are explored to reduce the vulnerability of tree drainage systems. Three tree systems and three loop systems in Dalian, China are used as case studies; their vulnerabilities are assessed under different design rainfall events and critical pipes of each system are revealed. Furthermore, a vulnerability index (VI) is defined to measure the vulnerability of the drainage systems before and after the implementation of adaptation measures.

2. Methodology

Figure 1 shows the methodology for vulnerability analysis of urban drainage systems, which is used to compare different tree and loop drainage systems. For a drainage system, vulnerability analysis is carried out by supposing pipe p 1 of this system is blocked, the corresponding consequences are assessed. To analyze the impacts of this pipe blockage on the performance of the entire drainage system, system performance indicators are used and calculated using a hydrodynamic simulation model under various design storm events. The hydrodynamic simulations are repeated for other pipes p i (i = 2, …, N). It should be noted that only one pipe is assumed to be blocked at the same time in this study, though higher orders of blockage can be used.
The total flood volume from the entire drainage system during a storm event is used as a performance indicator when one of the pipes is blocked. If the flood volume of the system is larger when a pipe is blocked, the system is more vulnerable to the failure of this pipe and the pipe is more critical; that is, it will have serious influence on the operation of the drainage system if it is blocked. In this study, we will compare and analyze the vulnerability of three tree and three loop systems with the analysis of flood volume and the proportion of critical pipes.
A brief introduction is given below to the hydrodynamic simulations and vulnerability index.

2.1. Hydrodynamic Simulations

Hydrodynamic simulations are undertaken by using the EPA Storm Water Management Model (SWMM), which is a dynamic rainfall-runoff simulation model used for single event or long-term (continuous) simulation of runoff quantity and quality from primarily urban areas [45]. It is widely used throughout the world for planning, analysis and design related to storm water runoff, combined sewers, sanitary sewers, and other drainage systems in urban areas, with many applications in non-urban areas as well [6,46,47,48,49,50,51].
When the pipe p i (i = 1, 2, …, N) of one system is blocked, the diameter of p i is set close to 0, such as 0.01 m. Hydrodynamic simulation is undertaken under different rainfall events, then the total flood volume V i of this system is calculated:
V i = n = 1 m v n
where V i denotes the flood volume of the systems when pipe p i is blocked, v n denotes the node flood volume at junction n, and m indices the number of overflow nodes.
Absolute flood volume and surface runoff of different drainage systems under different storm events are different. Here we use a relative value PI as a performance indicator to represent the ratio of water from runoff which cannot drain away through drainage pipes. Hence, PI is calculated from total flood volume (Vi) and surface runoff (VR) after
P I = V i V R
where VR denotes the surface runoff in a rainfall event.

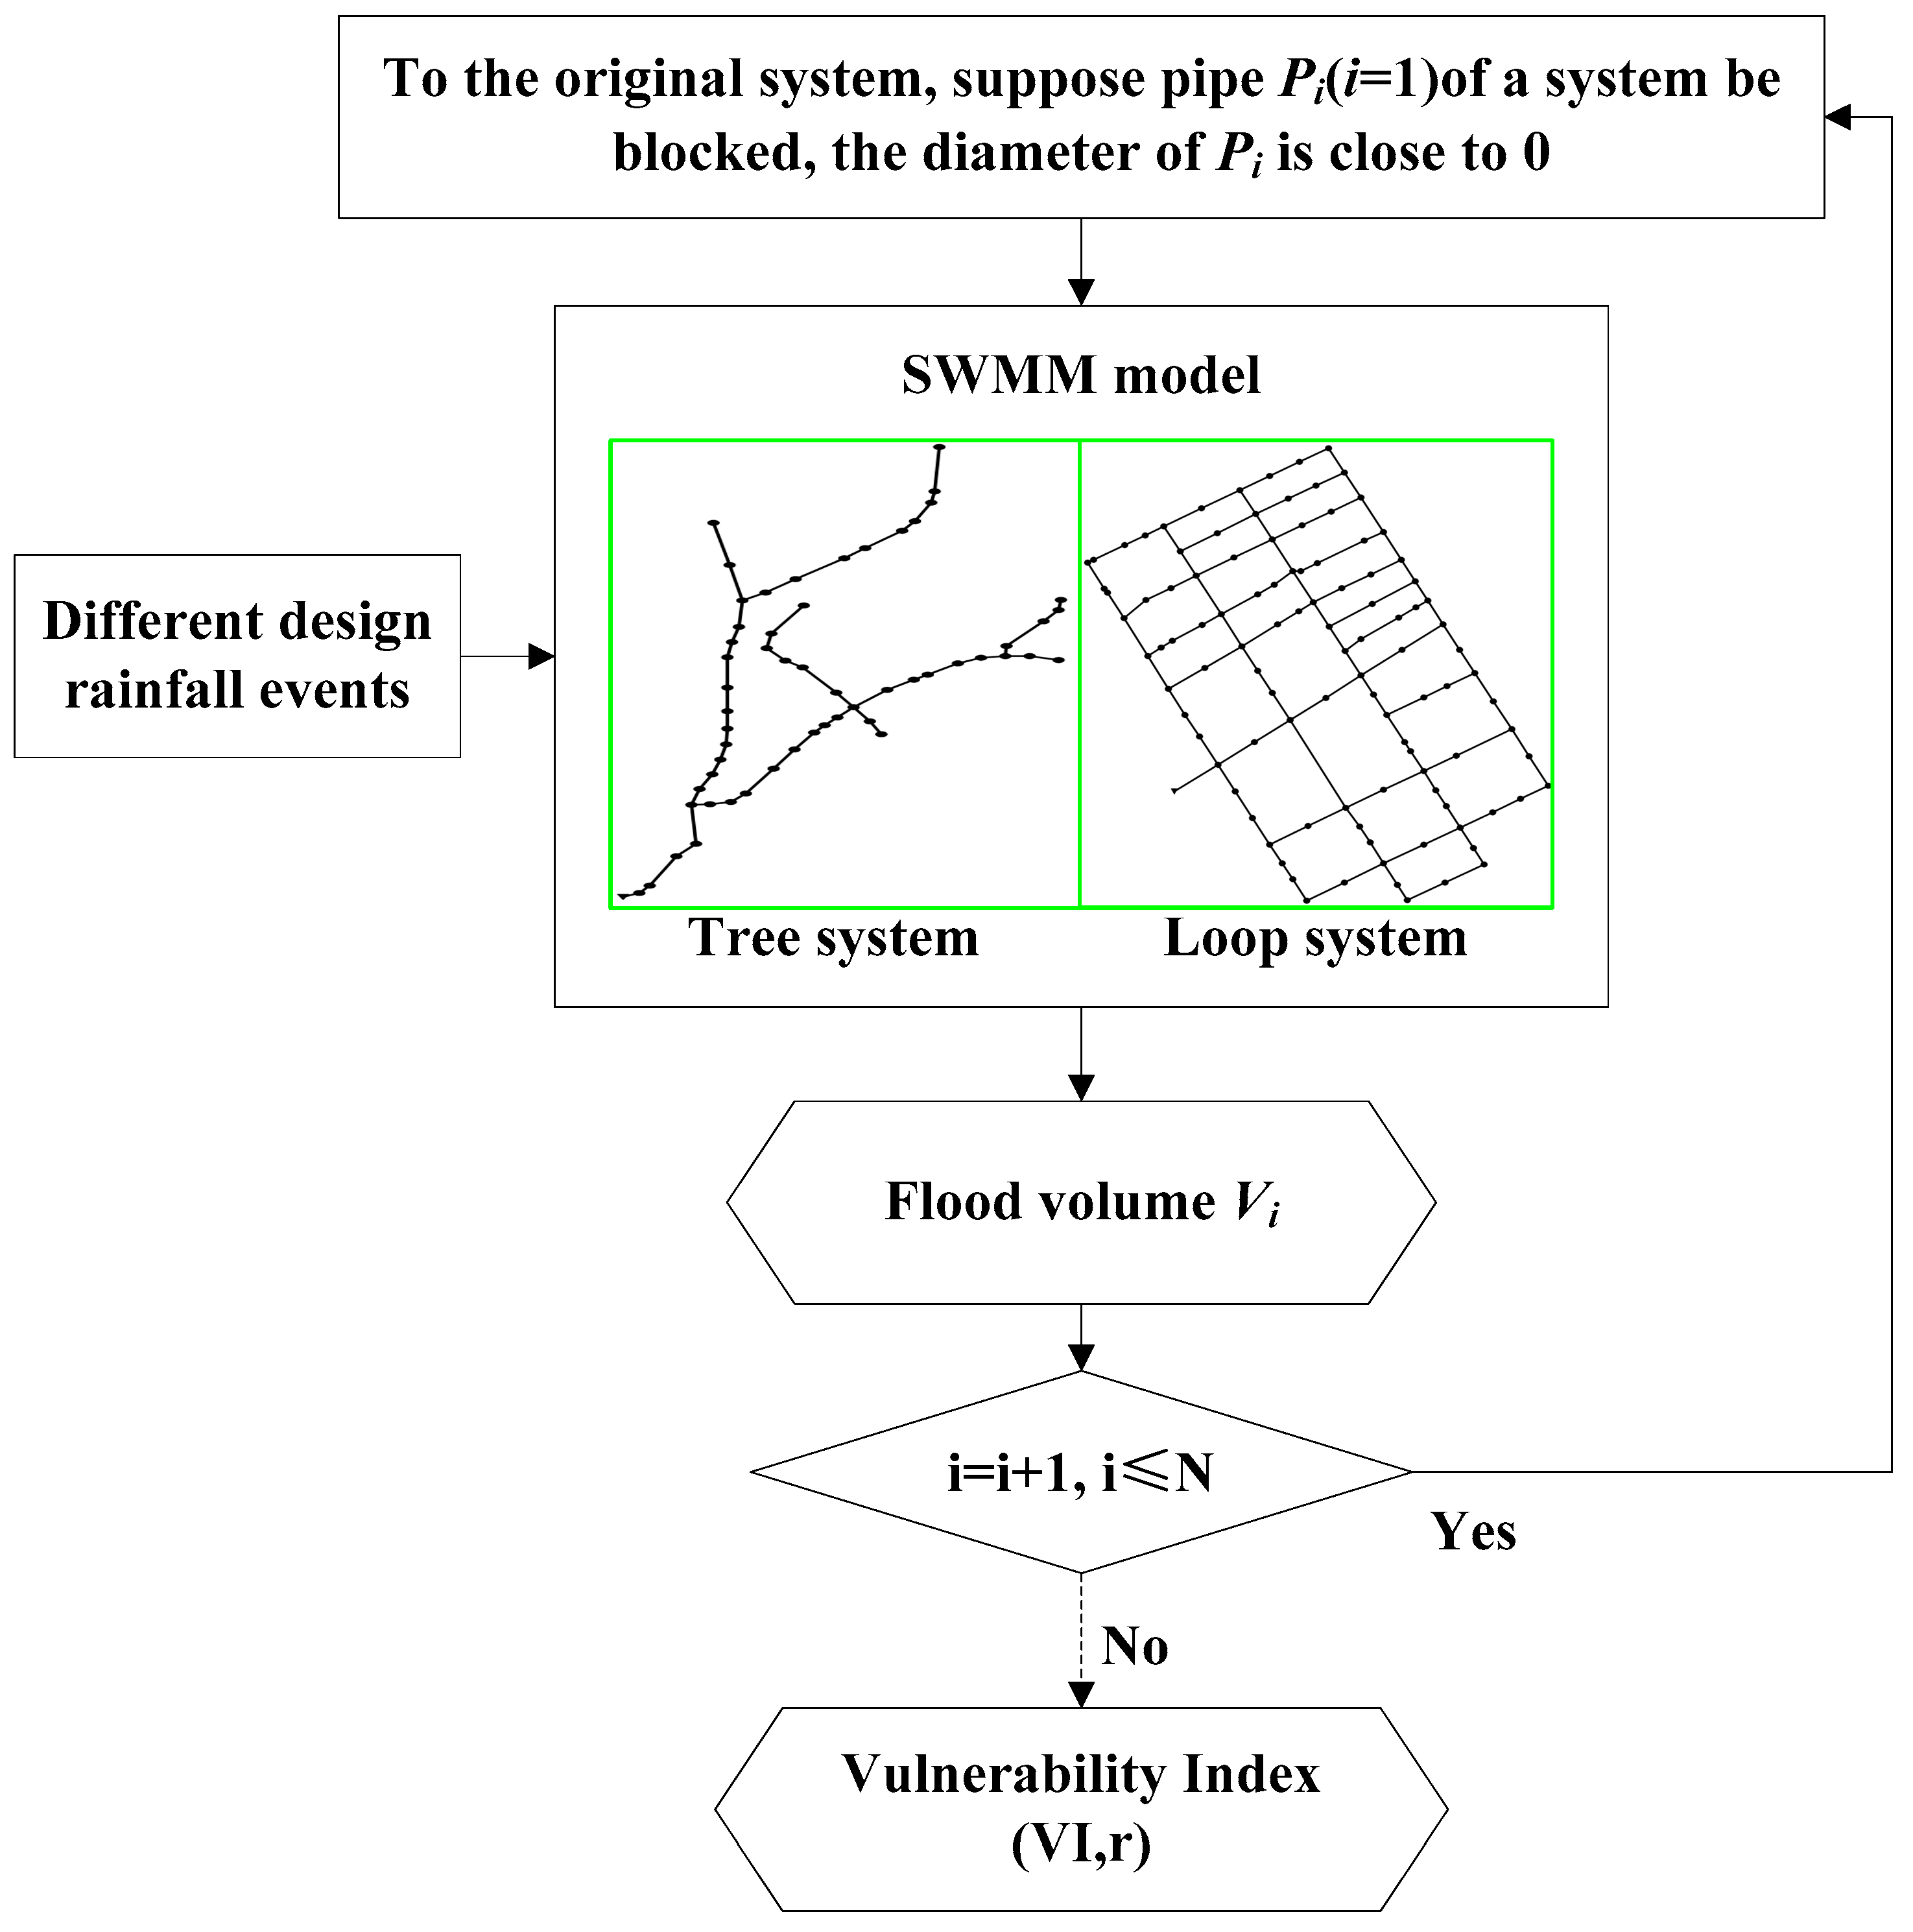
2.2. Vulnerability Index Calculation

We propose a vulnerability index VI to measure the vulnerability of the drainage systems, including the evaluation before and after the implementation of adaptation measures for the tree drainage systems. Calculation of the index is described as follow:
V I = i = 1 N P I / N
where VI is the vulnerability index; and N is the pipe number of the drainage system.

3. Case Study

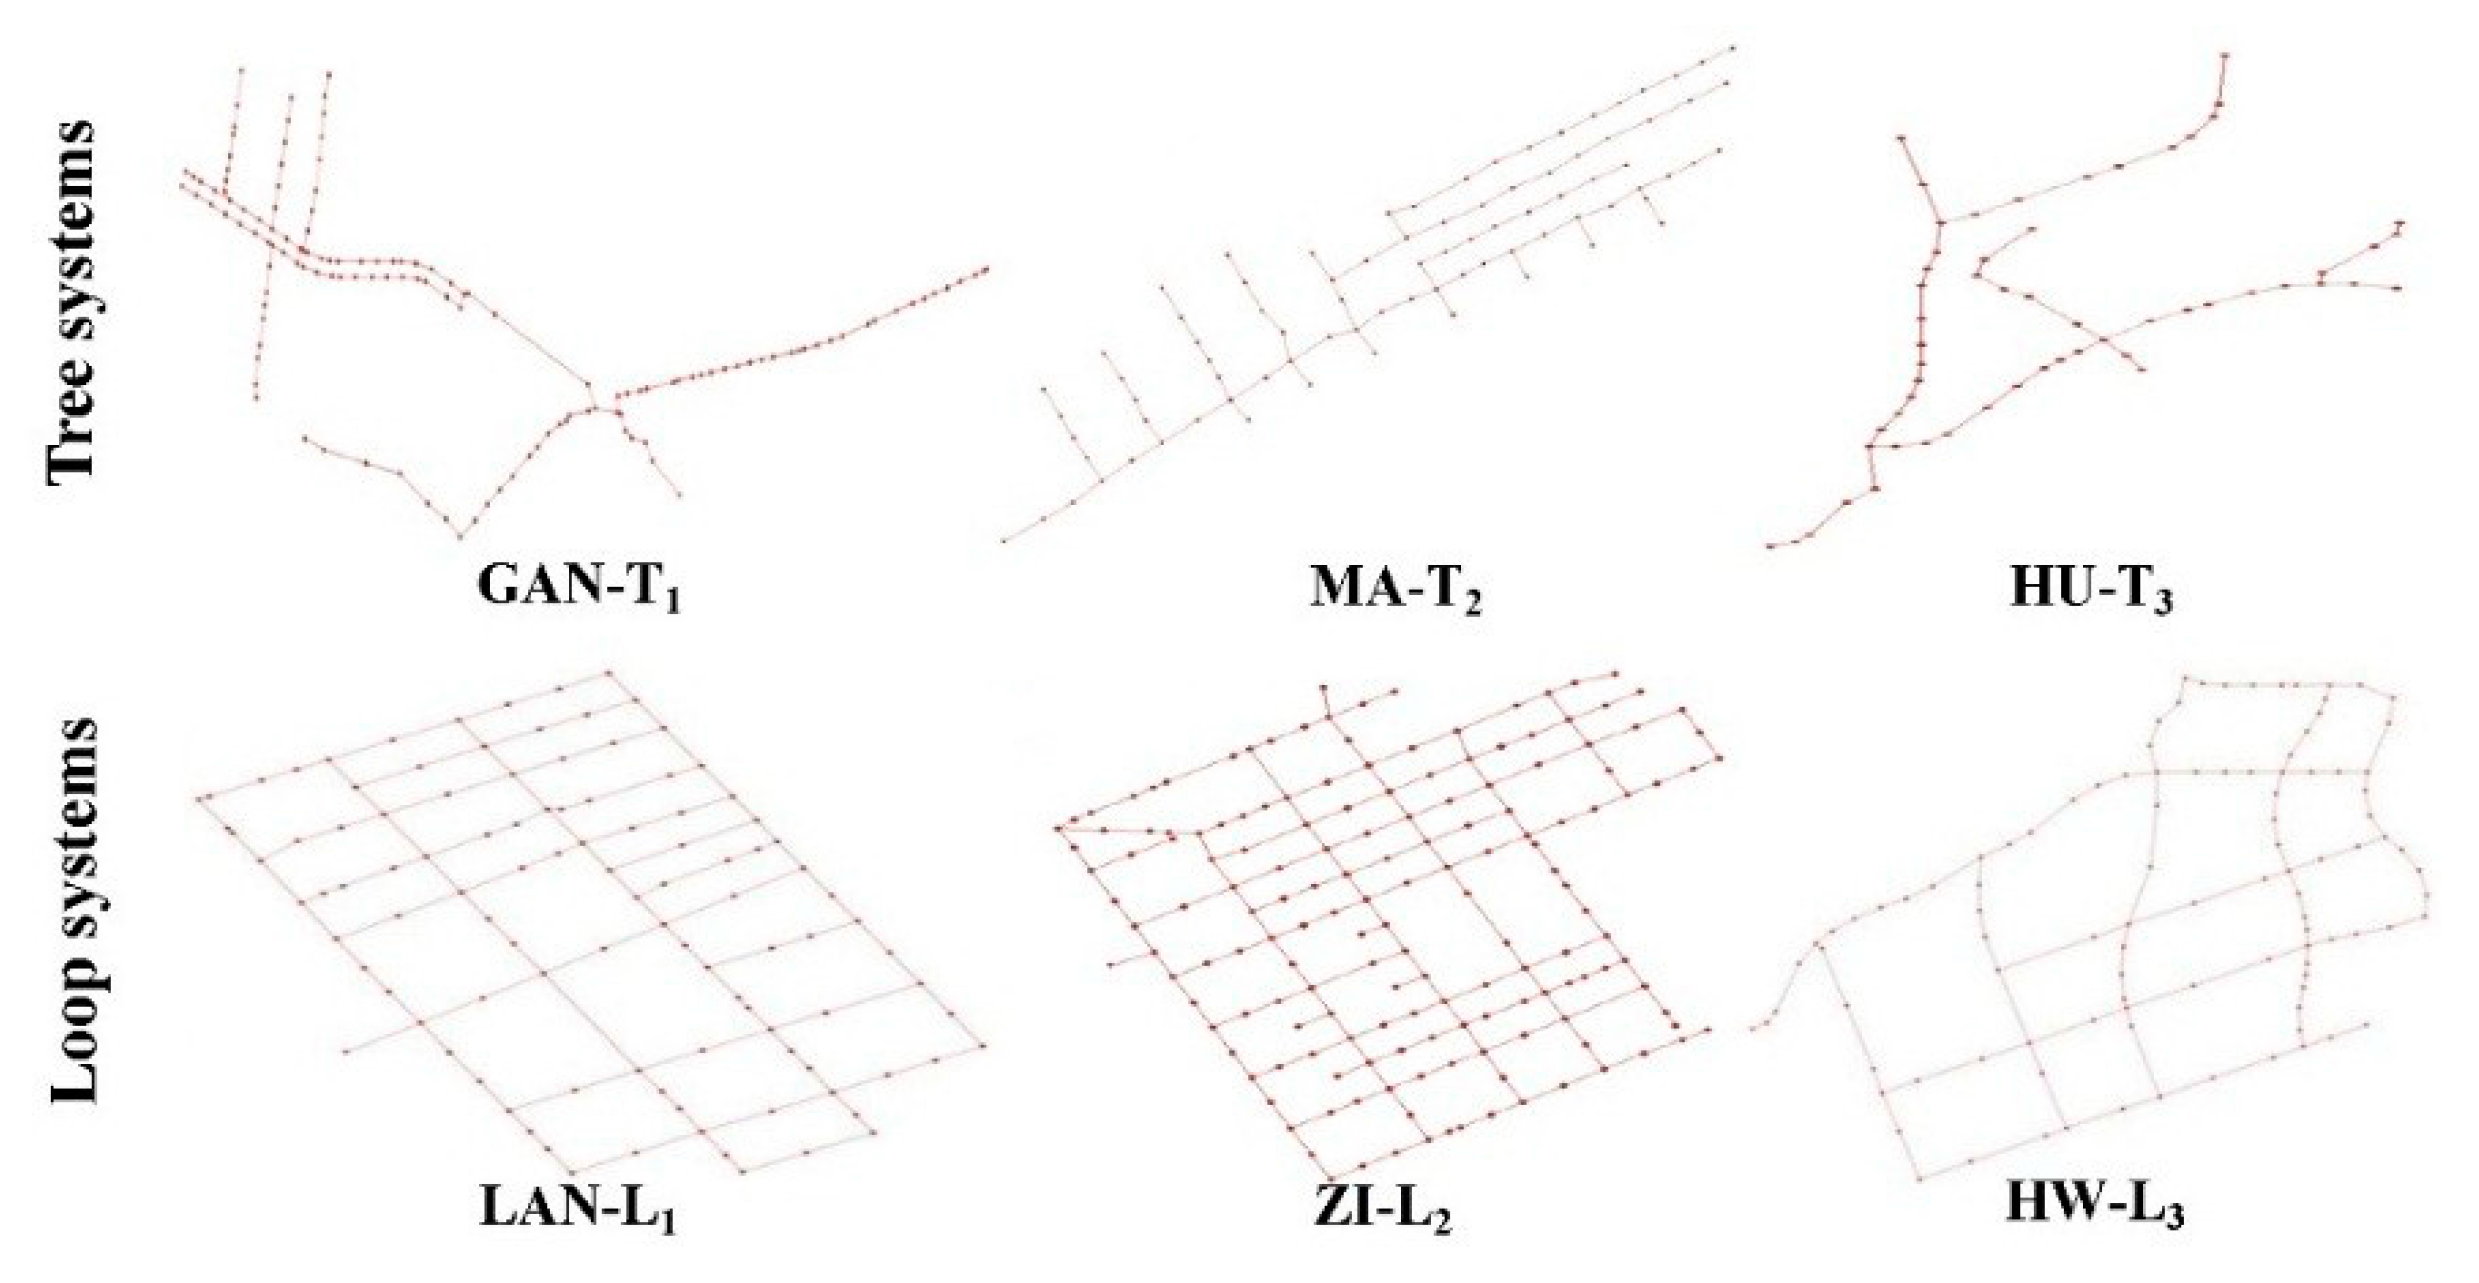
3.1. Case Study Networks

The city of Dalian lies in the south of Liaodong Peninsula, China. In recent years, the impact of flooding has been increasing mainly due to urbanization, which has increased the impervious land cover and caused more surface runoff, faster runoff concentration and higher peak flow rate. Urban floods can cause considerable damage in this region, and therefore the analysis and evaluation of the vulnerability of the drainage systems are of great importance. In this study, as shown in Figure 2, six drainage systems are selected to study the vulnerability, including three tree systems (GAN-T1, MA-T2, and HU-T3) and three loop systems (LAN-L1, ZI-L2, and HW-L3), all six drainage systems are designed for draining stormwater to reduce urban flooding. The components of each system are shown in Table 1. For example, the study area of GAN-T1 is simplified to 136 junctions, 136 pipes and 1 outfall. The study catchments for this drainage system have a drainage area of 103.2 ha.

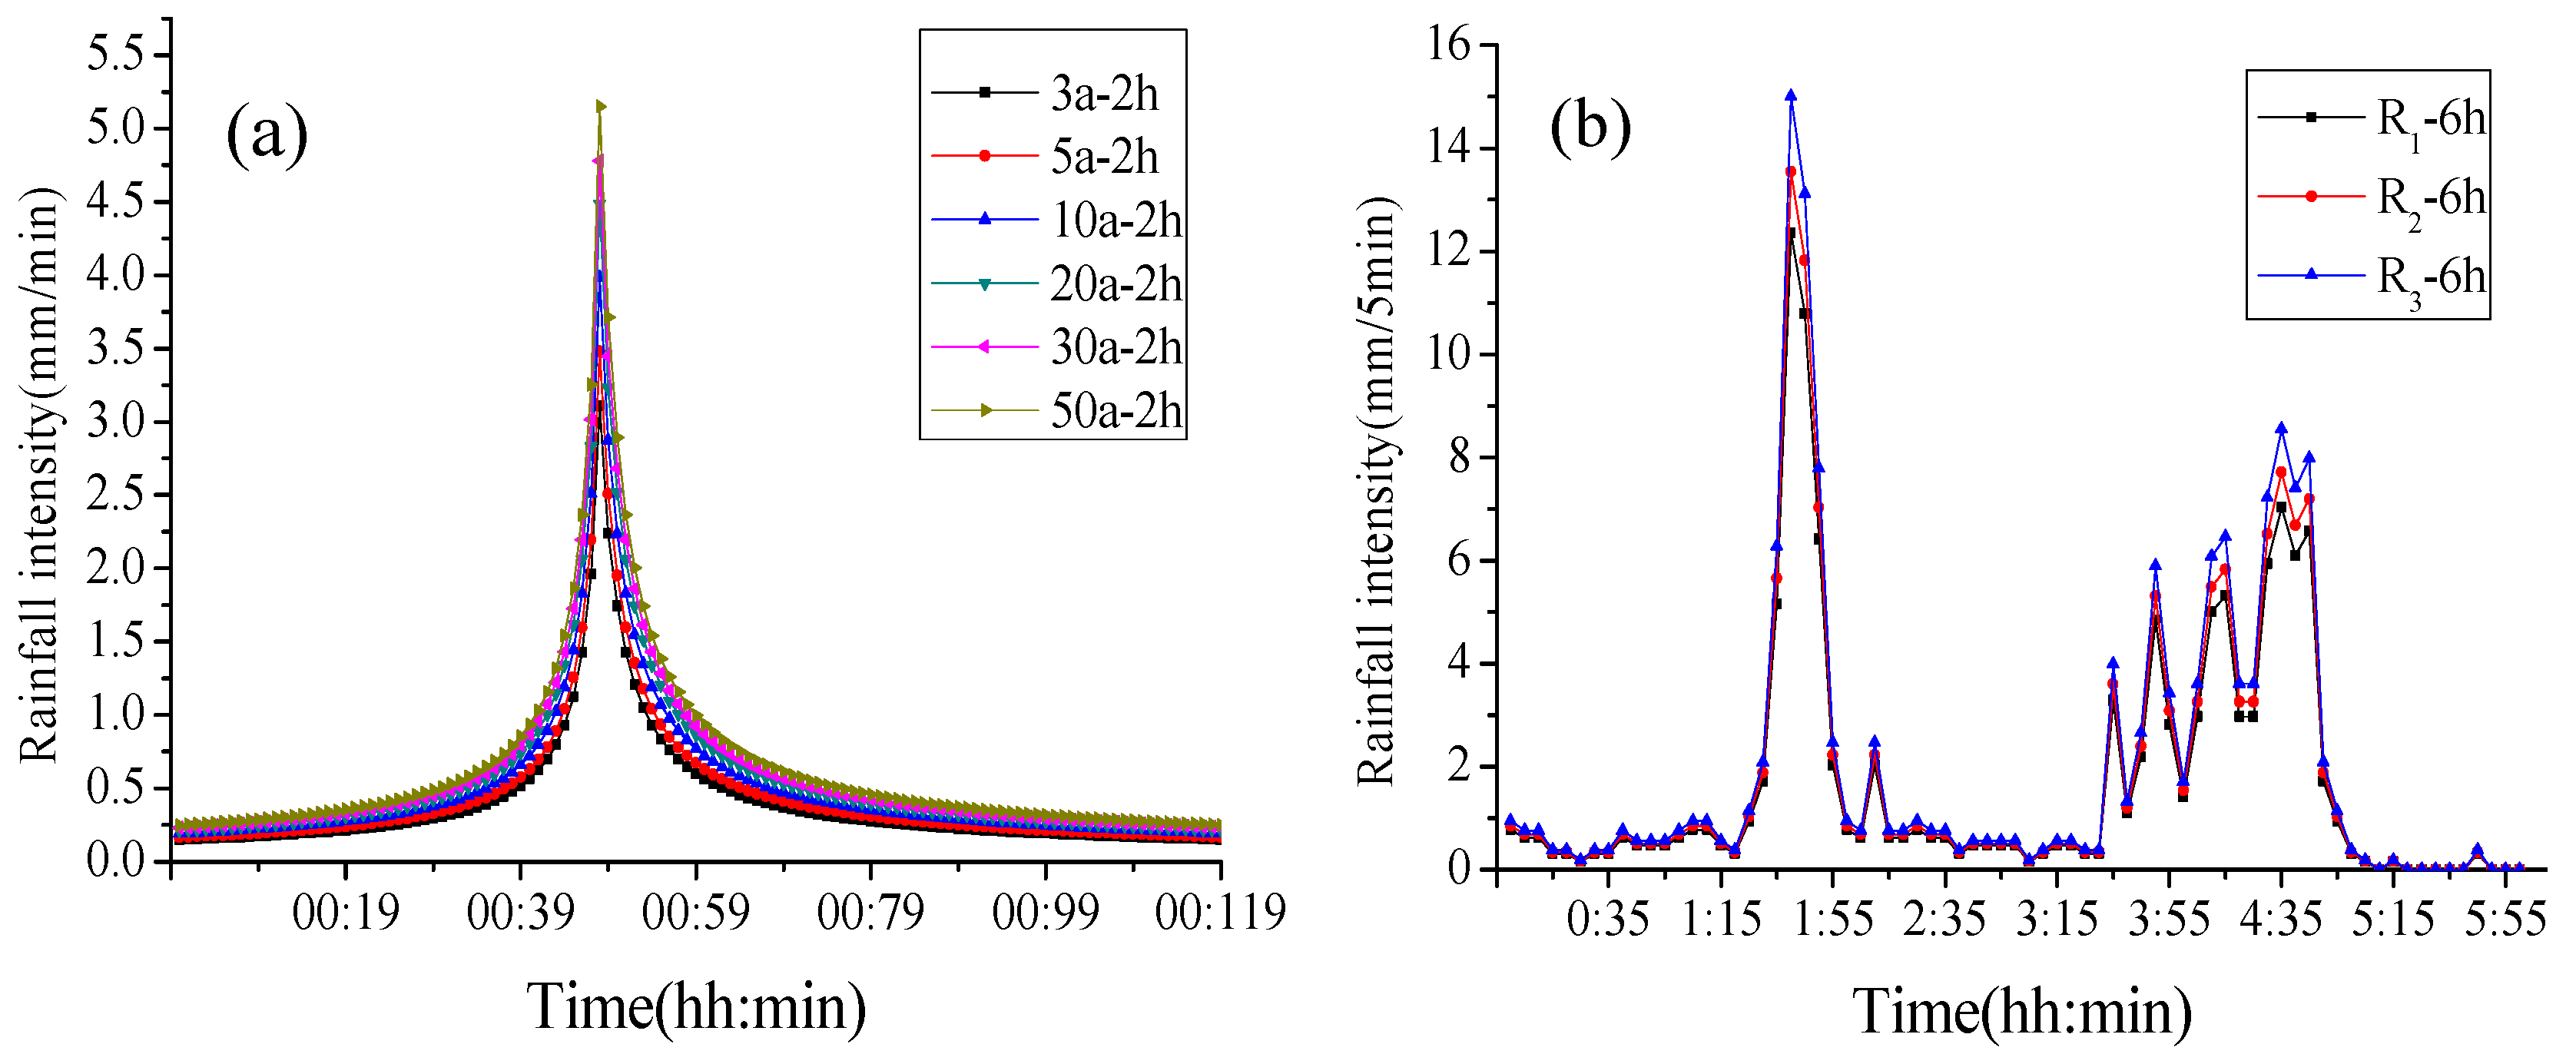
3.2. Model Inputs and Parameters

SWMMv5.1 is used to build the model for the rainfall flood simulation. SWMM supports the use of three different routing models for the stormwater network, and the full dynamic wave model in SWMM is used in this study to route flows through the modeled drainage systems. Furthermore, the model takes the infiltration loss into consideration, and infiltration is modeled using the Horton infiltration model, which shows that infiltration decreases exponentially from an initial maximum rate to some minimum rate over the course of a long rainfall event. According to the terrain features of the research area, the maximum and minimum infiltration rates are 76.2 mm/h and 3.18 mm/h, and the decay coefficient is 4 h−1 [52]. A Digital Elevation Model (DEM) with 4 m horizontal resolution for Dalian is used to build the model. In the parameterizations, the catchment of each drainage system is divided into subcatchments based on the DEM, land use and the sewer network layout. Then the subcatchment is drained through the stormwater network. The rainfall events include 2-h design rainfall events with a Chicago hyetograph [53] and 6-h rainfall events with an actual rainfall profile. Different design storms will give the additional insight in the system behavior, helping to analyze the operation of the system when suffered different rainfall patterns. According to the rain intensity Equation of Dalian, 2-h rainfall events of 3-, 5-, 10-, 20-, 30-, and 50-year return periods are generated using the Chicago rainfall pattern [54,55], in which rainfall intensity is calculated as
q = 1230.157 × ( 1 + 0.724 lg P ) ( t + 5.783 ) 0.661
where q is the average rainfall intensity, L/(s·ha); P is return period, year; and t is duration of rainfall, min.
According to the annual average rainfall of Dalian (mean value x ¯ , deviation coefficient c v and variation coefficient c s ), the profile of a typical actual rainfall is selected to generate 6-h simulated rainfall events of 20-, 30-, and 50-year return periods by using the same multiple method. As Figure 3b shows, they are described as R1-6h, R2-6h, and R3-6h, respectively.

3.3. Cost of the Pipes and Tanks

During the implementation of adaptation measures for the tree drainage systems, pipes will be added into the systems to form a loop, and the cost is also an important consideration. For the purpose of calculating the cost of the pipe, the non-linear cost function is used, and the parameters of this function can be obtained by using statistical software SPSS [56]. The cost function is described as follow:
C = (425.339 + 4903.395H + 69.895H2 + 1.434DH − 18.692D + 0.062D2)/100
where C is the pipe cost per meter, Yuan; H is the burial depth, m; and D is the diameter of the pipe, mm.
Furthermore, storage tank provision is used as another adaptation measure for the tree drainage systems to reduce the flood volume. The cost function for tank is adapted from Tao et al. (2014) [53] as below
C = 2.195 × 10 4 × V o l u m e 0.69
where C is the cost of the tank, Yuan; and Volume is the provided volume of the storage tank, m3.

4. Results and Discussion

4.1. Vulnerability of Tree and Loop Network Systems

Figure 4 and Figure 5 show the flood volume of the tree systems and loop systems, respectively. The x-axis shows the pipe number of each drainage system, and the y-axis shows the flood volume of the drainage systems when one pipe is blocked under various storm events. Figure 4a–c shows the flood volume for the design rainfall events, and Figure 4d–f for the 6-h simulated rainfall events. Furthermore, same considerations are extended for Figure 5. In the 2-h design hyetograph scenario, the colors show the flood volume for rainfall events with different return periods (i.e., 2-h rainfall events of 3-, 5-, 10-, 20-, 30-, and 50-year return periods).

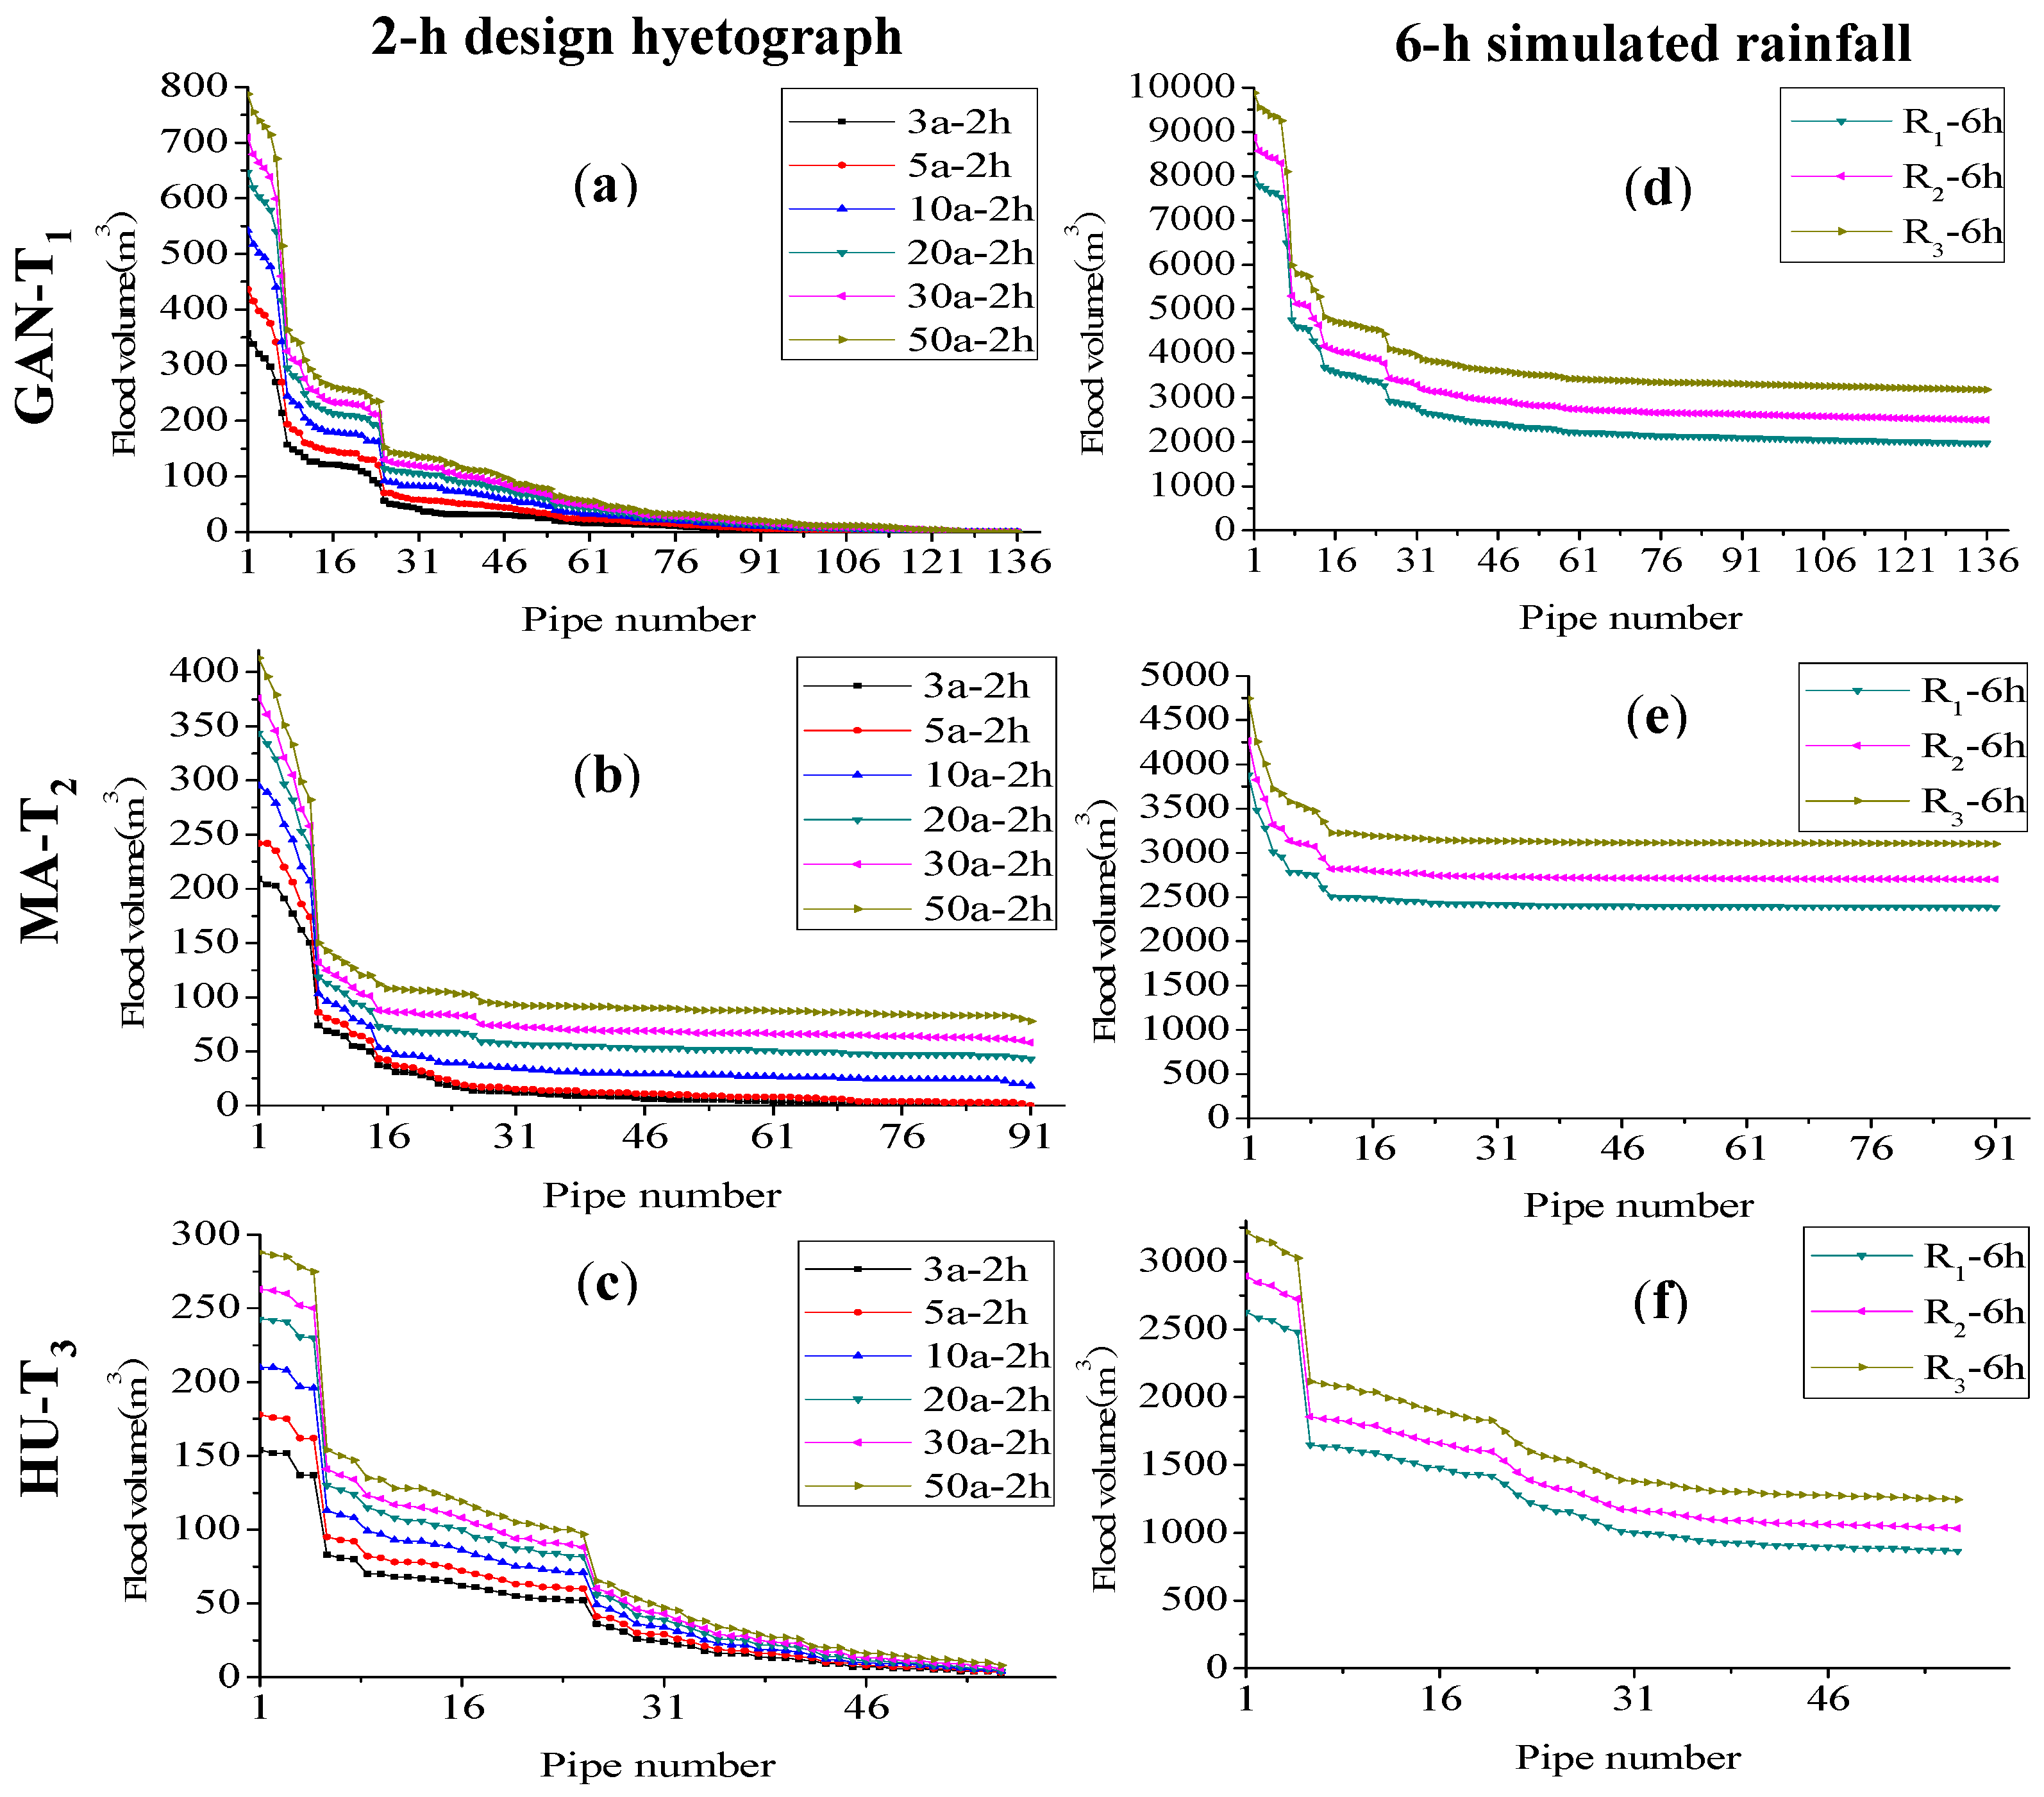
4.1.1. Tree Network Systems

Figure 4a shows the curves of GAN-T1 for the 2-h design hyetographs. With the rainfall of 3a-2h, the flood volume value is reduced gradually along the x-axis. When pipe No. 1 is blocked, it results in the largest flood volume, this implies that this pipe is the most critical hydraulic pipe. A threshold of flood volume of the drainage system can be defined to identify critical pipes whose blockage can result in a significant loss of the required level of service. Assuming that a flood volume of 0 m3 is used as the threshold in the rainfall of 3a-2h, i.e., no surface flooding, there are 100 critical pipes out of a total number of 136 in the case of rainfall 3a-2h. However, there is no flooding for the other 36 pipes if they are blocked in the rainfall of 3a-2h, because their mains are distributed near the upstream with a very small area of catchment. The proportion of critical hydraulic pipes for GAN-T1 system is 73.5%. This means that the drainage system is vulnerable with a large fraction of critical pipes under rainfall 3a-2h. The other curves in Figure 4a follow a similar trend to the curve of 3a-2h. However, the maximum flood volume increases with the increase of rainfall intensity.
Compared to Figure 4a, the flood volume curves of GAN-T1 under the rainfall events of 6-h simulated rainfall profile (i.e., R1-6h, R2-6h, and R3-6h) are shown in Figure 4d. The characteristics of the curves of 6-h simulated rainfall profile are similar to the curves of 2-h design hyetograph. Though the curves become flat at the end of the curves, they are not reduced to zero. Further, the flood volumes are different and relatively larger than those of 2-h design hyetograph because of the strong rainfall intensities.
The other two tree systems, i.e., MA-T2 and HU-T3, show similar characteristics to GAN-T1, though the flood volume are different under the same rainfall events, due to different catchment areas and other characteristics among the three tree systems.
In summary, the proportion of critical hydraulic pipes is relatively large for tree networks, for example, in 5a-2h rainfall pattern condition, the proportions of critical hydraulic pipes for GAN-T1, MA-T2, and HU-T3 systems are 83.1%, 99.0% and 100%, respectively.

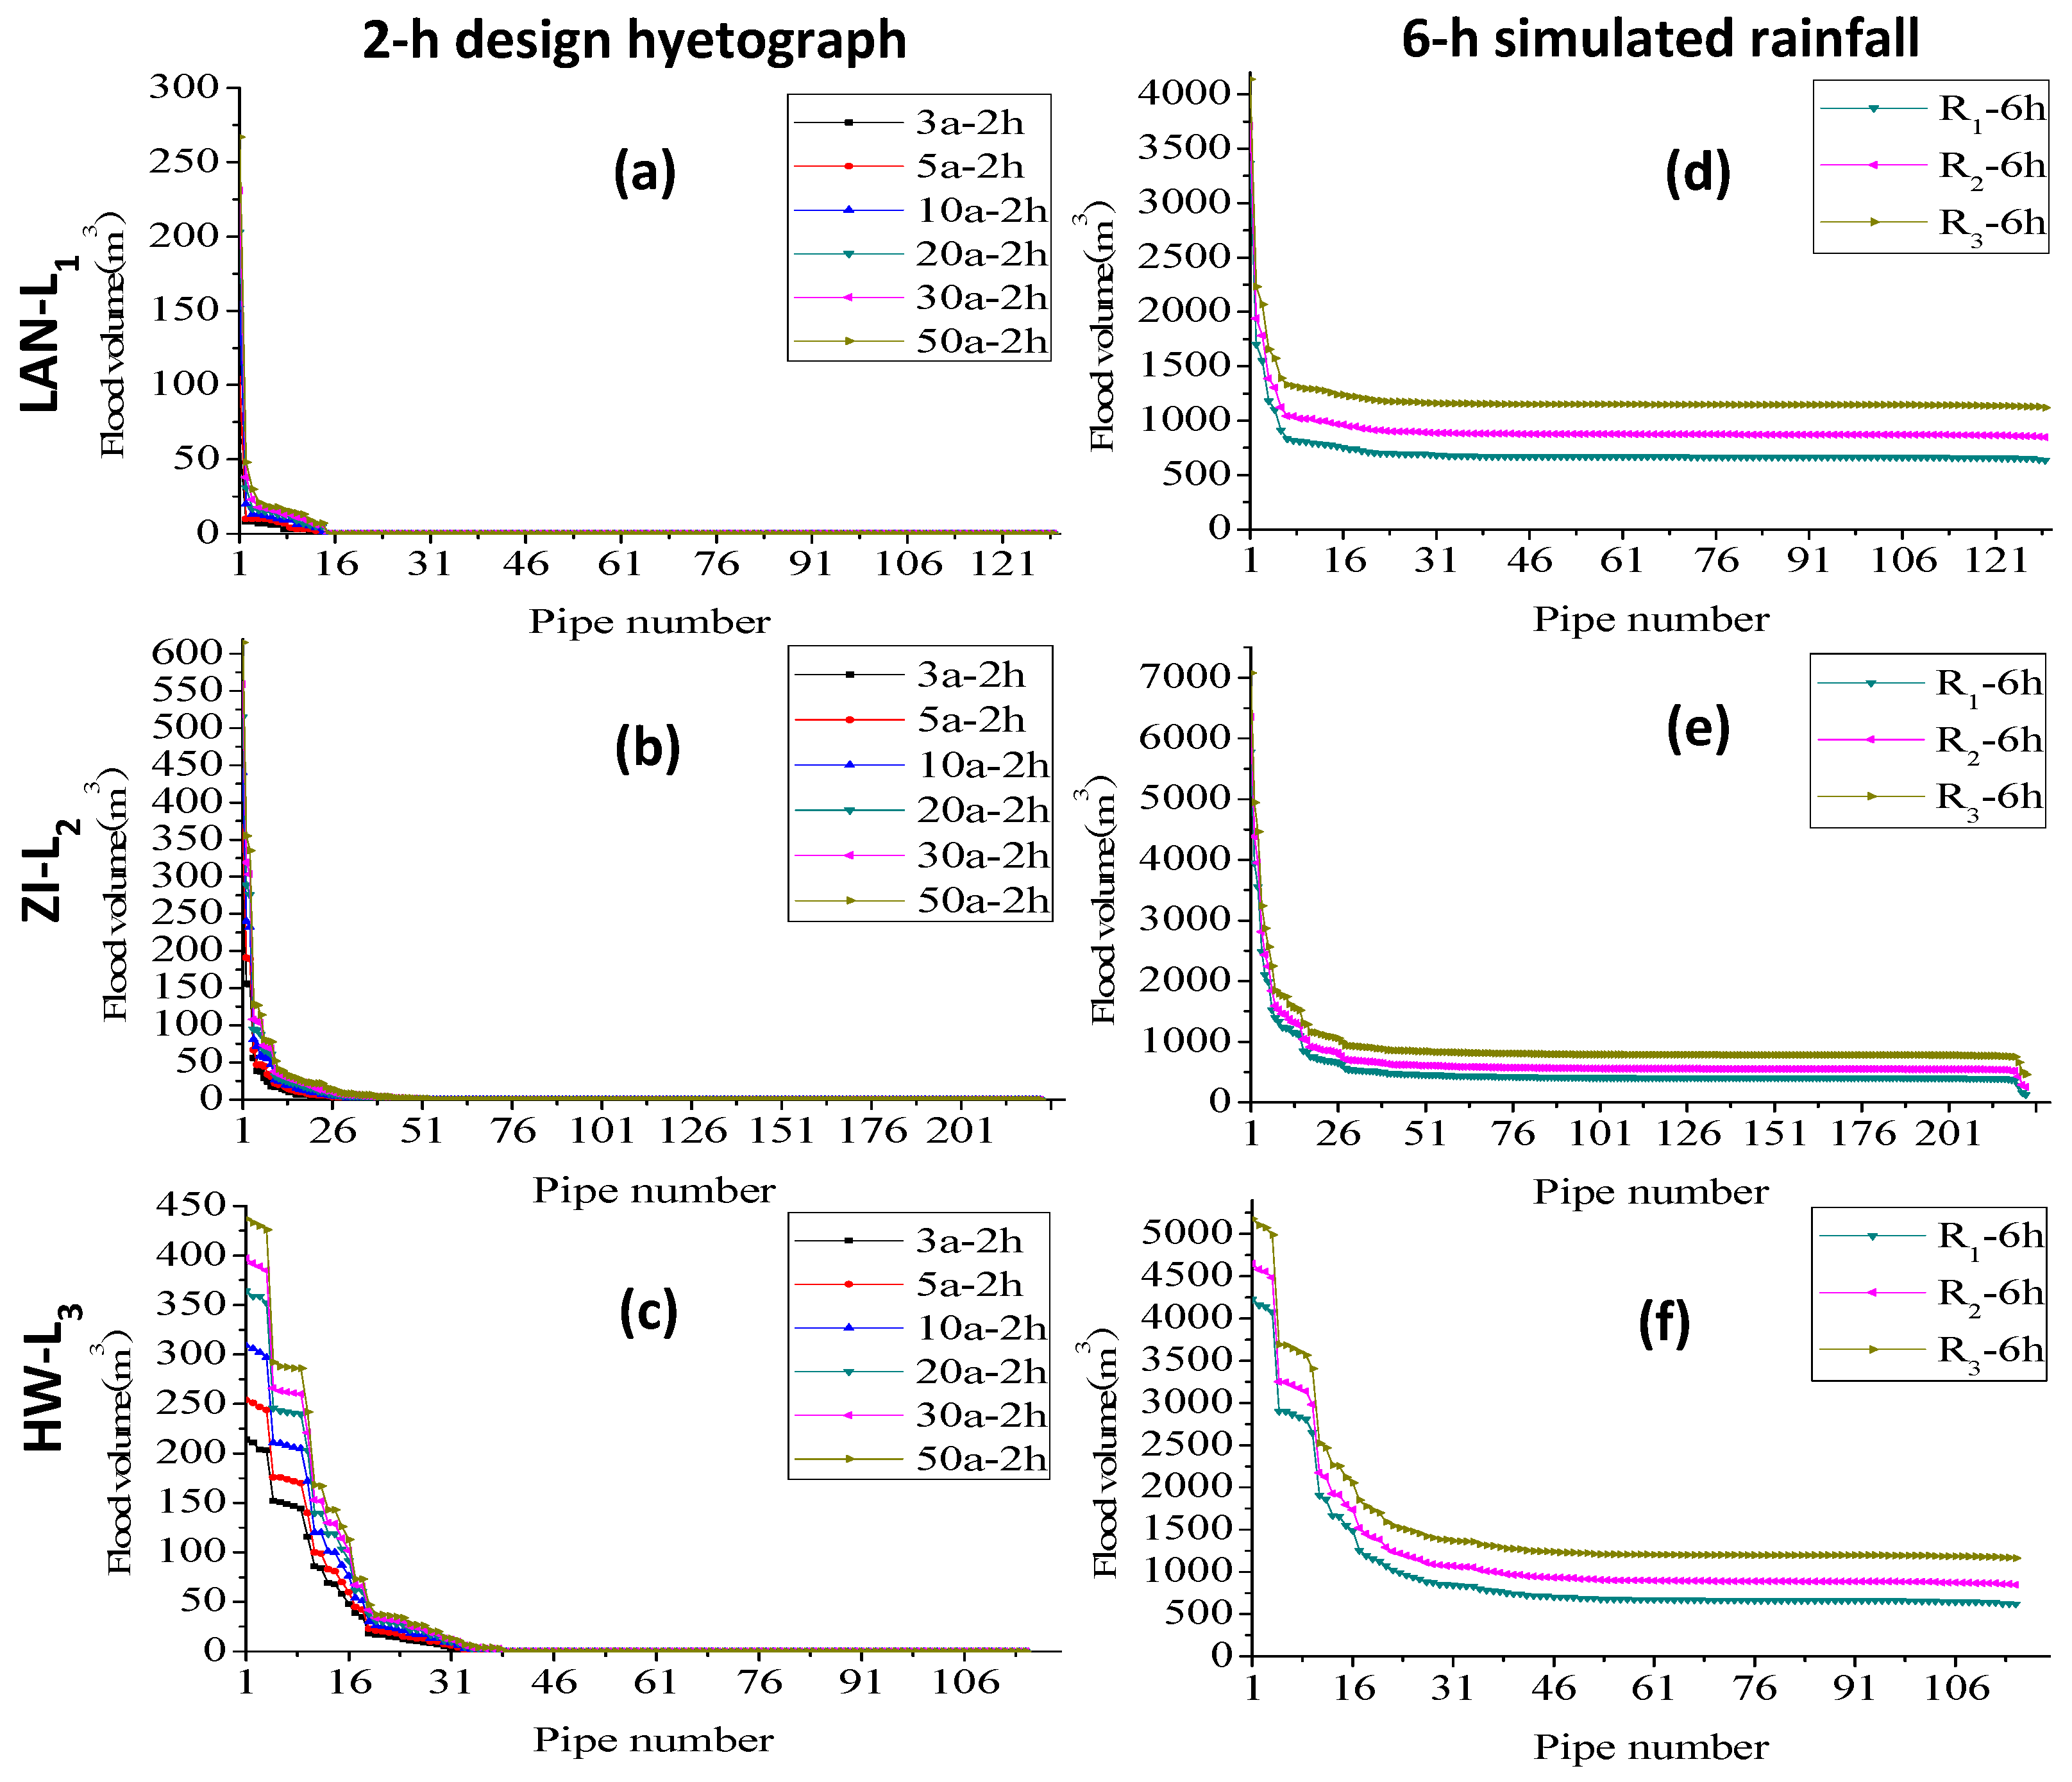
4.1.2. Loop Network Systems

Figure 5a shows the curves of LAN-L1 for the 2-h design hyetographs. With the rainfall of 3a-2h, the flood volume value is reduced quickly along the x-axis. When pipe No. 1 is blocked, it results in the largest flood volume, which implies that this pipe is the most critical hydraulic pipe. Similarly, assuming that a flood volume of 0 m3 is used as the threshold, i.e., no surface flooding, there are 13 critical pipes out of a total number of 129 in the case of rainfall 3a-2h. The proportion of critical hydraulic pipes for LAN-L1 system is only 10.0%. This means that the drainage system is less vulnerable with a small fraction of critical pipes under rainfall 3a-2h. The other curves in Figure 5a follow a similar trend to the curve of 3a-2h. However, the maximum flood volume increases with the increase of rainfall intensity.
Compared to Figure 5a, the flood volume curves of LAN-L1 under the rainfall events of 6-h simulated rainfall profile (i.e., R1-6h, R2-6h, and R3-6h) are shown in Figure 5d. The characteristics of the curves of 6-h simulated rainfall profile are similar to the curves of 2-h design hyetograph. Though the curves become flat at the end of the curves, they are not reduced to zero. Further, the flood volumes are different and relatively larger than those of 2-h design hyetograph because of the strong rainfall intensities.
The other two loop systems, i.e., ZI-L2 and HW-L3, show similar characteristics to LAN-L1, though the flood volume are different under the same rainfall events, due to different catchment areas and other characteristics among the three tree systems.
In summary, the proportion of critical hydraulic pipes is relatively small for loop networks, for example, in 5a-2h rainfall pattern condition, the proportions of critical hydraulic pipes for LAN-L1, ZI-L2, and HW-L3 systems are 10.1%, 17.0% and 31.3%, respectively.

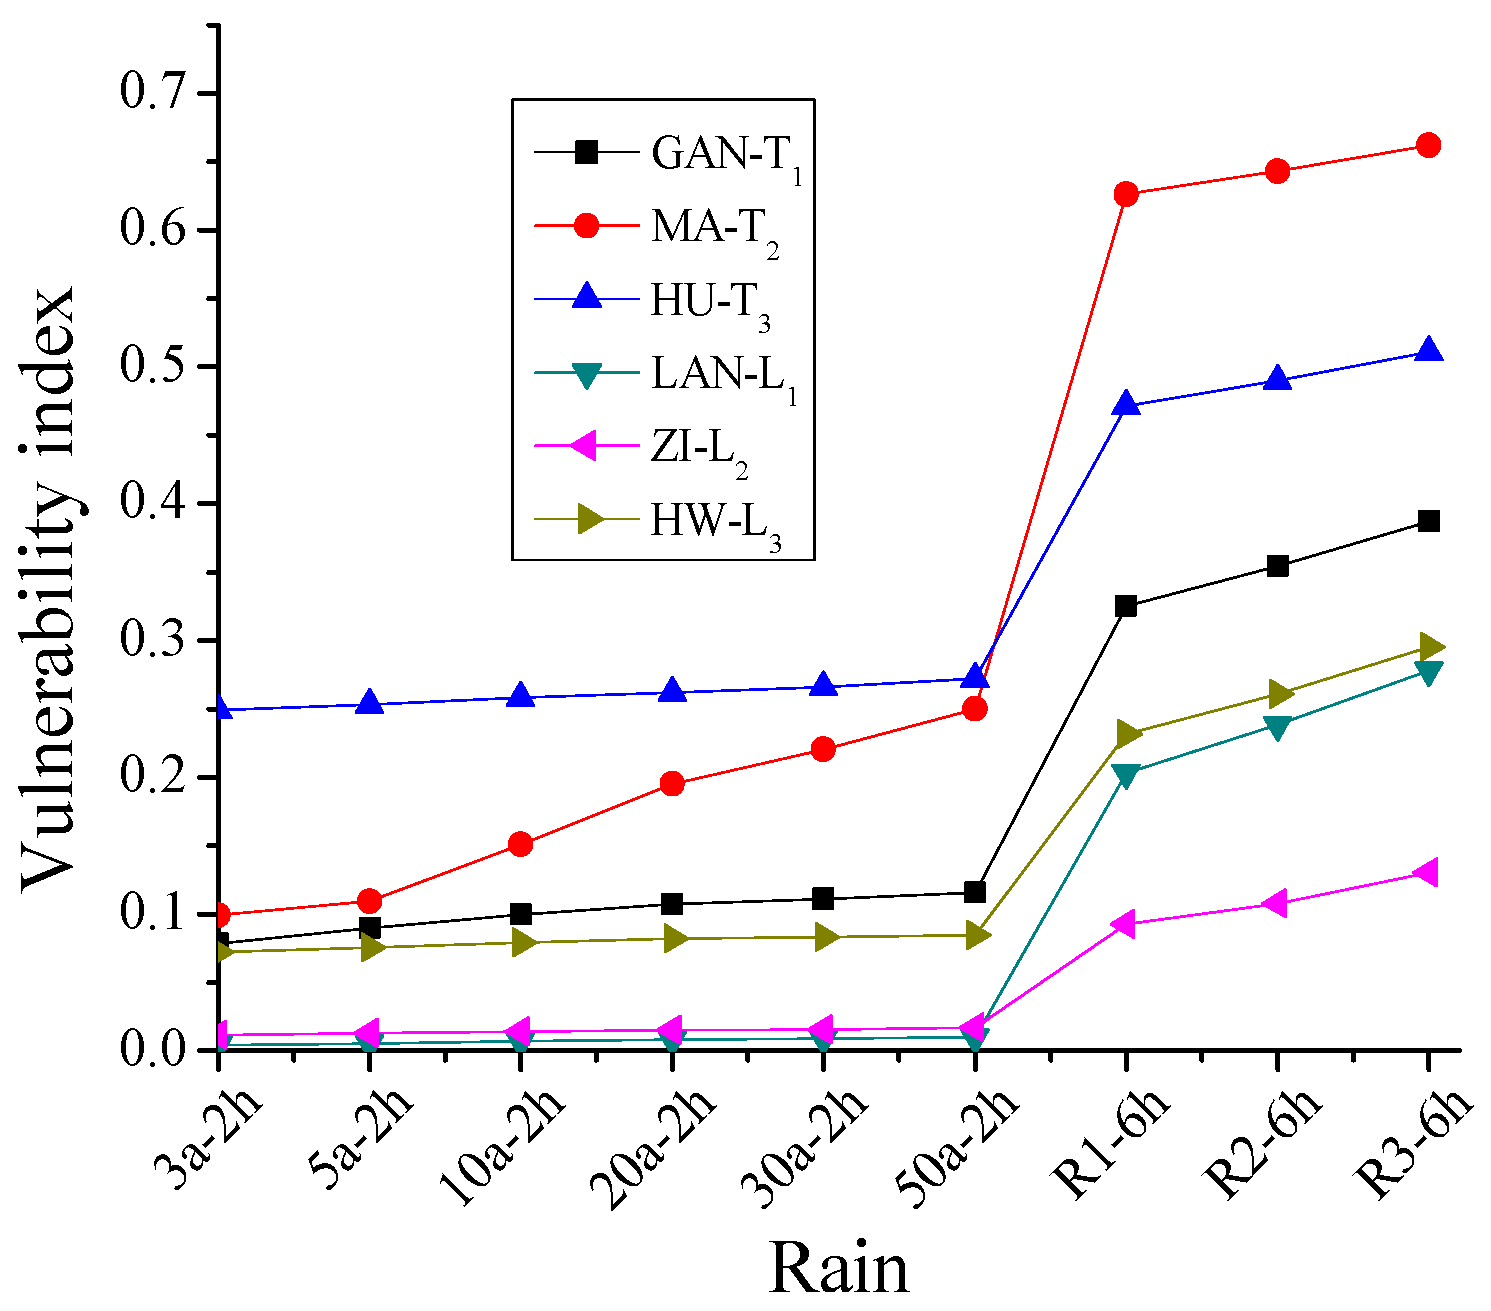
4.1.3. Comparison between Tree and Loop Networks

It can be seen that the tree systems have a relatively larger proportion of the total number of critical hydraulic pipes than the loop systems. According to the runoff of each drainage system under different rainfalls, we can use Equations (2) and (3) to calculate the vulnerability index of the tree and loop drainage systems. The results are shown in Figure 6. The results suggest that the loop systems have a lower vulnerability than the tree systems and tend to be better system stability. This is mainly because of the existence of the loops in the loop systems which increase the system resistance. In the operation of limiting sewer flooding and discharges into a receiving water body, the loop systems tend to resist the system failure to a certain extent. Thus, we can choose the loop systems in the planning and design of drainage systems if the condition permits.

4.2. The Impacts of Adaptation Measures

There are many adaptation measures for the tree drainage systems to reduce flood volume, such as upgrade the tree systems into loop systems by linking some pipes and add tanks to the tree drainage systems. The final adaptation measure should be chosen considering local economic conditions and land cover types. Here, we will analyze the effects of two different adaptation measures. In order to reduce the vulnerability of the tree systems, we can choose the loop systems as the target of the adaptation for the drainage systems if the condition (i.e., land cover types) permits. However, we also investigate the impacts of adaptation measure of adding tanks into the tree drainage systems. A vulnerability index is defined to measure the vulnerability of the drainage systems before and after the implementation of the adaptation measures.

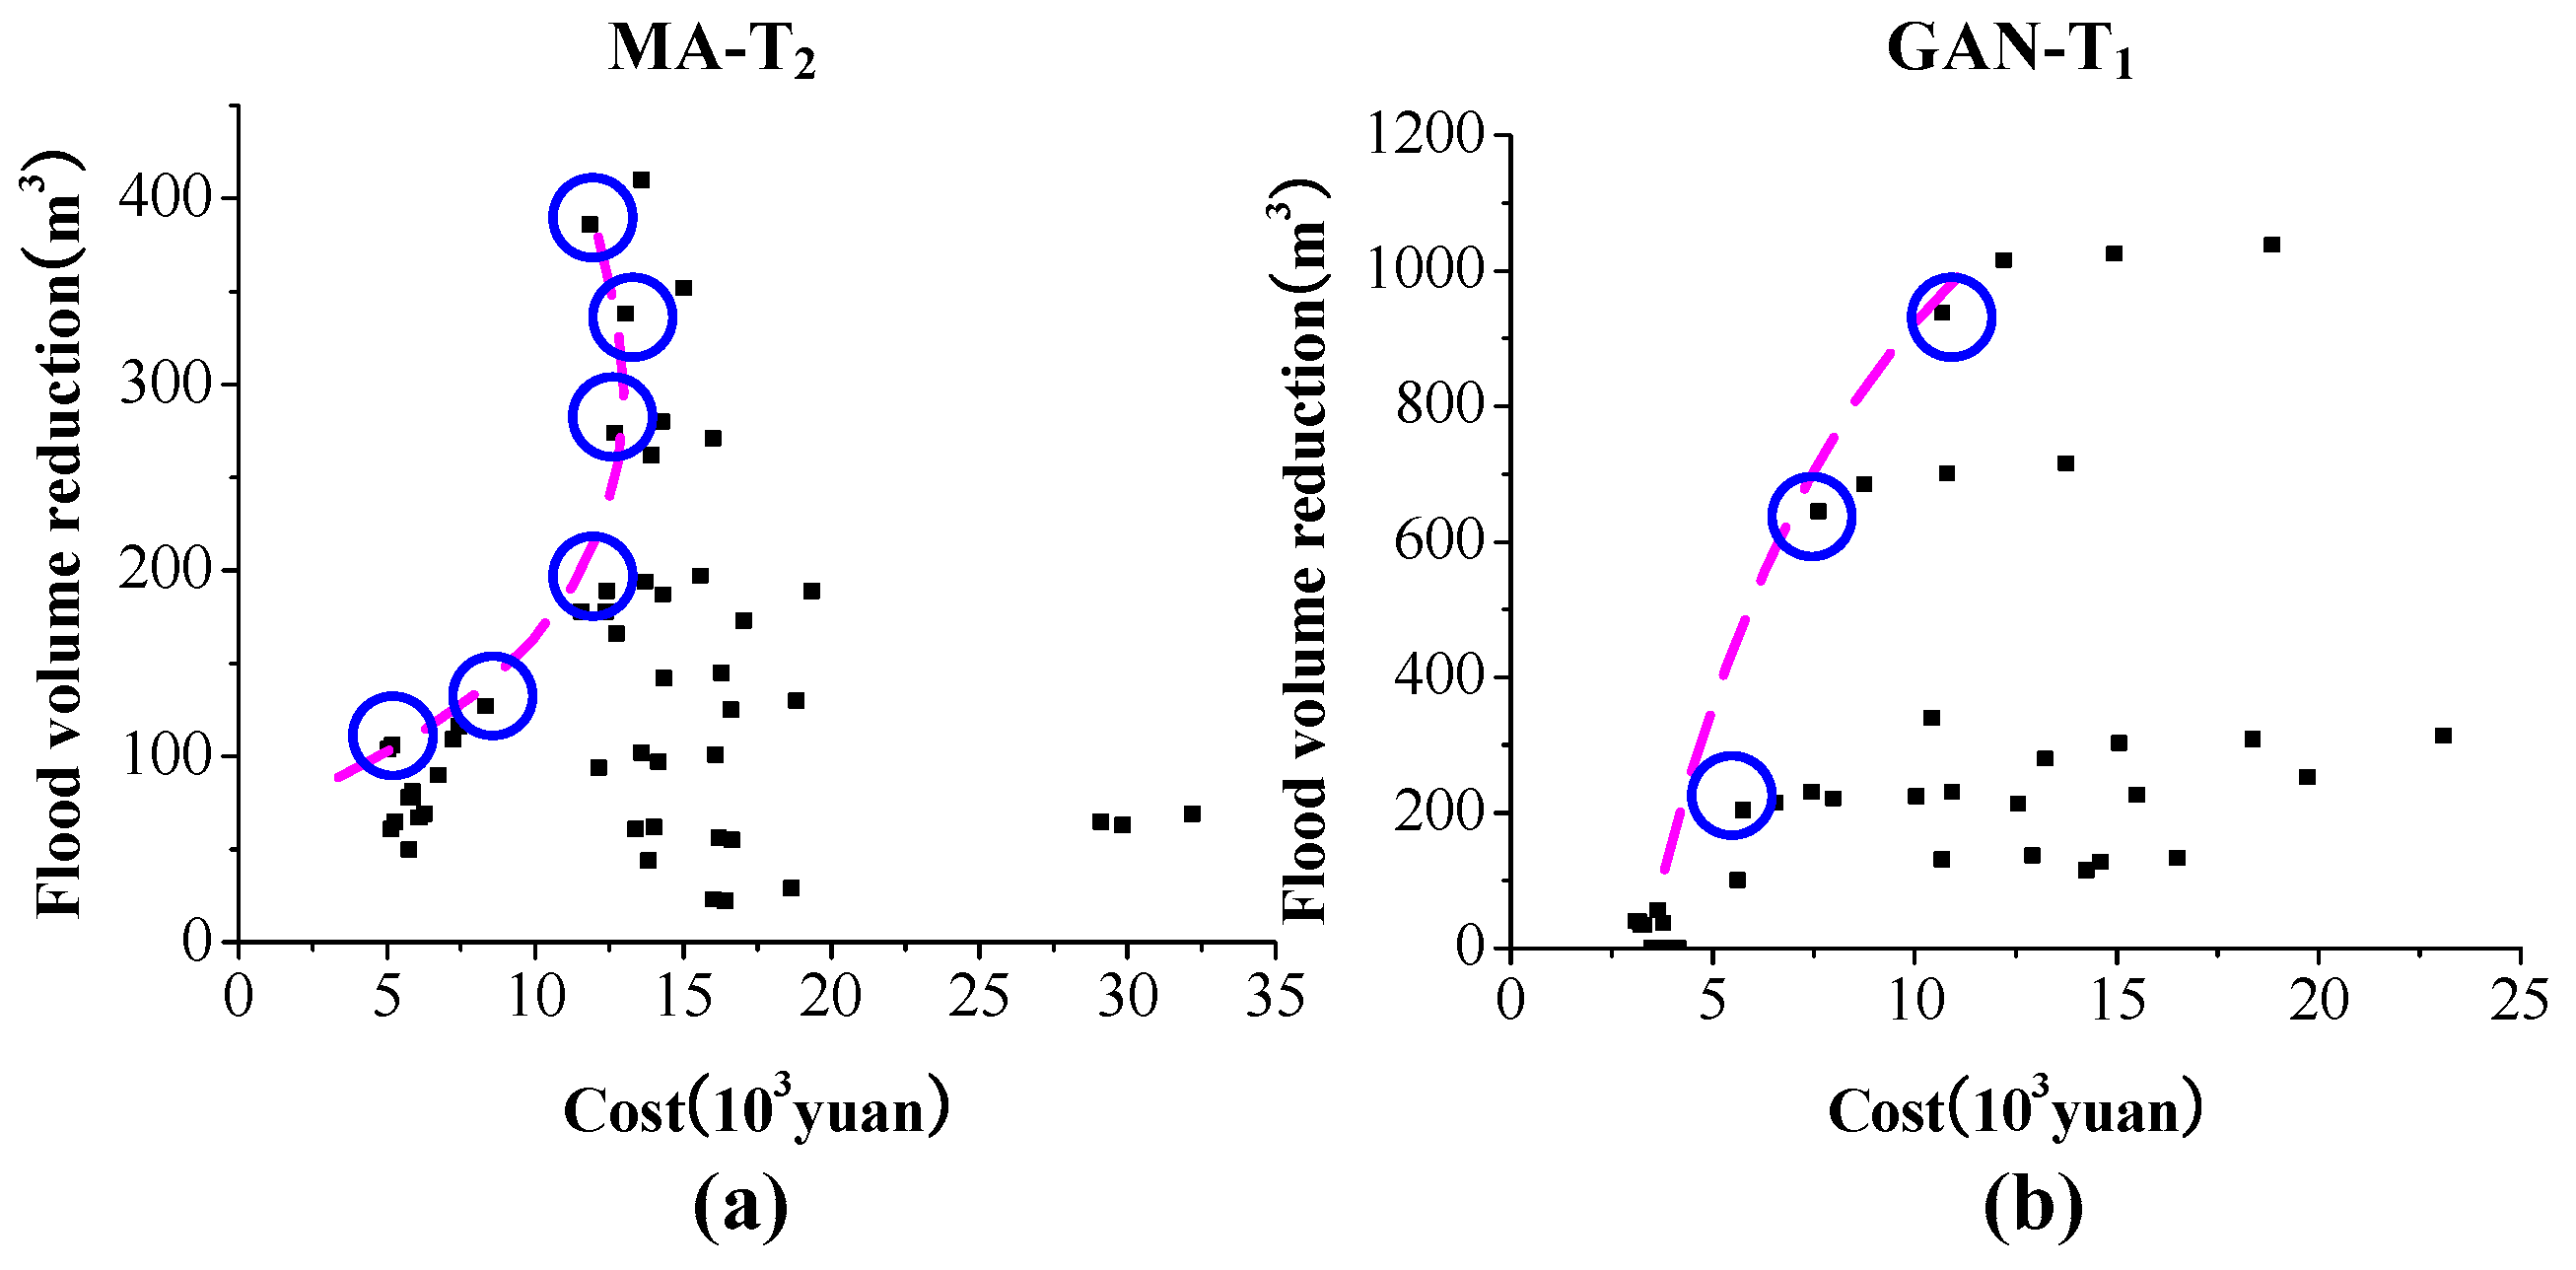
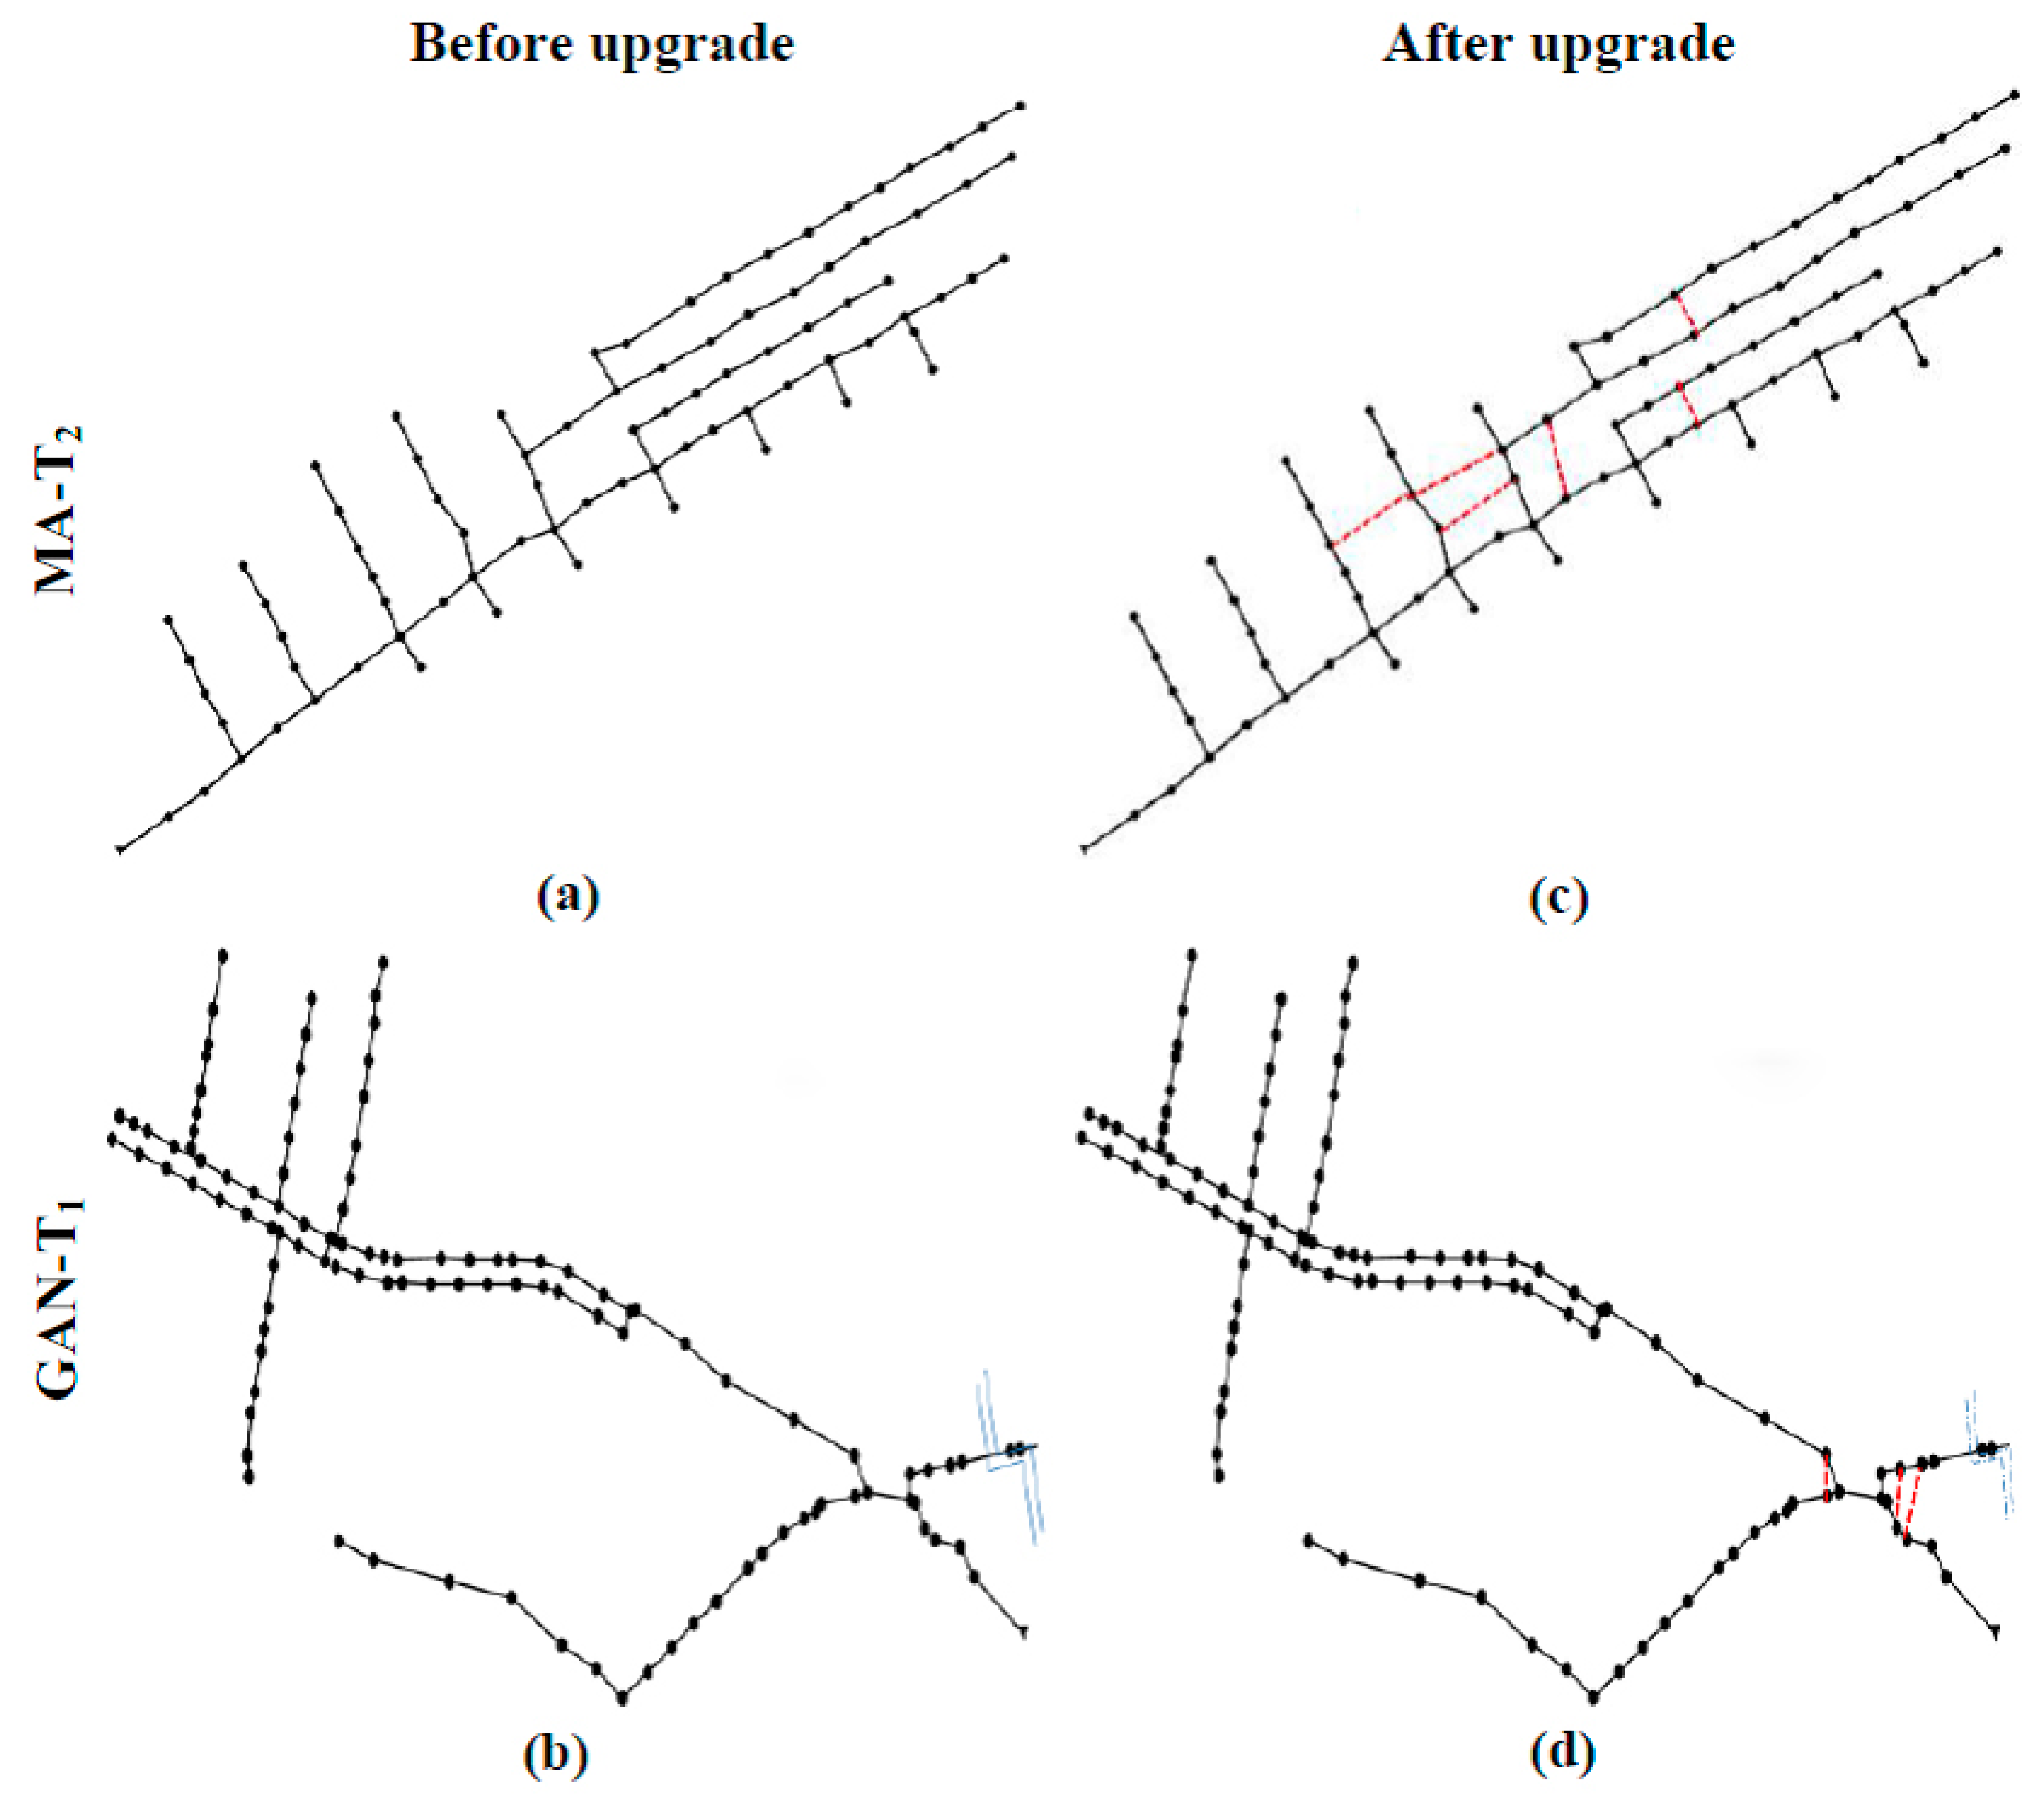
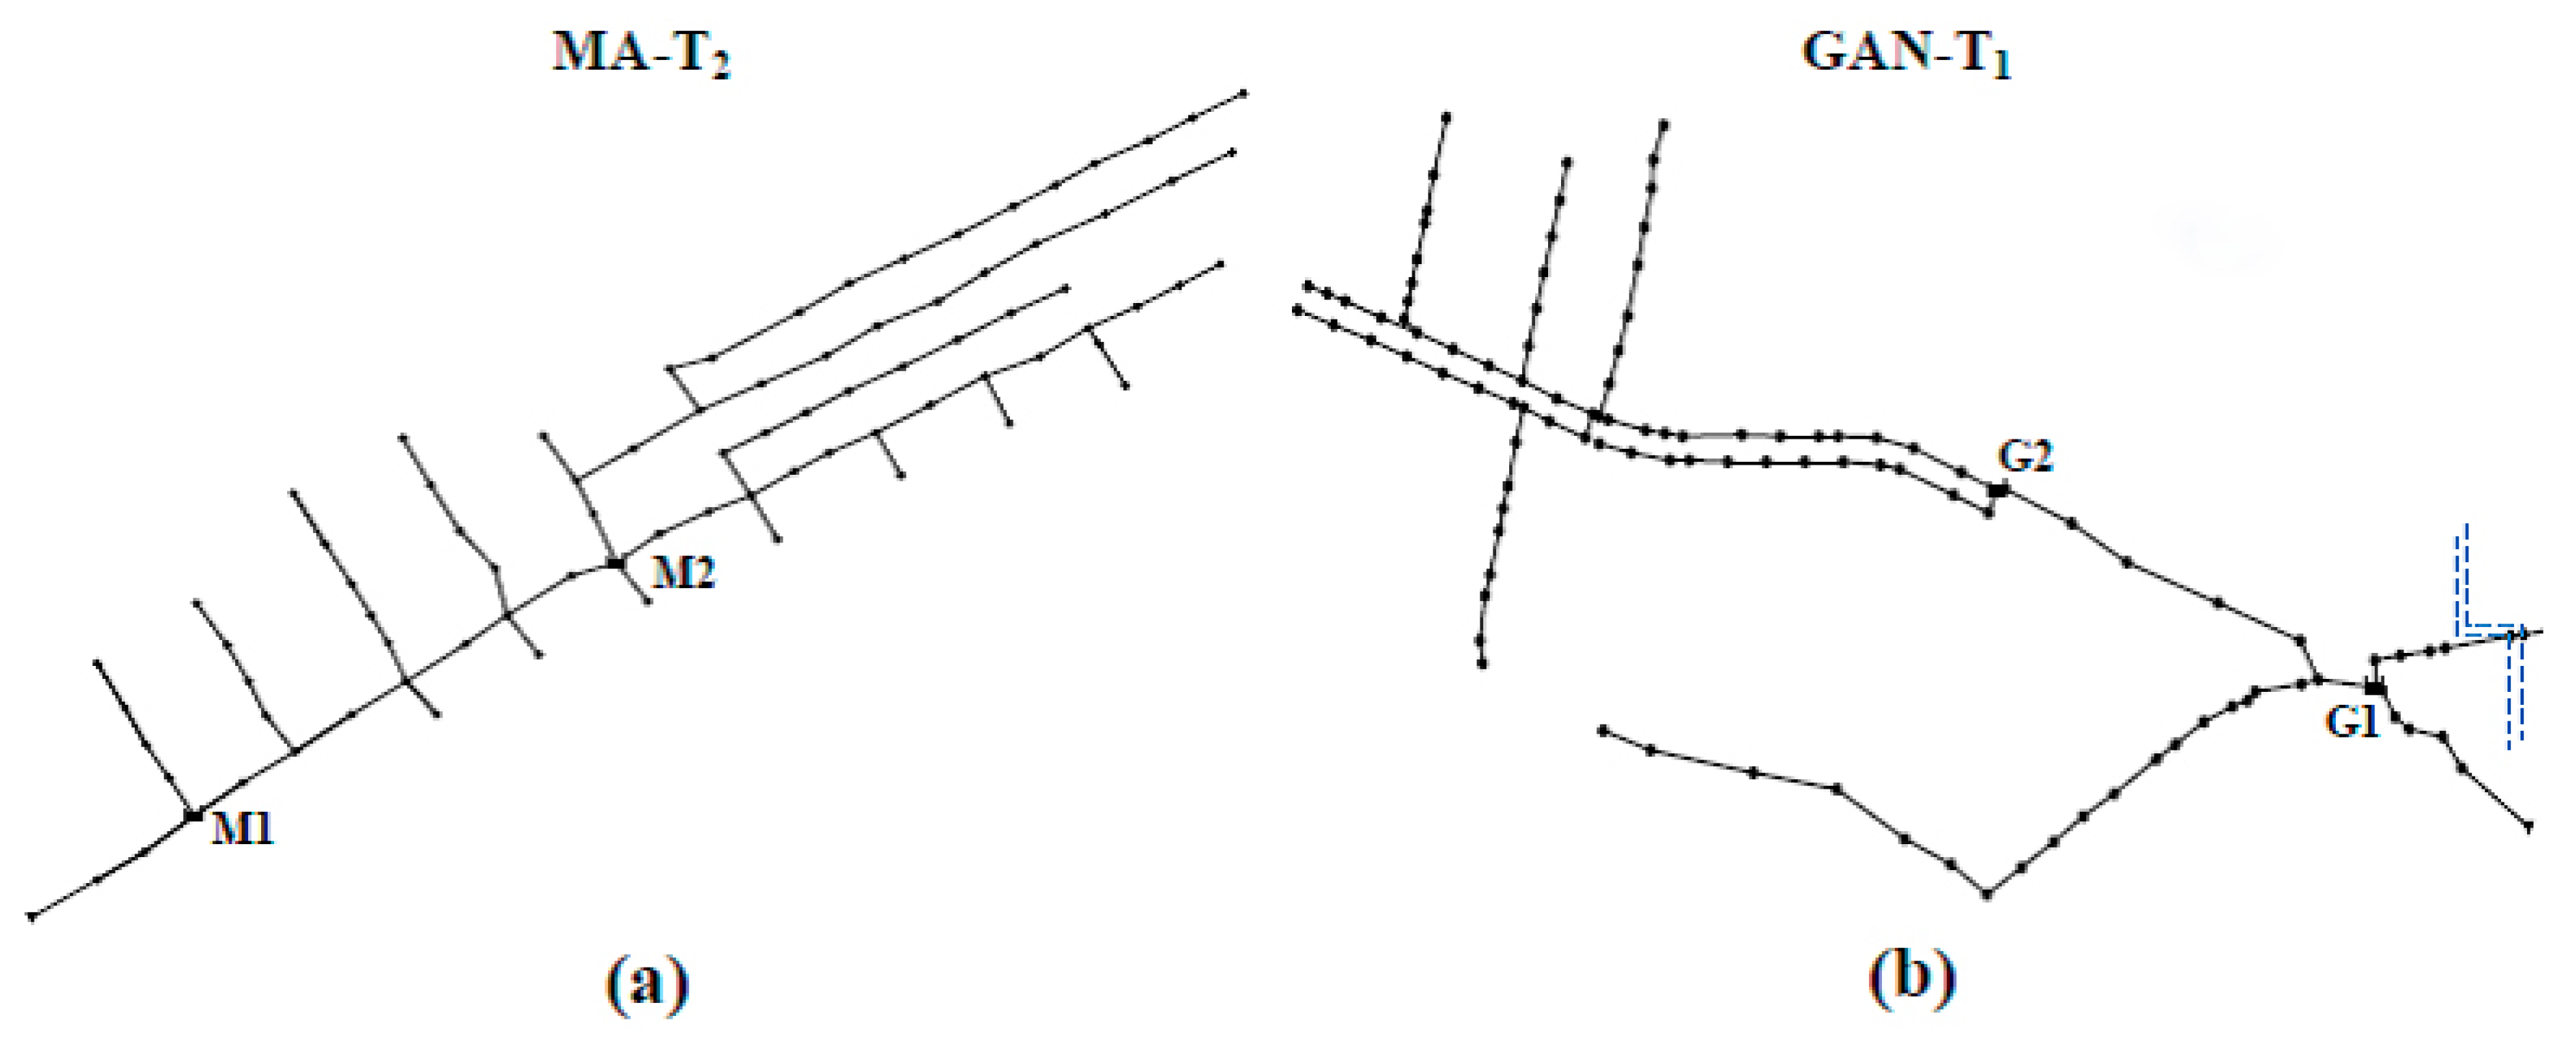
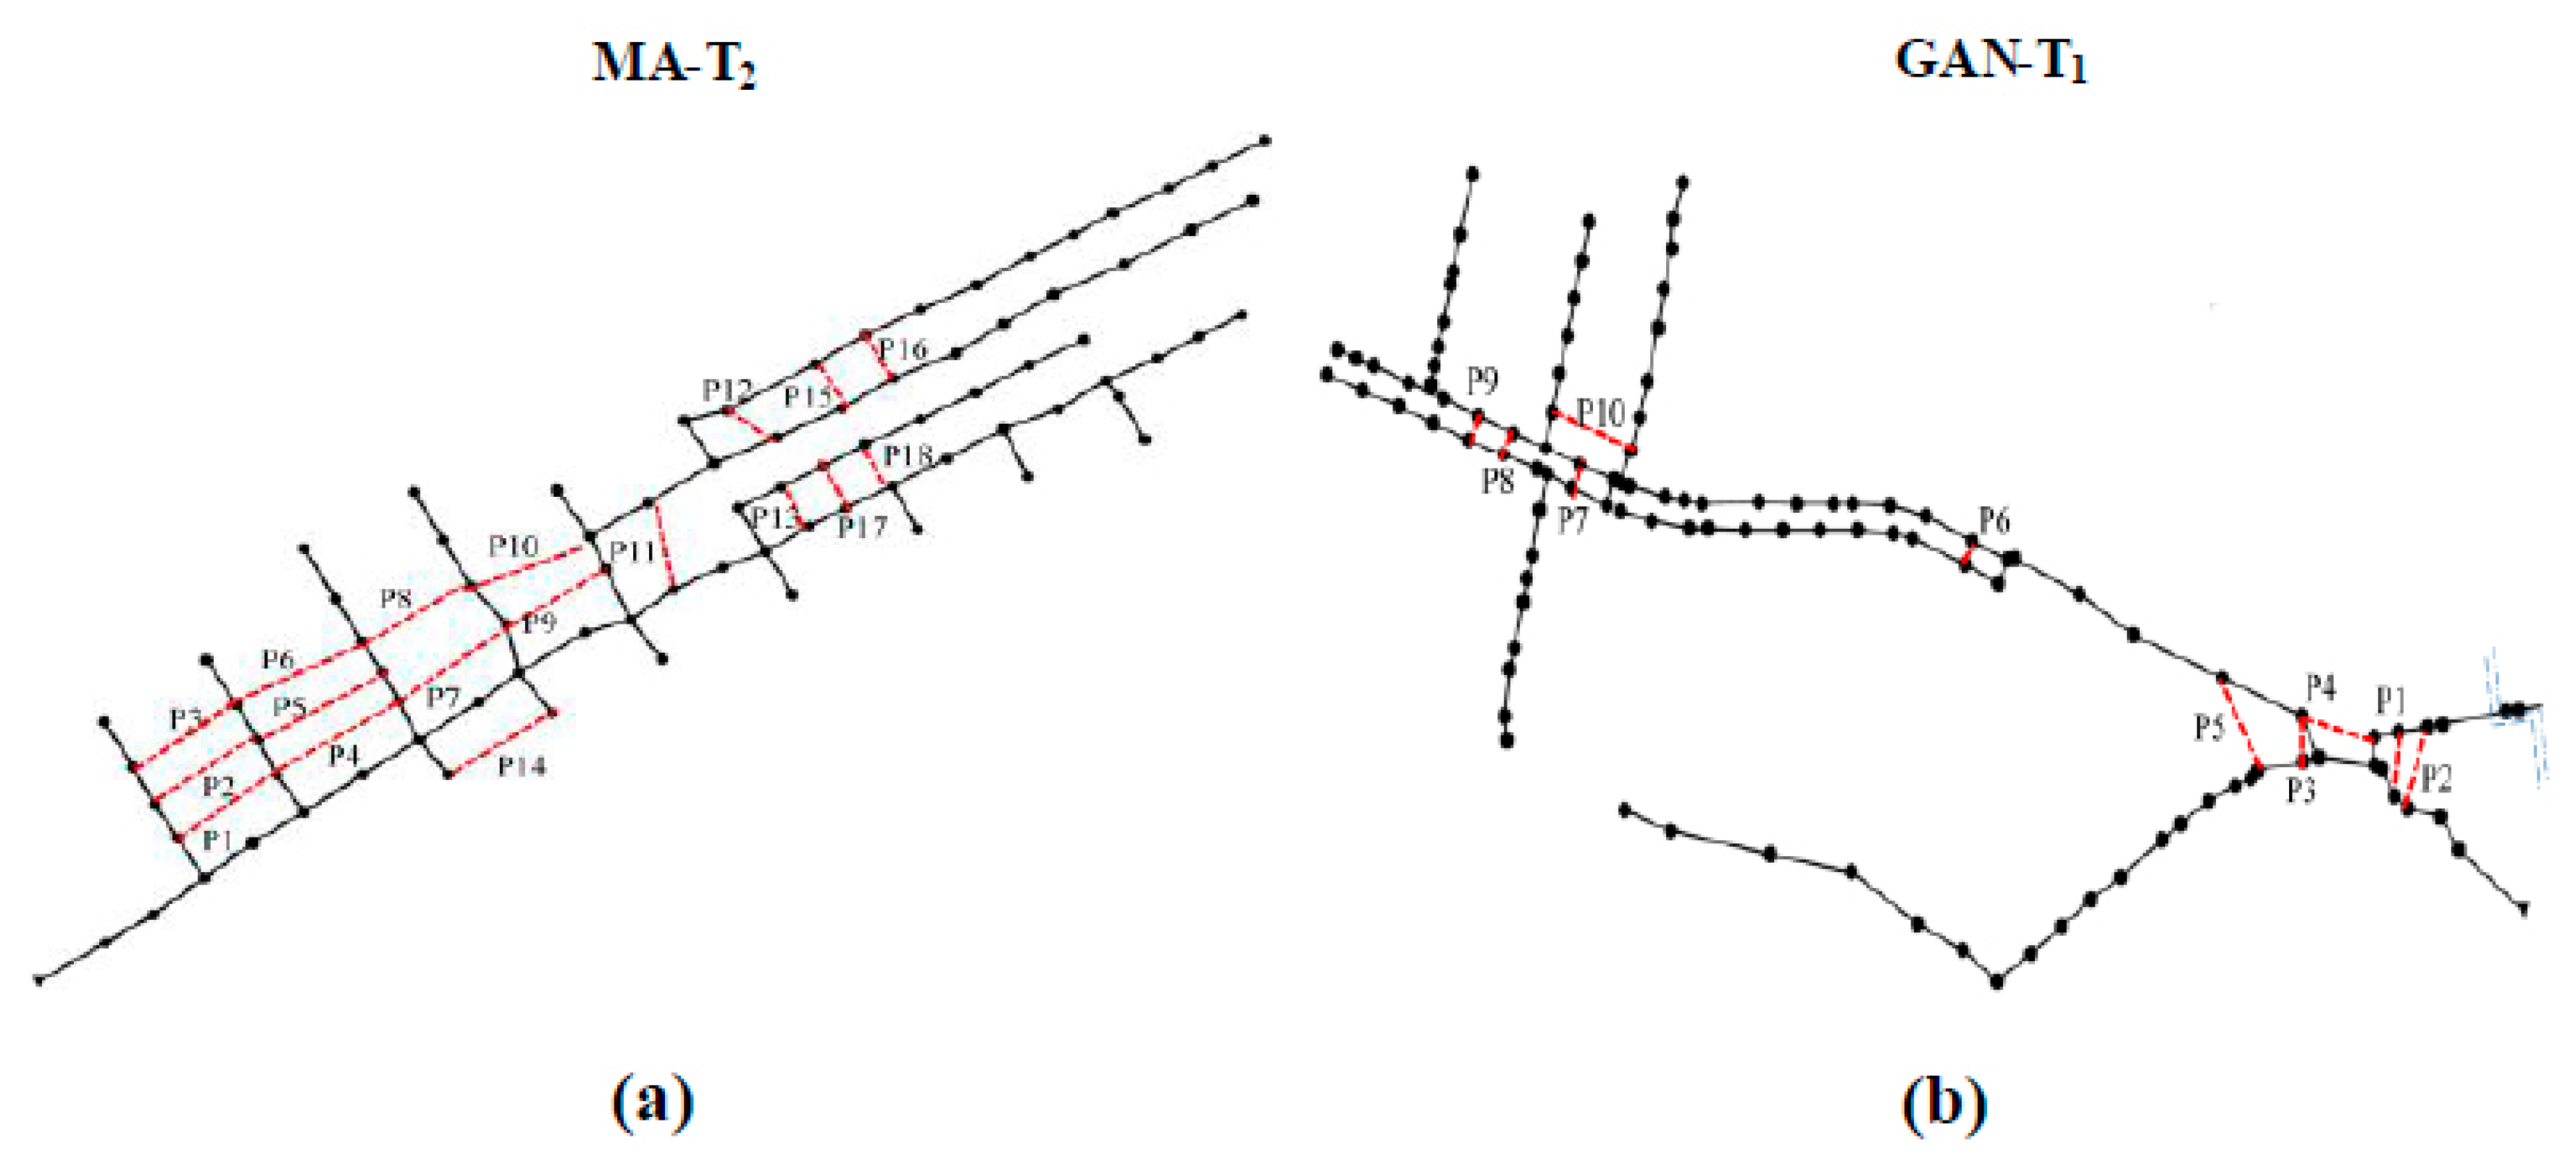
4.2.1. Converting Tree Network Systems into Loop Systems

Based on the results of vulnerability analysis of tree and loop systems, one mitigation measure is considered to upgrade the tree drainage systems into loop systems in order to reduce the vulnerability to pipe blockage. The principle of linking pipes is to use minimum number of pipes to connect the junction node with another nearby to form a loop. To a drainage system, there are many schemes to form one loop by adding one pipe. However, the cost and flood volume reduction of different schemes are vary from each other, so it is necessary to compare and analyze the cost and flood volume reduction of different schemes in order to achieve a group of better choices in the case of total cost allowed. To a tree drainage system, each time, we add one pipe with a particular diameter into the drainage system to form one loop, thus a new drainage system is generated to study the effectiveness of this pipe added to the original drainage system. Then hydrodynamic simulations will be undertaken with the SWMM model under a storm event of 3a-2h to calculate the total flood volume V i (i = 1, …, N) of this new drainage system when pipe p i of this system is blocked. Compared to the V i of the original drainage system, when pipe p i is blocked, we can get the reduction of total flood volume ( V i V i ) before and after the adaptation. For the purpose of evaluating the effectiveness of this adaptation by adding one pipe, the target index i = 1 N ( V i V i ) for evaluating the performance will be used. Meanwhile, the cost for adding this pipe is calculated with Equation (4). Possible schemes for the adaptation of the tree drainage systems are generated, and for each scheme, these two quantitative indicators are calculated.
In this study, MA-T2 and GAN-T1 are upgraded into loop systems by linking some pipes. One pipe each time will be chosen to generate a scheme. To the MA-T2 system, for example, pipe P1 with a diameter of 100 mm is added into the system, thus a new scheme is generated. By changing the location or diameter of the pipe, as shown in Figure 7a, in total, 51 schemes are generated by adding a pipe into this drainage system each time; that is, 15 pipes each with diameters of 100 mm, 200 mm, and 300 mm and three pipes each with diameters of 100 mm and 200 mm. As to the GAN-T1 system, as shown in Figure 7b, 40 schemes are generated by five pipes each with diameters of 100 mm, 200 mm, 300 mm, 400 mm, and 500 mm, and five pipes each with diameters of 100 mm, 200 mm, and 300 mm. After the hydrodynamic simulation for each scheme under a storm event of 3a-2h, these two quantitative indicators are calculated for each scheme. The relation between i = 1 N ( V i V i ) and cost of each scheme for MA-T2 and GAN-T1 are shown in Figure 8.
In Figure 8, the x-axis shows the cost and the y-axis shows the total flood volume reduction ( i = 1 N ( V i V i ) ). The results clearly show that by properly adding a pipe to form a loop for the original tree drainage system, significant flood volume reductions could be realized. It can be seen that different schemes lead to much difference on the two indicators. Then, a boundary line can be made for the system, and the schemes near the line are relatively better, so these schemes will be the priority selections. For example, suppose the total cost for the adaptation of MA-T2 and GAN-T1 system allow maximum of 65,000 Yuan and 25,000 Yuan, respectively. Then, six pipes are selected and added into the MA-T2 drainage system, as shown in the Figure 9c and the total cost for these six pipes is 63,532 Yuan. Similarly, three pipes for the GAN-T1 system are added into the GAN-T1 tree system to form a loop system, as Figure 9d shows, and the total cost is 24,051 Yuan. Flood volume of the new systems is calculated when each individual pipe is assumed to be blocked in different rainfall events using SWMM.

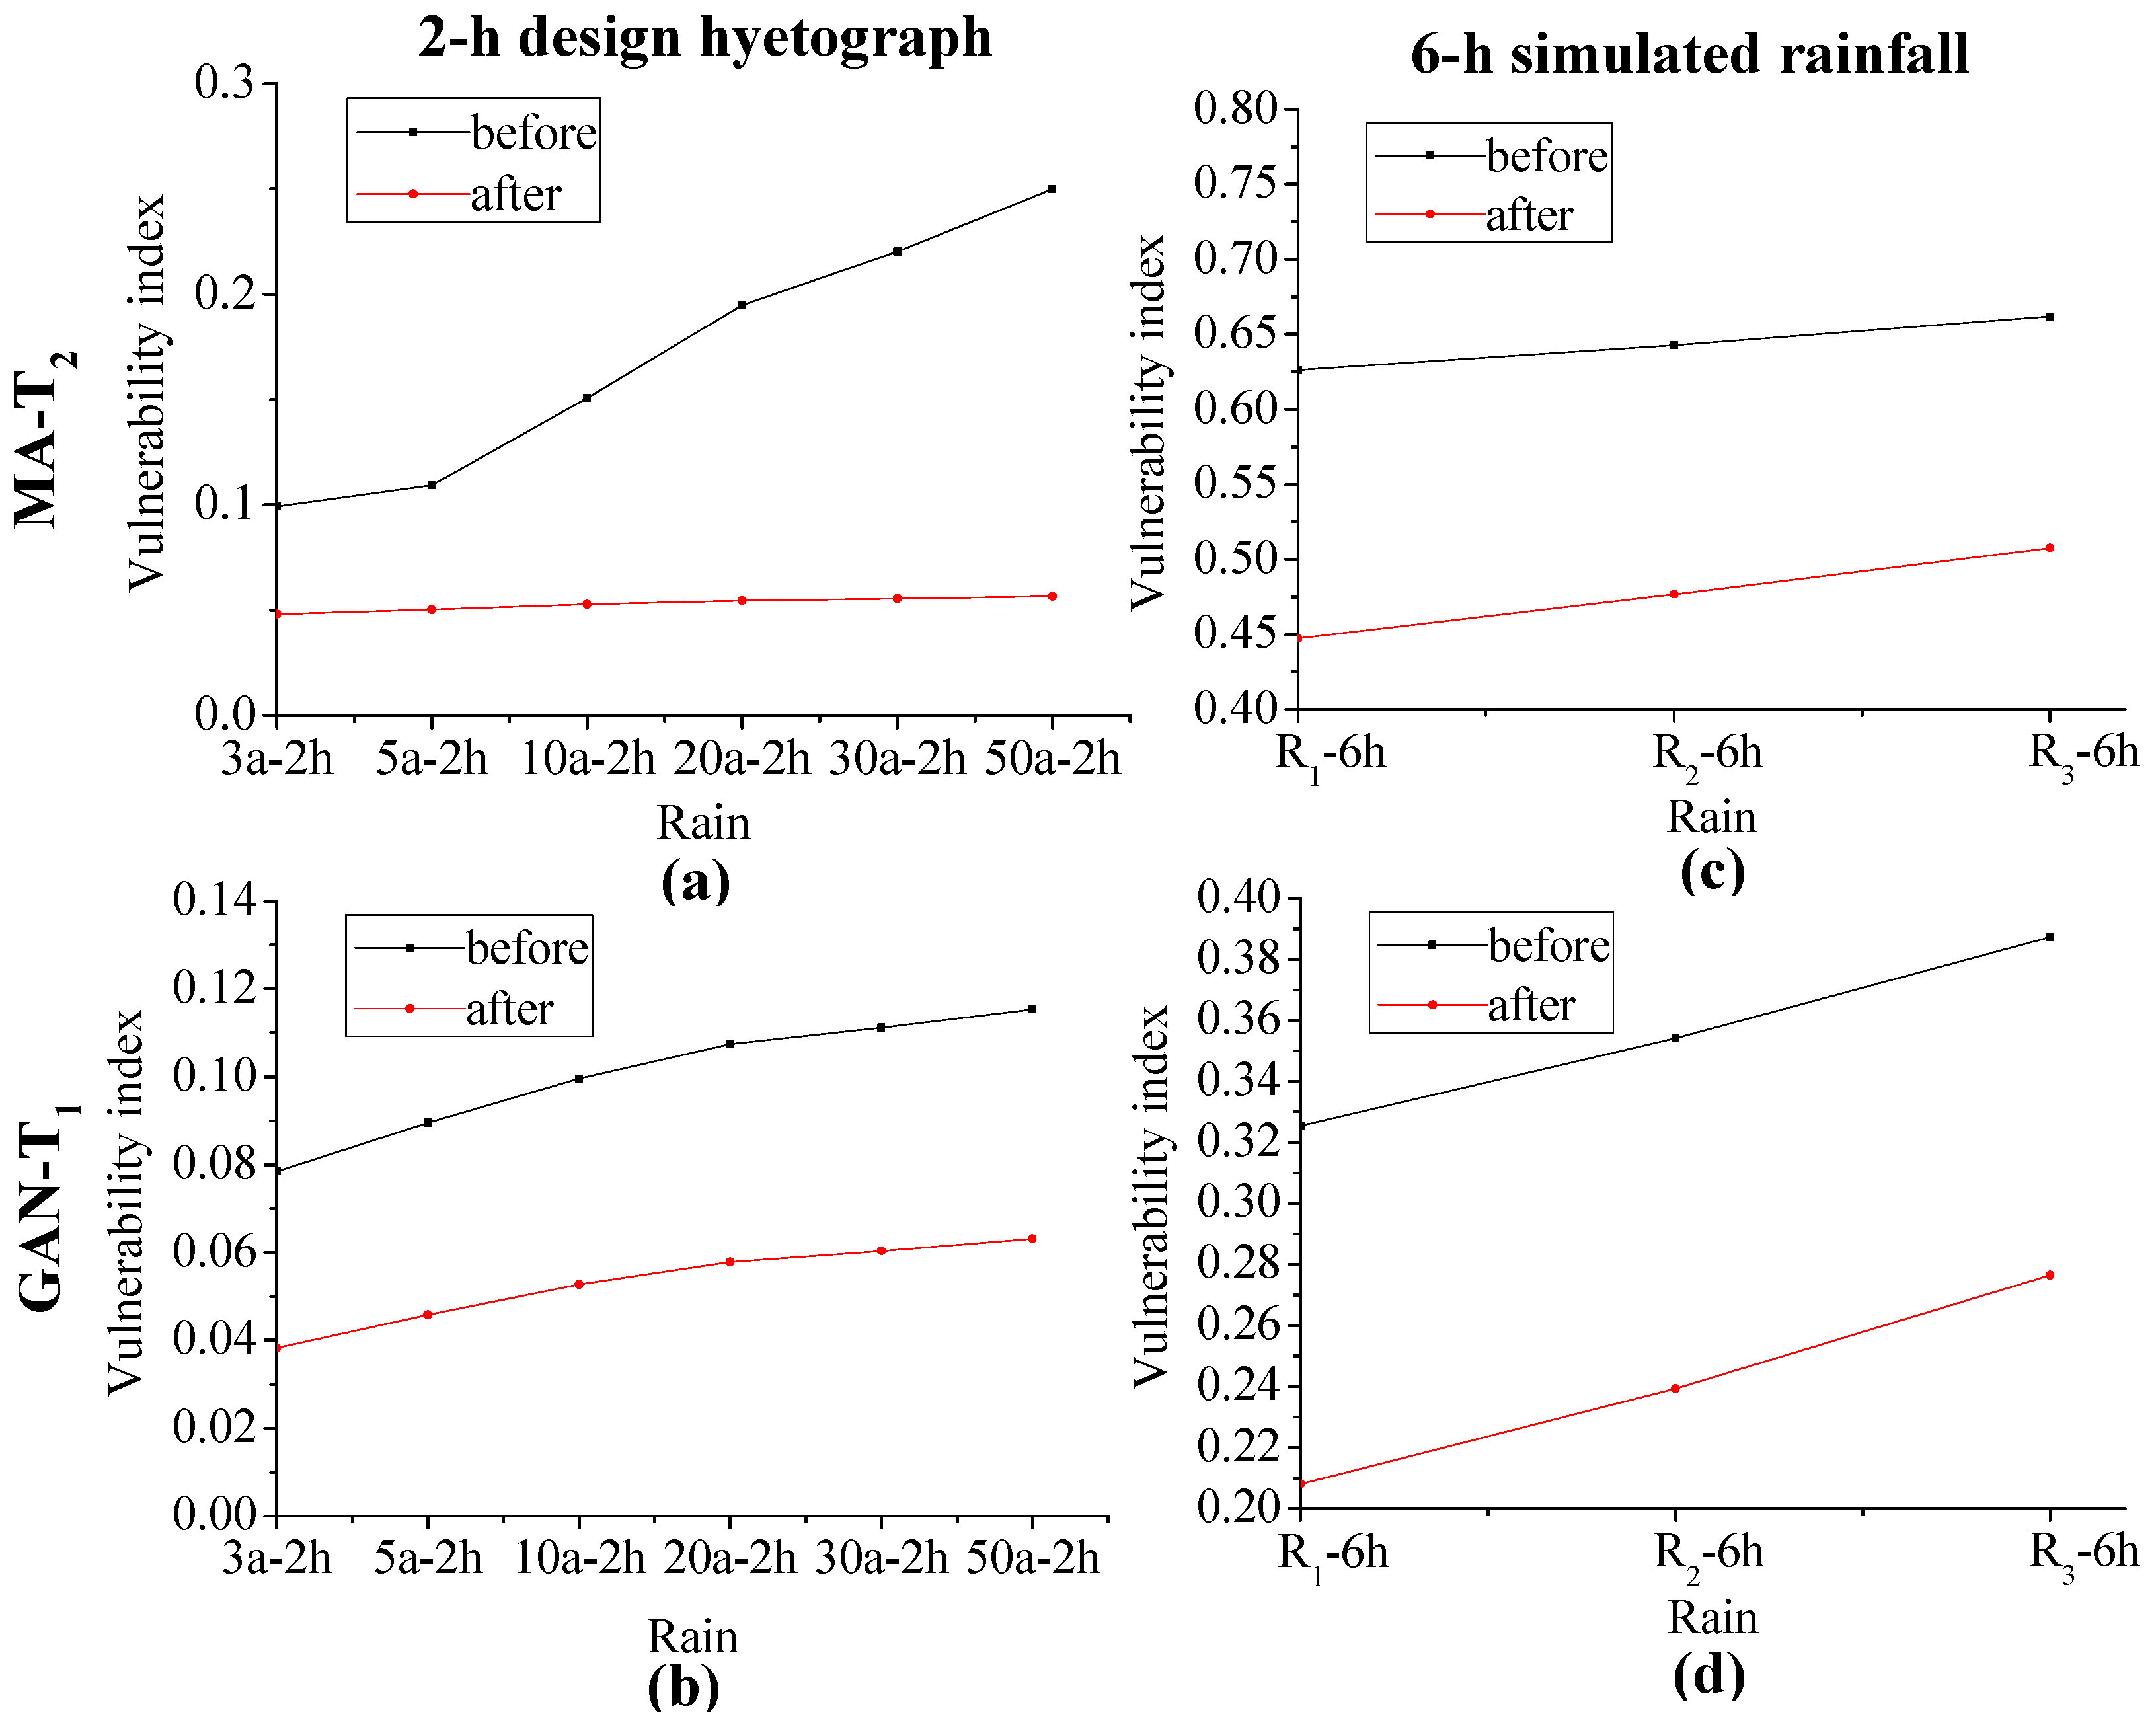
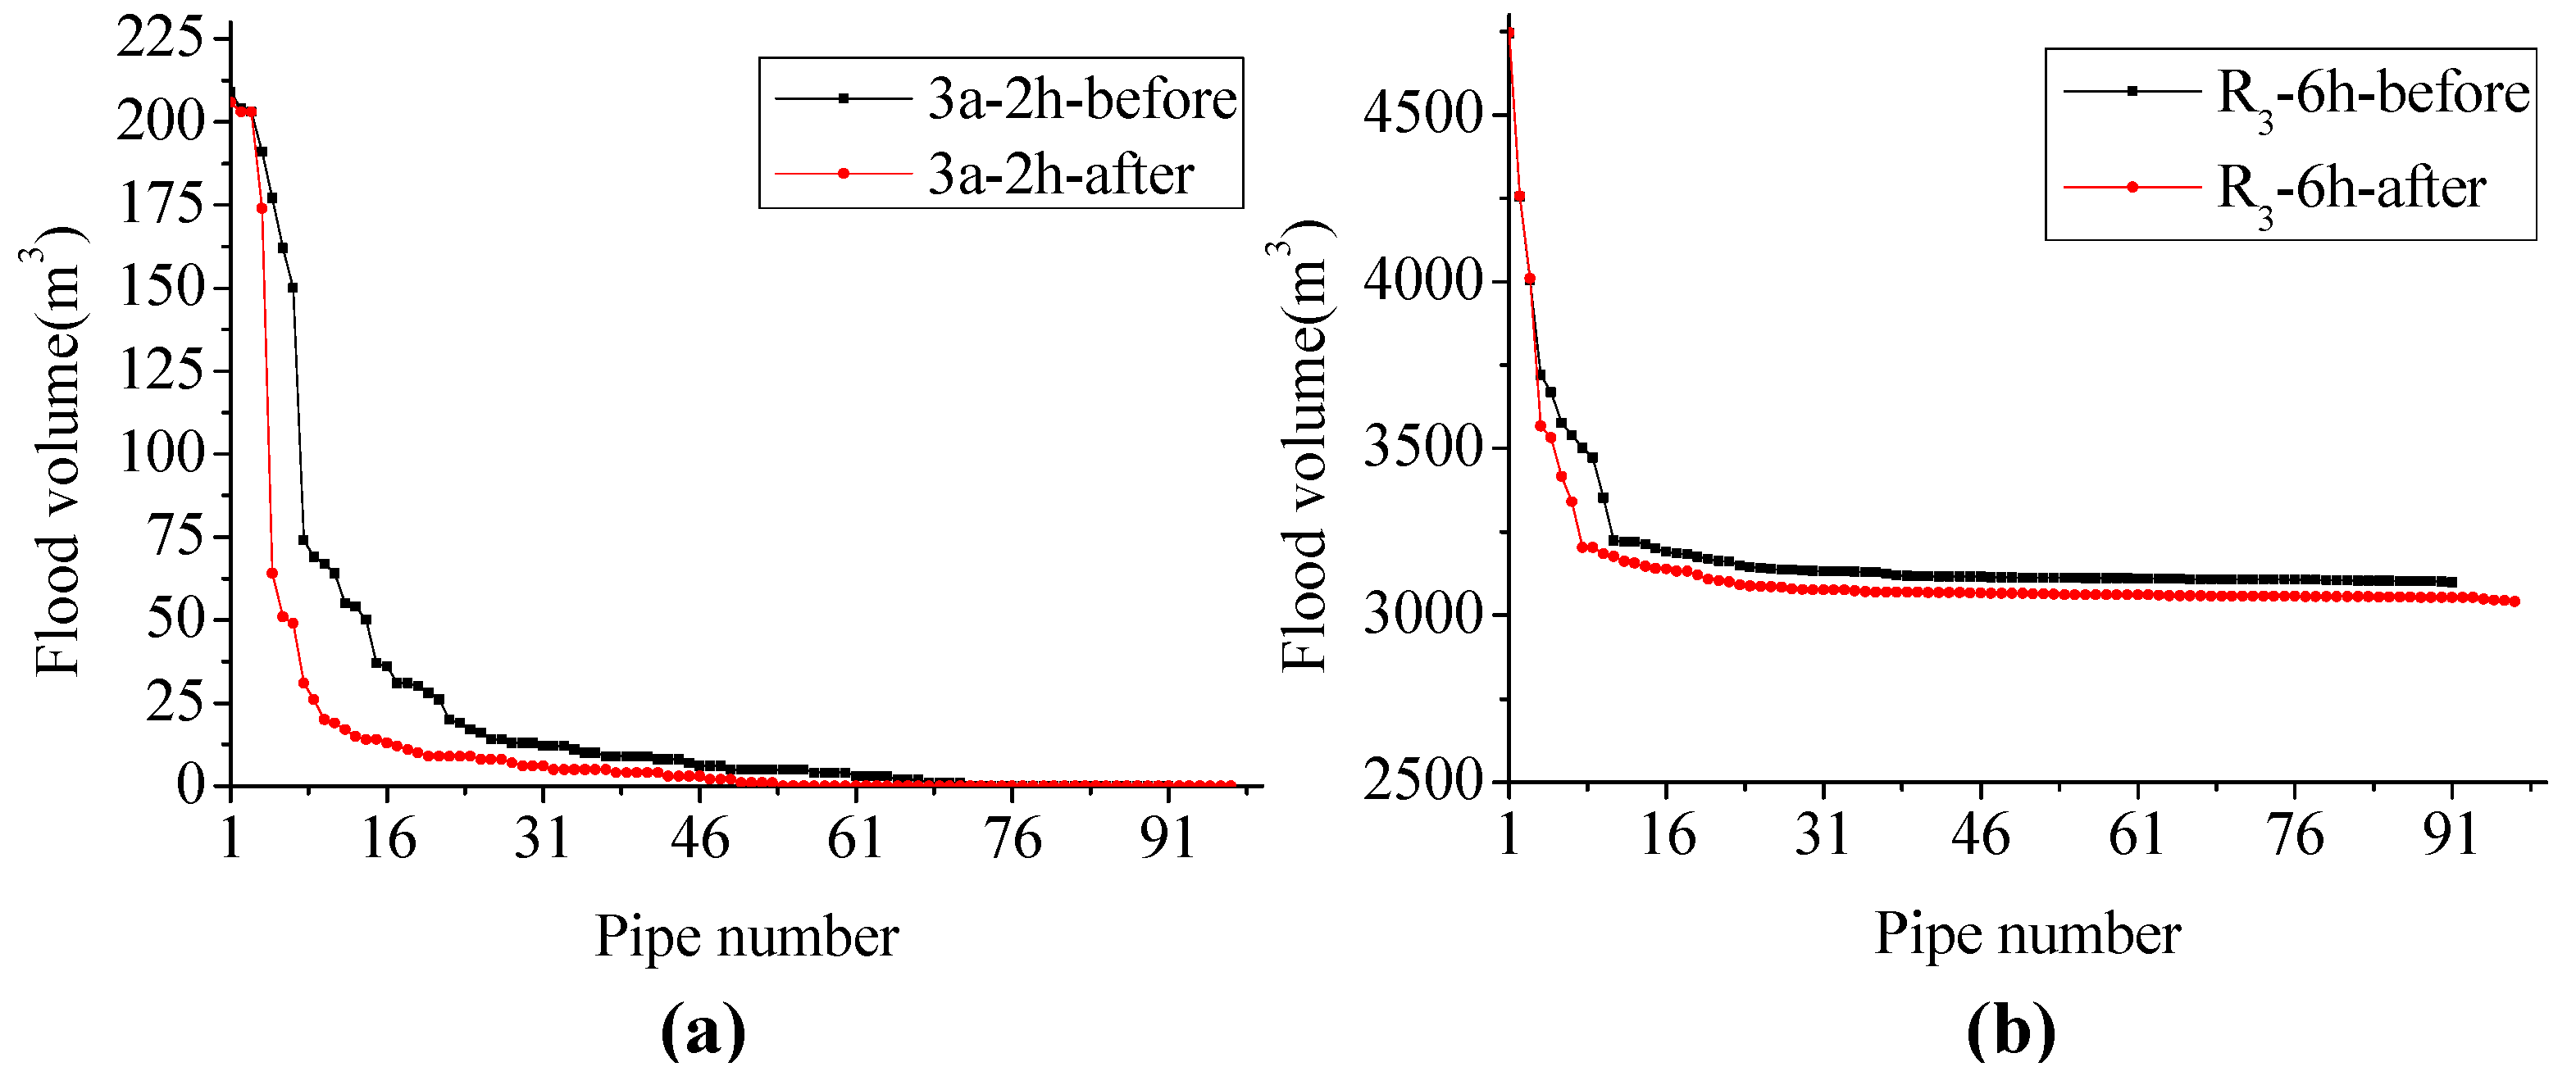
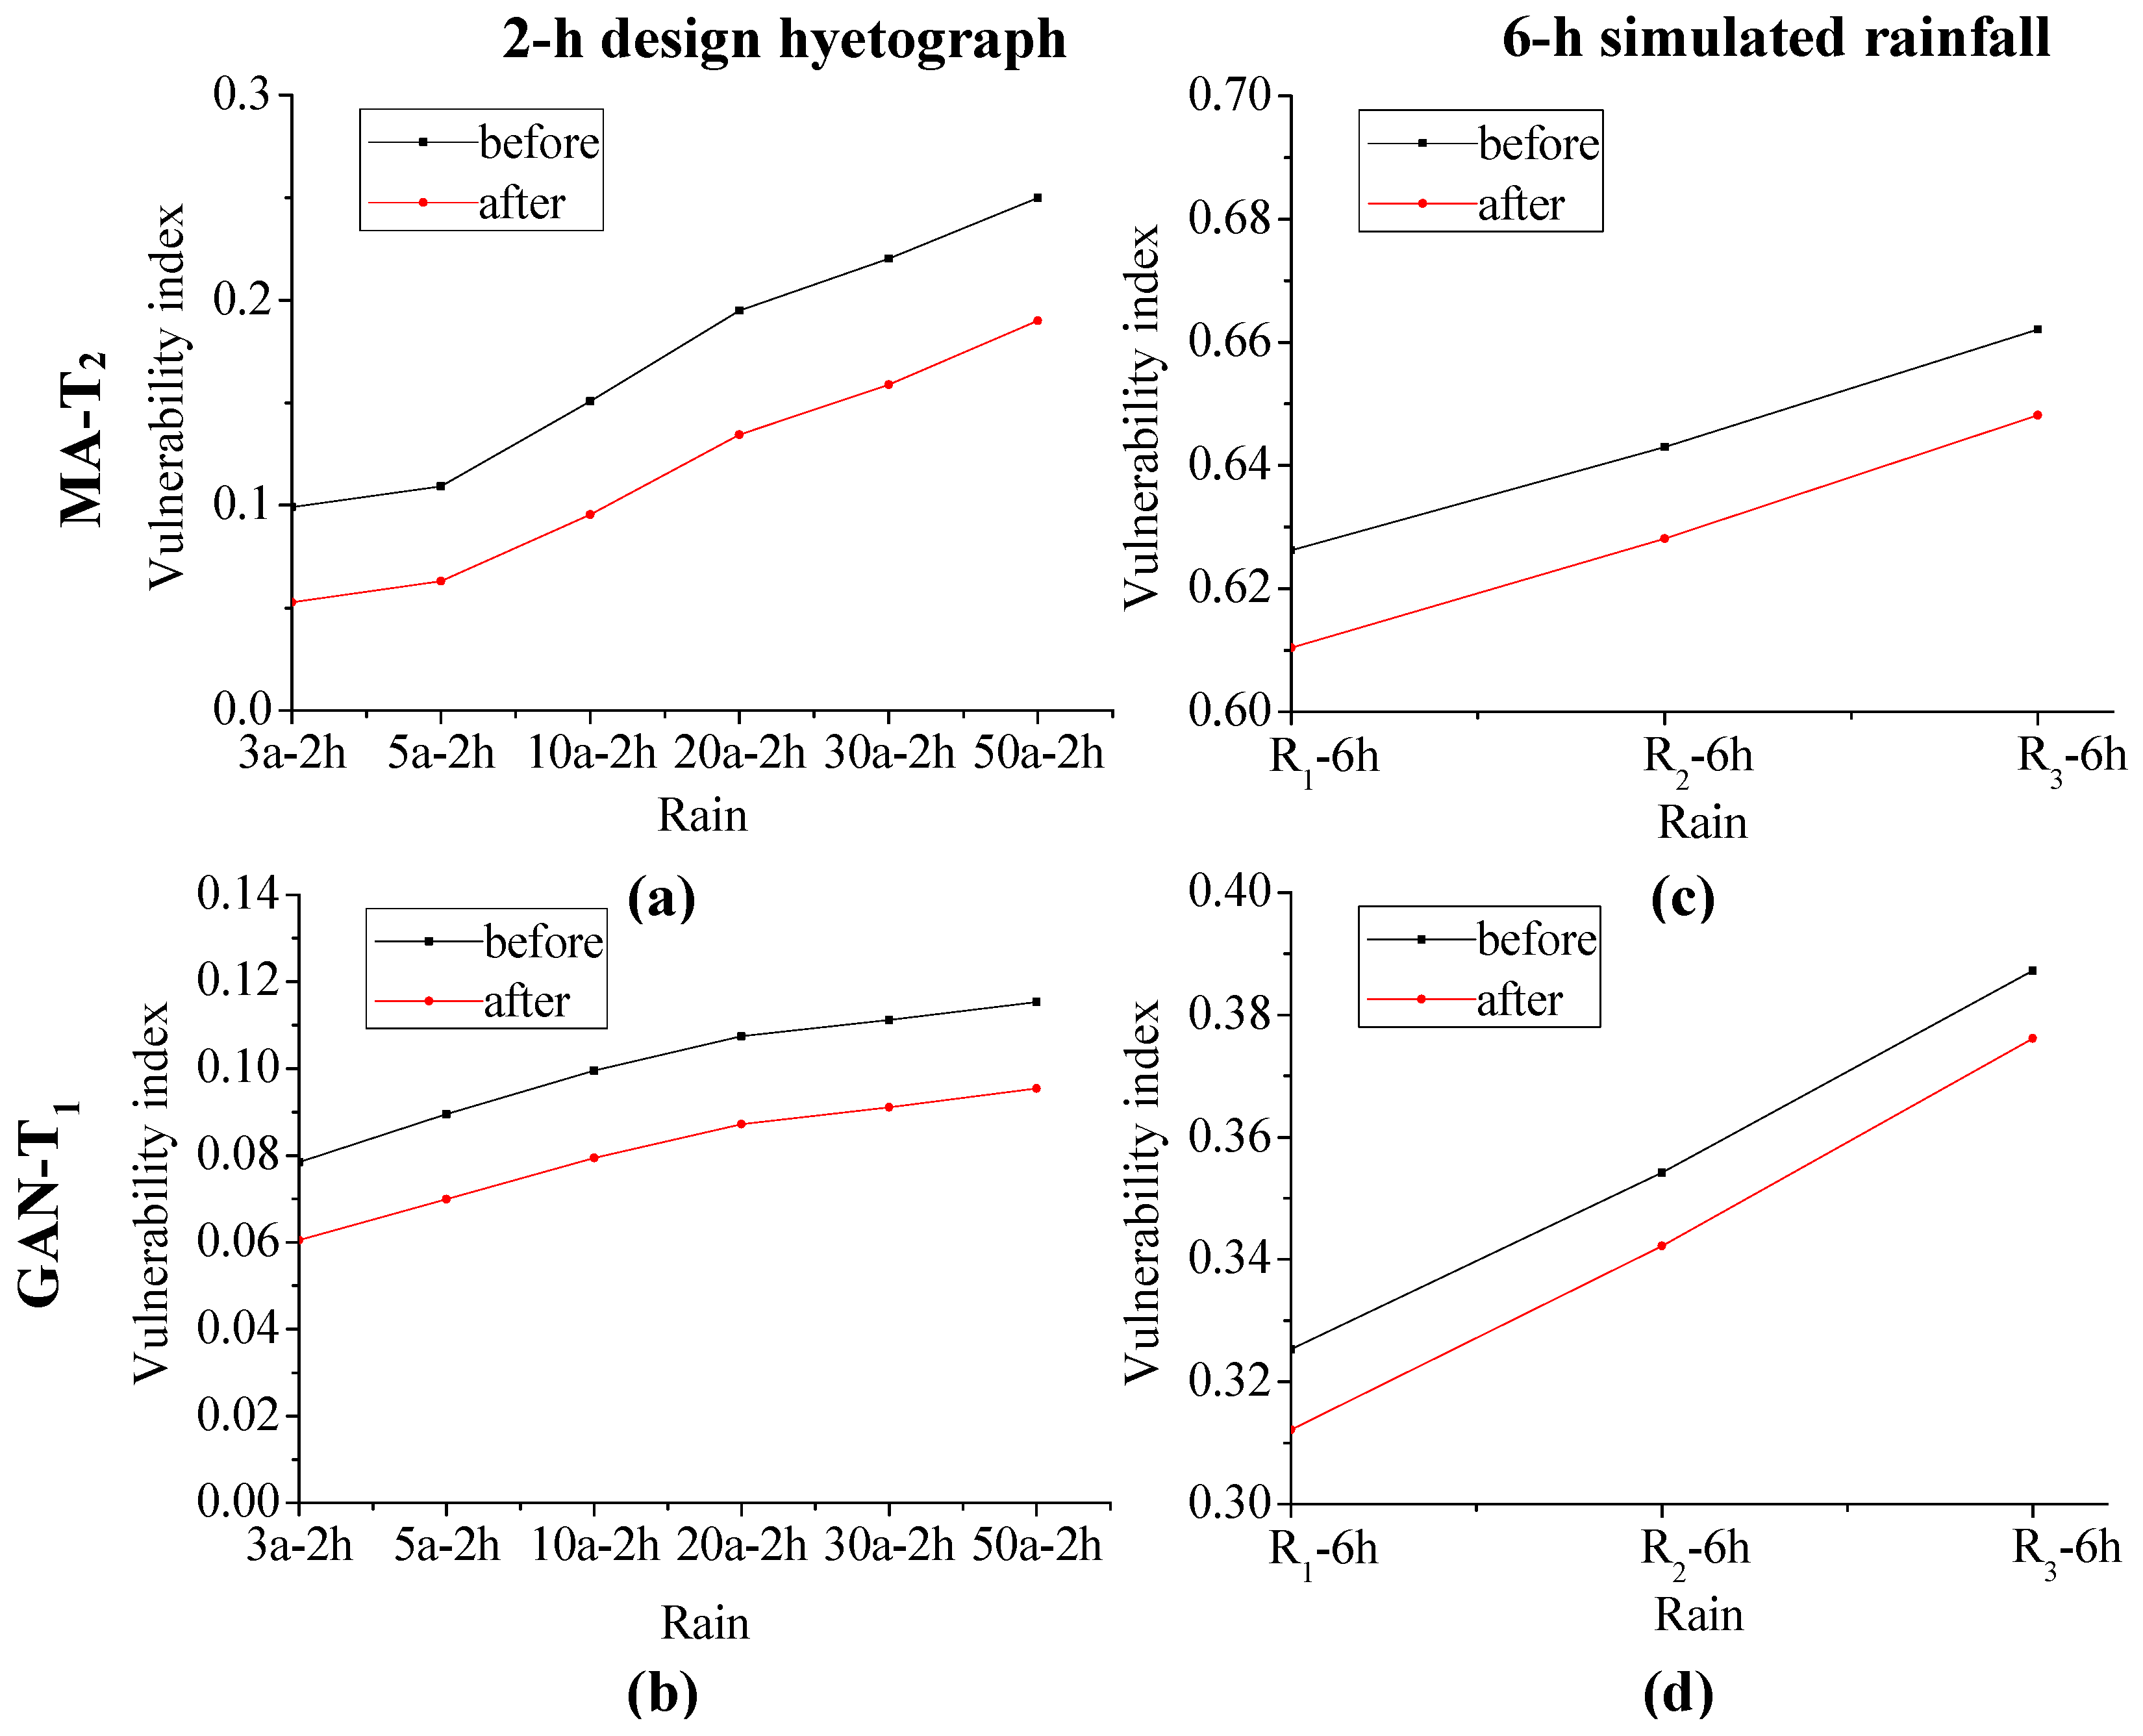
4.2.2. Vulnerability Comparison of Systems before and after Upgrading into Loop Systems

The results of the original and upgraded MA-T2 system under the storm events of 3a-2h and R3-6h are shown in Figure 10. The flood volume of the upgraded system is reduced, i.e., the red curve becomes lower than the black curve along the x-axis. In 3a-2h rainfall pattern condition, the number of critical pipes is substantially reduced in the new system, from 78.0% to 58.2% after the upgrade. This implies that the vulnerability of MA-T2 is reduced by transforming the tree system into a loop system.
Compared to Figure 10a, the results of the original and upgraded MA-T2 system under the storm events of 6-h simulated rainfall profile (i.e., R3-6h) are shown in Figure 10b. The characteristics of the curves of 6-h simulated rainfall profile are similar to the curves of 2-h design hyetograph. However, the red curves still keep lower and become flat at the end of the curves, they are not reduced to zero because of the strong rainfall intensities.
In addition, the largest flood volumes of the original and upgraded MA-T2 system are nearly equal. For example, as Figure 10b shows, when pipe No. 1 is blocked, it results in the largest flood volume. This is mainly because the largest flood volume absolutely corresponds to the most critical pipe No. 1, however, the most critical pipe is close to the outfall node and not chosen for upgrade. Furthermore, if condition permits, this most critical pipe is chosen to upgrade by increasing some pipes, thus, the largest flood volume of the upgraded MA-T2 will reduce greatly.
Furthermore, in order to measure the vulnerability of the drainage systems before and after the implementation of adaptation measures, a vulnerability index is defined. The calculation of the vulnerability index is described by Equation (3). Figure 11 shows the vulnerability index of original and upgraded MA-T2 and GAN-T1 systems under different storm events. The x-axis shows the various storm events, and the y-axis shows the vulnerability index of the drainage systems under various storm events. Figure 11a,c shows the vulnerability index of MA-T2 system under the design rainfall events and 6-h simulated rainfall events, respectively, and Figure 11b,d for the GAN-T1 system. In the 2-h design hyetograph scenario of MA-T2 system, the colors show the vulnerability index before and after the implementation of adaptation measures.
Figure 11a shows the curves of MA-T2 for the 2-h design hyetographs. With the original MA-T2 system, the vulnerability index is increased gradually along the x-axis. When the storm events is 50a-2h, it results in the largest vulnerability index, i.e., 0.25. This implies that the system stability is becoming lower in the strong rainfall intensity and it is “Very highly” vulnerable to urban flood. The other curve in Figure 11a follows a similar trend to the curve of upgraded MA-T2 system, however, the vulnerability index reduces under each storm events after the implementation of adaptation measures. For example, the vulnerability indices are 0.10 and 0.05 for rainfall events 3a-2h, respectively. This means that the drainage system is less vulnerable by upgrading into loop systems.
Compared to Figure 11a, the vulnerability index curves of MA-T2 under the rainfall events of 6-h simulated rainfall profile (i.e., R1-6h, R2-6h, and R3-6h) are shown in Figure 11c. The characteristics of the curves of 6-h simulated rainfall profile are also similar to the curves of 2-h design hyetograph. Further, the vulnerability is relatively large because of the strong rainfall intensities.
The other tree system, i.e., Gan-T1, shows similar characteristics to MA-T2, though the vulnerability indices are different under the same rainfall events, due to different catchment areas and other characteristics among the three tree systems.
In summary, the above analysis demonstrates that the tree drainage systems tend to have a lower vulnerability index and be better system stability after the implementation of adaptation measures, and the loops in the urban drainage systems have an important role in the flood reduction and normal operation when suffering pipe blockage.

4.2.3. Storage Tank Provision

Storage tank provision is considered as another adaptation measure to reduce the flood volume in order to reduce the vulnerability to pipe blockage. As shown in Figure 12, two tanks are added into the MA-T2 system and Gan-T1 system, respectively. However, the cost of tank is varying with the volume of the tank. It is necessary to choose economic and reasonable scheme on the volume of the two tanks. To the MA-T2 system, by changing the volume of the two tanks, in total, 36 schemes are generated, considering all combinations of tank M1 and M2 with the value of 500 m3, 1000 m3, 1500 m3, 2000 m3, 2500 m3 and 3000 m3, respectively. As to the Gan-T1 system, 25 schemes are generated by considering all combinations of two tanks G1 and G2 with volumes of 3000 m3, 4000 m3, 5000 m3, 6000 m3 and 7000 m3. Similar to the adaptation measure of increasing pipes, after the hydrodynamic simulation for each scheme, the two indicators of flood volume reduction and cost of two tanks are calculated, and the relation between i = 1 N ( V i V i ) and cost of each scheme for MA-T2 and GAN-T1 are shown in Figure 13. Suppose the total cost for the adaptation of MA-T2 and Gan-T1 allow maximum of 6 million Yuan and 13 million Yuan, respectively. Then, the volume of M1 and M2 for the MA-T2 are set as 1500 m3 and 1000 m3. Similarly, 3000 m3 and 4000 m3 are for G1 and G2.
Figure 14 shows the vulnerability index of MA-T2 and GAN-T1 systems before and after adaptation by adding tanks under different storm events. Figure 14a, c shows the vulnerability index of MA-T2 system under the design rainfall events and 6-h simulated rainfall events, respectively, and Figure 14b,d for the GAN-T1 system. The vulnerability index of the MA-T2 and GAN-T1 tend to reduce under each storm event after the implementation of adaptation measures. This is because the tank solutions can help reduce the flood volume. We can also conclude that the tree drainage systems tend to have a lower vulnerability by increasing the tanks into the drainage systems. Furthermore, even though the construction cost of tanks is generally higher than that of pipes. However, the tanks can play an important role in reducing the vulnerability index of tree drainage systems.

5. Conclusions

This paper analyzes and compares the vulnerability of tree and loop systems under various storm events when subject to structural failure represented by pipe blockage. Furthermore, this paper provides an insight into the vulnerability performance of the drainage systems, which is quantified with a quantitative index for both tree and loop drainage systems, and the vulnerability index is also used to measure the vulnerability of the drainage systems before and after the implementation of adaptation measures. The method is tested on a case study of three tree urban drainage systems and three loop systems using the SWMM model. Then, two adaptation measures have been investigated to reduce the vulnerability of tree systems: upgrading to loop systems by adding some pipes and adding storage tanks into the drainage systems. The main results obtained are summarized below.
The results indicate that only a fraction of the pipes in the systems are the critical pipes in terms of flood volume. Once these critical pipes are blocked, it will have a significant influence on the drainage systems. The proportion of critical pipes in the loop drainage systems is lower than the tree systems; for example, the proportions for the GAN-T1 and LAN-L1 systems are 73.5% and 10.0% in the rainfall of 3a-2h. Therefore, the loop systems have a lower vulnerability than the tree systems and tend to have better system stability.
Measures are put forward to upgrade the tree systems in order to reduce the systems vulnerability, and are assessed using the drainage systems of MA-T2 and GAN-T1. Compared to the original systems, the new systems tend to have lower vulnerability index and better system stability after the implementation of adaptation, which can be used to help and support normal operation of the drainage systems.
However, in this study, only one pipe was assumed to be blocked. More blockage scenarios should be considered in the future, for example, two or more pipes are blocked at the same time. It should be noted that further measures can be developed to reduce the vulnerability of the systems. More factors should be taken into account in the development of measures. This will help gain more understanding of the performance of tree and loop drainage networks and develop cost effective measures for sustainable urban drainage management.

Acknowledgments

This research was supported by the Major International (Regional) Cooperation Project (Grant No. 51320105010), the Special Public Welfare Research Fund of Ministry of Water Resources of China (Grant No. 201401014-2) and the National Nature Science Foundation of China (Grant No. 51279021). The corresponding author gratefully acknowledges the financial support provided by the China Scholarship Council.

Author Contributions

Chi Zhang and Yuntao Wang designed the study, analyzed the data and wrote the manuscript. Yu Li and Wei Ding provided good advice throughout the paper and helped revise the manuscript.

Conflicts of Interest

The authors declare no conflict of interest.

References

  1. Karamouz, M.; Nazif, S. Reliability-Based Flood Management in Urban Watersheds Considering Climate Change Impacts. J. Water Resour. Plan. Manag. 2013, 139, 520–533. [Google Scholar] [CrossRef]
  2. Ana, E.; Bauwens, W. Modeling the structural deterioration of urban drainage pipes: The state-of-the-art in statistical methods. Urban Water J. 2010, 7, 47–59. [Google Scholar] [CrossRef]
  3. Hahn, M.A.; Palmer, R.N.; Merrill, M.S.; Lukas, A.B. Expert system for prioritizing the inspection of sewers: Knowledge base formulation and evaluation. J. Water Resour. Plan. Manag. 2002, 128, 121–129. [Google Scholar] [CrossRef]
  4. Fu, G.; Butler, D. Copula-based frequency analysis of overflow and flooding in urban drainage systems. J. Hydrol. 2014, 510, 49–58. [Google Scholar] [CrossRef] [Green Version]
  5. Fu, G.; Butler, D.; Khu, S.T.; Sun, S.A. Imprecise probabilistic evaluation of sewer flooding in urban drainage systems using random set theory. Water Resour. Res. 2011, 47. [Google Scholar] [CrossRef] [Green Version]
  6. Meng, F.; Fu, G.; Butler, D. Water quality permitting: From end-of-pipe to operational strategies. Water Res. 2016, 101, 114–126. [Google Scholar] [CrossRef] [PubMed] [Green Version]
  7. Timmerman, P. Vulnerability, Resilience and the Collapse of Society: A Review of Models and Possible Climatic Applications; Institute for Environmental Studies, University of Toronto: Toronto, ON, Canada, 1981. [Google Scholar]
  8. Li, H.; Zhang, P.; Cheng, Y. Concepts and Assessment Methods of Vulnerability. Prog. Geogr. 2008, 27, 18–25. [Google Scholar]
  9. Liverman, D.M. Vulnerability to Global Environmental Change. Understanding Global Environmental Change: The Contributions of Risk Analysis and Management; Clark University: Worcester, MA, USA, 1990; pp. 27–44. [Google Scholar]
  10. Füssel, H.-M.; Klein, R.J. Climate change vulnerability assessments: An evolution of conceptual thinking. Clim. Chang. 2006, 75, 301–329. [Google Scholar] [CrossRef]
  11. Davidson, R.A.; Shah, H.C. An Urban Earthquake Disaster Risk Index; Stanford University: Stanford, CA, USA, 1997. [Google Scholar]
  12. Turvey, R. Vulnerability assessment of developing countries: The case of small-island developing states. Dev. Policy Rev. 2007, 25, 243–264. [Google Scholar] [CrossRef]
  13. Metzger, M.J.; Leemans, R.; Schröter, D. A multidisciplinary multi-scale framework for assessing vulnerabilities to global change. Int. J. Appl. Earth Obs. Geoinf. 2005, 7, 253–267. [Google Scholar] [CrossRef]
  14. Ezell, B.C.; Farr, J.V.; Wiese, I. Infrastructure risk analysis of municipal water distribution system. J. Infrastruct. Syst. 2000, 6, 118–122. [Google Scholar] [CrossRef]
  15. McCarthy, J.J. Climate Change 2001: Impacts, Adaptation, and Vulnerability: Contribution of Working Group II to the Third Assessment Report of the Intergovernmental Panel on Climate Change; Cambridge University Press: Cambridge, UK, 2001. [Google Scholar]
  16. White, G.F. Natural Hazards, Local, National, Global; Oxford University Press: Oxford, UK, 1974. [Google Scholar]
  17. Vogel, C. Vulnerability and global environmental change. LUCC Newsl. 1998, 3, 15–19. [Google Scholar]
  18. Cutter, S.L.; Boruff, B.J.; Shirley, W.L. Social vulnerability to environmental hazards. Soc. Sci. Q. 2003, 84, 242–261. [Google Scholar] [CrossRef]
  19. Ezell, B.C. Infrastructure Vulnerability Assessment Model (I-VAM). Risk Anal. 2007, 27, 571–583. [Google Scholar] [CrossRef] [PubMed]
  20. Kanta, L.R. Vulnerability Assessment of Water Supply Systems for Insufficient Fire Flows; Texas A&M University: College Station, TX, USA, 2006. [Google Scholar]
  21. Ezell, B.C. Toward a systems-based vulnerability assessment methodology for water supply systems. In Proceedings of the 10th United Engineering Foundation Conference, Santa Barbara, CA, USA, 3–8 November 2002.
  22. Xin, K.; Tao, T.; Wang, Y.; Liu, S. Hazard and vulnerability evaluation of water distribution system in cases of contamination intrusion accidents. Front. Environ. Sci. Eng. 2012, 6, 839–848. [Google Scholar] [CrossRef]
  23. Yazdani, A.; Jeffrey, P. A complex network approach to robustness and vulnerability of spatially organized water distribution networks. arXiv 2010. [Google Scholar]
  24. Shuang, Q.; Zhang, M.; Yuan, Y. Node vulnerability of water distribution networks under cascading failures. Reliab. Eng. Syst. Saf. 2014, 124, 132–141. [Google Scholar] [CrossRef]
  25. Kanta, L.; Brumbelow, K. Vulnerability, risk, and mitigation assessment of water distribution systems for insufficient fire flows. J. Water Resour. Plan. Manag. 2012, 139, 593–603. [Google Scholar] [CrossRef]
  26. Murray, R.; Janke, R.; Uber, J. The threat ensemble vulnerability assessment (TEVA) program for drinking water distribution system security. In Proceedings of the World Water and Environmental Resources Congress, Marrakech, Morocco, 20–24 September 2004.
  27. Tidwell, V.C.; Silva, C.J.; Jurado, S. An integrated approach to vulnerability assessment. In Proceedings of the Impacts of Global Climate Change (ASCE), Anchorage, AK, USA, 15–19 May 2005.
  28. Jaeger, C.D.; Hightower, M.M.; Torres, T. Evolution of Sandia’s Risk Assessment Methodology for Water and Wastewater Utilities (RAM-W). In Proceedings of the World Environmental and Water Resources Congress 2010@ Challenges of Change (ASCE), Providence, RI, USA, 16–20 May 2010.
  29. Shao, C.-Q. Vulnerability Assessment Model for Critical Infrastructure—Tianjin Water Distribution System Case Study; Nankai University: Tianjin, China, 2009. [Google Scholar]
  30. Li, H.-B. Study on Vulnerability Analysis of Urban Water Supply System; Tianjin University: Tianjin, China, 2009. [Google Scholar]
  31. Pinto, J.; Varum, H.; Bentes, I.; Agarwal, J. A theory of vulnerability of water pipe network (TVWPN). Water Resour. Manag. 2010, 24, 4237–4254. [Google Scholar] [CrossRef]
  32. Moderl, M.; Kleidorfer, M.; Sitzenfrei, R.; Rauch, W. Identifying weak points of urban drainage systems by means of VulNetUD. Water Sci. Technol. 2009, 60, 2507–2513. [Google Scholar] [CrossRef] [PubMed]
  33. Poulter, B.; Goodall, J.L.; Halpin, P.N. Applications of network analysis for adaptive management of artificial drainage systems in landscapes vulnerable to sea level rise. J. Hydrol. 2008, 357, 207–217. [Google Scholar] [CrossRef]
  34. Möderl, M.; Sitzenfrei, R.; Lammel, J.; Apperl, M.; Kleidorfer, M.; Rauch, W. Development of an urban drainage safety plan concept based on spatial risk assessment. Struct. Infrastruct. Eng. 2015, 11, 918–928. [Google Scholar] [CrossRef]
  35. Friedrich, E.; Kretzinger, D. Vulnerability of wastewater infrastructure of coastal cities to sea level rise: A South African case study. Water SA 2012, 38, 755–764. [Google Scholar] [CrossRef]
  36. Kleidorfer, M.; Moderl, M.; Sitzenfrei, R.; Urich, C.; Rauch, W. A case independent approach on the impact of climate change effects on combined sewer system performance. Water Sci. Technol. 2009, 60, 1555–1564. [Google Scholar] [CrossRef] [PubMed]
  37. Sitzenfrei, R.; Mair, M.; Moderl, M.; Rauch, W. Cascade vulnerability for risk analysis of water infrastructure. Water Sci. Technol. 2011, 64, 1885–1891. [Google Scholar] [CrossRef] [PubMed]
  38. Mair, M.; Sitzenfrei, R.; Kleidorfer, M.; Moderl, M.; Rauch, W. GIS-based applications of sensitivity analysis for sewer models. Water Sci. Technol. 2012, 65, 1215–1222. [Google Scholar] [CrossRef] [PubMed]
  39. Hou, Q. Study on Vulnerability Assessment and Emergency Measures of Storm Sewer Syetem; Qingdao Technological University: Qingdao, China, 2014. [Google Scholar]
  40. Mugume, S.N.; Gomez, D.E.; Fu, G.; Farmani, R.; Butler, D. A global analysis approach for investigating structural resilience in urban drainage systems. Water Res. 2015, 81, 15–26. [Google Scholar] [CrossRef] [PubMed] [Green Version]
  41. Hao, L.; Cuimei, L. Vulnerability assessment of urban storm sewer systems. J. Shenzhen Univ. Sci. Eng. 2014, 6, 006. [Google Scholar]
  42. Seo, Y.; Seo, Y.-H.; Kim, Y.-O. Behavior of a Fully-Looped Drainage Network and the Corresponding Dendritic Networks. Water 2015, 7, 1291–1305. [Google Scholar] [CrossRef]
  43. Ji, Z. General hydrodynamic model for sewer/channel network systems. J. Hydraul. Eng. 1998, 124, 307–315. [Google Scholar] [CrossRef]
  44. Feng, L. Study on the Hydrodynamic and Wastewater Quality Transfonrmtion Model in Urban Sewer Networks; Dalian University of Technology: Dalian, China, 2009. [Google Scholar]
  45. Rossman, L.A. Storm Water Management Model User’s Manual, Version 5.0. Available online: http://www.owp.csus.edu/LIDTool/Content/PDF/SWMM5Manual.pdf (accessed on 23 February 2017).
  46. Peterson, E.W.; Wicks, C.M. Assessing the importance of conduit geometry and physical parameters in karst systems using the storm water management model (SWMM). J. Hydrol. 2006, 329, 294–305. [Google Scholar] [CrossRef]
  47. Tsihrintzis, V.A.; Hamid, R. Runoff quality prediction from small urban catchments using SWMM. Hydrol. Process. 1998, 12, 311–329. [Google Scholar] [CrossRef]
  48. Cong, X.-Y.; Ni, G.-H.; Hui, S.-B.; Tian, F.-Q.; Zhang, T. Simulative analysis on storm flood in typical urban region of Beijing based on SWMM. Water Resour. Hydropower Eng. 2006, 4, 64–67. [Google Scholar]
  49. Zhao, D.-Q.; Chen, J.-N.; Tong, Q.-Y.; Wang, H.-Z.; Cao, S.-B.; Sheng, Z. Construction of SWMM urban drainage network model Based on GIS. China Water Wastewater 2008, 24, 88. [Google Scholar]
  50. Fu, G.; Kapelan, Z. Flood analysis of urban drainage systems: Probabilistic dependence structure of rainfall characteristics and fuzzy model parameters. J. Hydroinform. 2013, 15, 687–699. [Google Scholar] [CrossRef]
  51. Sun, S.; Fu, G.; Djordjević, S.; Khu, S.-T. Separating aleatory and epistemic uncertainties: Probabilistic sewer flooding evaluation using probability box. J. Hydrol. 2012, 420, 360–372. [Google Scholar] [CrossRef]
  52. Li, Y.; Wang, Y.; Zhang, H.; Zhang, C.; Cheng, M.; Yu, Z. Impact of Urbanization Process on Drainage System and Modification Measures Analysis. J. Water Resour. Res. 2015, 4, 273. [Google Scholar] [CrossRef]
  53. Tao, T.; Wang, J.; Xin, K.; Li, S. Multi-objective optimal layout of distributed storm-water detention. Int. J. Environ. Sci. Technol. 2014, 11, 1473–1480. [Google Scholar] [CrossRef]
  54. Keifer, C.J.; Chu, H.H. Synthetic storm pattern for drainage design. J. Hydraul. Divis. 1957, 83, 1–25. [Google Scholar]
  55. Marsalek, J.; Watt, W. Design storms for urban drainage design. Can. J. Civ. Eng. 1984, 11, 574–584. [Google Scholar] [CrossRef]
  56. Dong, Y. The Study on Optimal Design to Rehabilitation and Extension of Drainage Pipe Network; Xi’an University of Technology: Xi’an, China, 2006. [Google Scholar]
Figure 1. Schematic representation of the method.
Sustainability 09 00397 g001
Figure 2. Case study networks.
Sustainability 09 00397 g002
Figure 3. Rainfall pattern with different duration and return periods. (a) 2-h design hyetograph; and (b) 6-h simulated rainfall pattern.
Sustainability 09 00397 g003
Figure 4. Flood volume of tree drainage systems when subject to pipe blockage under different rainfalls. (a) Flood volume for GAN-T1 under 2-h design hyetograph; (b) Flood volume for MA-T2 under 2-h design hyetograph; (c) Flood volume for HU-T3 under 2-h design hyetograph; (d) Flood volume for GAN-T1 under 6-h simulated rainfall; (e) Flood volume for MA-T2 under 6-h simulated rainfall; and (f) Flood volume for HU-T3 under 6-h simulated rainfall.
Sustainability 09 00397 g004
Figure 5. Flood volume of loop drainage systems when subject to pipe blockage under different rainfalls. (a) Flood volume for LAN-L1 under 2-h design hyetograph; (b) Flood volume for ZI-L2 under 2-h design hyetograph; (c) Flood volume for HW-L3 under 2-h design hyetograph; (d) Flood volume for LAN-L1 under 6-h simulated rainfall; (e) Flood volume for ZI-L2 under 6-h simulated rainfall; and (f) Flood volume for HW-L3 under 6-h simulated rainfall.
Sustainability 09 00397 g005
Figure 6. Vulnerability index of the six drainage systems under different rainfalls.
Sustainability 09 00397 g006
Figure 7. Schemes of adaptation for the MA-T2 and GAN-T1 drainage systems. (a) Adaptation schemes for MA-T2; and (b) Adaptation schemes for GAN-T1.
Sustainability 09 00397 g007
Figure 8. Flood volume reduction and cost of each scheme (increasing one pipe) for the MA-T2 and GAN-T1 drainage systems under rainfall of 3a-2h. (a) Flood volume reduction and cost for MA-T2; and (b) Flood volume reduction and cost for GAN-T1. The red line represents the boundary line and blue circle represents the selected schemes.
Sustainability 09 00397 g008
Figure 9. Network upgrades of MA-T2 and GAN-T1. (a) and (c) represent the network of MA-T2 before and after adaptation measure; (b) and (d) represent the network of GAN-T1 before and after adaptation measure.
Sustainability 09 00397 g009
Figure 10. Flood volume of MA-T2 before and after adaptation by increasing pipes. (a) Flood volume under rainfall of 3a-2h; and (b) Flood volume under rainfall of R3-6h.
Sustainability 09 00397 g010
Figure 11. Vulnerability index of MA-T2 and GAN-T1 before and after adaptation by increasing pipes. (a) Vulnerability index of MA-T2 under the rainfall of 2-h design hyetograph; (b) Vulnerability index of GAN-T1 under the rainfall of 2-h design hyetograph; (c) Vulnerability index of MA-T2 under the rainfall of 6-h simulated rainfall; and (d) Vulnerability index of GAN-T1 under the rainfall of 6-h simulated rainfall.
Sustainability 09 00397 g011
Figure 12. Scheme (adding tanks) for the MA-T2 and GAN-T1 drainage systems. (a) Location of two tanks for MA-T2; and (b) Location of two tanks for GAN-T1.
Sustainability 09 00397 g012
Figure 13. Flood volume reduction and cost of each scheme (adding two tanks) for the MA-T2 and GAN-T1 drainage systems under rainfall of R1-6h. (a) Flood volume reduction and cost for MA-T2; and (b) Flood volume reduction and cost for GAN-T1. The red line represents the boundary line and blue circle represents the selected schemes.
Sustainability 09 00397 g013
Figure 14. Vulnerability index of MA-T2 and GAN-T1 before and after adaptation by adding tanks. (a) Vulnerability index of MA-T2 under the rainfall of 2-h design hyetograph; (b) Vulnerability index of GAN-T1 under the rainfall of 2-h design hyetograph; (c) Vulnerability index of MA-T2 under the rainfall of 6-h simulated rainfall; and (d) Vulnerability index of GAN-T1 under the rainfall of 6-h simulated rainfall.
Sustainability 09 00397 g014
Table 1. General properties of the case study networks.
Drainage SystemNo. of NodesNo. of PipesNo. of OutfallsCatchment Area (ha)
GAN-T11361361103.2
MA-T28391148.8
HU-T35656133.3
LAN-L1105129143.6
ZI-L2163223172.9
HW-L3103115153.7

