
Social Media Research, Human Behavior, and Sustainable Society


Abstract
:1. Introduction
2. Data and Methods
- (1)
- Growth of output during 2008–2014;
- (2)
- Distribution of output in subject categories and journals identified by ISI;
- (3)
- Geographic and institutional distribution of publications;
- (4)
- Distribution of author keywords analysis;
- (5)
- Institution collaboration network analysis.
3. Results and Discussion
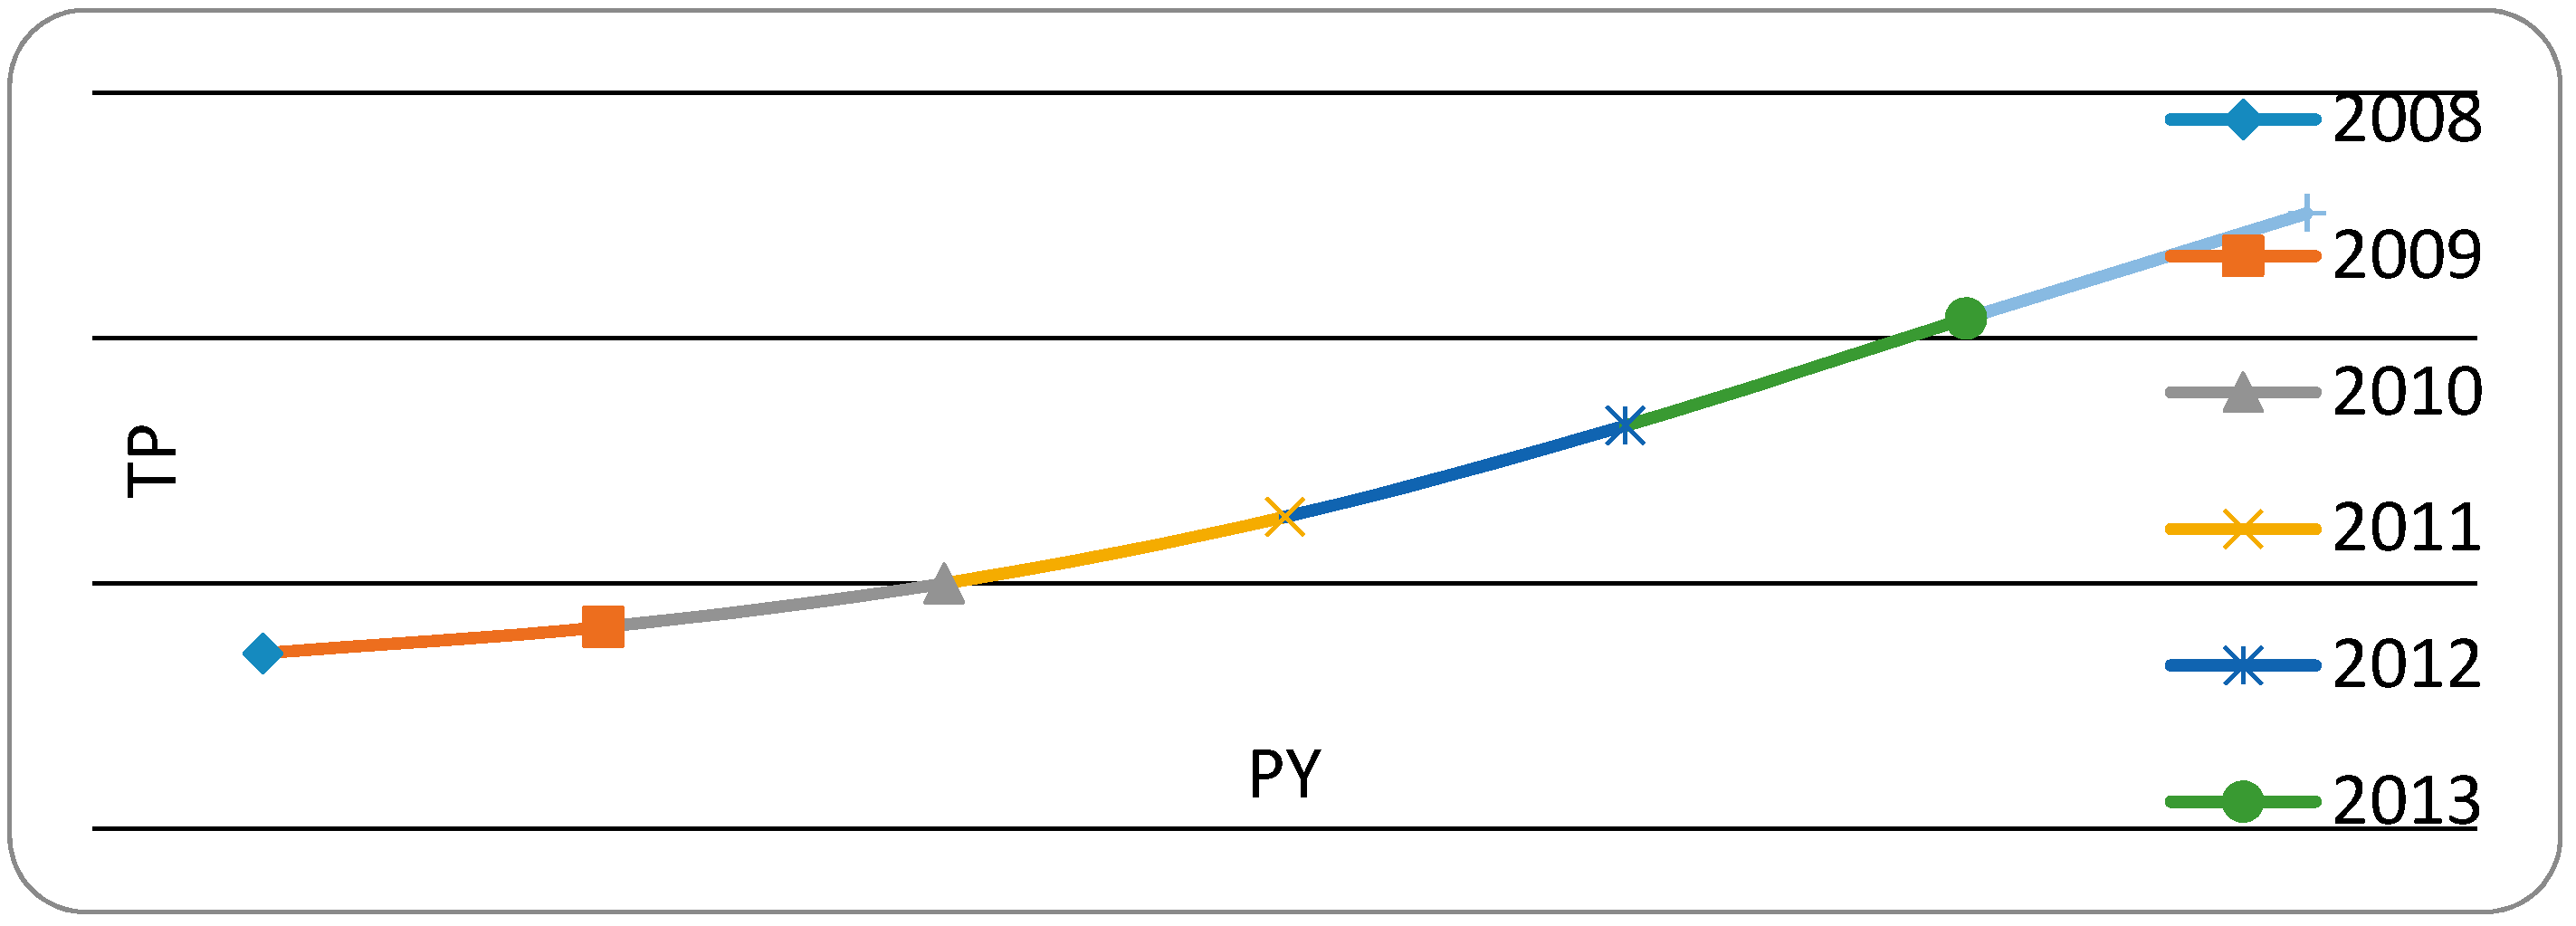
3.1. Characteristics of Article Outputs
3.2. Subjective Categories and Major Journals
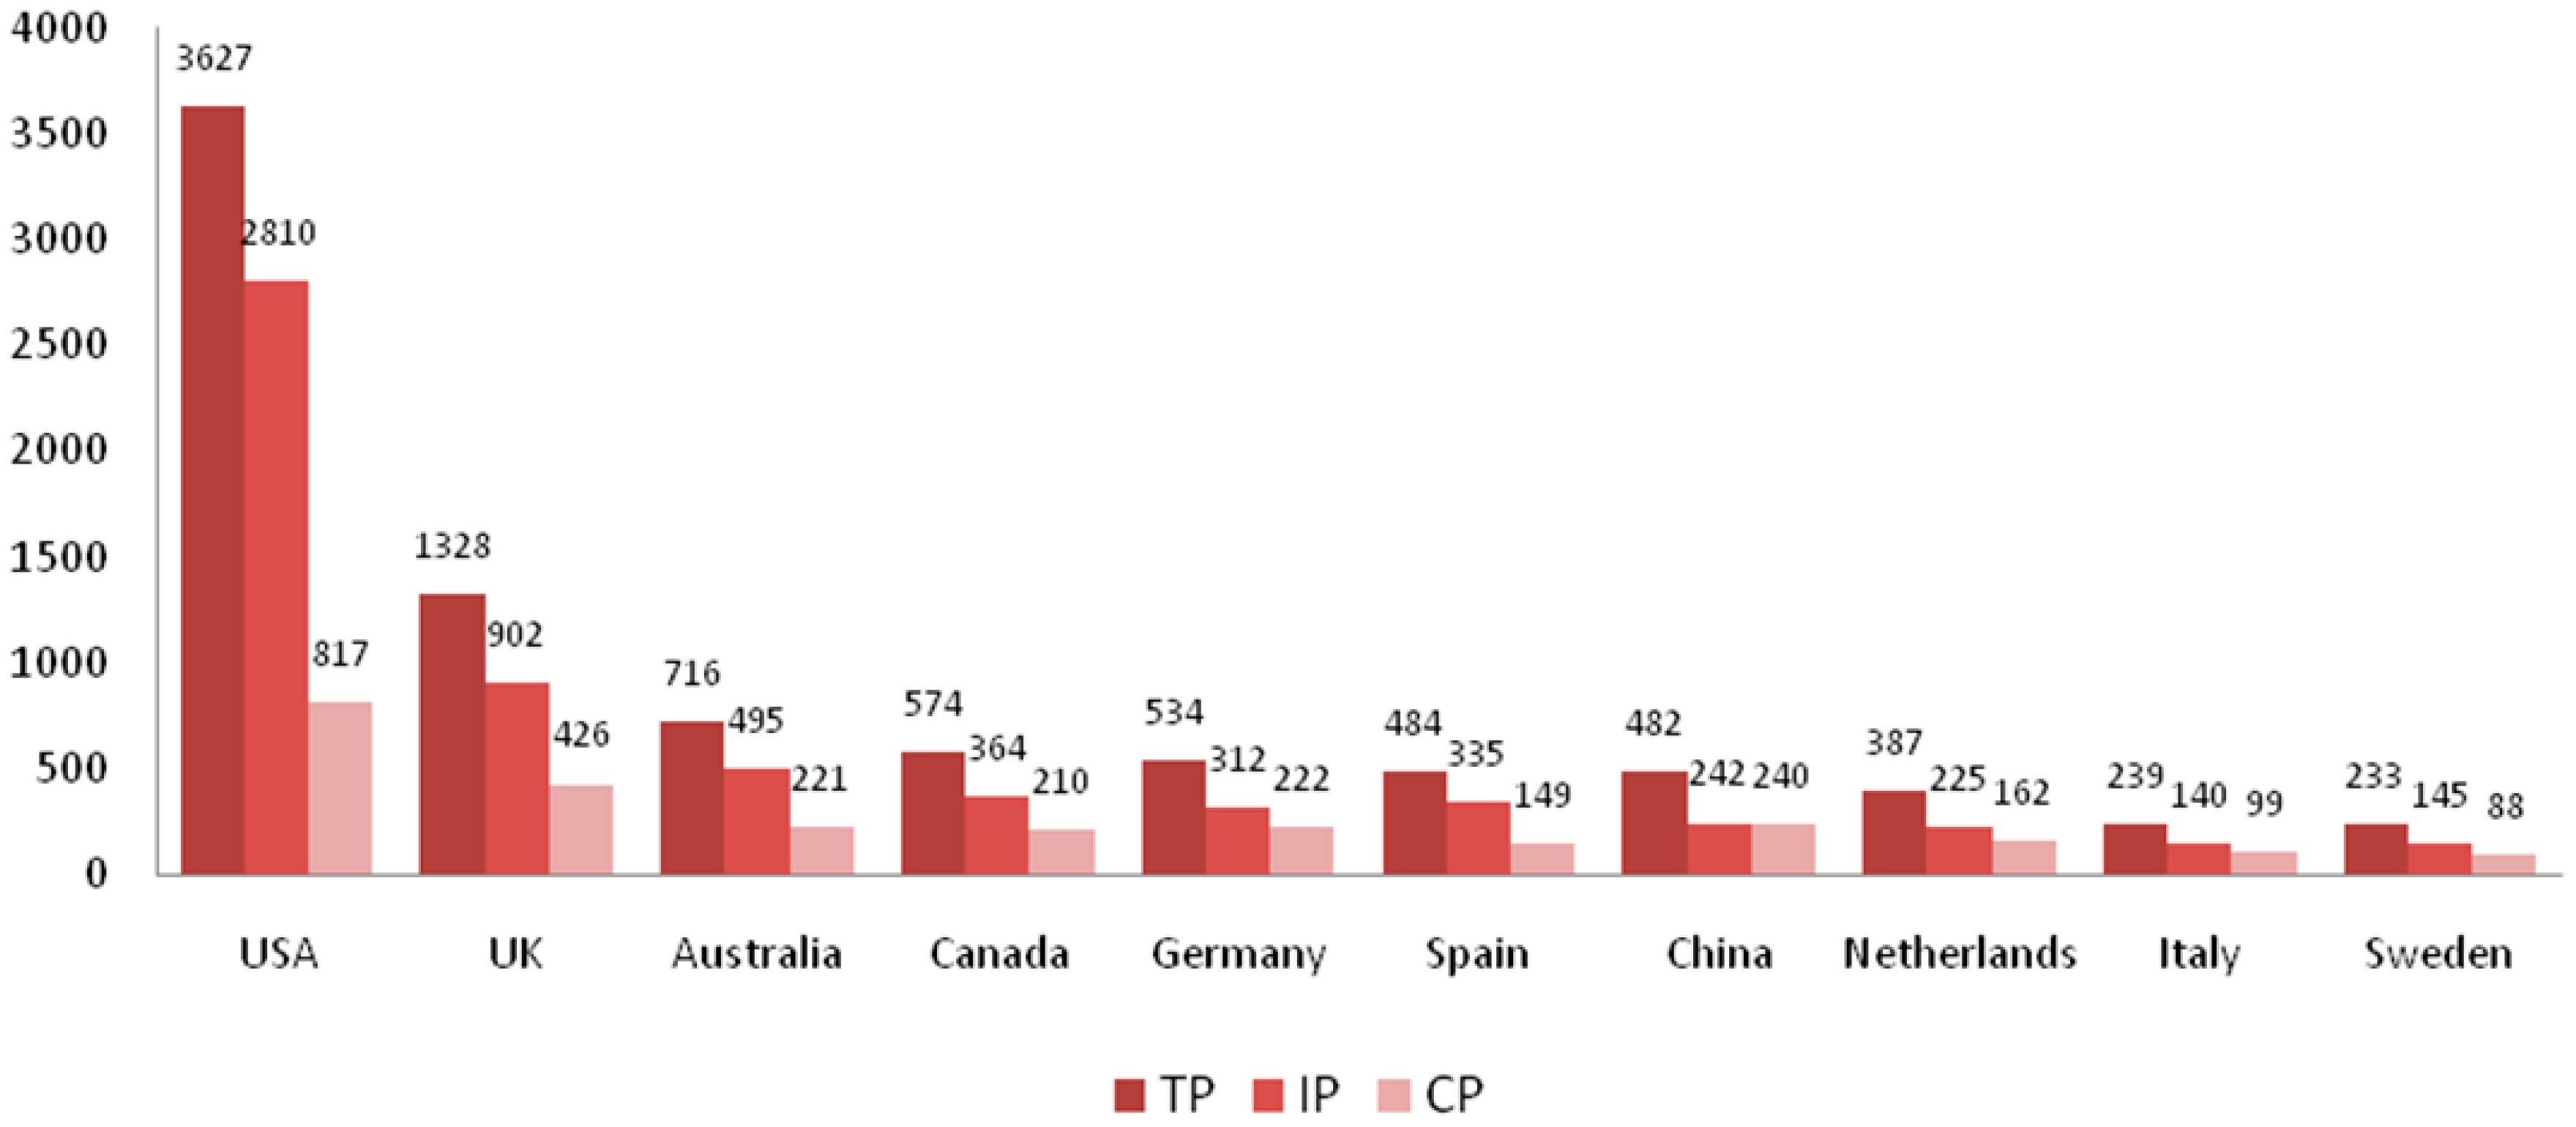
3.3. Geographic and Institutional Distribution of Publications
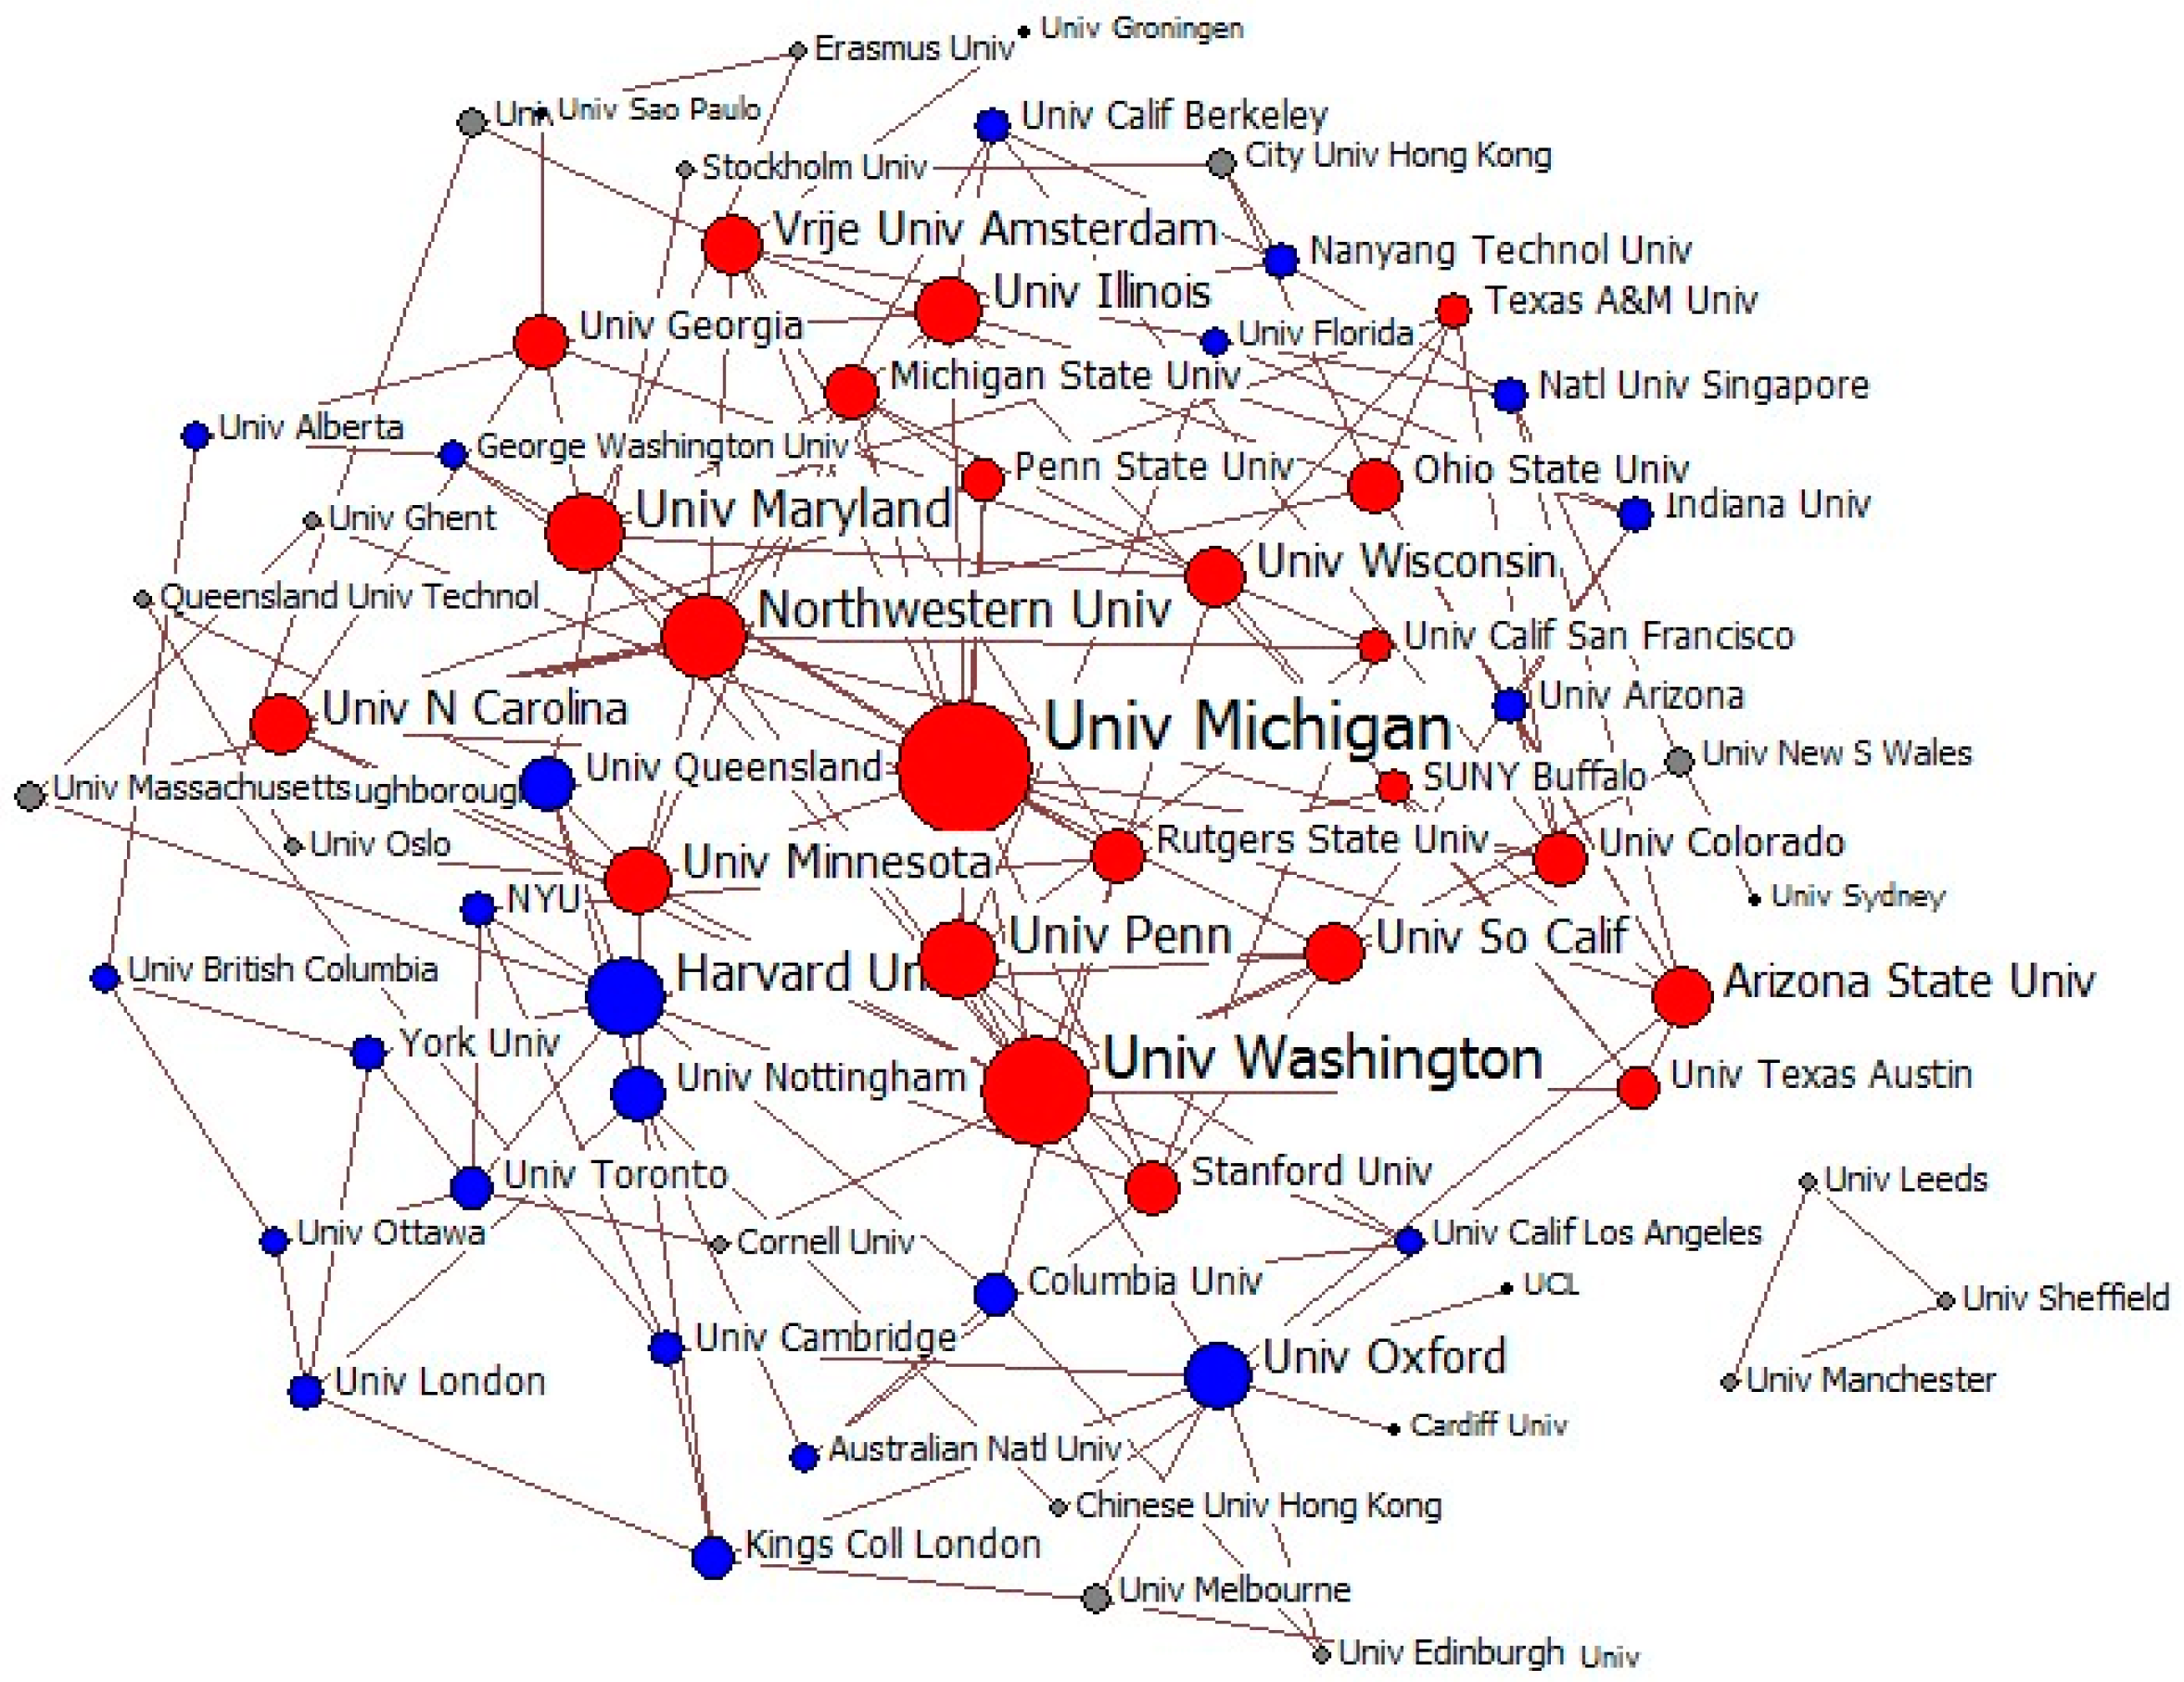
3.4. Institution Collaboration Network
3.5. Author Keywords Analysis
3.5.1. Temporal Evolution of Author Keywords
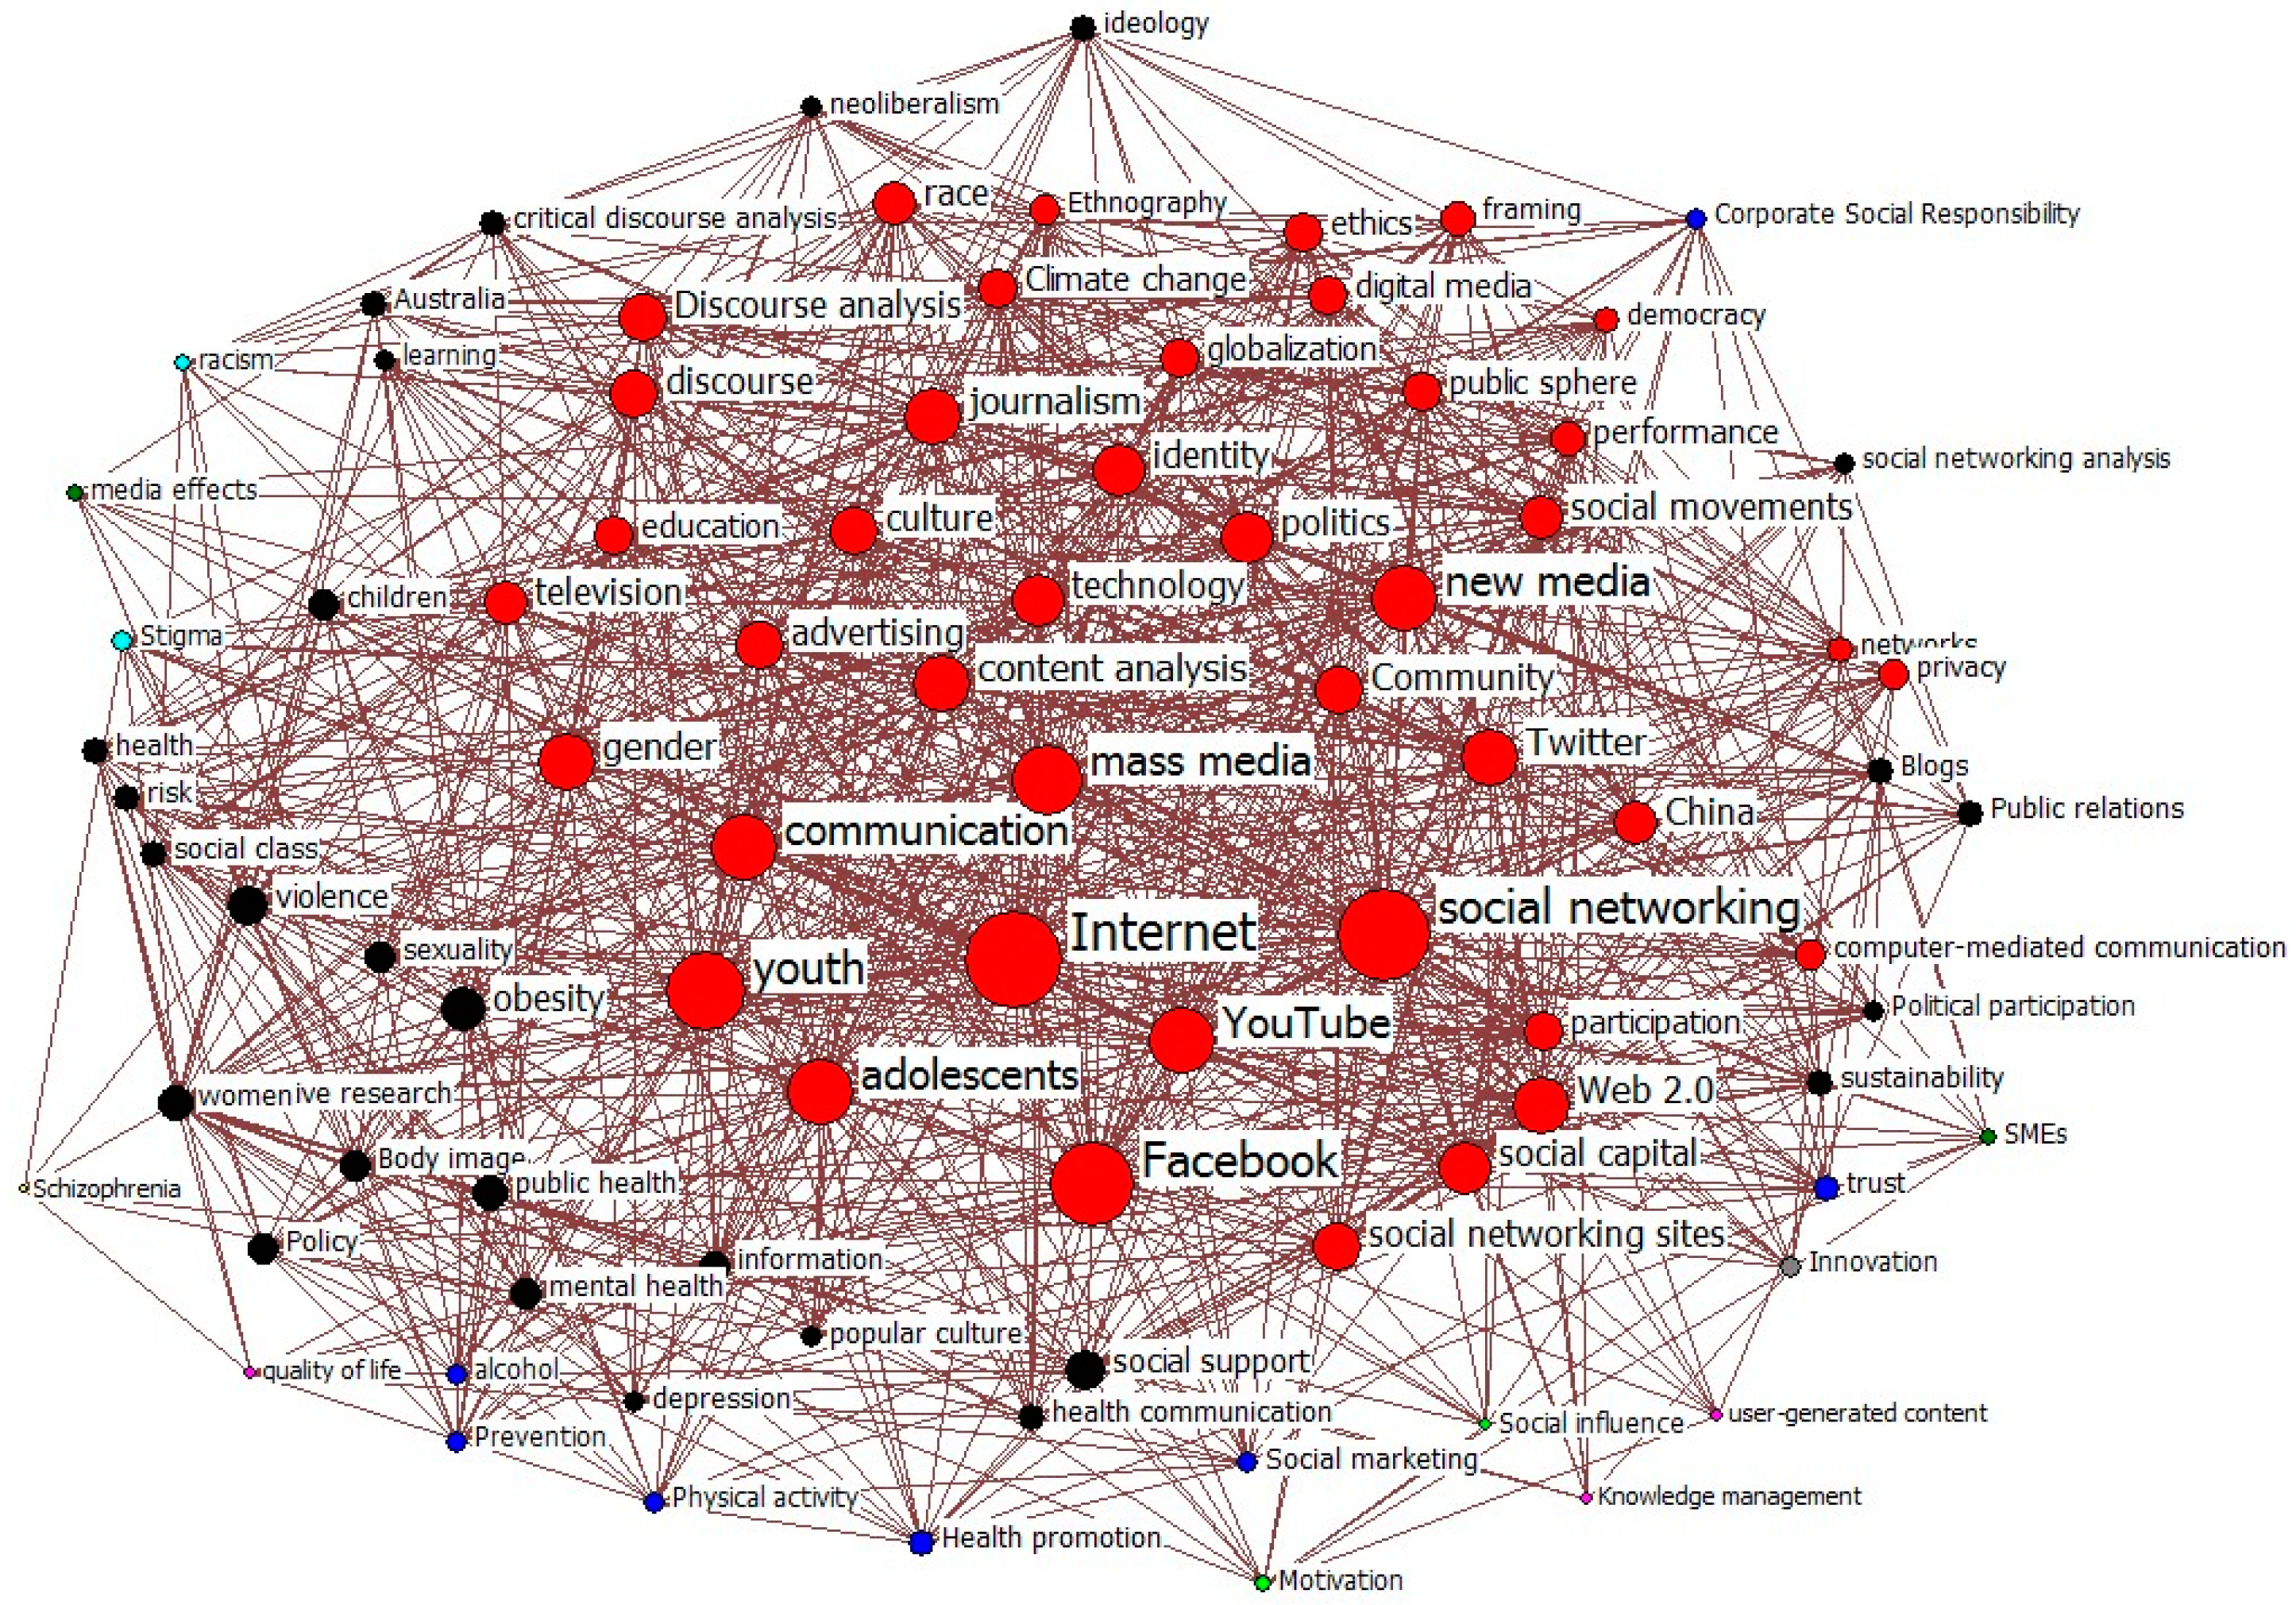
3.5.2. Author Keywords Co-Work Network Analysis
4. Conclusions
Acknowledgments
Author Contributions
Conflicts of Interest
References
- Kaplan, A.M.; Haenlein, M. Users of the world, unite! The challenges and opportunities of social media. Bus. Horiz. 2010, 1, 59–68. [Google Scholar] [CrossRef]
- Mayfield, A. What Is Social Media? 2008. Available online: http://www.repromax.com/docs/113/854427515.pdf (accessed on 5 April 2015).
- Ryan, T.; Xenos, S. Who uses Facebook? An investigation into the relationship between the Big Five, shyness, narcissism, loneliness, and Facebook usage. Comput. Hum. Behav. 2011, 5, 1658–1664. [Google Scholar] [CrossRef]
- Smock, A.D.; Ellison, N.B.; Lampe, C.; Donghee Yvette, W. Facebook as a toolkit: A uses and gratification approach to unbundling feature use. Comput. Hum. Behav. 2011, 6, 2322–2329. [Google Scholar] [CrossRef]
- Cheung, C.M.K.; Chiu, P.; Lee, M.K.O. Online social networks: Why do students use facebook? Comput. Hum. Behav. 2011, 4, 1337–1343. [Google Scholar] [CrossRef]
- Kima, Y.; Sohn, D.; Choi, S.M. Cultural difference in motivations for using social network sites: A comparative study of American and Korean college students. Comput. Hum. Behav. 2011, 1, 365–372. [Google Scholar] [CrossRef]
- Hughes, D.J.; Rowea, M.; Batey, M.; Lee, A. A tale of two sites: Twitter vs. Facebook and the personality predictors of social media usage. Comput. Hum. Behav. 2012, 2, 561–569. [Google Scholar] [CrossRef] [Green Version]
- Wang, Z.; Ye, X.; Tsou, M. Spatial, temporal, and content analysis of Twitter for wildfire hazards. Natl. Hazards 2016. [Google Scholar] [CrossRef]
- Kaigo, M. Social Media Usage during Disasters and Social Capital: Twitter and the Great East Japan Earthquake. Keio Commun. Rev. 2012, 34, 19–35. [Google Scholar]
- Leskovec, J.; Huttenlocher, D.; Kleinberg, J. Governance in Social Media: A Case Study of the Wikipedia Promotion Process. In Proceedings of the 4th International AAAI Conference on Weblogs and Social Media, Washington, DC, USA, 23–26 May 2010; pp. 98–105.
- Rainie, L.; Smith, A.; Schlozman, K.L.; Brady, H.; Verba, S. Social Media and Political Engagement. Available online: http://pewinternet.org/Reports/2012/Political-Engagement.aspx (accessed on 23 January 2017).
- Smith, T. The social media revolution. Int. J. Mark. Res. 2009, 4, 559–561. [Google Scholar] [CrossRef]
- Miller, R.; Lammas, N. Social media and its implications for viral marketing. Asia Pac. Public Relat. J. 2010, 11, 1–9. [Google Scholar]
- Edosomwan, S.; Prakasan, S.K.; Kouame, D.; Watson, J.; Seymour, T. The History of Social Media and its Impact on Business. J. Appl. Manag. Entrep. 2011, 16, 3. [Google Scholar]
- Ritterman, J.; Osborne, M.; Klein, E. Using prediction markets and Twitter to predict a swine flu pandemic. In Proceedings of the 1st International Workshop of Mining Social Media, Sevilla, Spain, 9 November 2009; pp. 9–17.
- Tumasjan, A.; Sprenger, T.O.; Sandner, P.G.; Welpe, I.M. Predicting Elections with Twitter: What 140 Characters Reveal about Political Sentiment. In Proceedings of the 4th International AAAI Conference on Weblogs and Social Media, Washington, DC, USA, 23–26 May 2010.
- Ye, X.; Li, S.; Yang, X.; Qin, C. Use of Social Media for Detection and Analysis of Infectious Disease in China. ISPRS Int. J. Geo-Inf. 2016. [Google Scholar] [CrossRef]
- Selwyn, N. Social Media in Higher Education; The Europa World of Learning: Lodon, UK, 2012; Available online: https://www.researchgate.net/publication/265159738_SOCIAL_MEDIA_IN_HIGHER_EDUCATION (accessed on 1 March 2017).
- Lenhart, A.; Purcell, K.; Smith, A.; Zickuhr, K. Social Media and Young Adults. Available online: http://www.pewinternet.org/Reports/2010/Social-Media-and-Young-Adults.aspx (accessed on 23 January 2017).
- Leung, D.; Law, R.; van Hoof, H.; Buhalis, D. Social Media in Tourism and Hospitality: A Literature Review. J. Travel Tour. Mark. 2013, 1–2, 3–22. [Google Scholar] [CrossRef]
- Andzulis, J.; Panagopoulos, N.G.; Rapp, A. A Review of Social Media and Implications for the Sales Process. J. Pers. Sell. Sales Manag. 2013, 3, 305–316. [Google Scholar] [CrossRef]
- Moorhead, S.A.; Hazlett, D.E.; Harrison, L.; Carroll, J.K.; Irwin, A.; Hoving, C. A New Dimension of Health Care: Systematic Review of the Uses, Benefits, and Limitations of Social Media for Health Communication. J. Med. Internet Res. 2013, 4, 85. [Google Scholar] [CrossRef] [PubMed]
- Veil, S.R.; Buehner, T.; Palenchar, M.J. Work-In-Process Literature Review: Incorporating Social Media in Risk and Crisis Communication. J. Conting. Crisis Manag. 2011, 2, 110–122. [Google Scholar] [CrossRef]
- Crowe, A. The social media manifesto: A comprehensive review of the impact of social media on emergency management. J. Bus. Contin. Emerg. Plan. 2010, 1, 409–420. [Google Scholar]
- Tess, P.A. The role of social media in higher education classes (real and virtual)—A literature review. Comput. Hum. Behav. 2013, 5, 60–68. [Google Scholar] [CrossRef]
- Magro, M.J. A Review of Social Media Use in E-Government. Adm. Sci. 2012, 2, 148–161. [Google Scholar] [CrossRef]
- De Bellis, N. Bibliometrics and Citation Analysis: From the Science Citation Index to Cybermetrics; Scarecrow Press: Lanham, MD, USA, 2009; Volume 417. [Google Scholar]
- Pritchard, A. Statistical bibliography or bibliometrics? J. Doc. 1969, 25, 348–349. [Google Scholar]
- Garfield, E. Citation indexing for studying science. Nature 1970, 227, 669–671. [Google Scholar] [CrossRef] [PubMed]
- Chiu, W.T.; Huang, J.S.; Ho, Y.S. Bibliometric analysis of severe acute respiratory syndrome-related research in the beginning stage. Scientometrics 2004, 61, 69–77. [Google Scholar] [CrossRef]
- Li, J.; Zhang, Y.; Wang, X.; Ho, Y.S. Bibliometric analysis of atmospheric simulation trends in meteorology and atmospheric science journals. Croat. Chem. Acta 2009, 82, 695–705. [Google Scholar]
- Zhang, W.; Qian, W.; Ho, Y.S. A bibliometric analysis of research related to ocean circulation. Scientometrics 2009, 80, 305–316. [Google Scholar] [CrossRef]
- Zhao, L.; Zhang, Q. Mapping knowledge domains of Chinese digital library research output, 1994–2010. Scientometrics 2011, 89, 51–87. [Google Scholar] [CrossRef]
- Ding, Y.; Chowdhury, G.; Foo, S. Bibliometric cartography of information retrieval researchby using co-word analysis. Inf. Process. Manag. 2011, 37, 817–842. [Google Scholar] [CrossRef]
- Niu, B.; Hong, S.; Yuan, J.; Peng, S.; Wang, Z.; Zhang, X. Global trends in sediment-related research in earth science during 1992–2011: A bibliometric analysis. Scientometrics 2014, 98, 511–529. [Google Scholar] [CrossRef]
- He, Y.; Hui, S. Mining a web citation database for author co-citation analysis. Inf. Process. Manag. 2002, 38, 491–508. [Google Scholar] [CrossRef]
- Lai, K.; Wu, S. Using the patent co-citation approach to establish a new patent classification system. Inf. Process. Manag. 2005, 41, 313–330. [Google Scholar] [CrossRef]
- Glanzel, W. Science in Scandinavia: A bibliometric approach. Scientometrics 2000, 48, 121–150. [Google Scholar] [CrossRef]
- Seglen, P.; Aksnes, D. Scientific productivity and group size: A bibliometric analysis of Norwegian microbiological research. Scientometrics 2000, 49, 125–143. [Google Scholar] [CrossRef]
- Liu, X.; Zhan, F.; Hong, S.; Niu, B.; Liu, Y. A bibliometric study of earthquake research: 1900–2010. Scientometrics 2012, 92, 747–765. [Google Scholar] [CrossRef]
- Schmoch, U.; Schubert, T. Are international co-publications an indicator for quality of scientific research? Scientometrics 2008, 74, 361–377. [Google Scholar] [CrossRef]
- De Bakker, F.G.A.; Groenewegen, P.; Hond, F.D. A Bibliometric Analysis of 30 Years of Research and Theory on Corporate Social Responsibility and Corporate Social Performance. Bus. Soc. 2005, 3, 283–317. [Google Scholar] [CrossRef]
- Nederhof, A.J. Bibliometric monitoring of research performance in the Social Sciences and the Humanities: A Review. Scientometrics 2006, 1, 81–100. [Google Scholar] [CrossRef]
- Tarkowski, S.M. Environmental health research in Europe-Bibliometric analysis. Eur. J. Public Health 2007, 17, 14–18. [Google Scholar] [CrossRef] [PubMed]
- Li, T.; Ho, Y.S.; Li, C.Y. Bibliometric analysis on global Parkinson’s disease research trends during 1991–2006. Neurosci. Lett. 2008, 441, 248–252. [Google Scholar] [CrossRef] [PubMed]
- Xie, S.; Zhang, J.; Ho, Y.S. Assessment of world aerosol research trends by bibliometric analysis. Scientometrics 2008, 77, 113–130. [Google Scholar] [CrossRef]
- Liu, X.; Zhang, L.; Hong, S. Global biodiversity research during 1900–2009: A bibliometric analysis. Biodivers. Conserv. 2010, 20, 807–826. [Google Scholar] [CrossRef]
- DeJordy, R.; Halgin, D.; Everett, M.; Borgatti, S. Social Network Analysis Software. Available online: http://www.analytictech.com (accessed on 1 March 2017).


| PY | TP | AU | AU/TP | TC | TC/TP | NR | NR/TP | PG | PG/TP |
|---|---|---|---|---|---|---|---|---|---|
| 2008 | 716 | 1996 | 2.79 | 8848 | 12.36 | 30,067 | 41.99 | 10,719 | 14.97 |
| 2009 | 823 | 2080 | 2.53 | 8580 | 10.43 | 34,692 | 42.15 | 12,001 | 14.58 |
| 2010 | 1000 | 2755 | 2.76 | 10,510 | 10.51 | 48,725 | 48.73 | 15,012 | 15.01 |
| 2011 | 1271 | 3351 | 2.64 | 8540 | 6.72 | 59,540 | 46.85 | 18,508 | 14.56 |
| 2012 | 1643 | 4597 | 2.80 | 7730 | 4.70 | 79,657 | 48.48 | 23,716 | 14.43 |
| 2013 | 2080 | 6133 | 2.95 | 4846 | 2.33 | 100,807 | 48.46 | 30,149 | 14.49 |
| 2014 | 2509 | 7605 | 3.03 | 1661 | 0.66 | 121,999 | 48.62 | 35,348 | 14.09 |
| total | 10,042 | 28,517 | — | 50,715 | — | 475,487 | — | 145,453 | — |
| average | 1434.6 | 4073.9 | 2.80 | 7245 | 6.80 | 67,926.7 | 46.50 | 20,779 | 14.60 |
| SCI/SSCI Subject Category | TP (%) |
|---|---|
| Communication | 1439 (14.33) |
| Sociology | 829 (8.26) |
| Public, Environmental & Occupational Health | 735 (7.32) |
| Business | 627 (6.24) |
| Psychology, Multidisciplinary | 575 (5.73) |
| Information Science & Library Science | 563 (5.61) |
| Education & Educational Research | 551 (5.49) |
| Computer Science, Information Systems | 537 (5.35) |
| Management | 479 (4.77) |
| Social Sciences, Interdisciplinary | 429 (4.27) |
| Psychiatry | 335 (3.33) |
| Psychology, Experimental | 274 (2.73) |
| Psychology, Clinical | 269 (2.68) |
| Environmental Studies | 255 (2.54) |
| Political Science | 233 (2.32) |
| Linguistics | 231 (2.30) |
| Environmental Sciences | 222 (2.21) |
| Geography | 213 (2.12) |
| Cultural Studies | 211 (2.10) |
| Health Care Sciences & Services | 211 (2.10) |
| Sub Total | 9218 (91.79) |
| Journals | TP (%) | TC (%) | TC/TP | IF |
|---|---|---|---|---|
| Computers in Human Behavior | 236 (2.35) | 1786 (3.52) | 7.57 | 2.273 |
| New Media & Society | 145 (1.44) | 1220 (2.41) | 8.41 | 2.052 |
| Public Relations Review | 133 (1.32) | 794 (1.57) | 5.97 | 0.755 |
| Information Communication & Society | 130 (1.29) | 629 (1.24) | 4.84 | 1.283 |
| Journal of Medical Internet Research | 107 (1.07) | 764 (1.51) | 7.14 | 4.669 |
| Media Culture & Society | 92 (0.92) | 361 (0.71) | 3.92 | 1.139 |
| Comunicar | 85 (0.84) | 73 (0.14) | 0.86 | 0.35 |
| Journal of Business Ethics | 83 (0.83) | 665 (1.31) | 8.01 | 1.552 |
| American Behavioral Scientist | 74 (0.74) | 438 (0.86) | 5.92 | 0.926 |
| Computers & Education | 55 (0.55) | 739 (1.46) | 13.44 | 2.63 |
| Total | 1140 (11.34) | 7469 (14.73) | ||
| Average | 6.61 | 1.76 |
| DE | GROSS | 2008 | 2009 | 2010 | 2011 | 2012 | 2013 | 2014 | ||||||||||||||||
|---|---|---|---|---|---|---|---|---|---|---|---|---|---|---|---|---|---|---|---|---|---|---|---|---|
| N | R | P (%) | N | R | P (%) | N | R | P (%) | N | R | P (%) | N | R | P (%) | N | R | P (%) | N | R | P (%) | N | R | P (%) | |
| social networking | 427 | 1 | 0.78 | 20 | 3 | 2 (0.54) | 27 | 3 | 1 (0.63) | 34 | 3 | 1 (0.63) | 64 | 3 | 1 (0.93) | 79 | 2 | 1 (0.88) | 90 | 4 | 3 (0.79) | 113 | 4 | 3 (0.81) |
| Internet | 395 | 2 | 0.72 | 24 | 2 | 1 (0.65) | 27 | 2 | 1 (0.63) | 32 | 4 | 2 (0.60) | 42 | 4 | 2 (0.61) | 59 | 4 | 2 (0.65) | 100 | 2 | 1 (0.88) | 111 | 5 | 4 (0.80) |
| Facebook ↑ | 299 | 3 | 0.55 | - | - | - | 5 | 69 | 22 (0.12) | 4 | 96 | 27 (0.07) | 20 | 11 | 8 (0.29) | 56 | 5 | 3 (0.62) | 91 | 3 | 2 (0.80) | 123 | 3 | 2 (0.88) |
| Twitter ↑ | 288 | 4 | 0.53 | - | - | - | 1 | 773 | 30 (0.02) | 3 | 206 | 29 (0.06) | 19 | 12 | 10 (0.28) | 48 | 6 | 4 (0.53) | 87 | 5 | 4 (0.76) | 130 | 2 | 1 (0.93) |
| Adolescents | 228 | 5 | 0.42 | 20 | 4 | 2 (0.54) | 21 | 5 | 3 (0.49) | 26 | 6 | 4 (0.49) | 31 | 6 | 4 (0.45) | 33 | 8 | 6 (0.37) | 38 | 9 | 7 (0.33) | 59 | 7 | 5 (0.42) |
| Youth | 193 | 6 | 0.35 | 8 | 17 | 13 (0.22) | 12 | 15 | 11 (0.28) | 28 | 5 | 3 (0.52) | 29 | 8 | 6 (0.42) | 28 | 10 | 8 (0.31) | 45 | 7 | 5 (0.40) | 43 | 10 | 8 (0.31) |
| Web 2.0 | 183 | 7 | 0.34 | 6 | 28 | 20 (0.16) | 7 | 30 | 18 (0.16) | 15 | 11 | 9 (0.28) | 32 | 5 | 3 (0.47) | 47 | 7 | 5 (0.52) | 35 | 12 | 10 (0.31) | 41 | 11 | 9 (0.29) |
| gender | 164 | 8 | 0.30 | 12 | 6 | 5 (0.33) | 16 | 7 | 5 (0.37) | 20 | 8 | 6 (0.37) | 30 | 7 | 5 (0.44) | 21 | 14 | 12 (0.23) | 36 | 10 | 8 (0.32) | 29 | 18 | 16 (0.21) |
| mass media | 161 | 9 | 0.30 | 17 | 5 | 4 (0.46) | 21 | 6 | 3 (0.49) | 22 | 7 | 5 (0.41) | 23 | 9 | 7 (0.34) | 28 | 11 | 8 (0.31) | 28 | 13 | 11 (0.25) | 22 | 25 | 20 (0.16) |
| communication ↑ | 137 | 10 | 0.25 | 4 | 51 | 23 (0.11) | 12 | 16 | 11 (0.28) | 9 | 22 | 17 (0.17) | 15 | 17 | 14 (0.22) | 16 | 21 | 17 (0.18) | 36 | 11 | 8 (0.32) | 45 | 9 | 7 (0.32) |
| new media | 132 | 11 | 0.24 | 5 | 34 | 22 (0.14) | 14 | 11 | 7 (0.32) | 8 | 29 | 22 (0.15) | 15 | 19 | 14 (0.22) | 31 | 9 | 7 (0.34) | 20 | 22 | 18 (0.18) | 39 | 12 | 10 (0.28) |
| social networking sites ↑ | 131 | 12 | 0.24 | - | - | - | 3 | 179 | 29 (0.07) | 5 | 79 | 26 (0.09) | 12 | 28 | 22 (0.17) | 21 | 15 | 12 (0.23) | 39 | 8 | 6 (0.34) | 51 | 8 | 6 (0.37) |
| social capital | 122 | 13 | 0.22 | 12 | 7 | 5 (0.33) | 12 | 13 | 11 (0.28) | 17 | 9 | 7 (0.32) | 12 | 27 | 22 (0.17) | 15 | 28 | 20 (0.17) | 26 | 15 | 13 (0.23) | 28 | 20 | 17 (0.20) |
| social movements | 118 | 14 | 0.22 | 6 | 29 | 20 (0.16) | 6 | 37 | 19 (0.14) | 9 | 24 | 17 (0.17) | 18 | 14 | 11 (0.26) | 22 | 13 | 11 (0.24) | 24 | 18 | 16 (0.21) | 33 | 15 | 13 (0.24) |
| Identity | 117 | 15 | 0.21 | 11 | 9 | 8 (0.30) | 14 | 9 | 7 (0.32) | 6 | 51 | 25 (0.11) | 20 | 10 | 8 (0.29) | 25 | 12 | 10 (0.28) | 22 | 19 | 17 (0.19) | 19 | 30 | 22 (0.14) |
| China ↑ | 112 | 16 | 0.21 | 1 | 353 | 26 (0.03) | 9 | 24 | 16 (0.21) | 12 | 17 | 12 (0.22) | 13 | 25 | 20 (0.19) | 18 | 16 | 14 (0.20) | 21 | 21 | 18 (0.18) | 38 | 13 | 11 (0.27) |
| Content analysis | 112 | 17 | 0.21 | 12 | 8 | 5 (0.33) | 6 | 34 | 19 (0.14) | 12 | 18 | 12 (0.22) | 7 | 58 | 30 (0.10) | 18 | 17 | 14 (0.20) | 27 | 14 | 12 (0.24) | 30 | 17 | 15 (0.22) |
| technology | 110 | 18 | 0.20 | 7 | 10 | 15 (0.19) | 4 | 8 | 27 (0.09) | 7 | 19 | 23 (0.13) | 16 | 13 | 13 (0.23) | 16 | 25 | 17 (0.18) | 25 | 31 | 14 (0.22) | 35 | 22 | 12 (0.25) |
| television | 110 | 19 | 0.20 | 11 | 21 | 8 (0.30) | 15 | 73 | 6 (0.35) | 11 | 42 | 15 (0.21) | 18 | 15 | 11 (0.26) | 15 | 20 | 20 (0.17) | 16 | 16 | 25 (0.14) | 24 | 14 | 19 (0.17) |
| Corporate social responsibility | 97 | 21 | 0.18 | 7 | 22 | 15 (0.19) | 14 | 10 | 7 (0.32) | 12 | 15 | 12 (0.22) | 14 | 22 | 18 (0.20) | 15 | 26 | 20 (0.17) | 19 | 23 | 20 (0.17) | 16 | 44 | 28 (0.11) |
| children | 99 | 20 | 0.18 | 10 | 12 | 10 (0.27) | 12 | 14 | 11 (0.28) | 14 | 12 | 10 (0.26) | 14 | 21 | 18 (0.20) | 16 | 22 | 17 (0.18) | 16 | 30 | 25 (0.14) | 17 | 37 | 26 (0.12) |
| Education | 96 | 22 | 0.18 | 7 | 23 | 15 (0.19) | 5 | 49 | 22 (0.12) | 9 | 26 | 17 (0.17) | 9 | 41 | 28 (0.13) | 17 | 18 | 16 (0.19) | 17 | 28 | 24 (0.15) | 32 | 16 | 14 (0.23) |
| discourse ↓ | 84 | 23 | 0.15 | 9 | 15 | 12 (0.25) | 13 | 12 | 10 (0.30) | 16 | 10 | 8 (0.30) | 11 | 29 | 24 (0.16) | 10 | 53 | 25 (0.11) | 13 | 42 | 28 (0.11) | 12 | 64 | 29 (0.09) |
| Ethics | 82 | 24 | 0.15 | 8 | 18 | 13 (0.22) | 6 | 35 | 19 (0.14) | 9 | 23 | 17 (0.17) | 13 | 26 | 20 (0.19) | 15 | 27 | 20 (0.17) | 14 | 36 | 27 (0.12) | 17 | 38 | 26 (0.12) |
| Public health | 81 | 25 | 0.15 | 4 | 52 | 23 (0.11) | 9 | 21 | 16 (0.21) | 4 | 92 | 27 (0.07) | 10 | 36 | 25 (0.15) | 9 | 67 | 28 (0.10) | 25 | 17 | 14 (0.22) | 20 | 28 | 22 (0.14) |
| risk | 80 | 26 | 0.15 | 10 | 13 | 10 (0.27) | 5 | 48 | 22 (0.12) | 9 | 25 | 17 (0.17) | 15 | 18 | 14 (0.22) | 10 | 51 | 25 (0.11) | 18 | 26 | 22 (0.16) | 13 | 53 | 29 (0.09) |
| culture | 80 | 27 | 0.15 | 1 | 354 | 26 (0.03) | 10 | 19 | 15 (0.23) | 14 | 13 | 10 (0.26) | 15 | 16 | 14 (0.22) | 9 | 65 | 28 (0.10) | 13 | 43 | 28 (0.11) | 18 | 34 | 25 (0.13) |
| Climate change ↑ | 79 | 28 | 0.14 | 4 | 53 | 23 (0.11) | 5 | 55 | 22 (0.12) | 3 | 148 | 29 (0.06) | 10 | 37 | 25 (0.15) | 15 | 29 | 20 (0.17) | 19 | 24 | 20 (0.17) | 23 | 24 | 20 (0.16) |
| journalism | 78 | 29 | 0.14 | 7 | 24 | 15 (0.19) | 5 | 61 | 22 (0.12) | 11 | 20 | 15 (0.21) | 9 | 44 | 28 (0.13) | 9 | 75 | 28 (0.10) | 18 | 27 | 22 (0.16) | 19 | 32 | 22 (0.14) |
| Trust | 75 | 30 | 0.14 | 7 | 22 | 15 (0.19) | 4 | 75 | 27 (0.09) | 7 | 45 | 23 (0.13) | 10 | 35 | 25 (0.15) | 10 | 51 | 25 (0.11) | 11 | 62 | 30 (0.10) | 26 | 21 | 18 (0.19) |
© 2017 by the authors. Licensee MDPI, Basel, Switzerland. This article is an open access article distributed under the terms and conditions of the Creative Commons Attribution (CC BY) license ( http://creativecommons.org/licenses/by/4.0/).
Share and Cite
Li, Q.; Wei, W.; Xiong, N.; Feng, D.; Ye, X.; Jiang, Y. Social Media Research, Human Behavior, and Sustainable Society. Sustainability 2017, 9, 384. https://doi.org/10.3390/su9030384
Li Q, Wei W, Xiong N, Feng D, Ye X, Jiang Y. Social Media Research, Human Behavior, and Sustainable Society. Sustainability. 2017; 9(3):384. https://doi.org/10.3390/su9030384
Chicago/Turabian StyleLi, Quan, Wenbo Wei, Nian Xiong, Daici Feng, Xinyue Ye, and Yongsheng Jiang. 2017. "Social Media Research, Human Behavior, and Sustainable Society" Sustainability 9, no. 3: 384. https://doi.org/10.3390/su9030384