1. Introduction
The planet is facing a dramatic climate change problem [
1] and fossil fuel-based CO
2 emissions are a limiting constraint for usage of fossil fuels in the long-term [
2,
3]. In the past years, voluntary and mandatory regulations have been set to limit fossil fuel emissions at different levels. Based on the COP21 Paris agreement, some certain countries, if not all, have to aim to reach a net zero emissions system by 2050 [
4]. This means, in these countries, fossil fuel consumption could be completely banned, in particular since natural negative emissions such as growing forests are very limited and carbon capture and storage (CCS) technology is high in cost and risky [
5]. At the very least, this will result in drastic reductions in the consumption of fossil fuels. Europe has been a leader for this trend in the last decade and is expected to remain as one of the first places for the implementation of new solutions.
To reach the goal of net zero emissions, fossil fuel-based energy demand could be mainly replaced by renewable electricity (RE). However, there are sectors such as aviation, shipping, heavy transportation and non-energetic use of fossil fuels for which hydrocarbons cannot be replaced by electricity easily, or physically not at all. Biofuel production is faced with resource limitations and conflicts with food production and, therefore, offers no substantial substitute [
6,
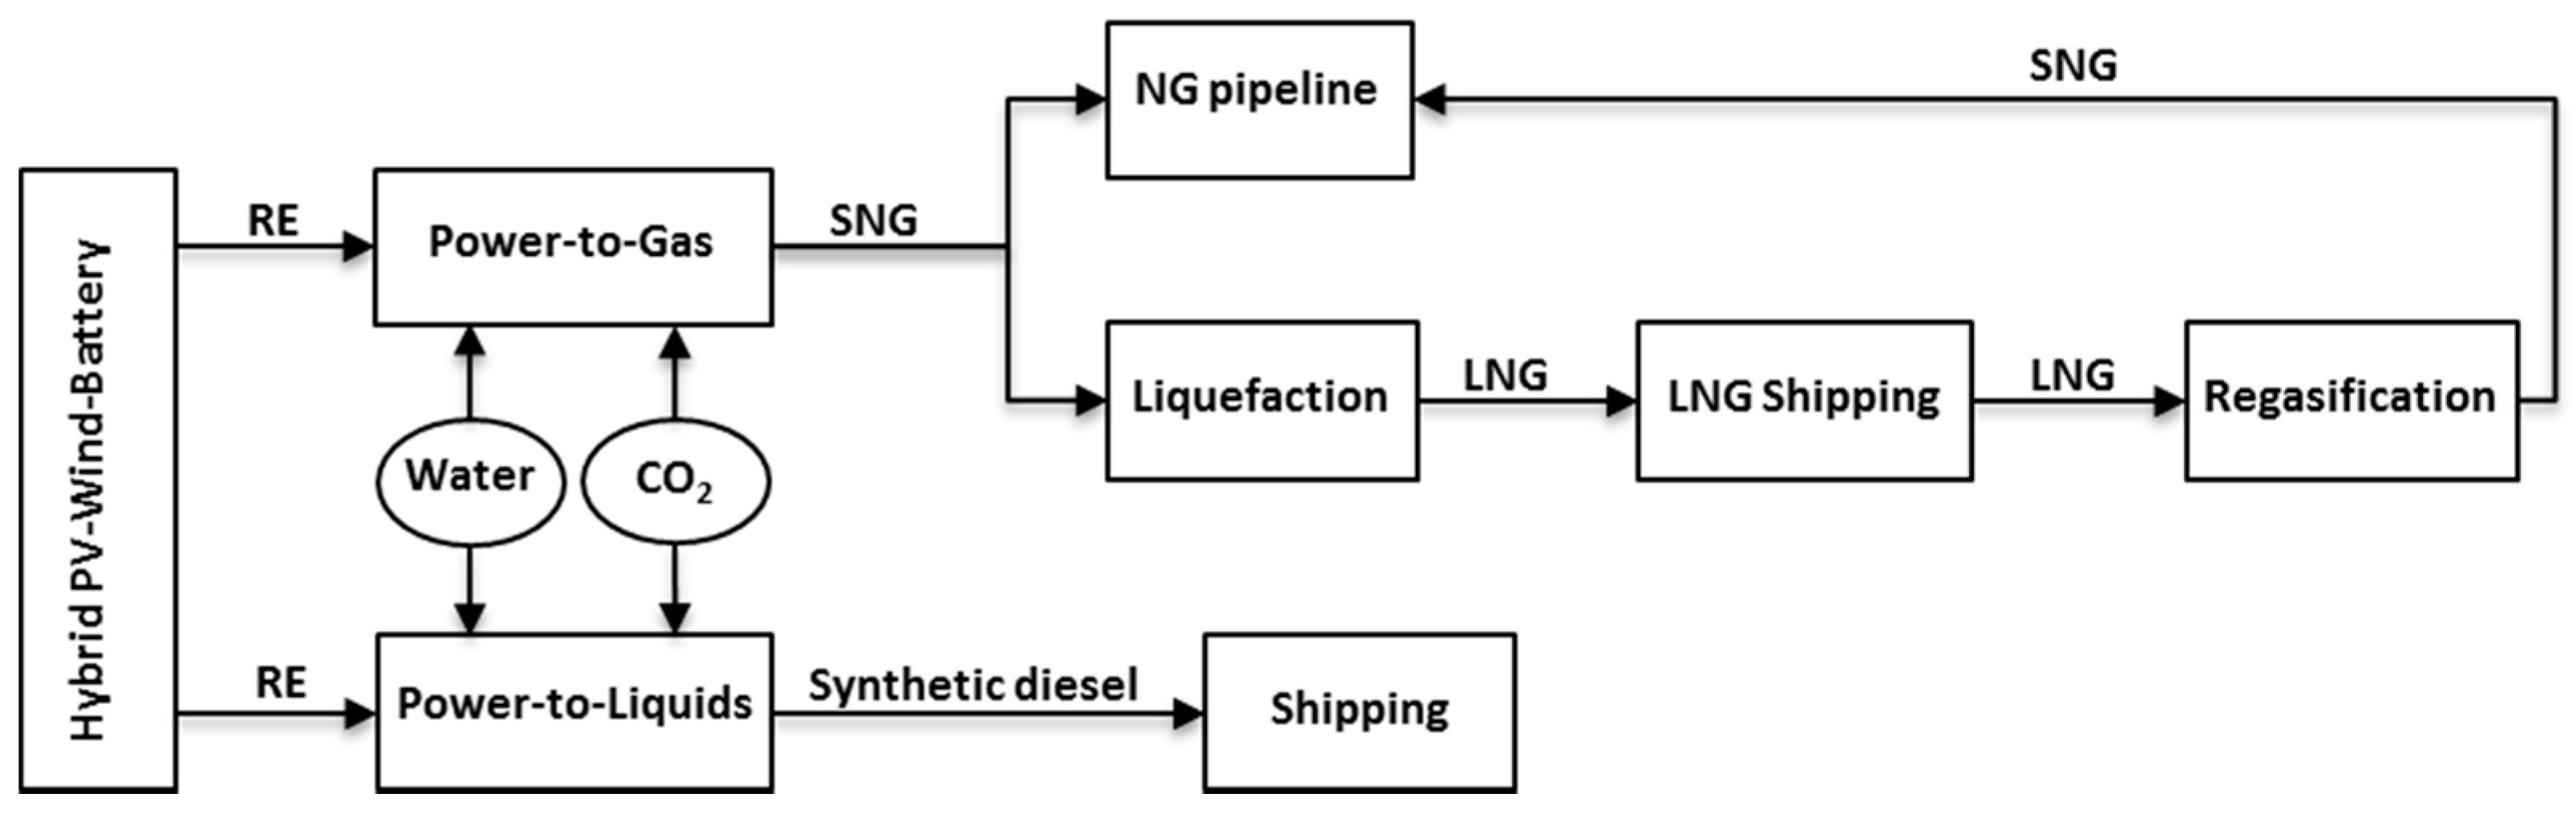
7]. Net zero emissions could be achieved by a recarbonization of the energy system, whereby carbon from fossil sources is replaced by that which is created synthetically and sustainably, by the aid of RE. These RE-based fuels are carbon neutral and can be used in the current fossil fuel-based infrastructure. There are several technical options to produce hydrocarbon fuels based on hybrid PV–Wind power plants for the transport and mobility sector: mainly RE-power-to-gas (PtG) [
8], liquefied natural gas (LNG) based on RE-PtG [
9], and RE-power-to-liquids (PtL) [
10].
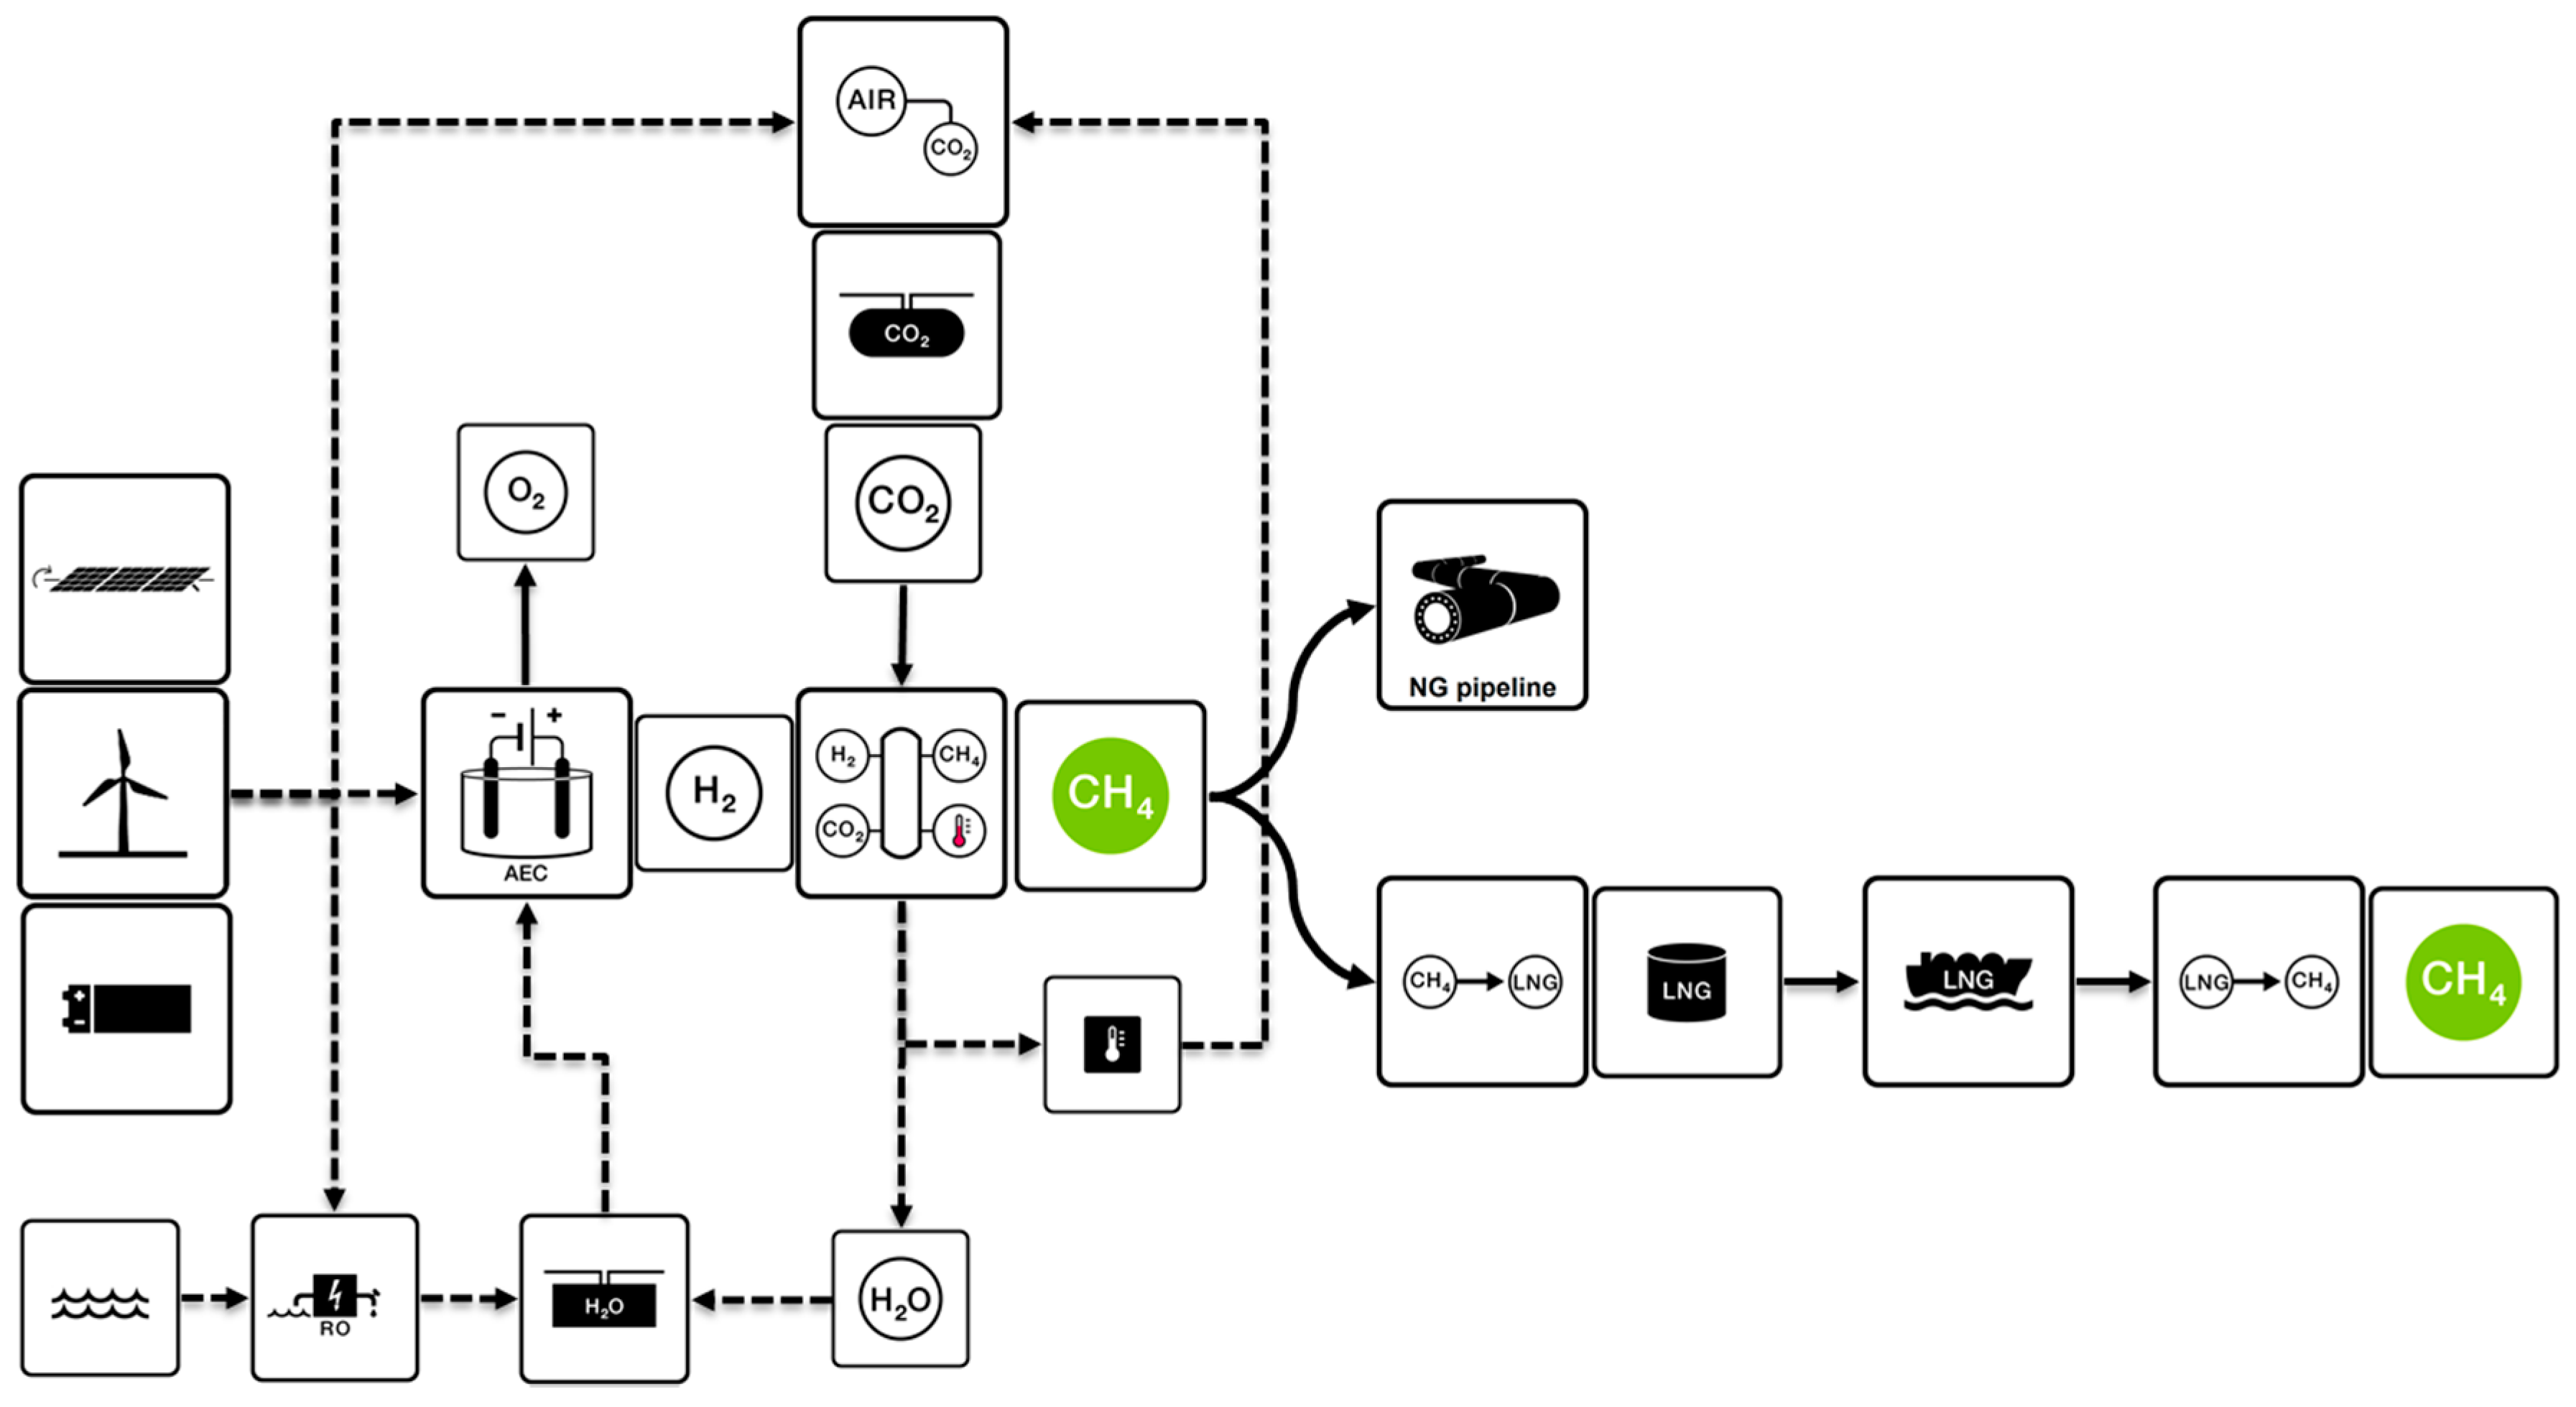
Figure 1 illustrates a very simplified version of these value chains.
However, either Europe may not have the RE-based power potential to answer this demand due to area limitations, or the final production cost could be too expensive. The Maghreb region (Algeria, Libya, Mauritania, Morocco, Tunisia and Western Sahara), with a high potential of solar energy and, to a lesser degree, wind power, can act as a carbon neutral oil well in the vicinity of Europe which can export a wide range of carbon neutral hydrocarbons for the least transportation cost. RE-SNG can be injected into the European gas grid through the natural gas (NG) pipelines connecting the Maghreb region to Southern Europe or liquefied into LNG and shipped to Northern Europe. RE-diesel and RE-jet fuel can be also shipped to European ports. This article investigates the production potential of these approaches and the corresponding cost, in 2030 and 2040, based on Maghreb region’s solar and wind potential. The article is structured into the following sections: Materials and Methods, Results, Discussion and Conclusions.
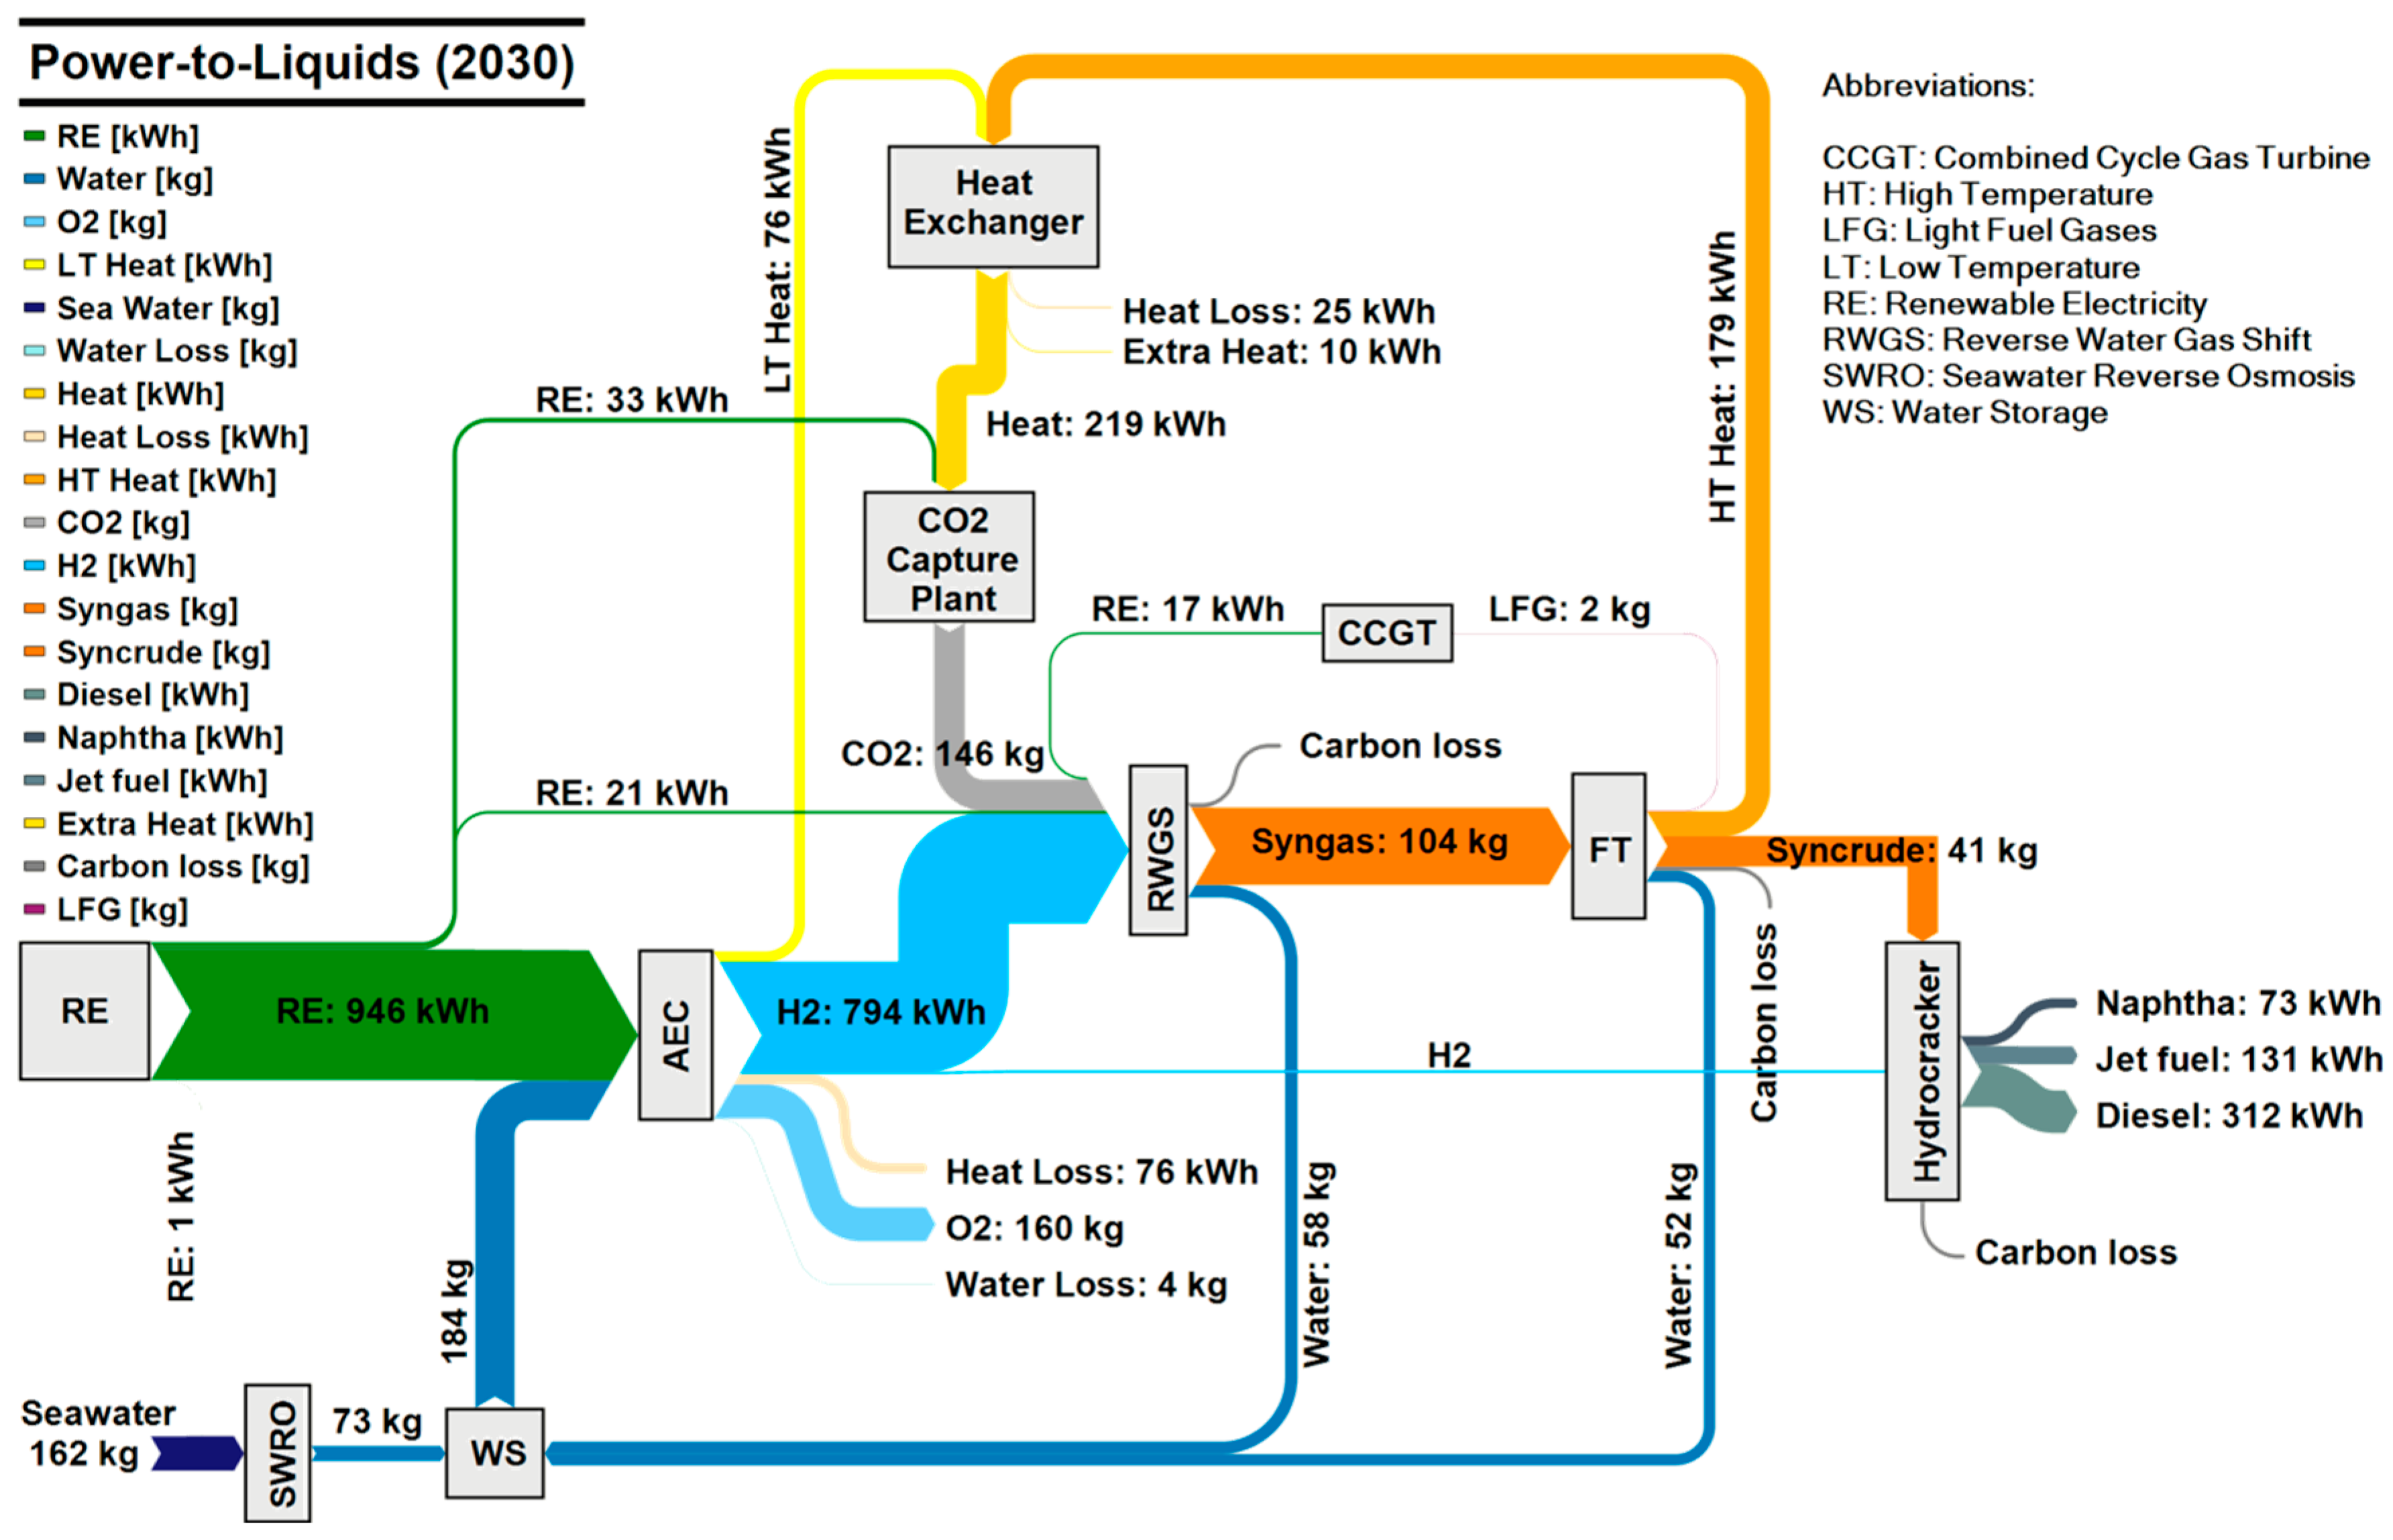
2. Materials and Methods
The methodology used in this article for the PtG–LNG and PtL value chains is fully explained in Fasihi et al. [
9] and Fasihi et al. [
10], respectively. As a summary, an updated version of the main topics has been reviewed here.
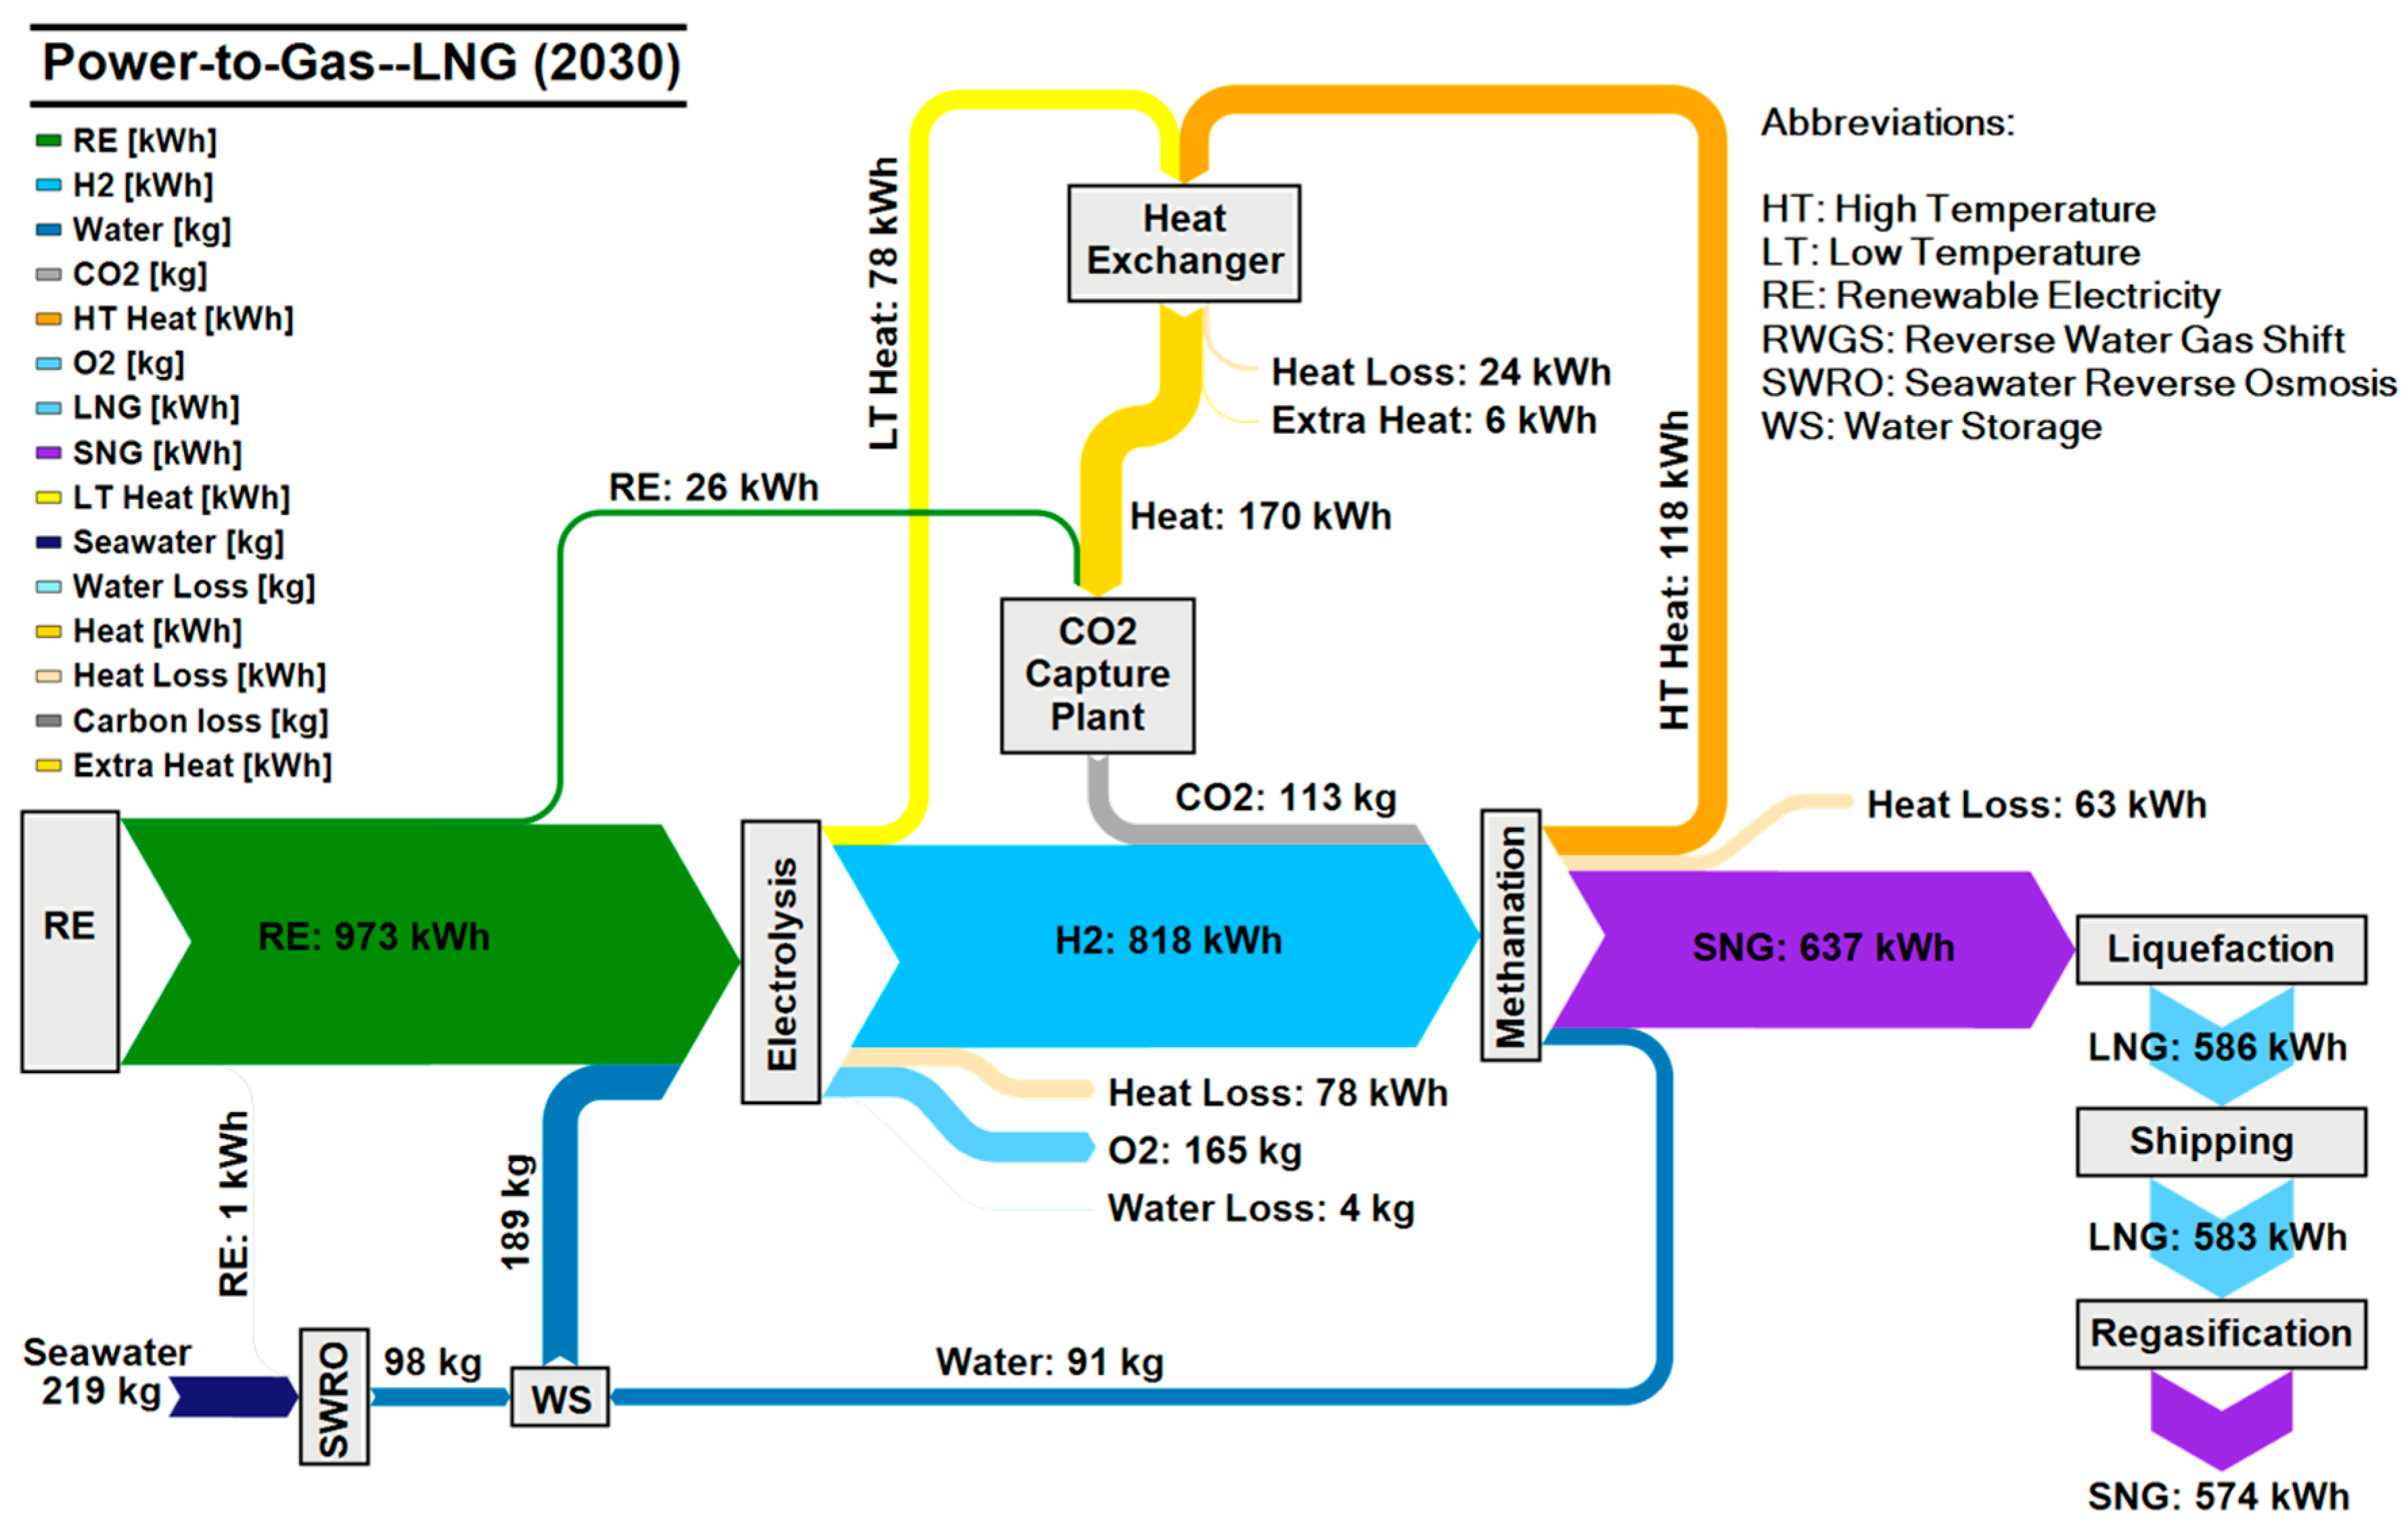
The RE-PtG–LNG simplified value chain is illustrated in
Figure 2. The main components are: hybrid PV–Wind power plants, electrolyser and methanation plants, CO
2 from direct air capture units, liquefaction to LNG, LNG shipping, and regasification. Electrolyser and methanation plants are coupled and will work simultaneously and with an SNG storage system; the liquefaction plant can run as base load. To have a sustainable energy system with carbon neutral products, atmospheric CO
2 is used, which is independent of the location. The output heat of the electrolysis and methanation is used to fulfill the heat demand of the CO
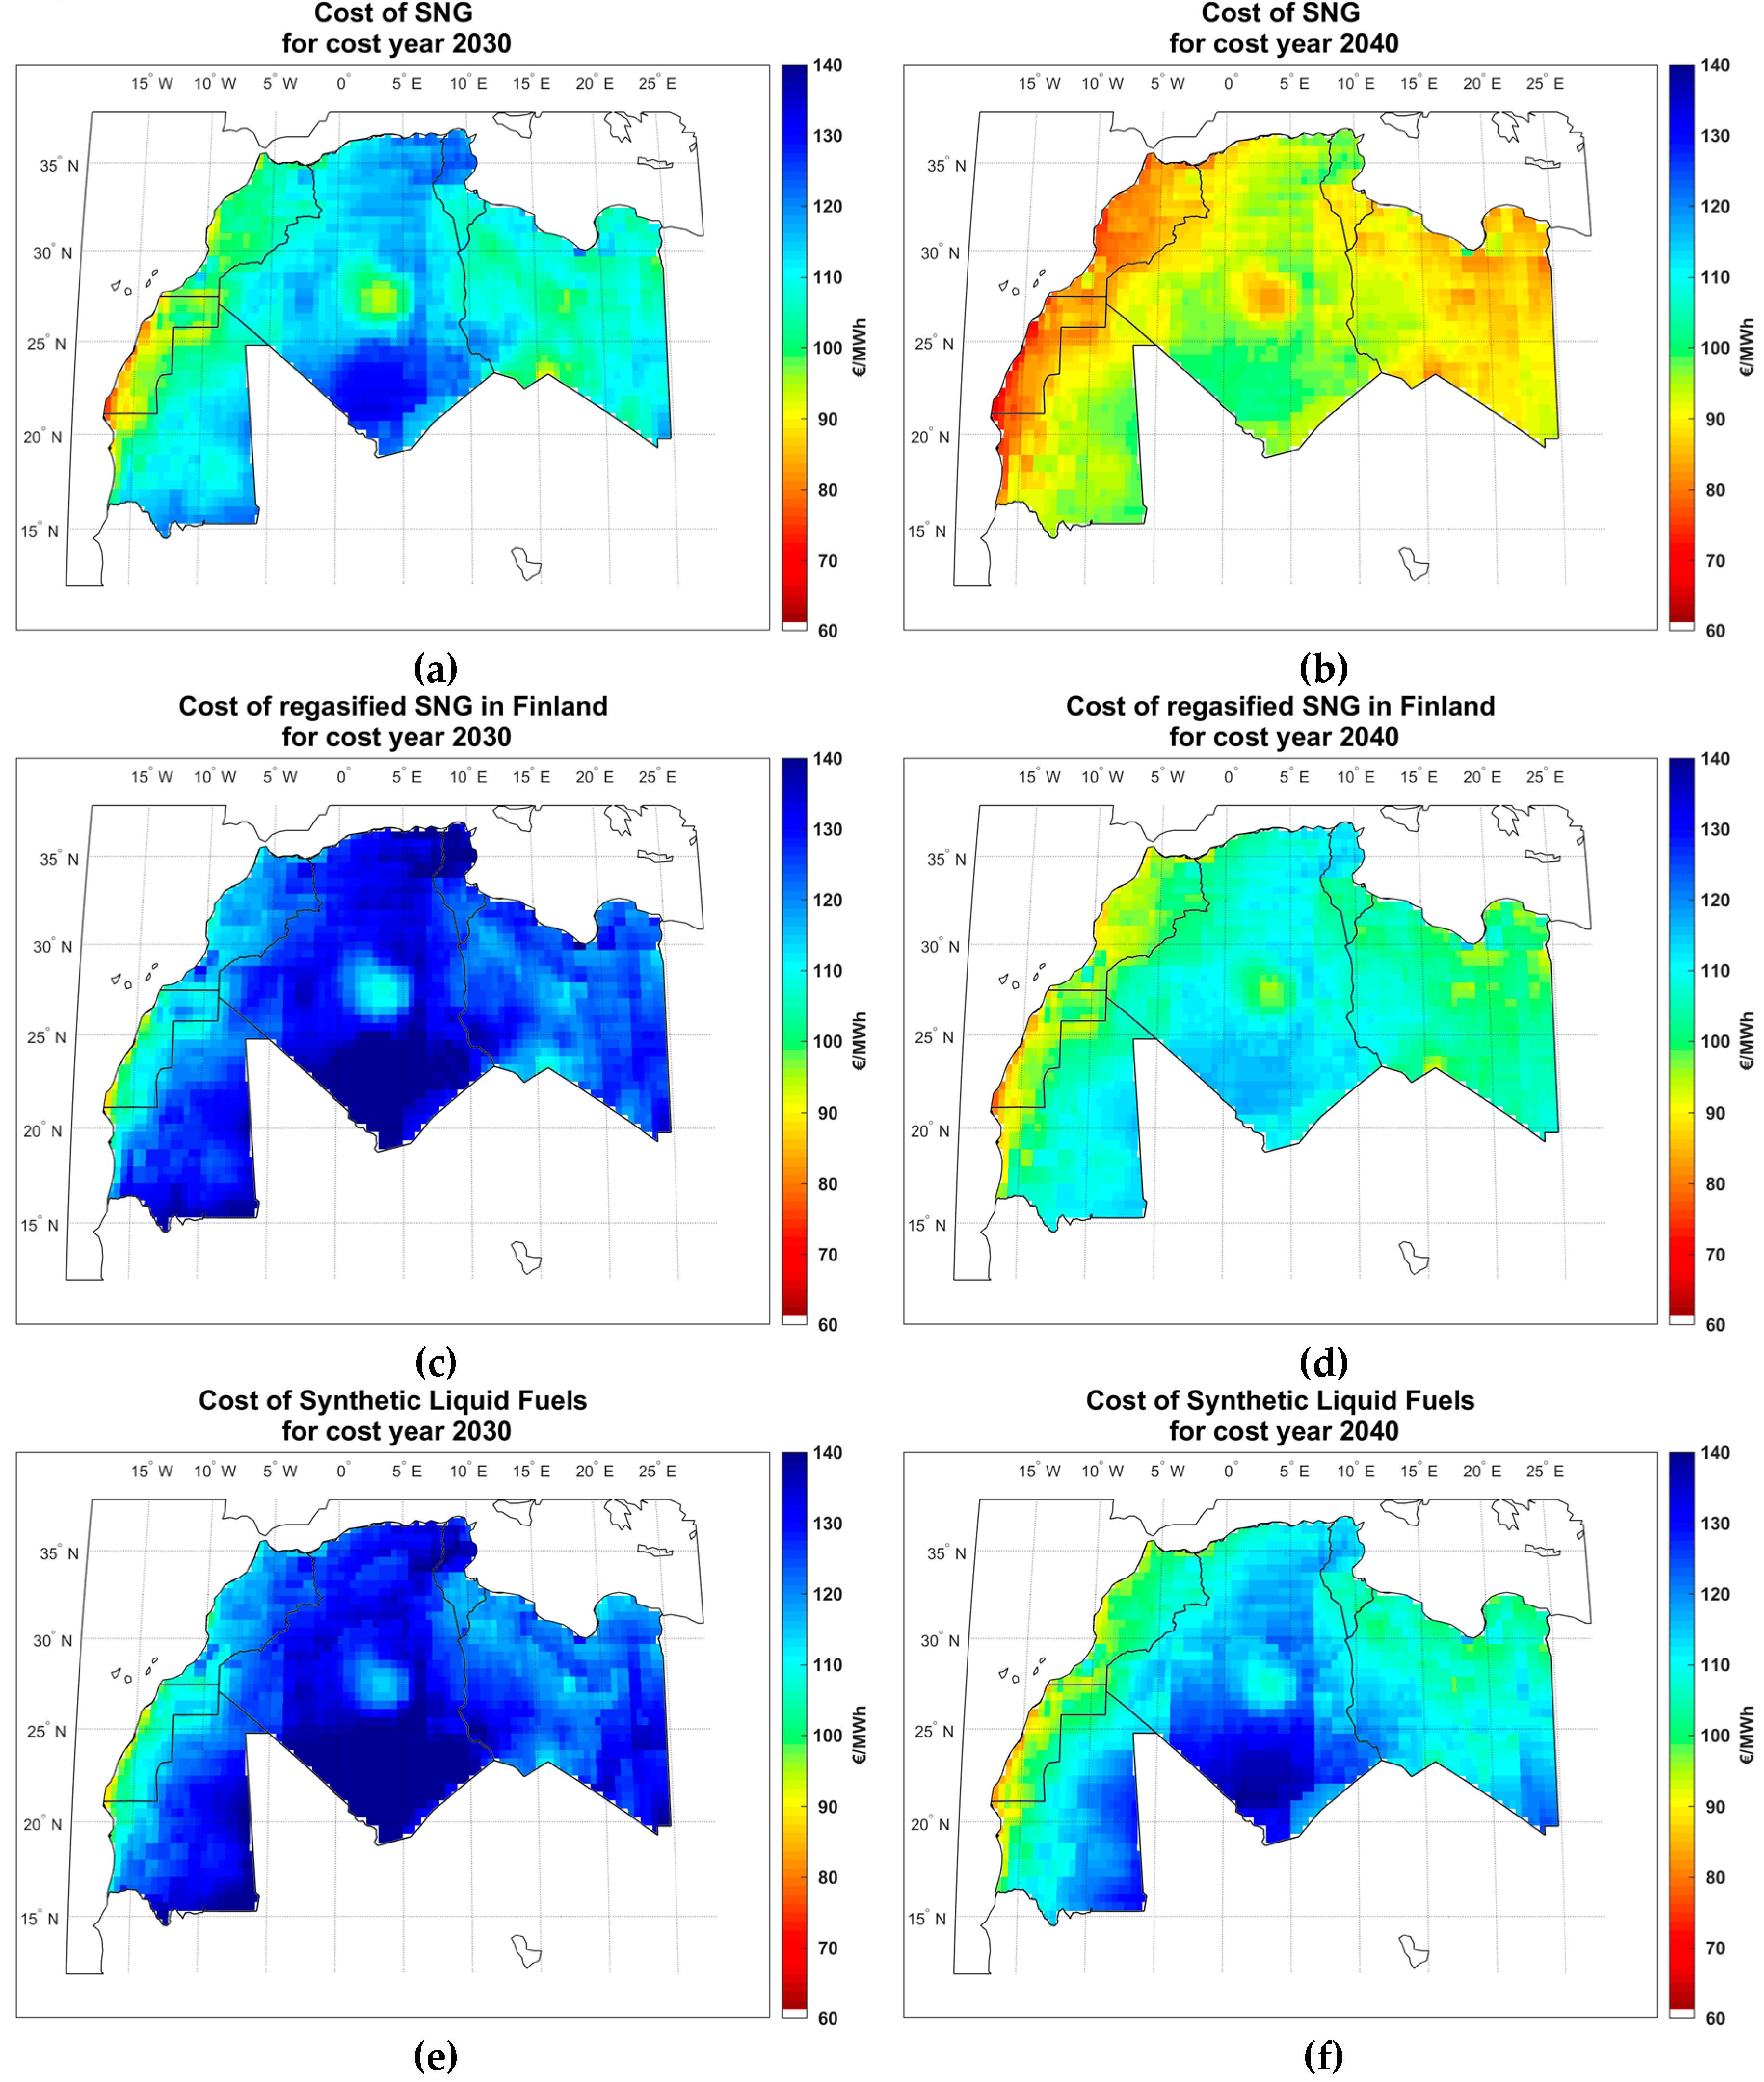
2 capture plant, which increases the overall efficiency of the system. The water demand is supplied by seawater reverse osmosis (SWRO) desalination and the recycled water from the methanation process. As a case study, Finland has been chosen as the long distance market for SNG, where the LNG value chain (liquefaction, shipping and regasification) cost has been applied.
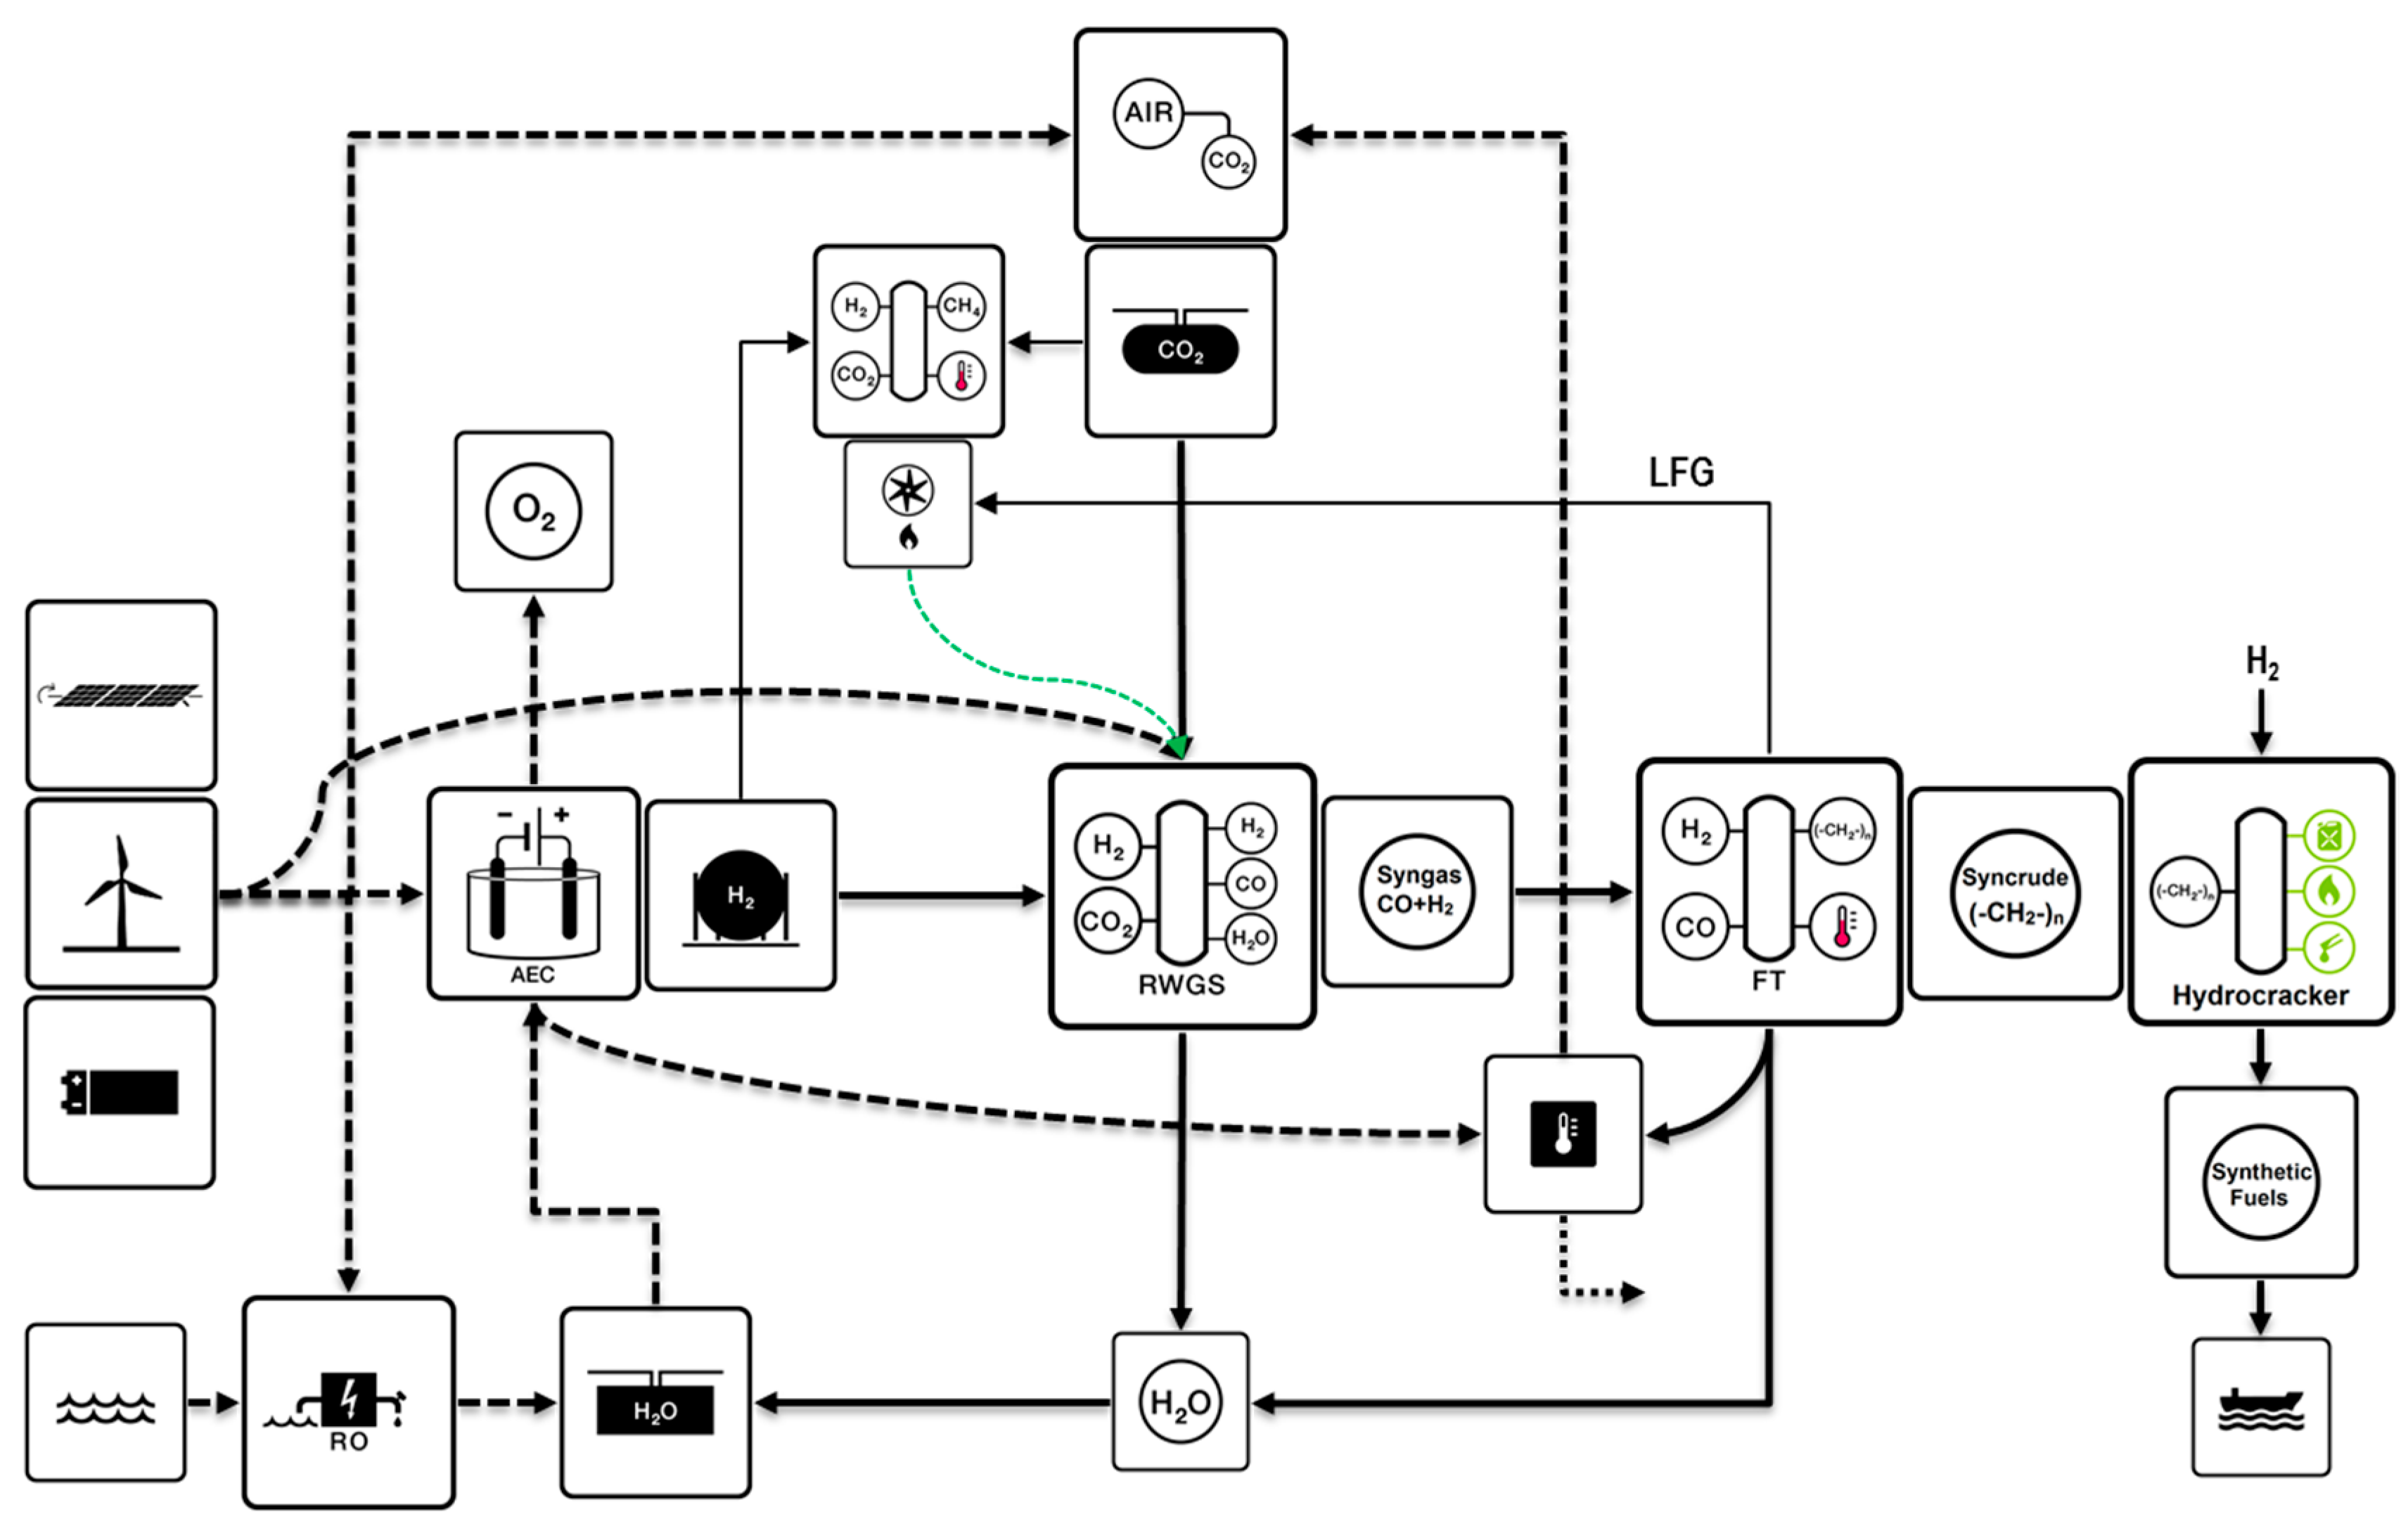
Figure 3 delineates the RE-PtL value chain. The main components are: hybrid PV–Wind power plants, electrolyser and reverse water-gas shift (RWGS) plants, CO
2 from direct air capture units, Fischer–Tropsch (FT) plant, product upgrading unit and fuel shipping. Hydrogen and CO
2 storage systems will guarantee the feedstock for operation of the RWGS plant and subsequently the Fischer–Tropsch plant as base load. The light fuel gases (LFG) (C
1–C
4) account for 5% (mass) of FT plant output [
11]. The LFG and SNG produced in a methanation plant can be combusted to generate electricity via a combined cycle gas turbine (CCGT) as a backup system for the constant electricity demand of the RWGS unit. The integrated system introduces some potentials for the utilization of waste energy, which will increase the overall efficiency and will decrease the costs. Aiming for the maximum middle distillates share, the numbers provided by FVV [
12] have been used for the model of this paper, and represent naphtha, jet fuel and diesel with a share of 15%, 25% and 60%, respectively.
The key specification of the PtG and PtL, LNG value chain, and the feedstock (CO
2 and water) plants are shown in
Table 1,
Table 2 and
Table 3, respectively. The currency exchange rate is the long-term average 1.35 USD/€, and the currency year for all the financial numbers and generated results is 2015. Abbreviations: capital expenditures, Capex, fixed operational expenditures, Opex
fix, variable operational expenditures, Opex
var, electricity, el, higher heating value, HHV, efficiency, eff., hydrogen, H
2, tonne, t, barrel per day, bpd, thousand euros, k€, per annum, p.a., million, m, million cubic meter, mcm.
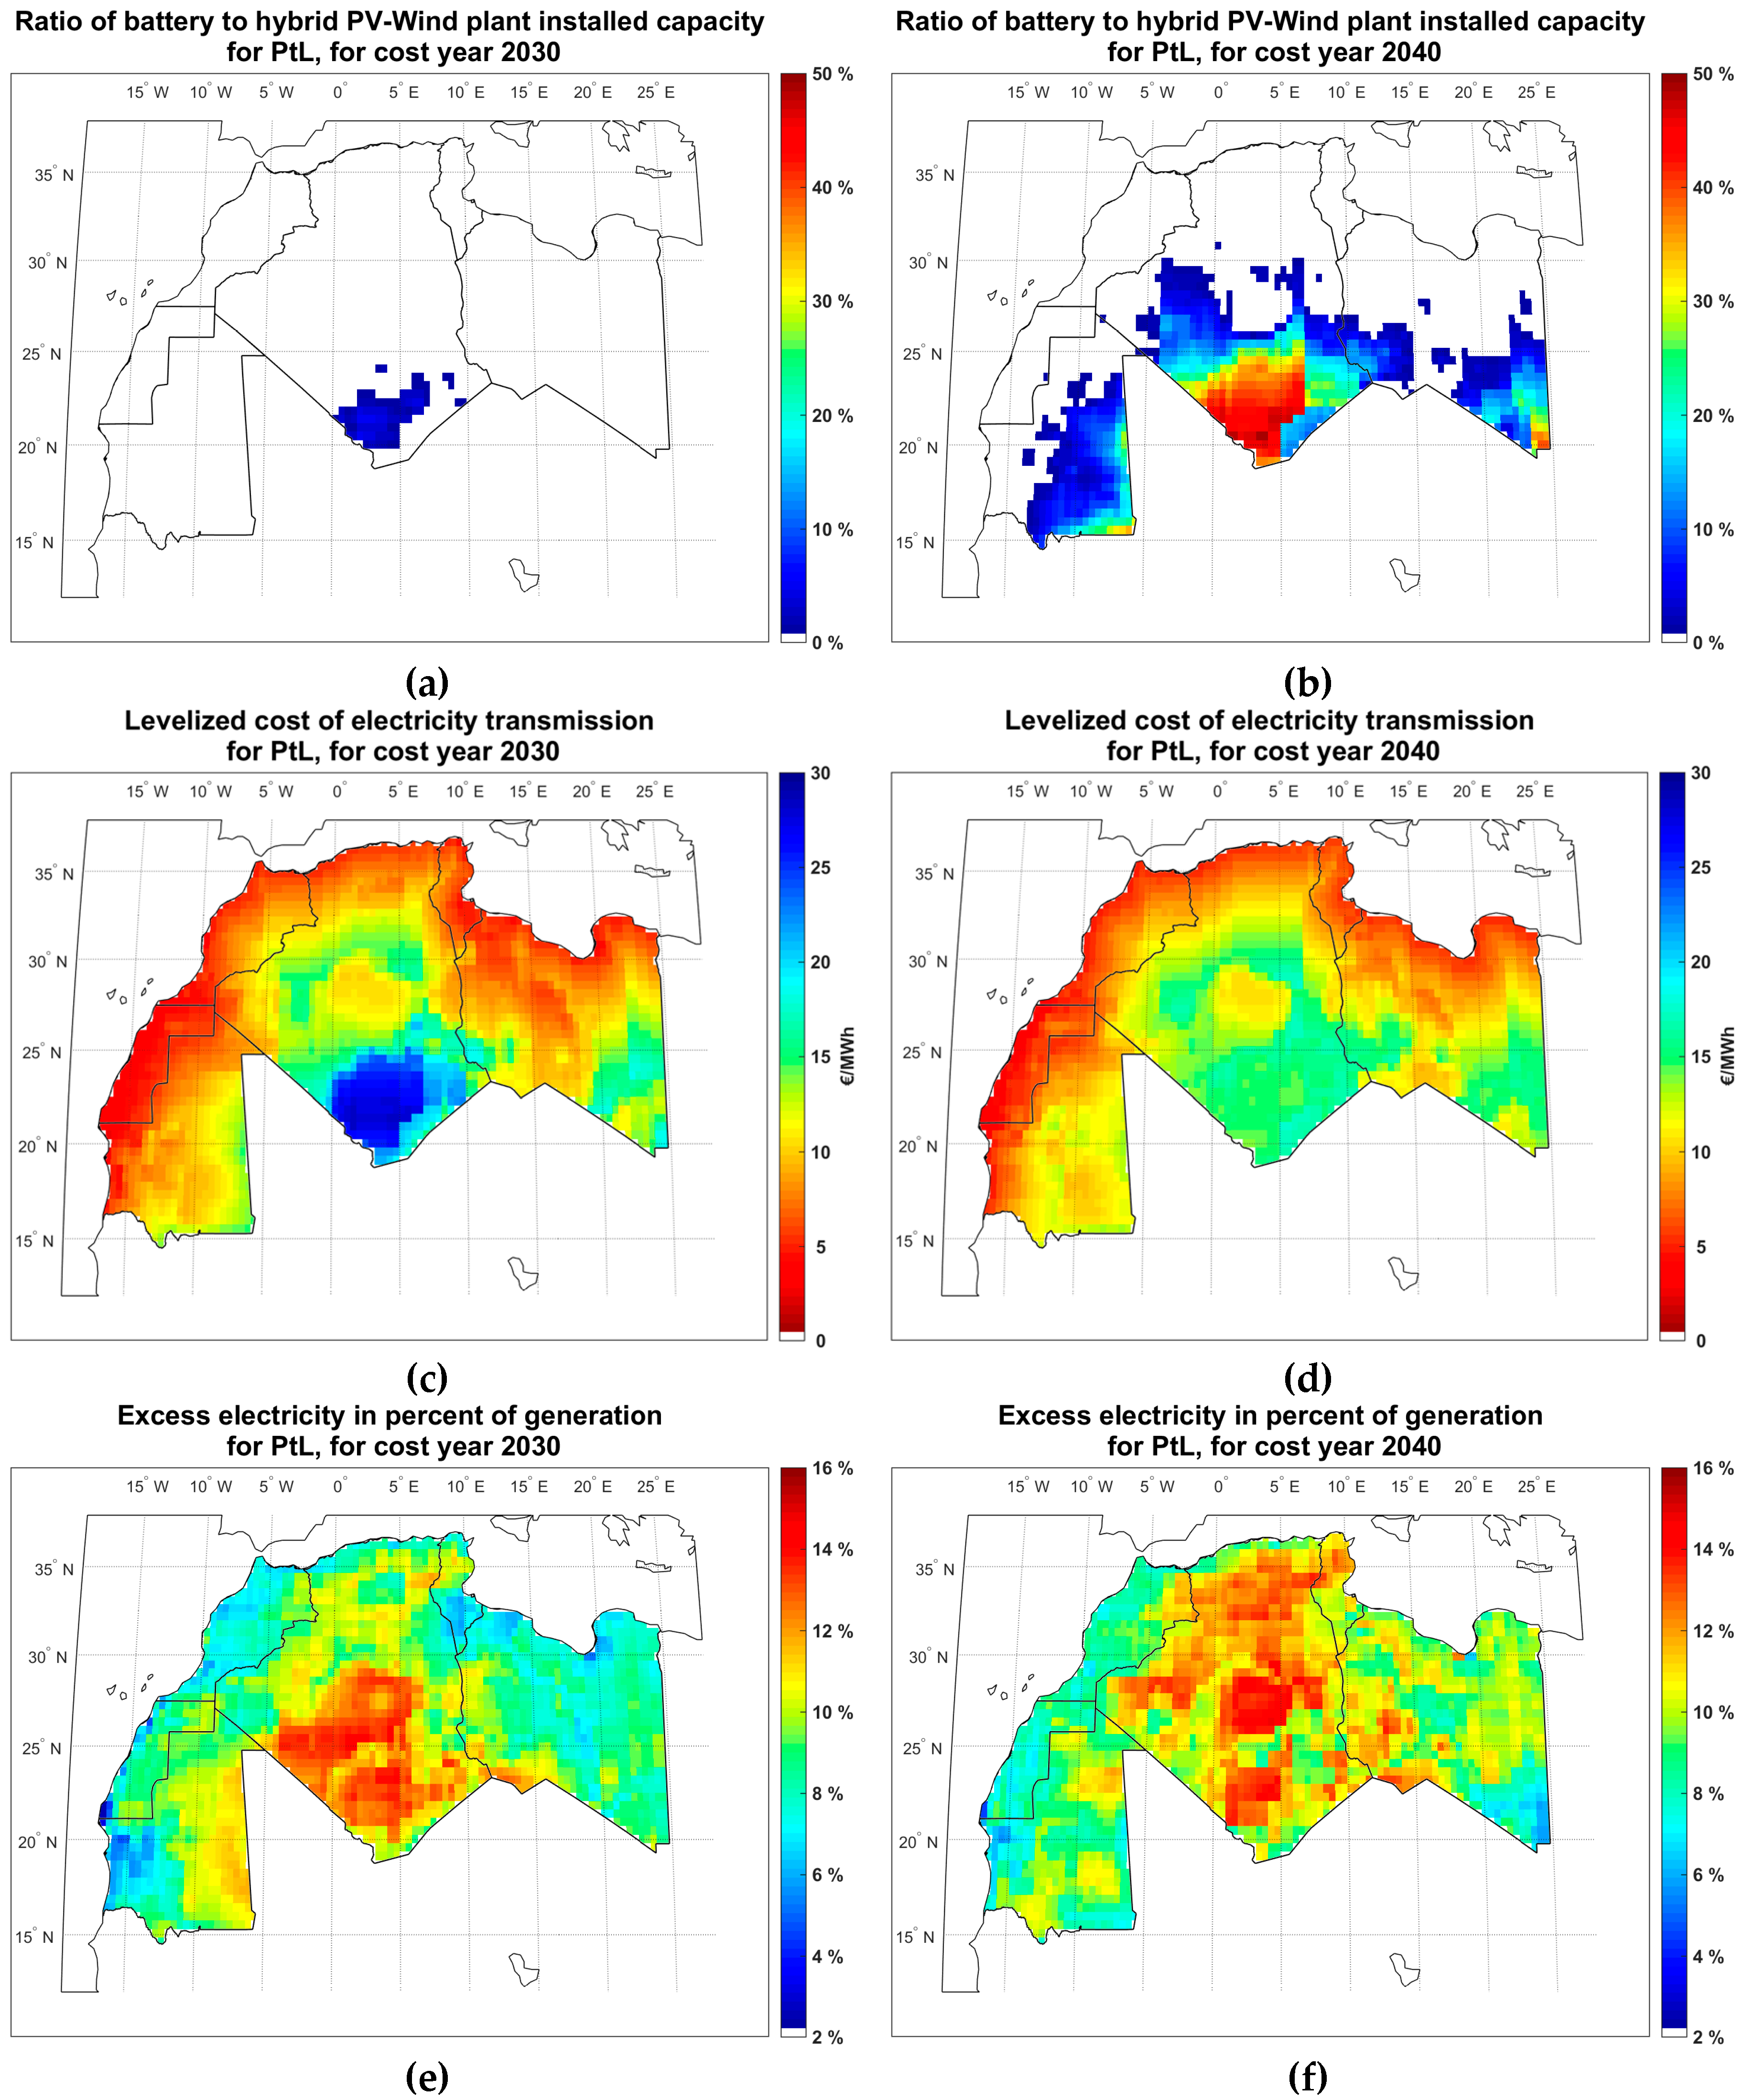
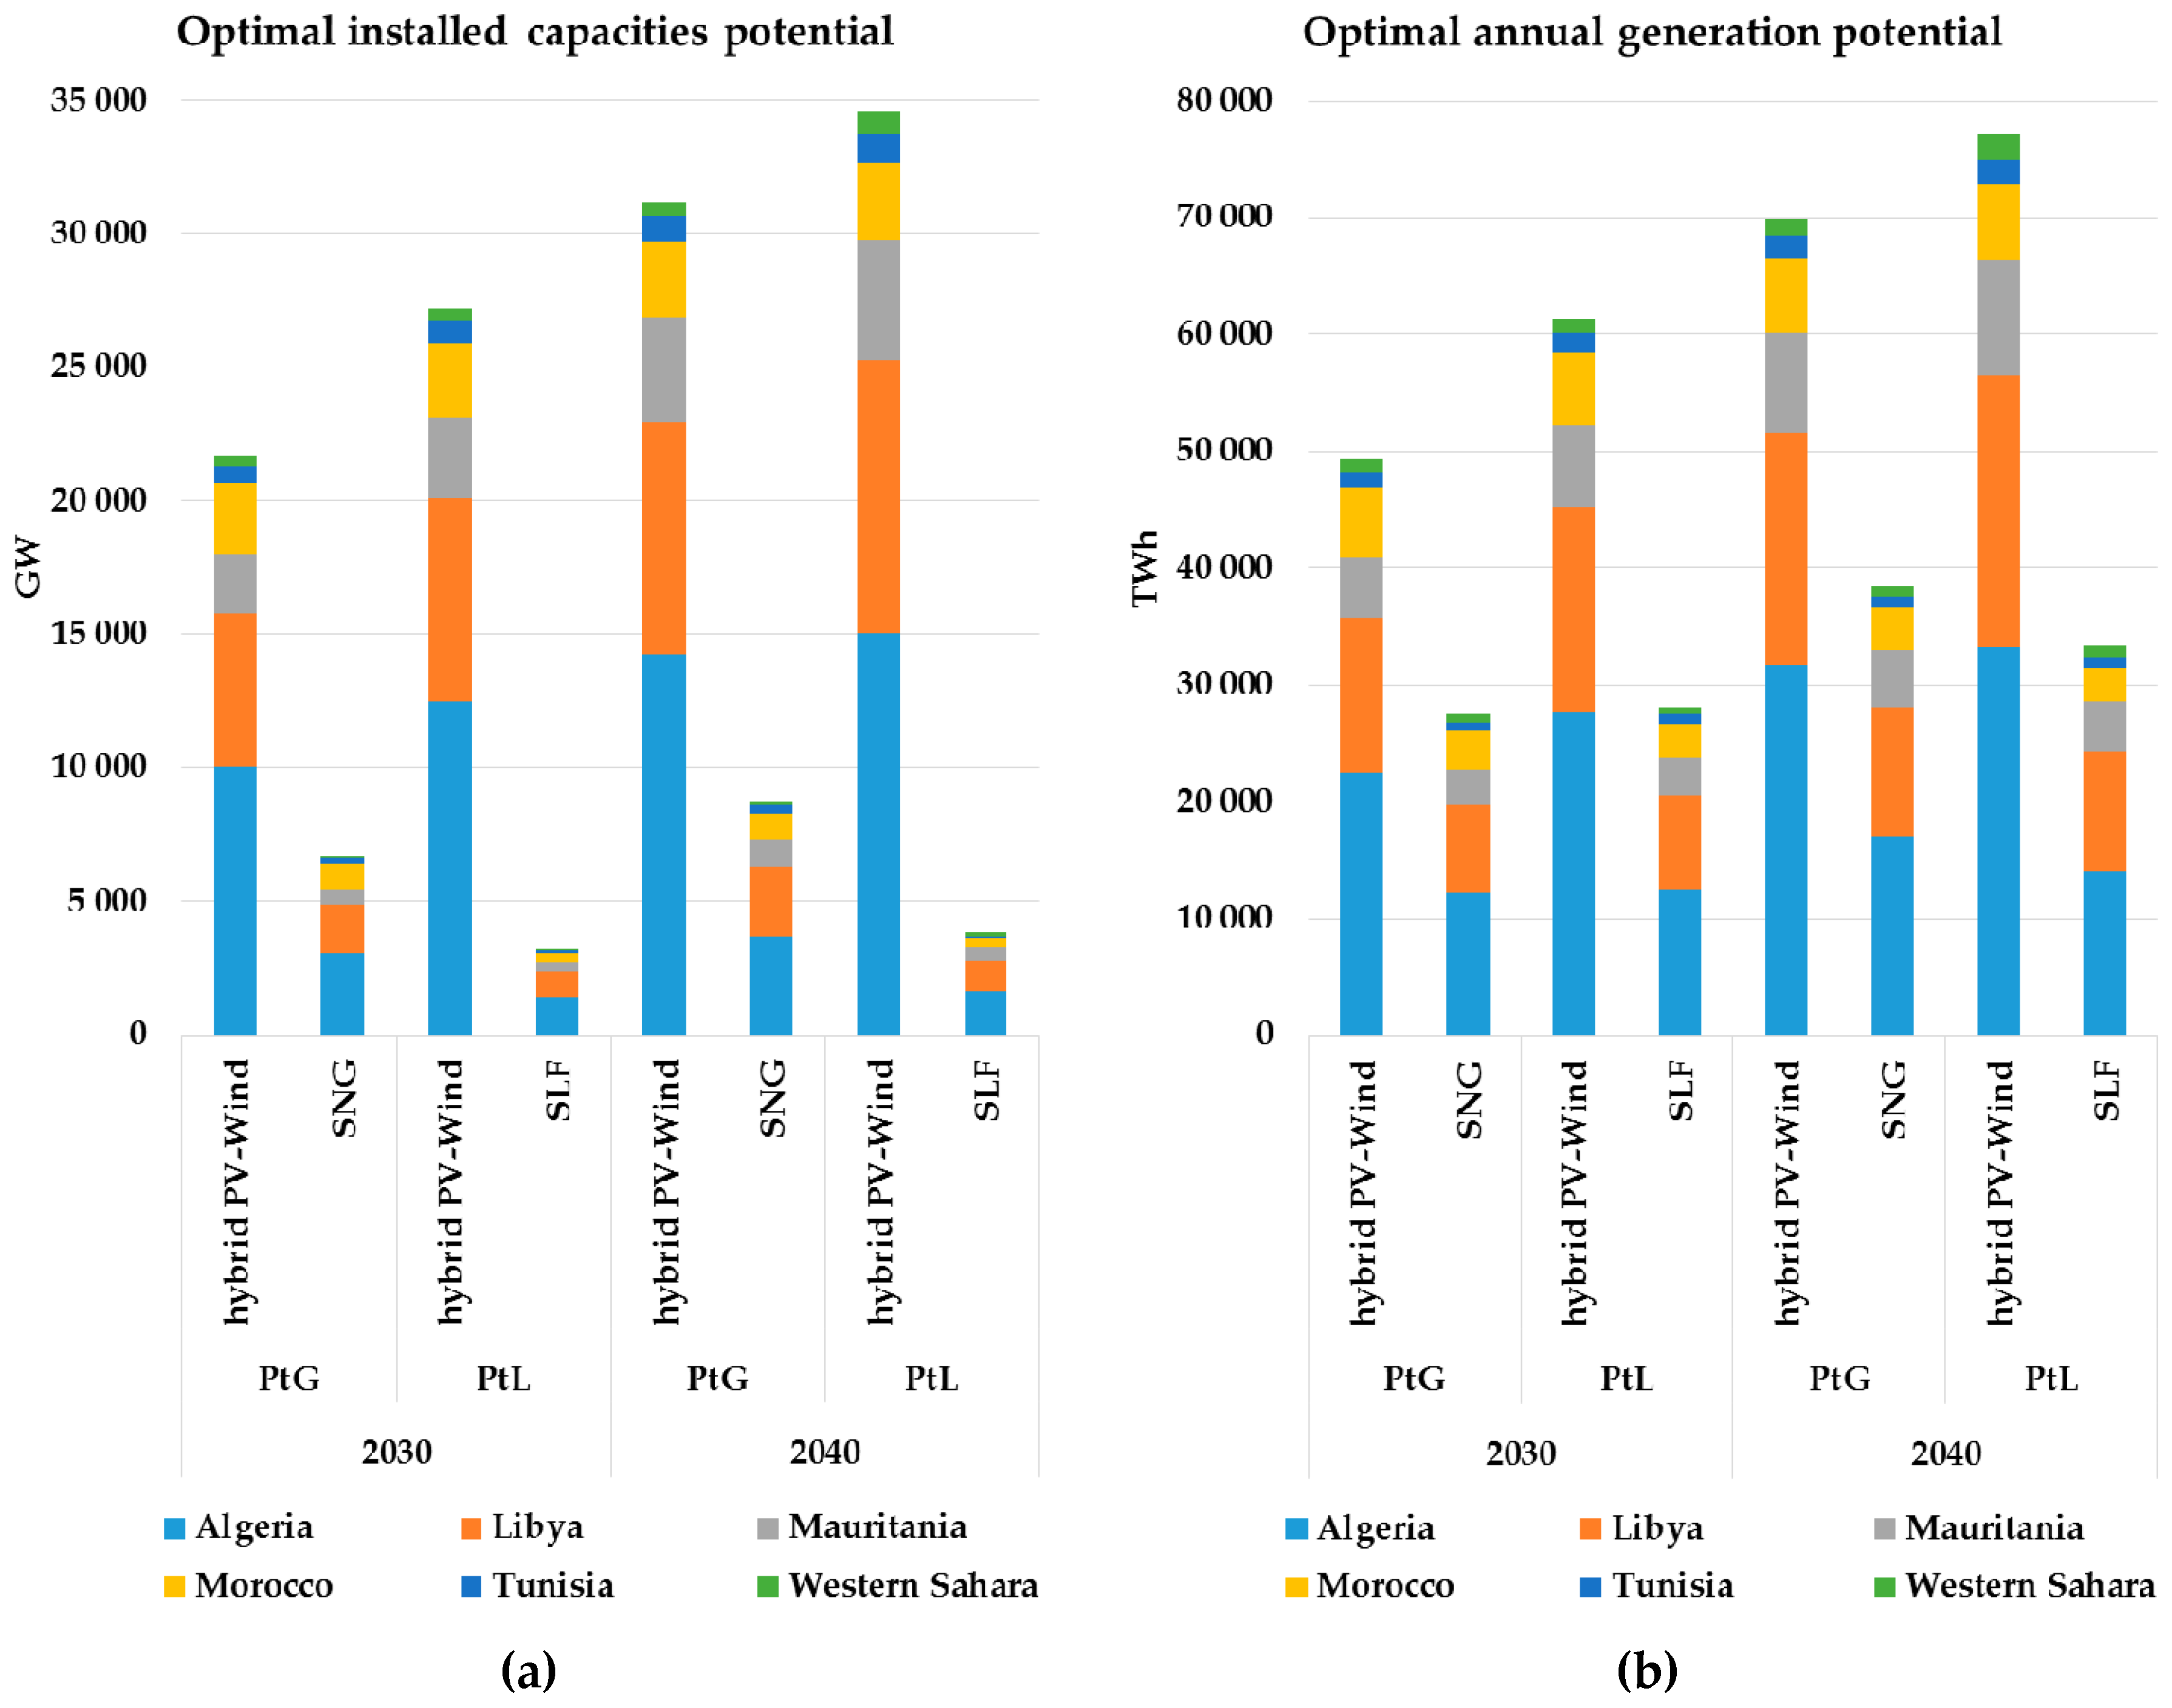
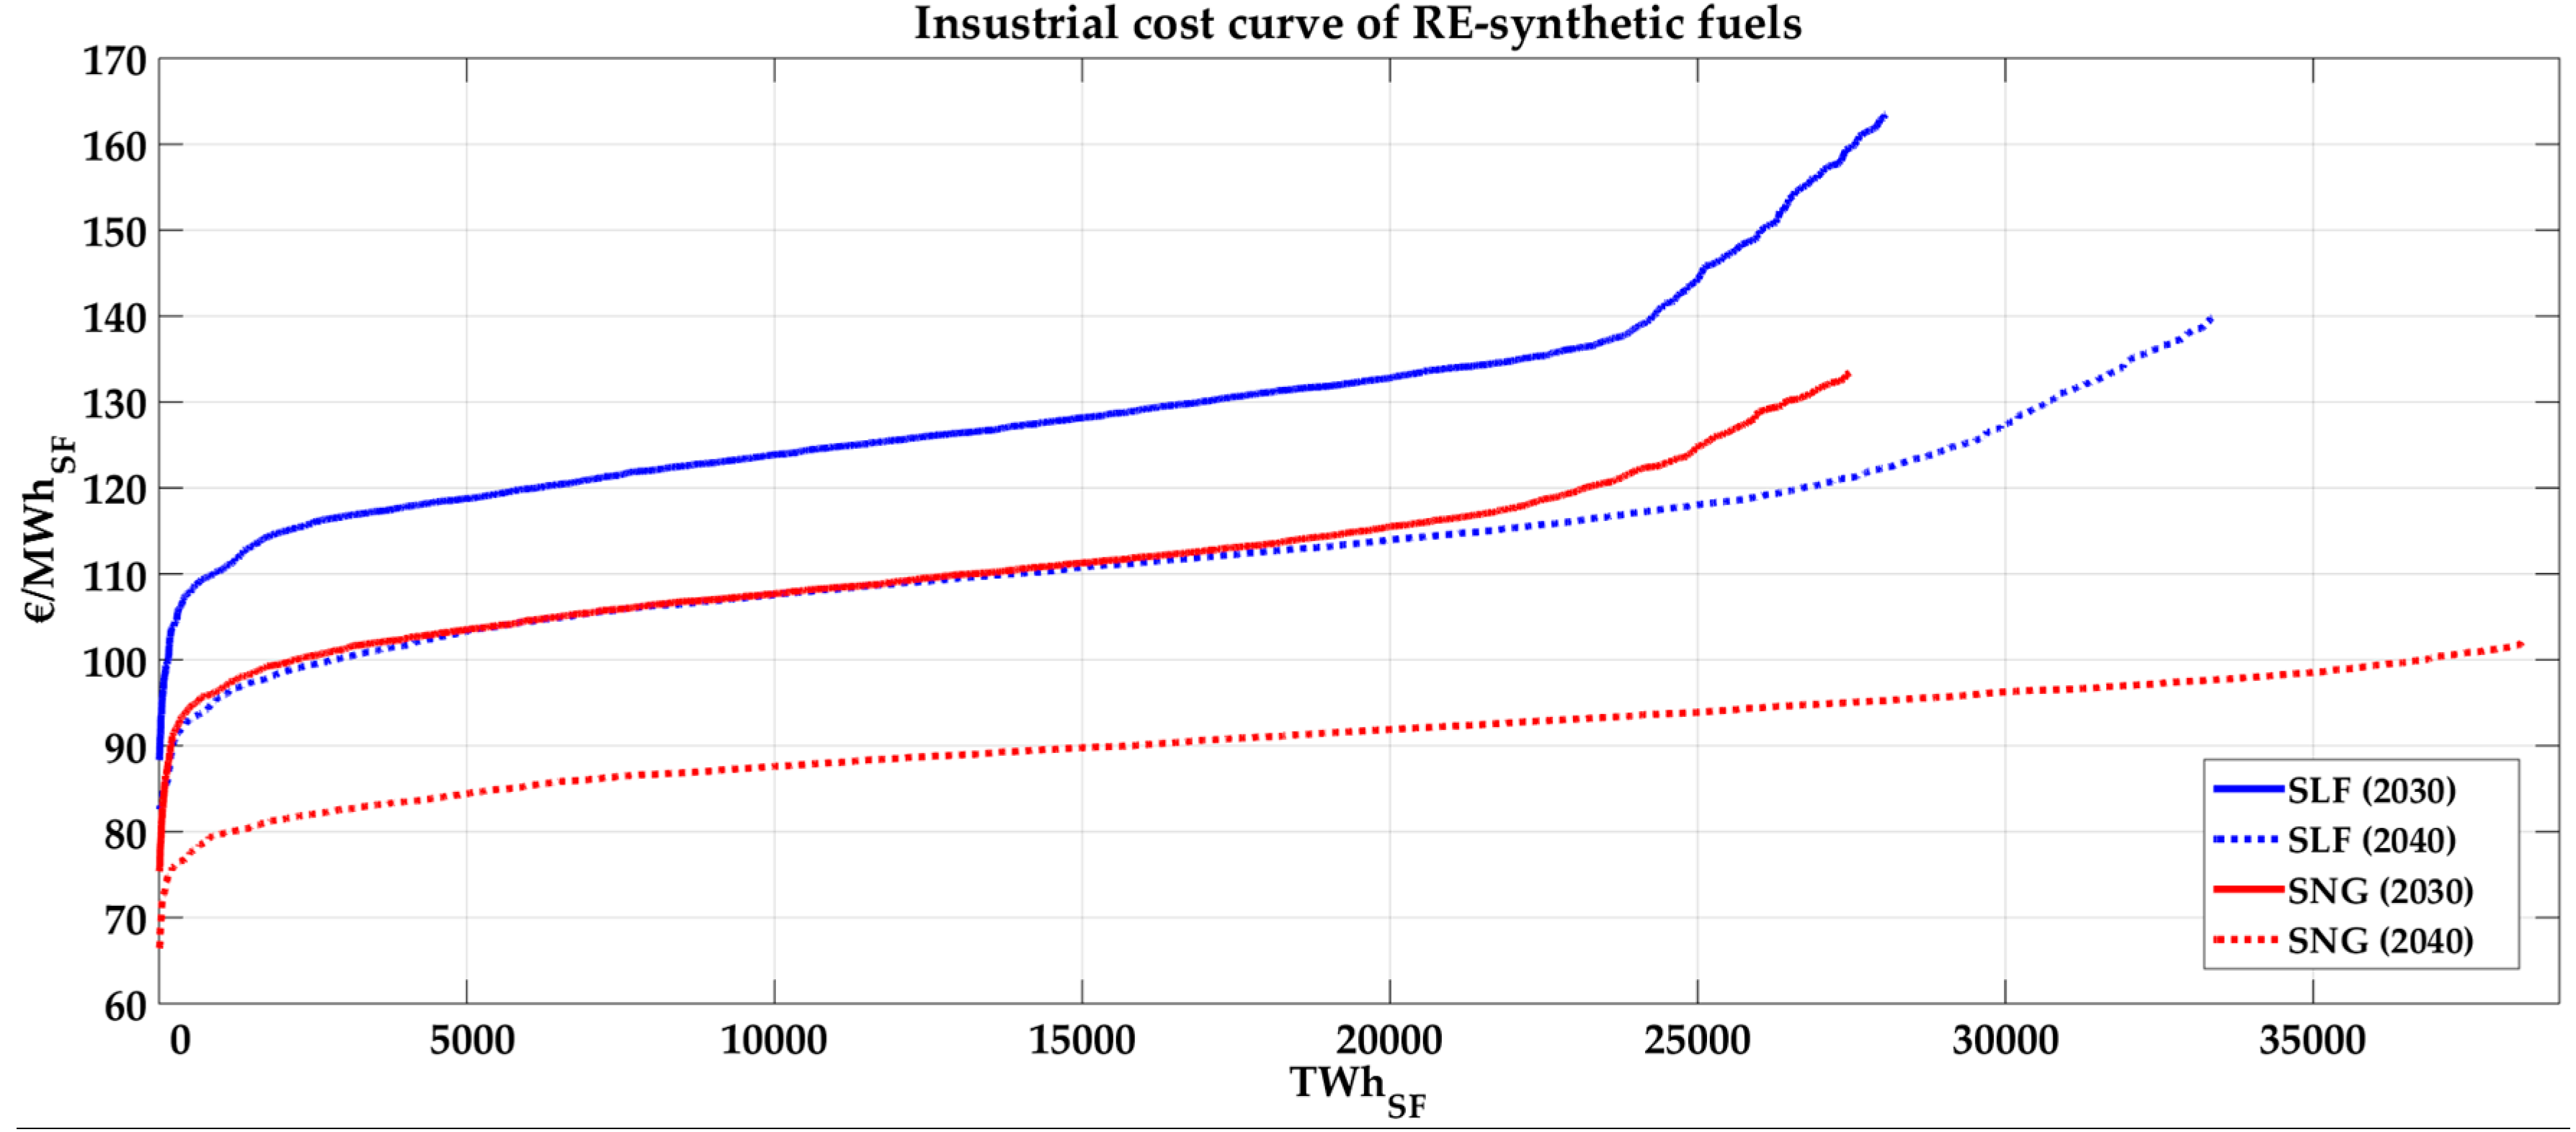
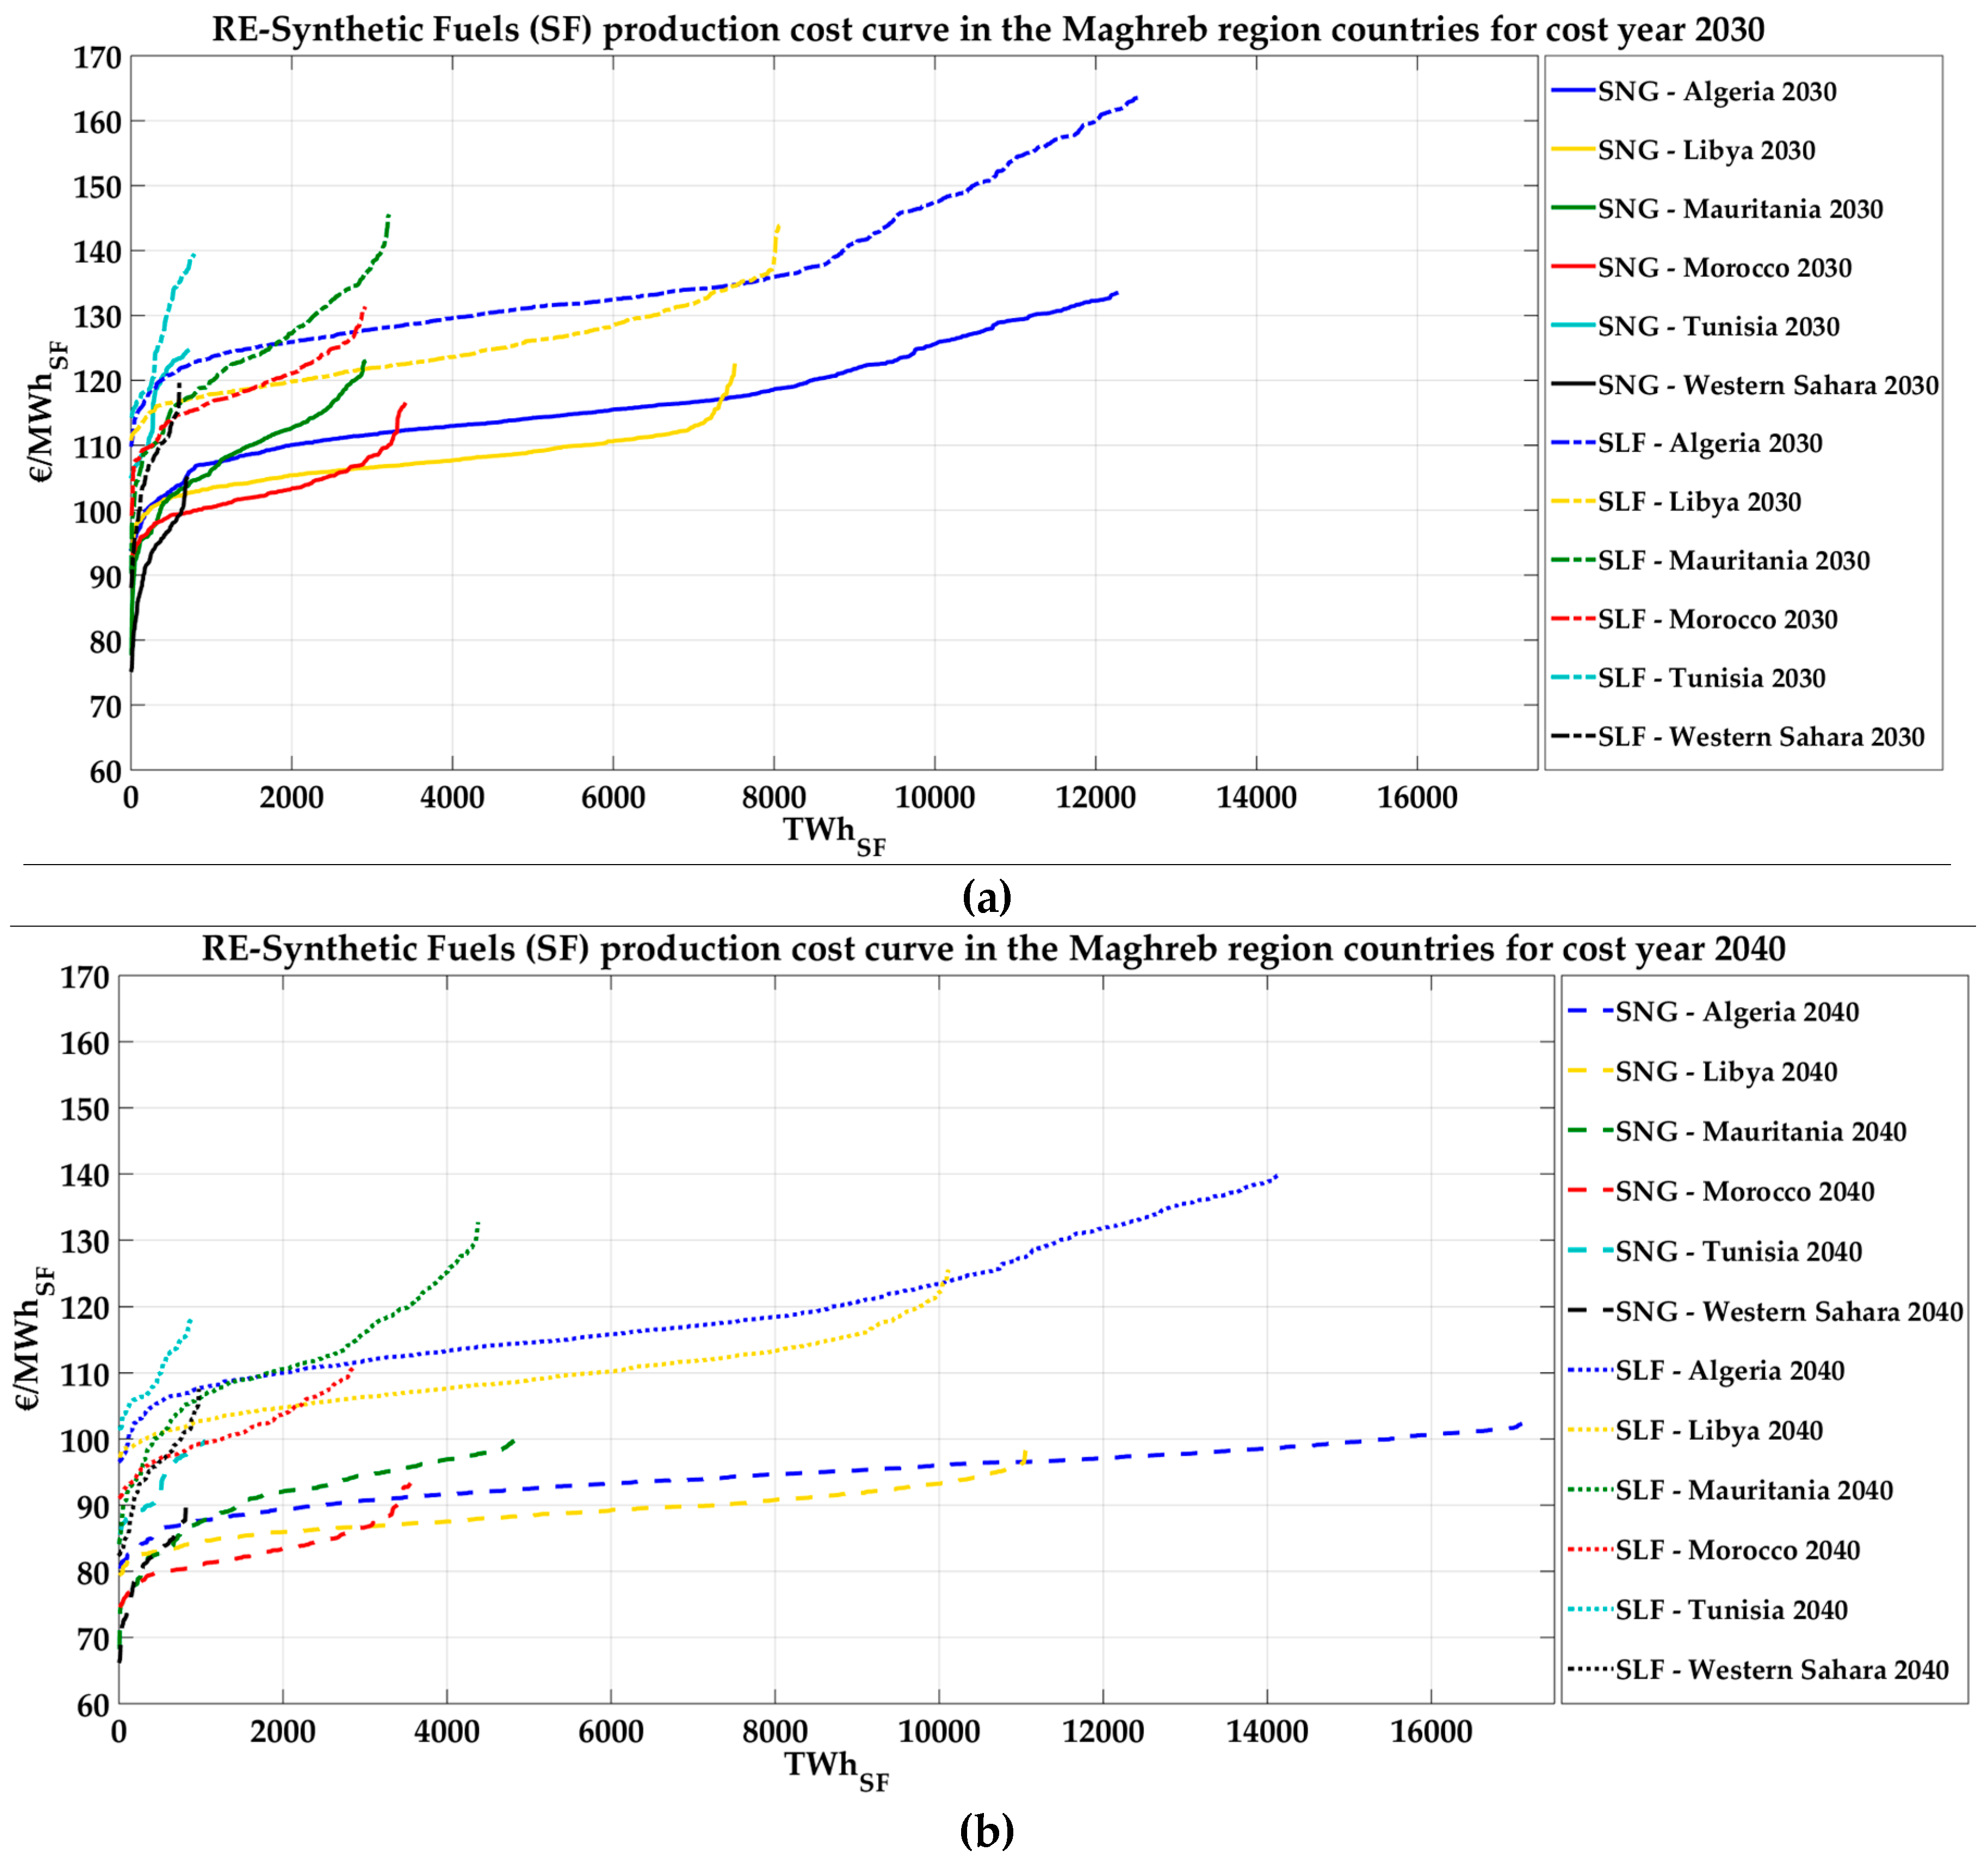
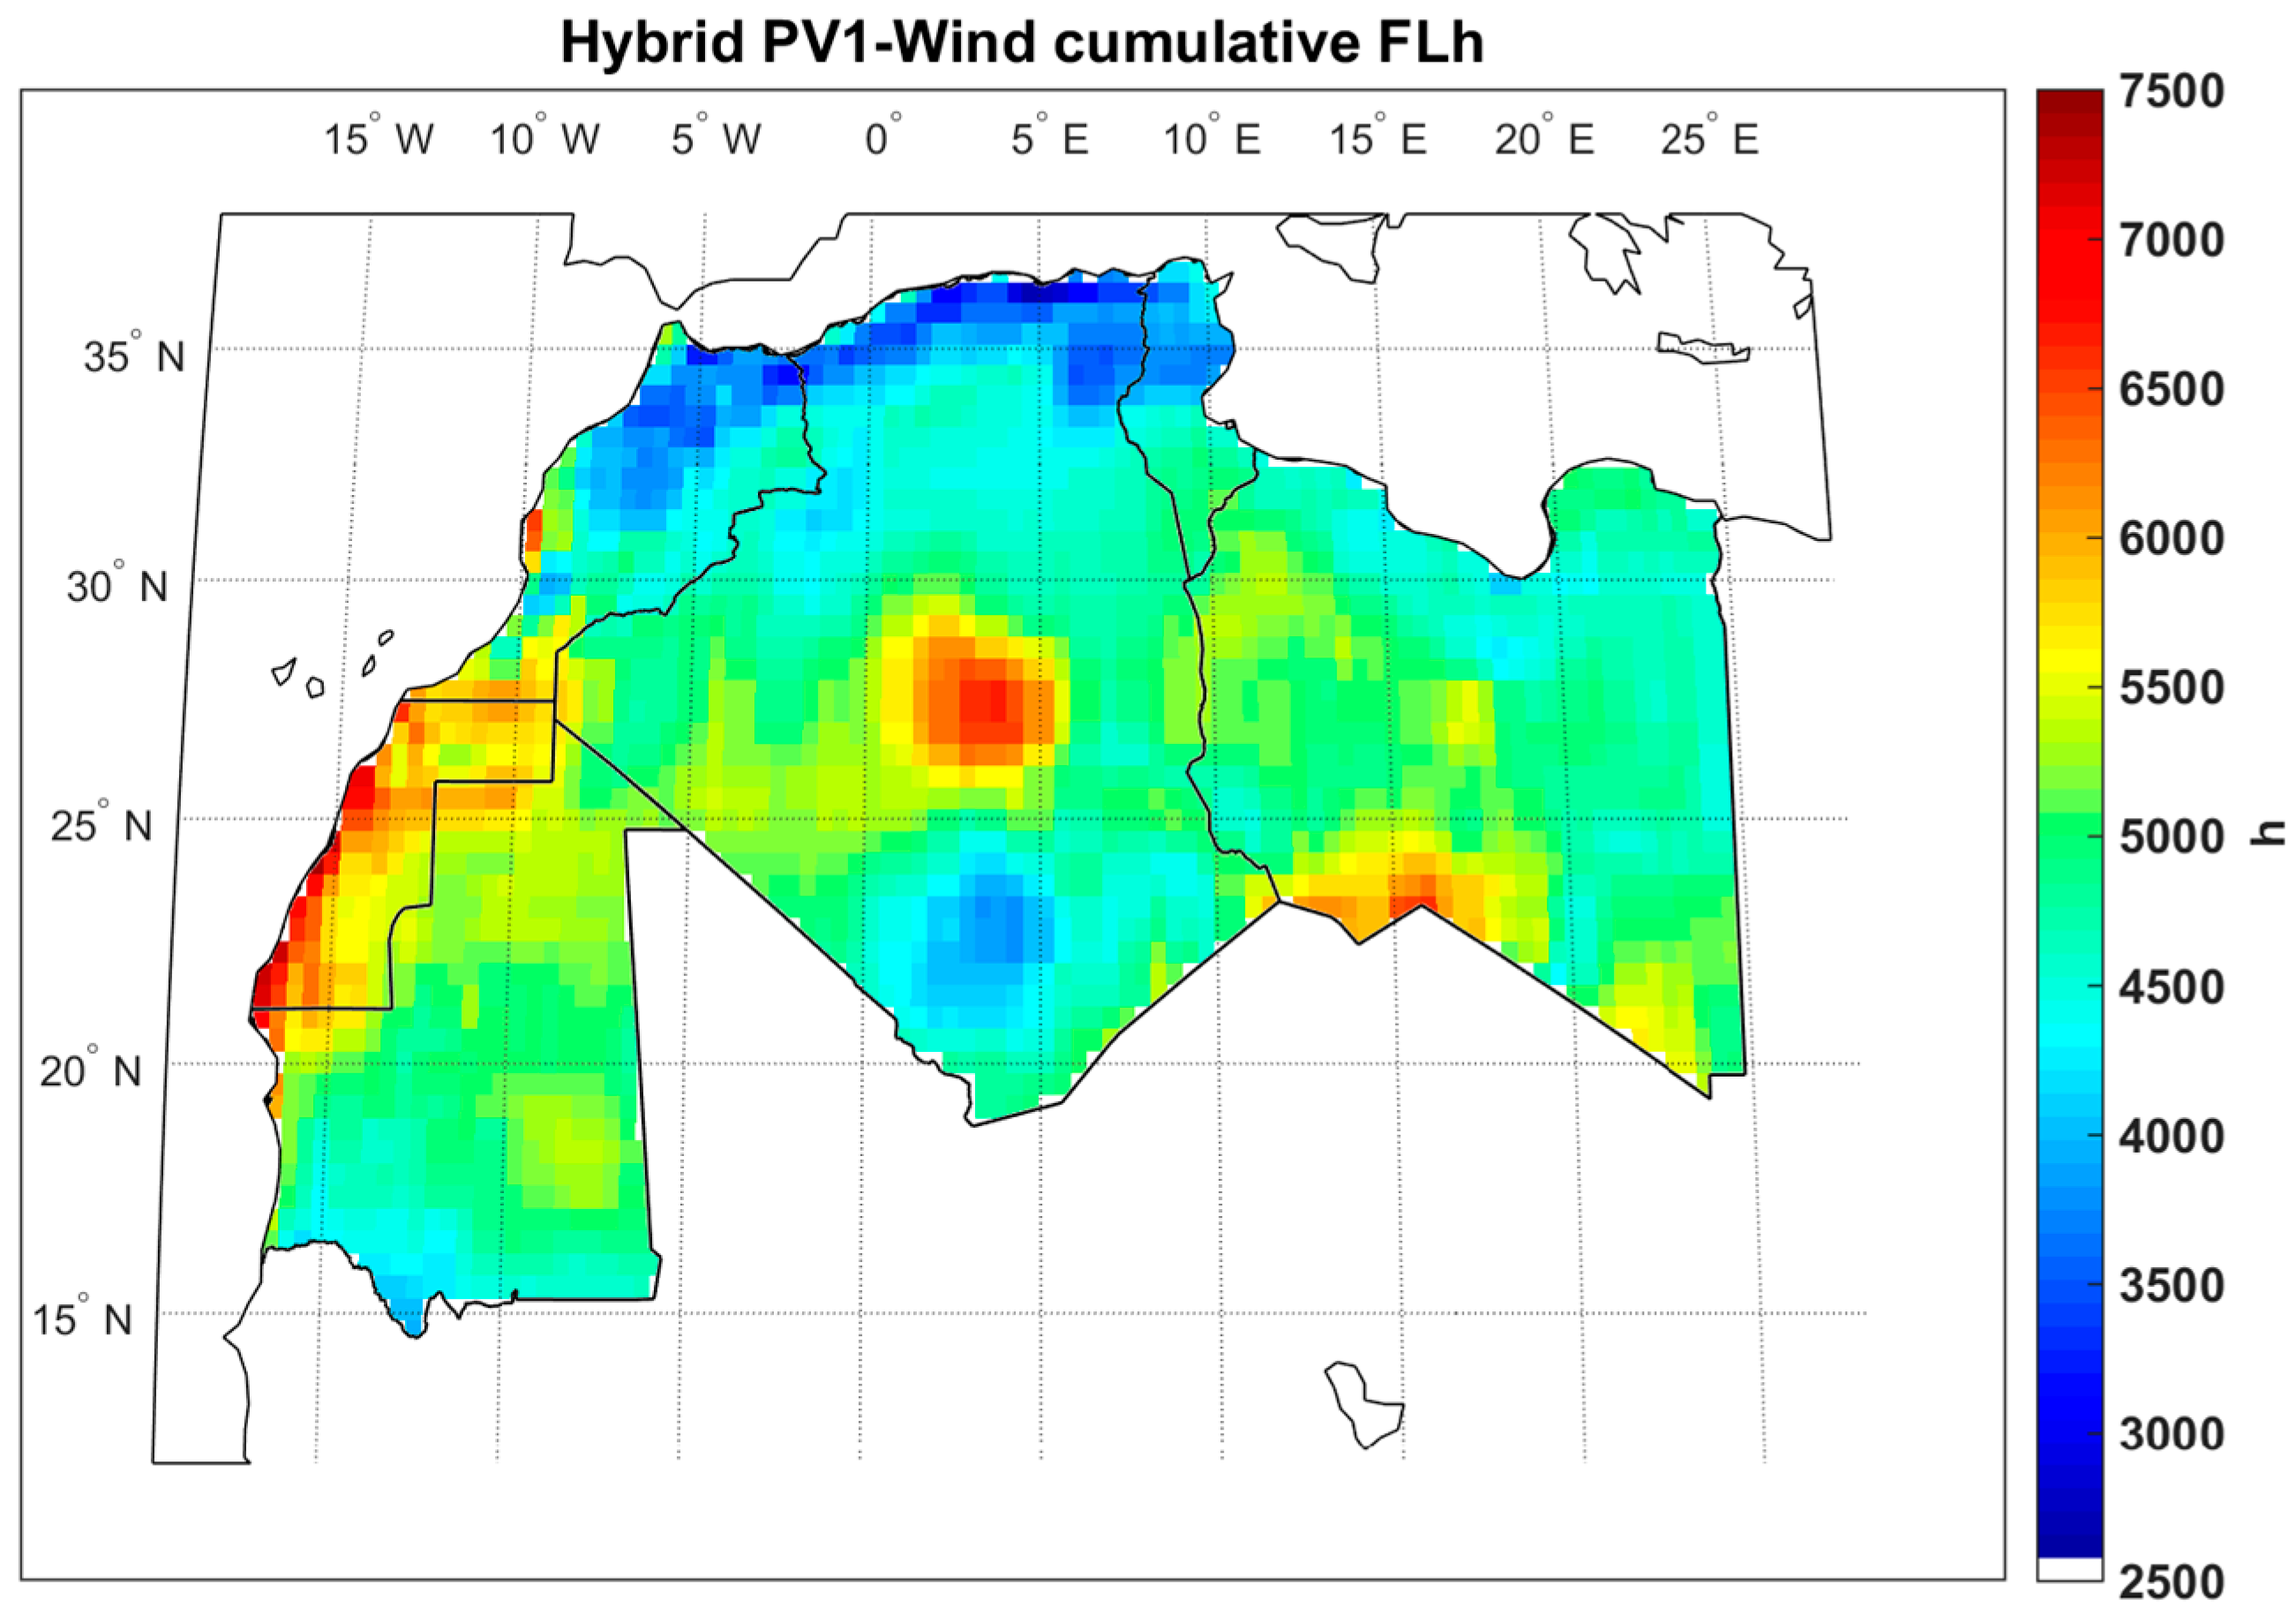
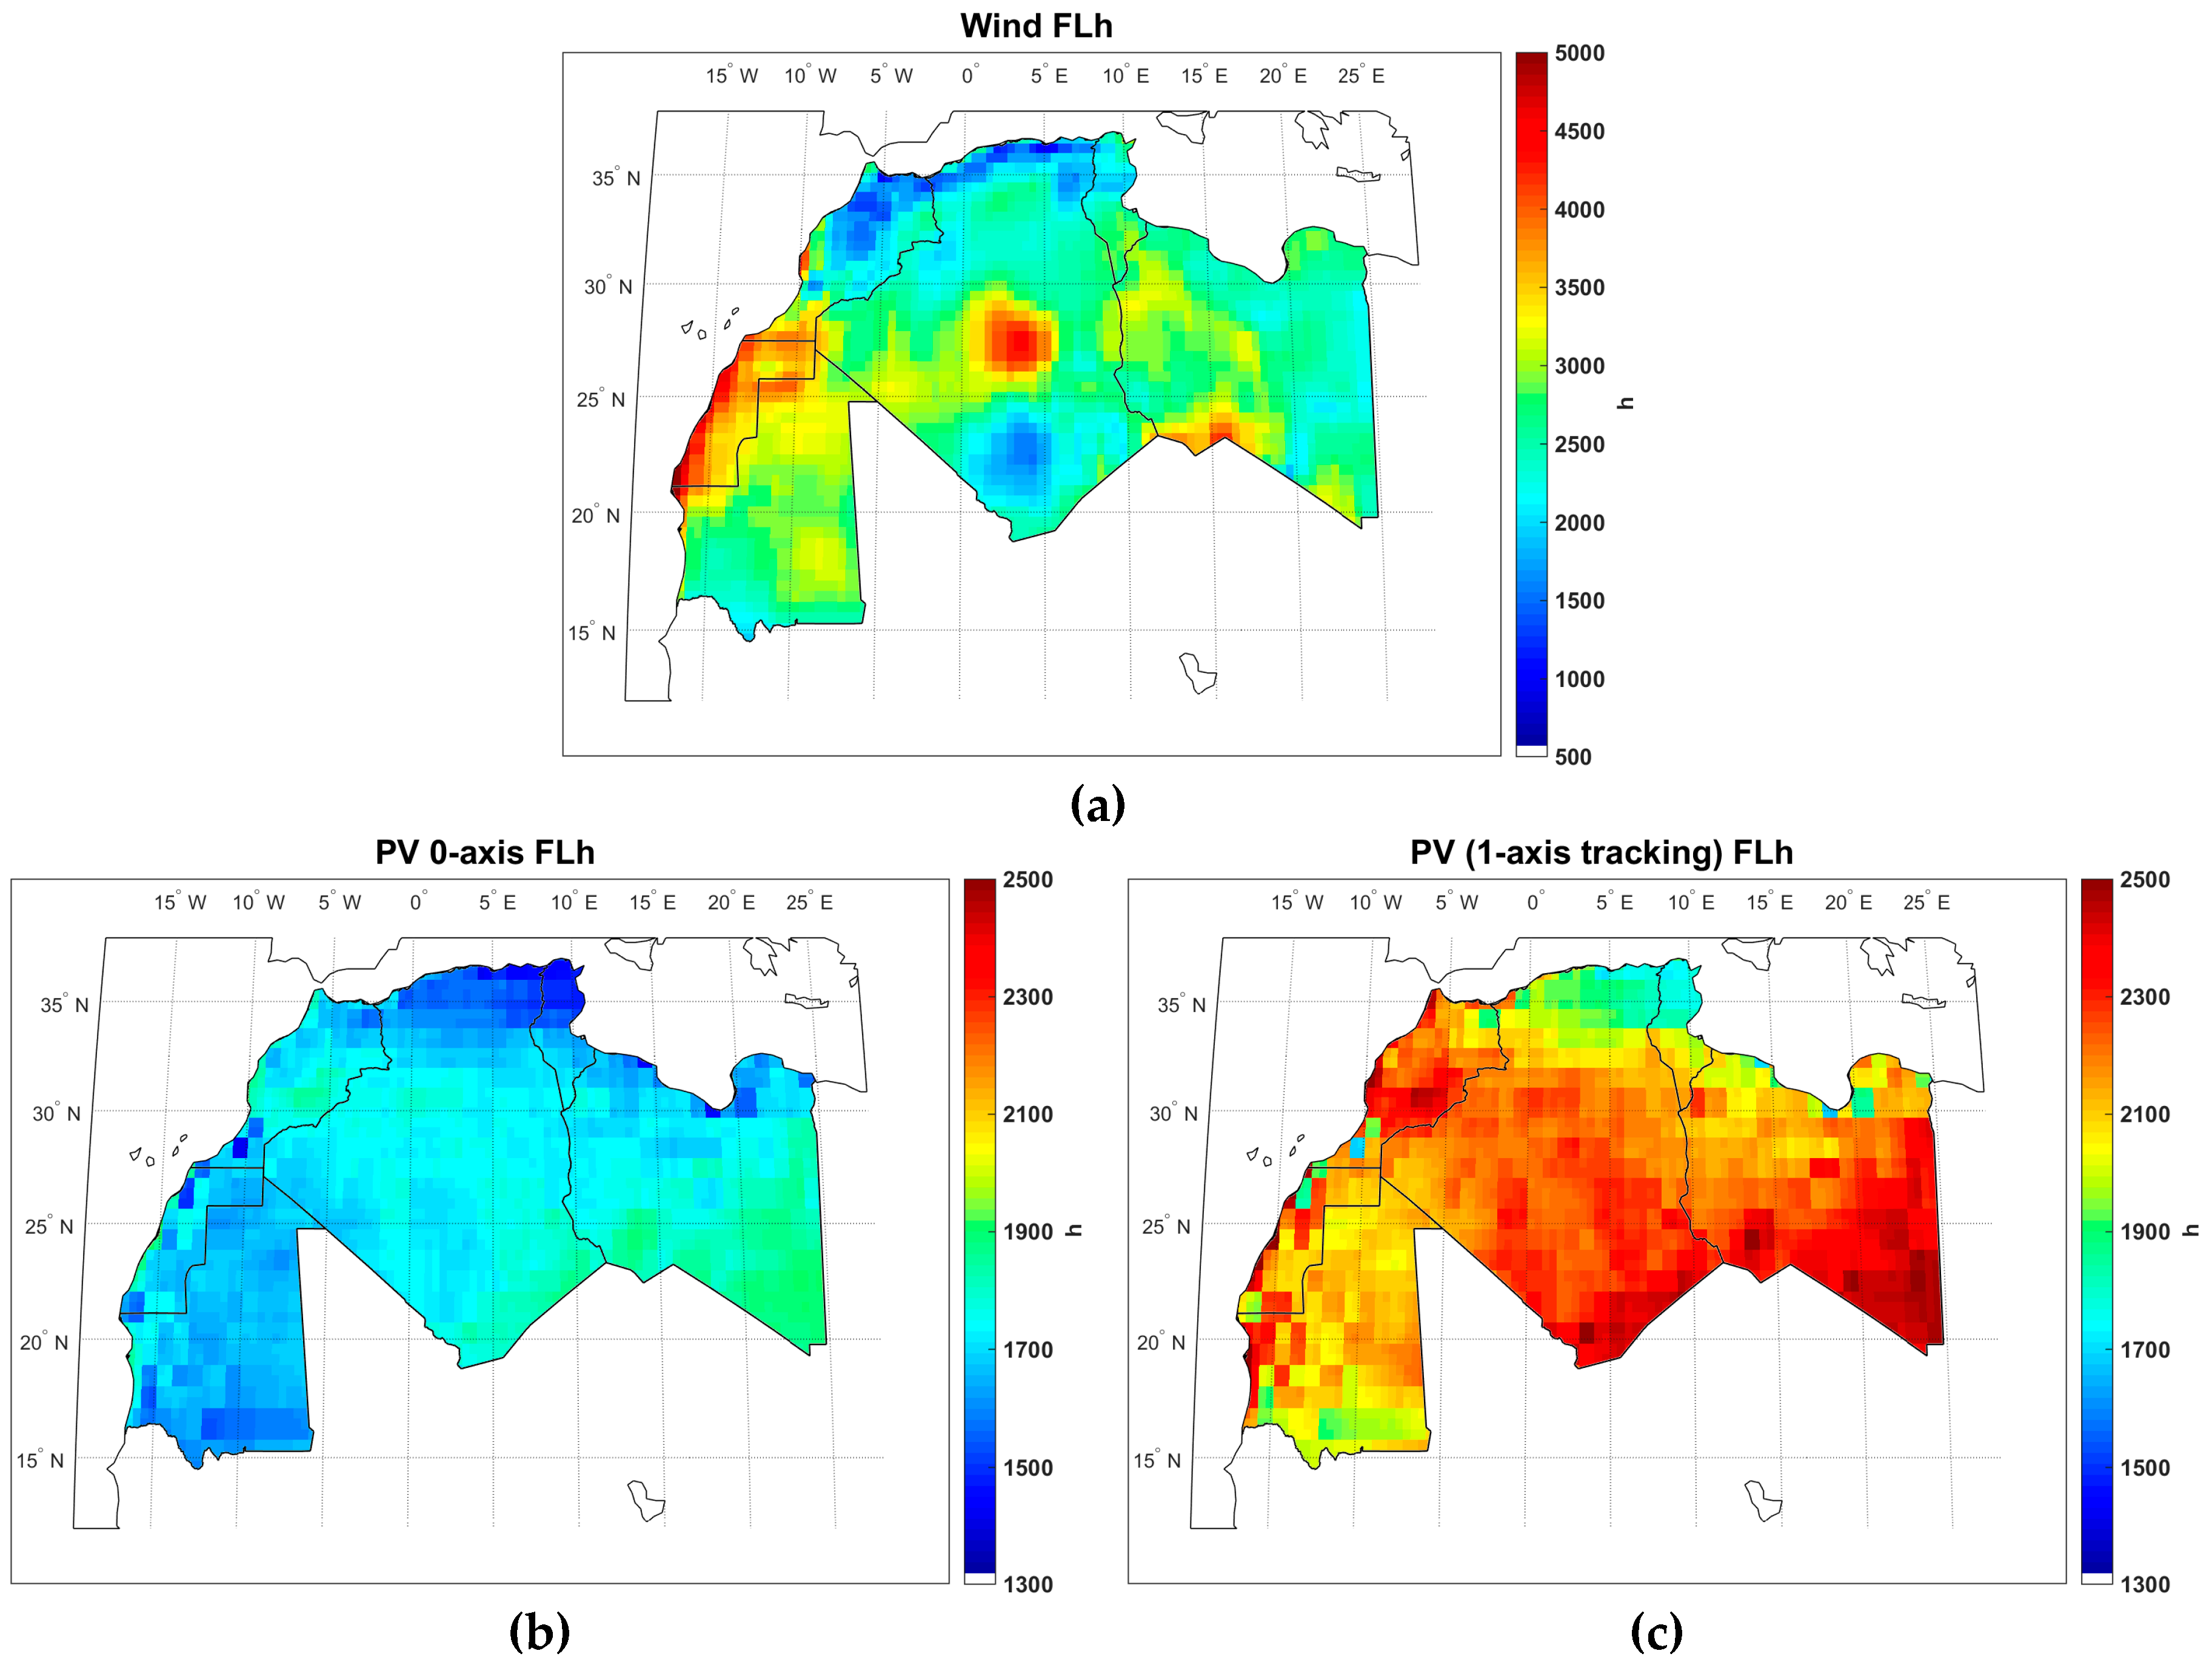
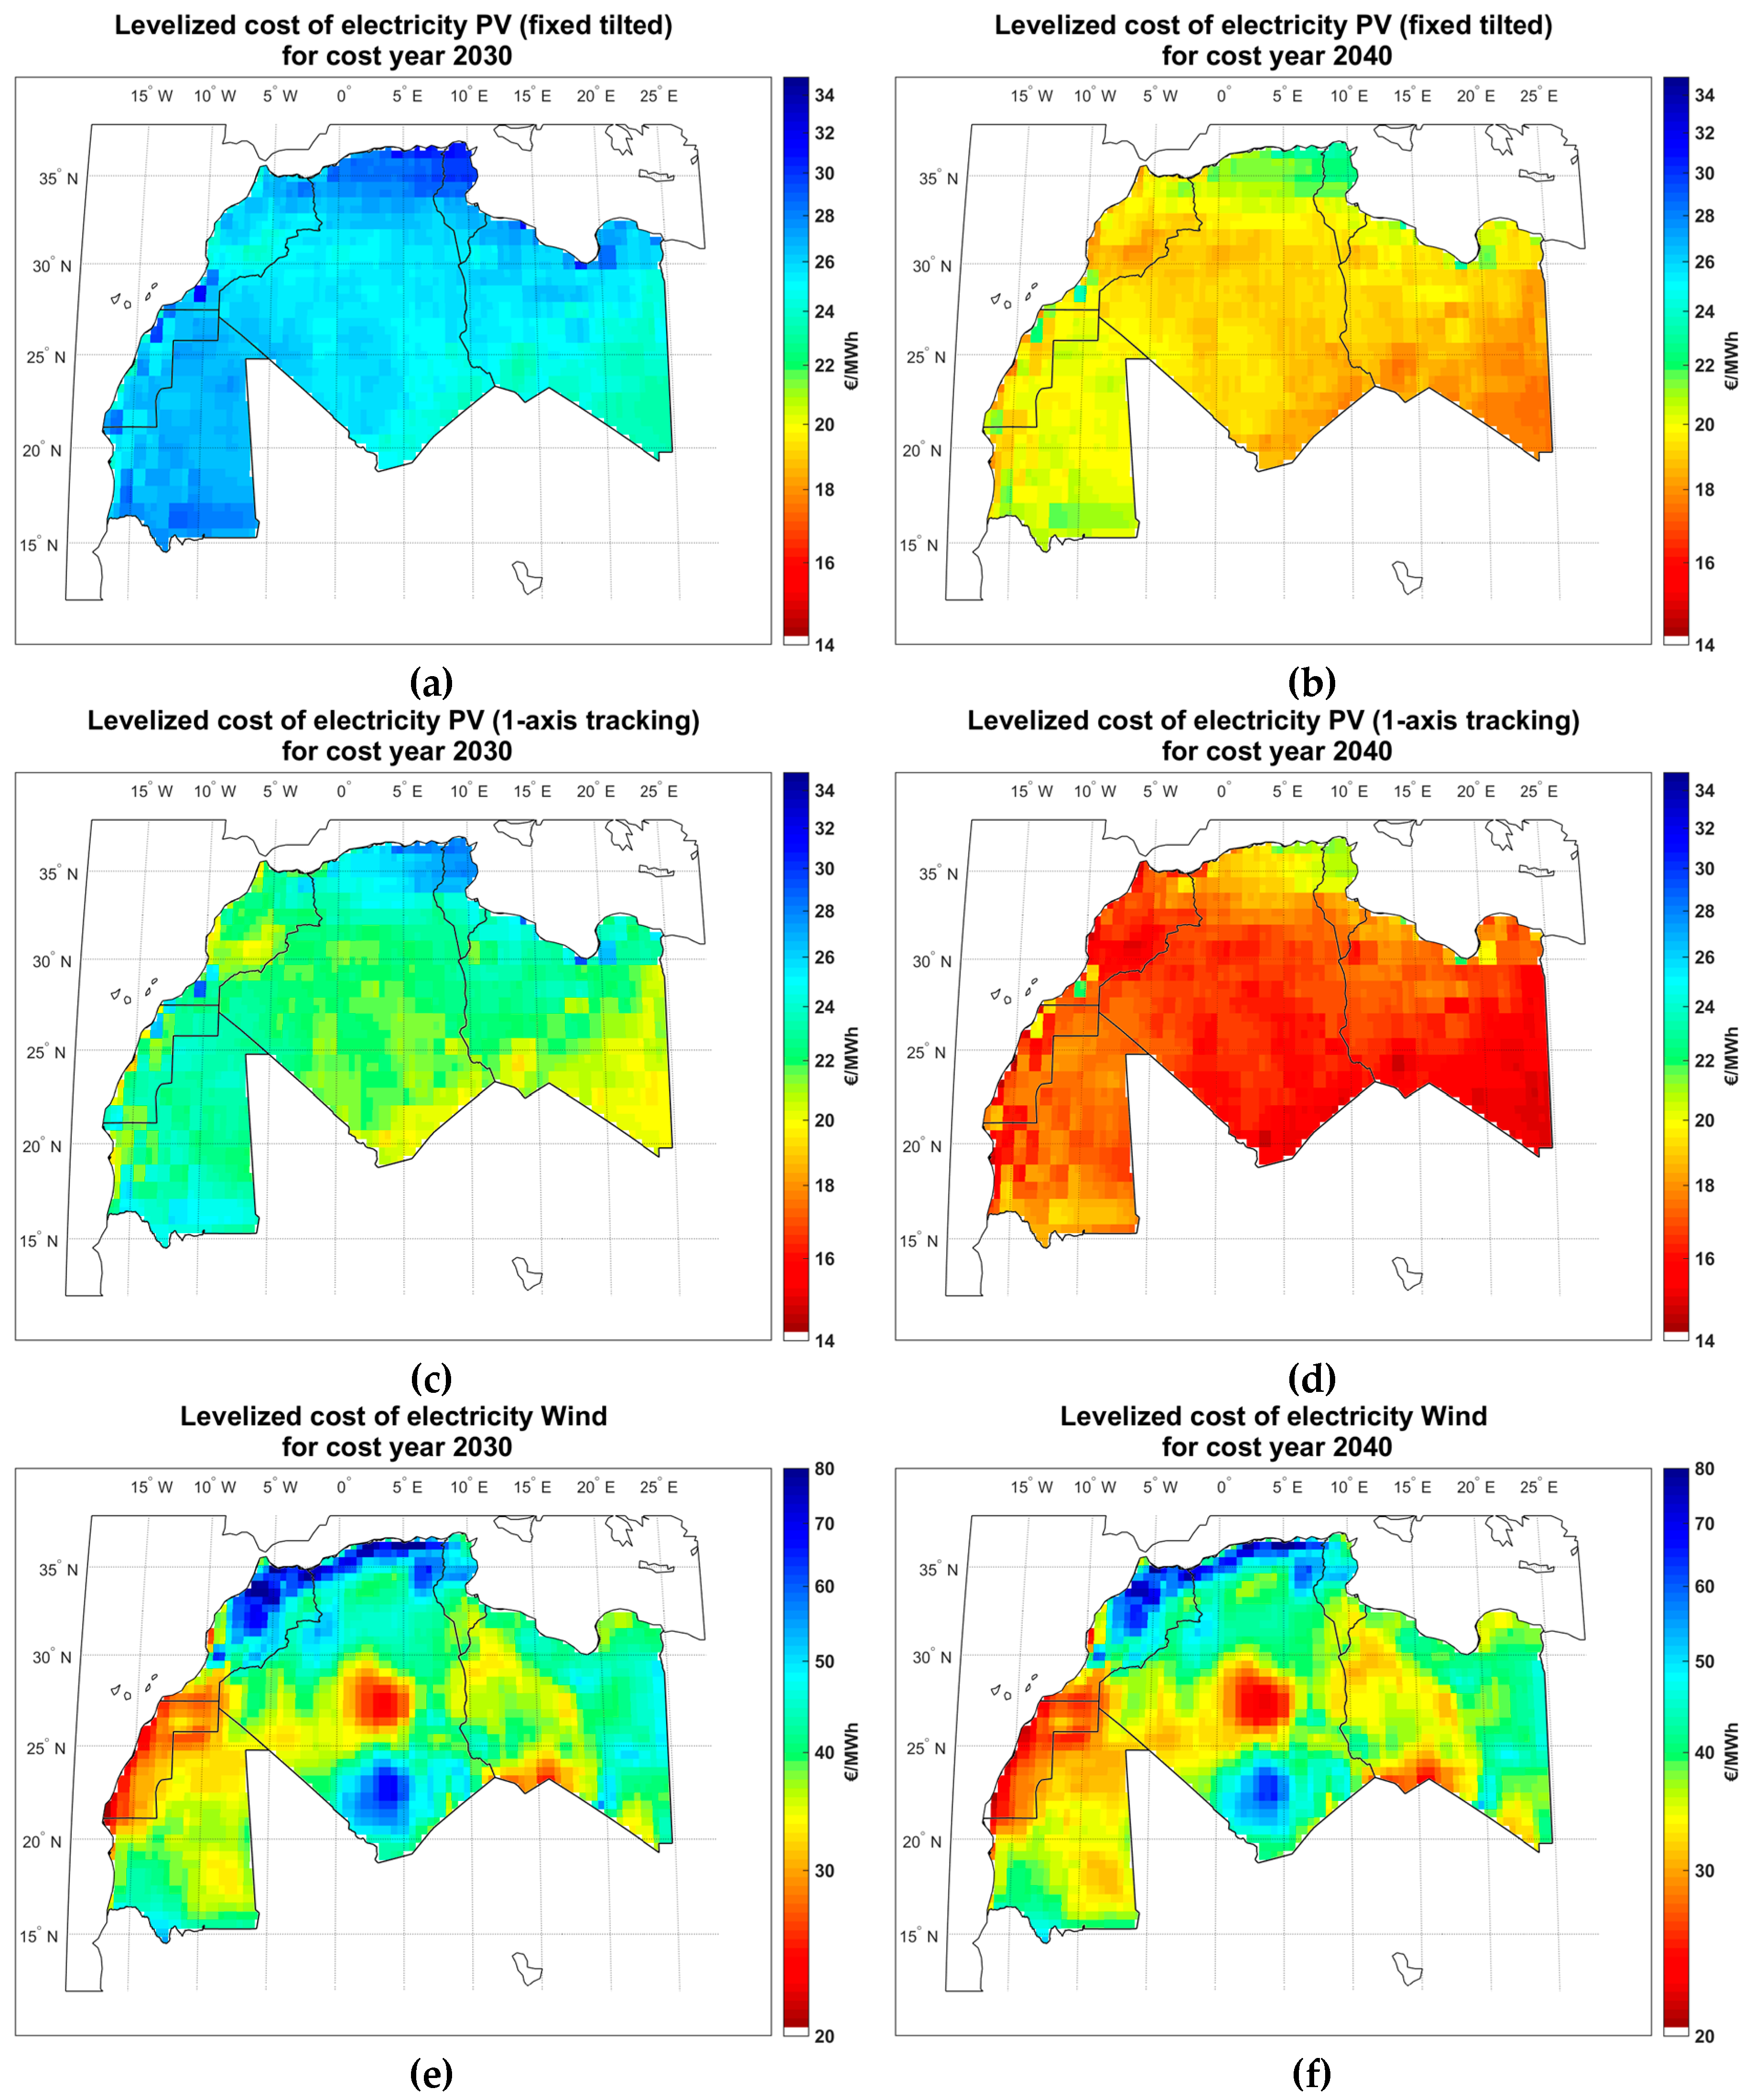
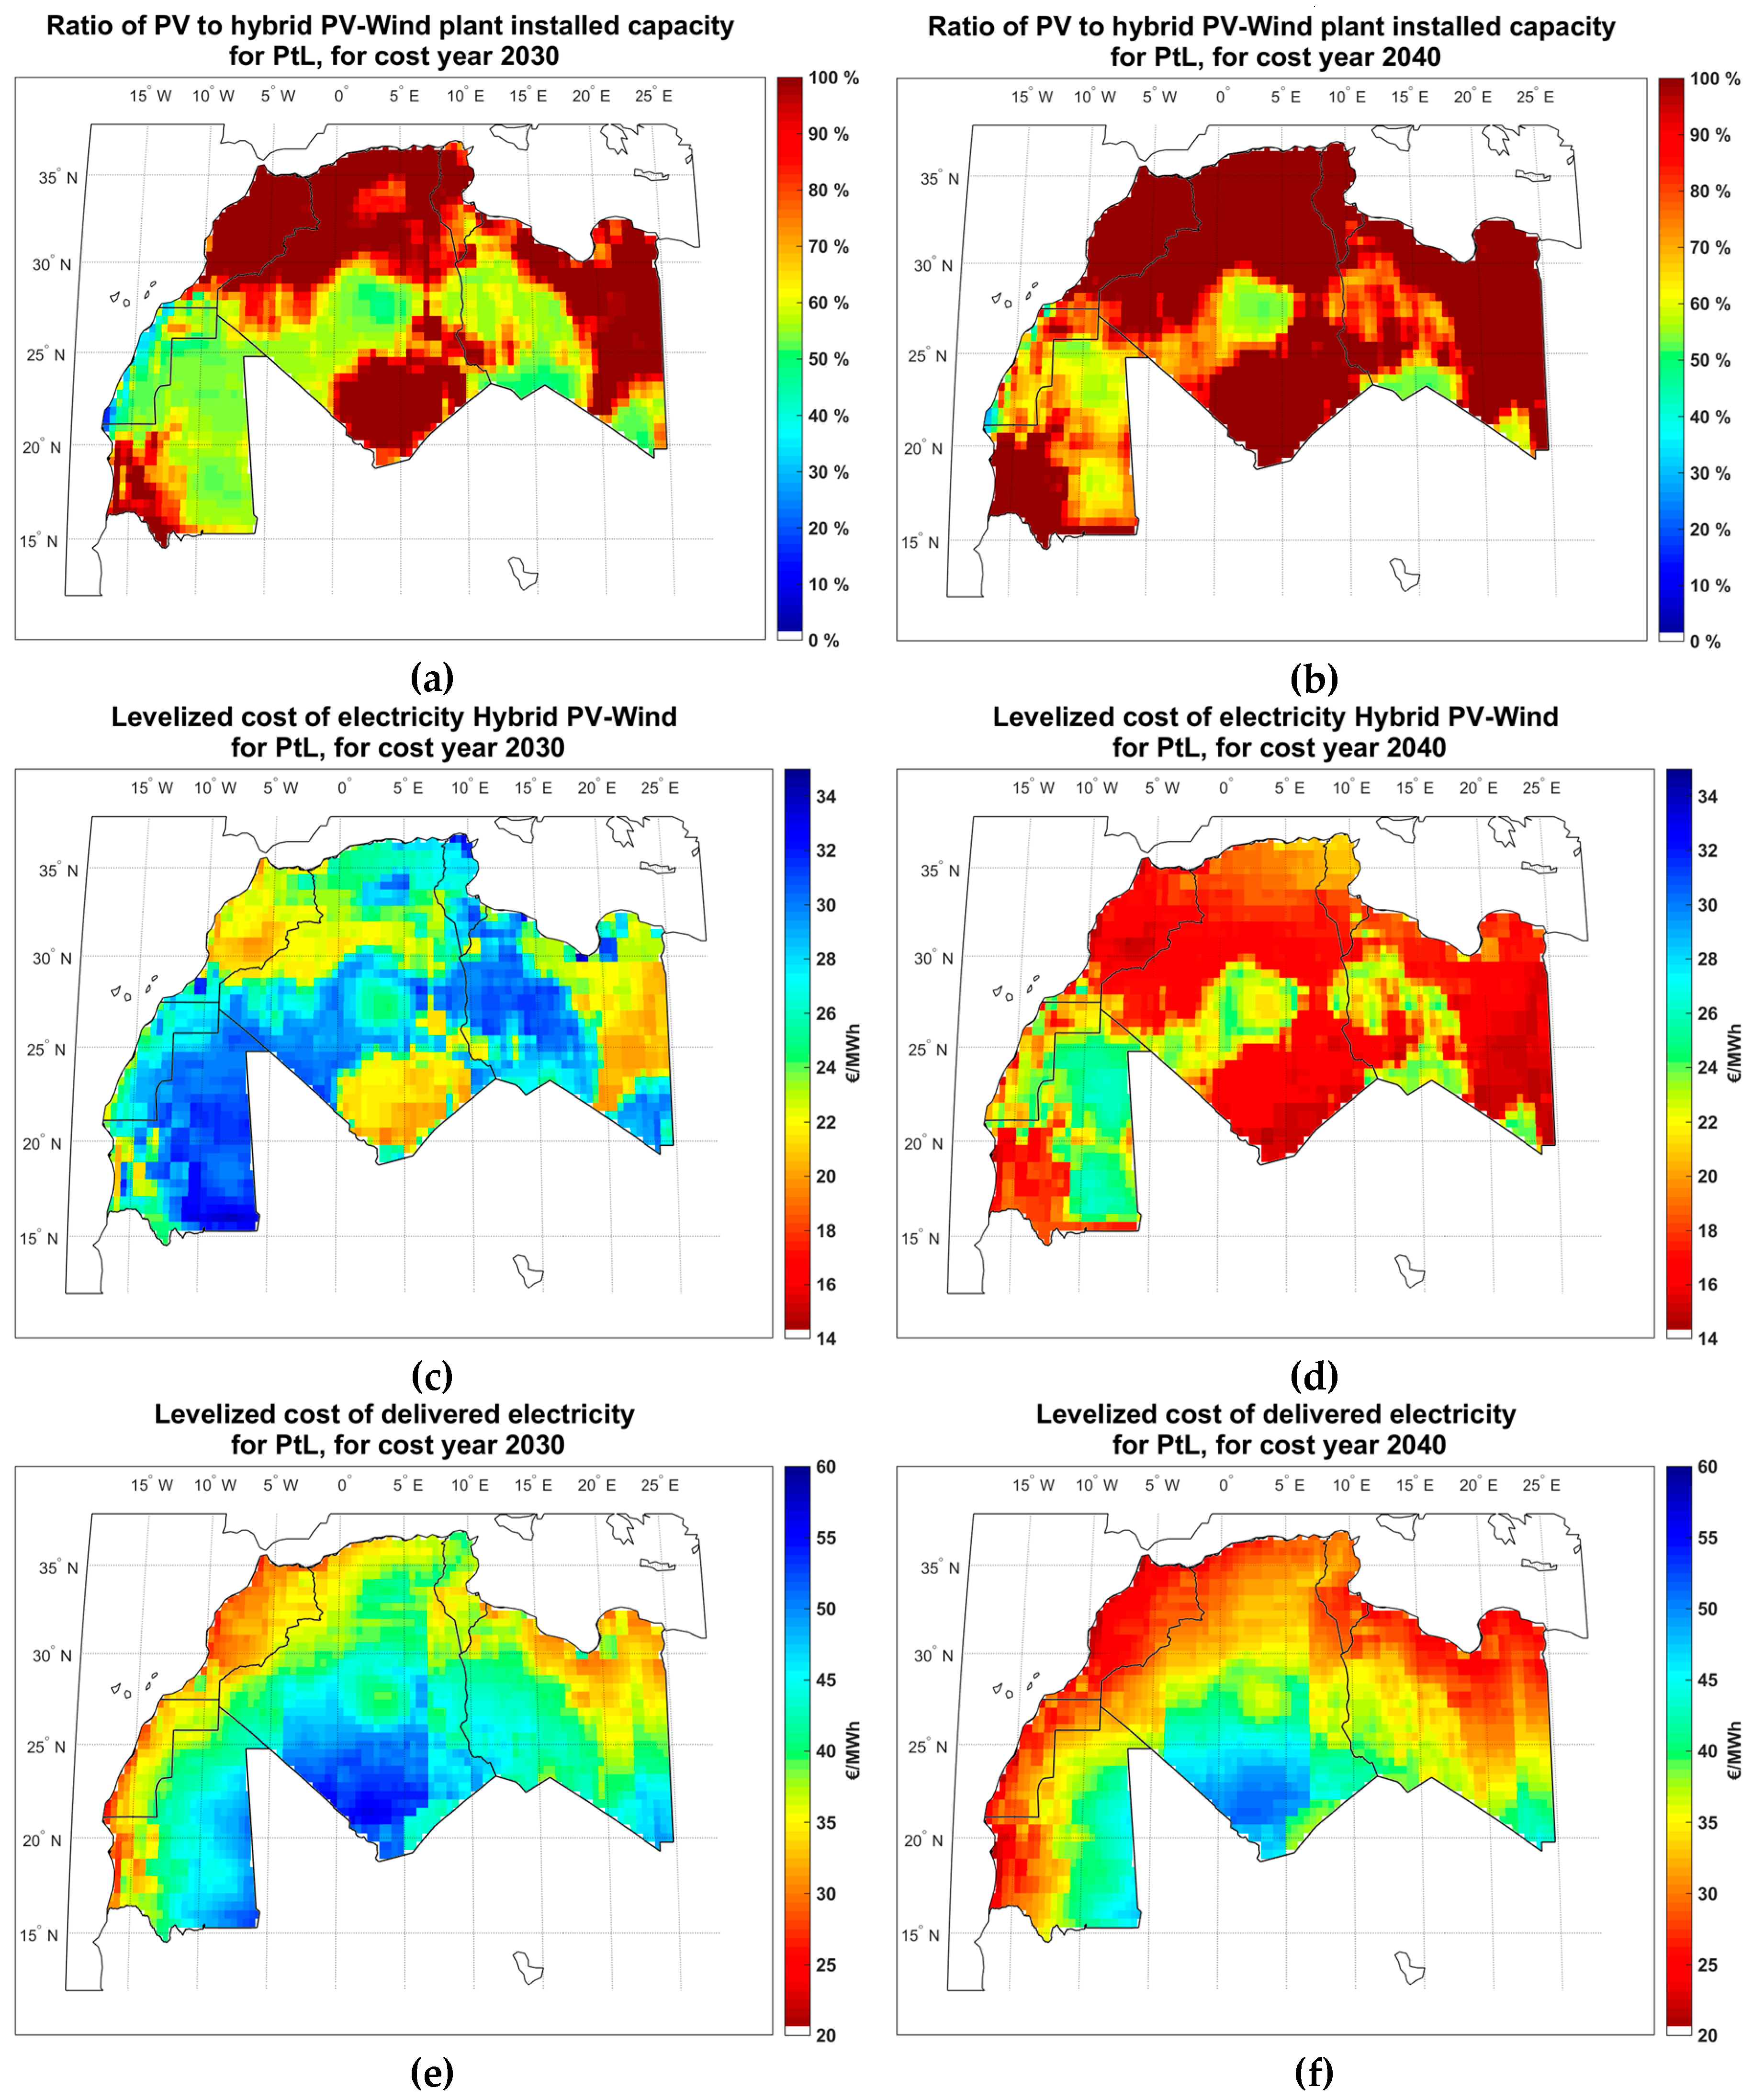
The hybrid PV–Wind power plants, as the power source for all these technologies, should be located in regions of very high full load hours (FLh) to reduce the levelized cost of electricity (LCOE) of power production and subsequently the levelized cost of fuels (LCOF).
Figure 4 shows the cumulative FLh for a hybrid PV–Wind power plant in the Maghreb region, where the best sites are indicated by a red color coding [
31,
32]. With about 7000 FLh, Western Sahara shows the highest potential of solar and wind in the region. In addition, the close distance to the coast, where the PtX plants could be located, makes the power transmission cost and, consequently, the power generation cost in total as low as possible.
The
Hourly Basis Model uses the optimized combination of PV (fixed tilted or single-axis tracking), wind power, storage options (battery, gas storage), transmission line and PtX facilities capacity to minimize the levelized cost of RE-SNG or RE-diesel. This is based on an hourly availability of the solar and wind resources in a 0.45° × 0.45° spatial resolution. The datasets for solar irradiation components and wind speed are taken from NASA databases [
32,
33] and partly reprocessed by the German Aerospace Center [
34]. Feed-in time series for fixed, optimally tilted solar PV systems are calculated based on Gerlach et al., [
35] and Huld et al., [
36], and for single-axis north–south oriented continuous horizontal tracking it is calculated based on Duffie and Beckmann [
37]. Feed-in time series of wind power plants are calculated for standard 3 MW wind turbines (E-101 [
38]) with hub height conditions of 150 m, according to Gerlach et al., [
35]. The power sector specification for the years 2030 and 2040 are shown in
Table 4.
The equations below have been used to calculate the LCOE of a hybrid PV–Wind power plant and the subsequent value chain, which follows respective guidelines published by the NREL [
47]. Abbreviations: capital expenditures,
Capex, annual operational expenditures,
Opex, full load hours per year,
FLh, fuel costs, fuel, efficiency,
η, annuity factor, crf, weighted average cost of capital, WACC, lifetime, N, performance ratio,
PR, overlap FLh, overlap.
PVirradiation uses the irradiation on the module surface in units of kWh/(m
2∙a), which is applied for modules under standard test conditions (STC) for 1 kW/m
2. The solar PV performance ratio describes the annual performance of PV systems and is comprised of all components between the module and the point of grid access, as well as all losses due to system downtimes or reduced yields due to not fully clean modules. The overlap is defined by Gerlach et al. [
35]. A WACC of 7% is used for all the calculations in the base scenario. Due to the current financing conditions and the level of stability in the region, the assumed WACC might seem low. However, it may be unlikely that such a situation would continue for decades. In addition, this is the real WACC (excluding inflation, which is typically assumed to be around 2%). For the WACC of 7% in the base scenario, assuming an equity share of 30% and an interest rate of 4%, this would lead to a return on equity of 14%, which is rather high. The volatility of prices in a renewable energy dominated energy system could be much lower, since all cost are fixed for decades. Hence, the price and respective returns can also be very stable for a long term, assuming stable political conditions. For a WACC of 5%, the corresponding numbers would lead to a return on equity of about 7.3%, which is still higher than expected in most feed-in tariff laws in Europe. However, it is obvious that such a de-risking strategy would require a respective policy framework.
4. Discussion and Conclusions
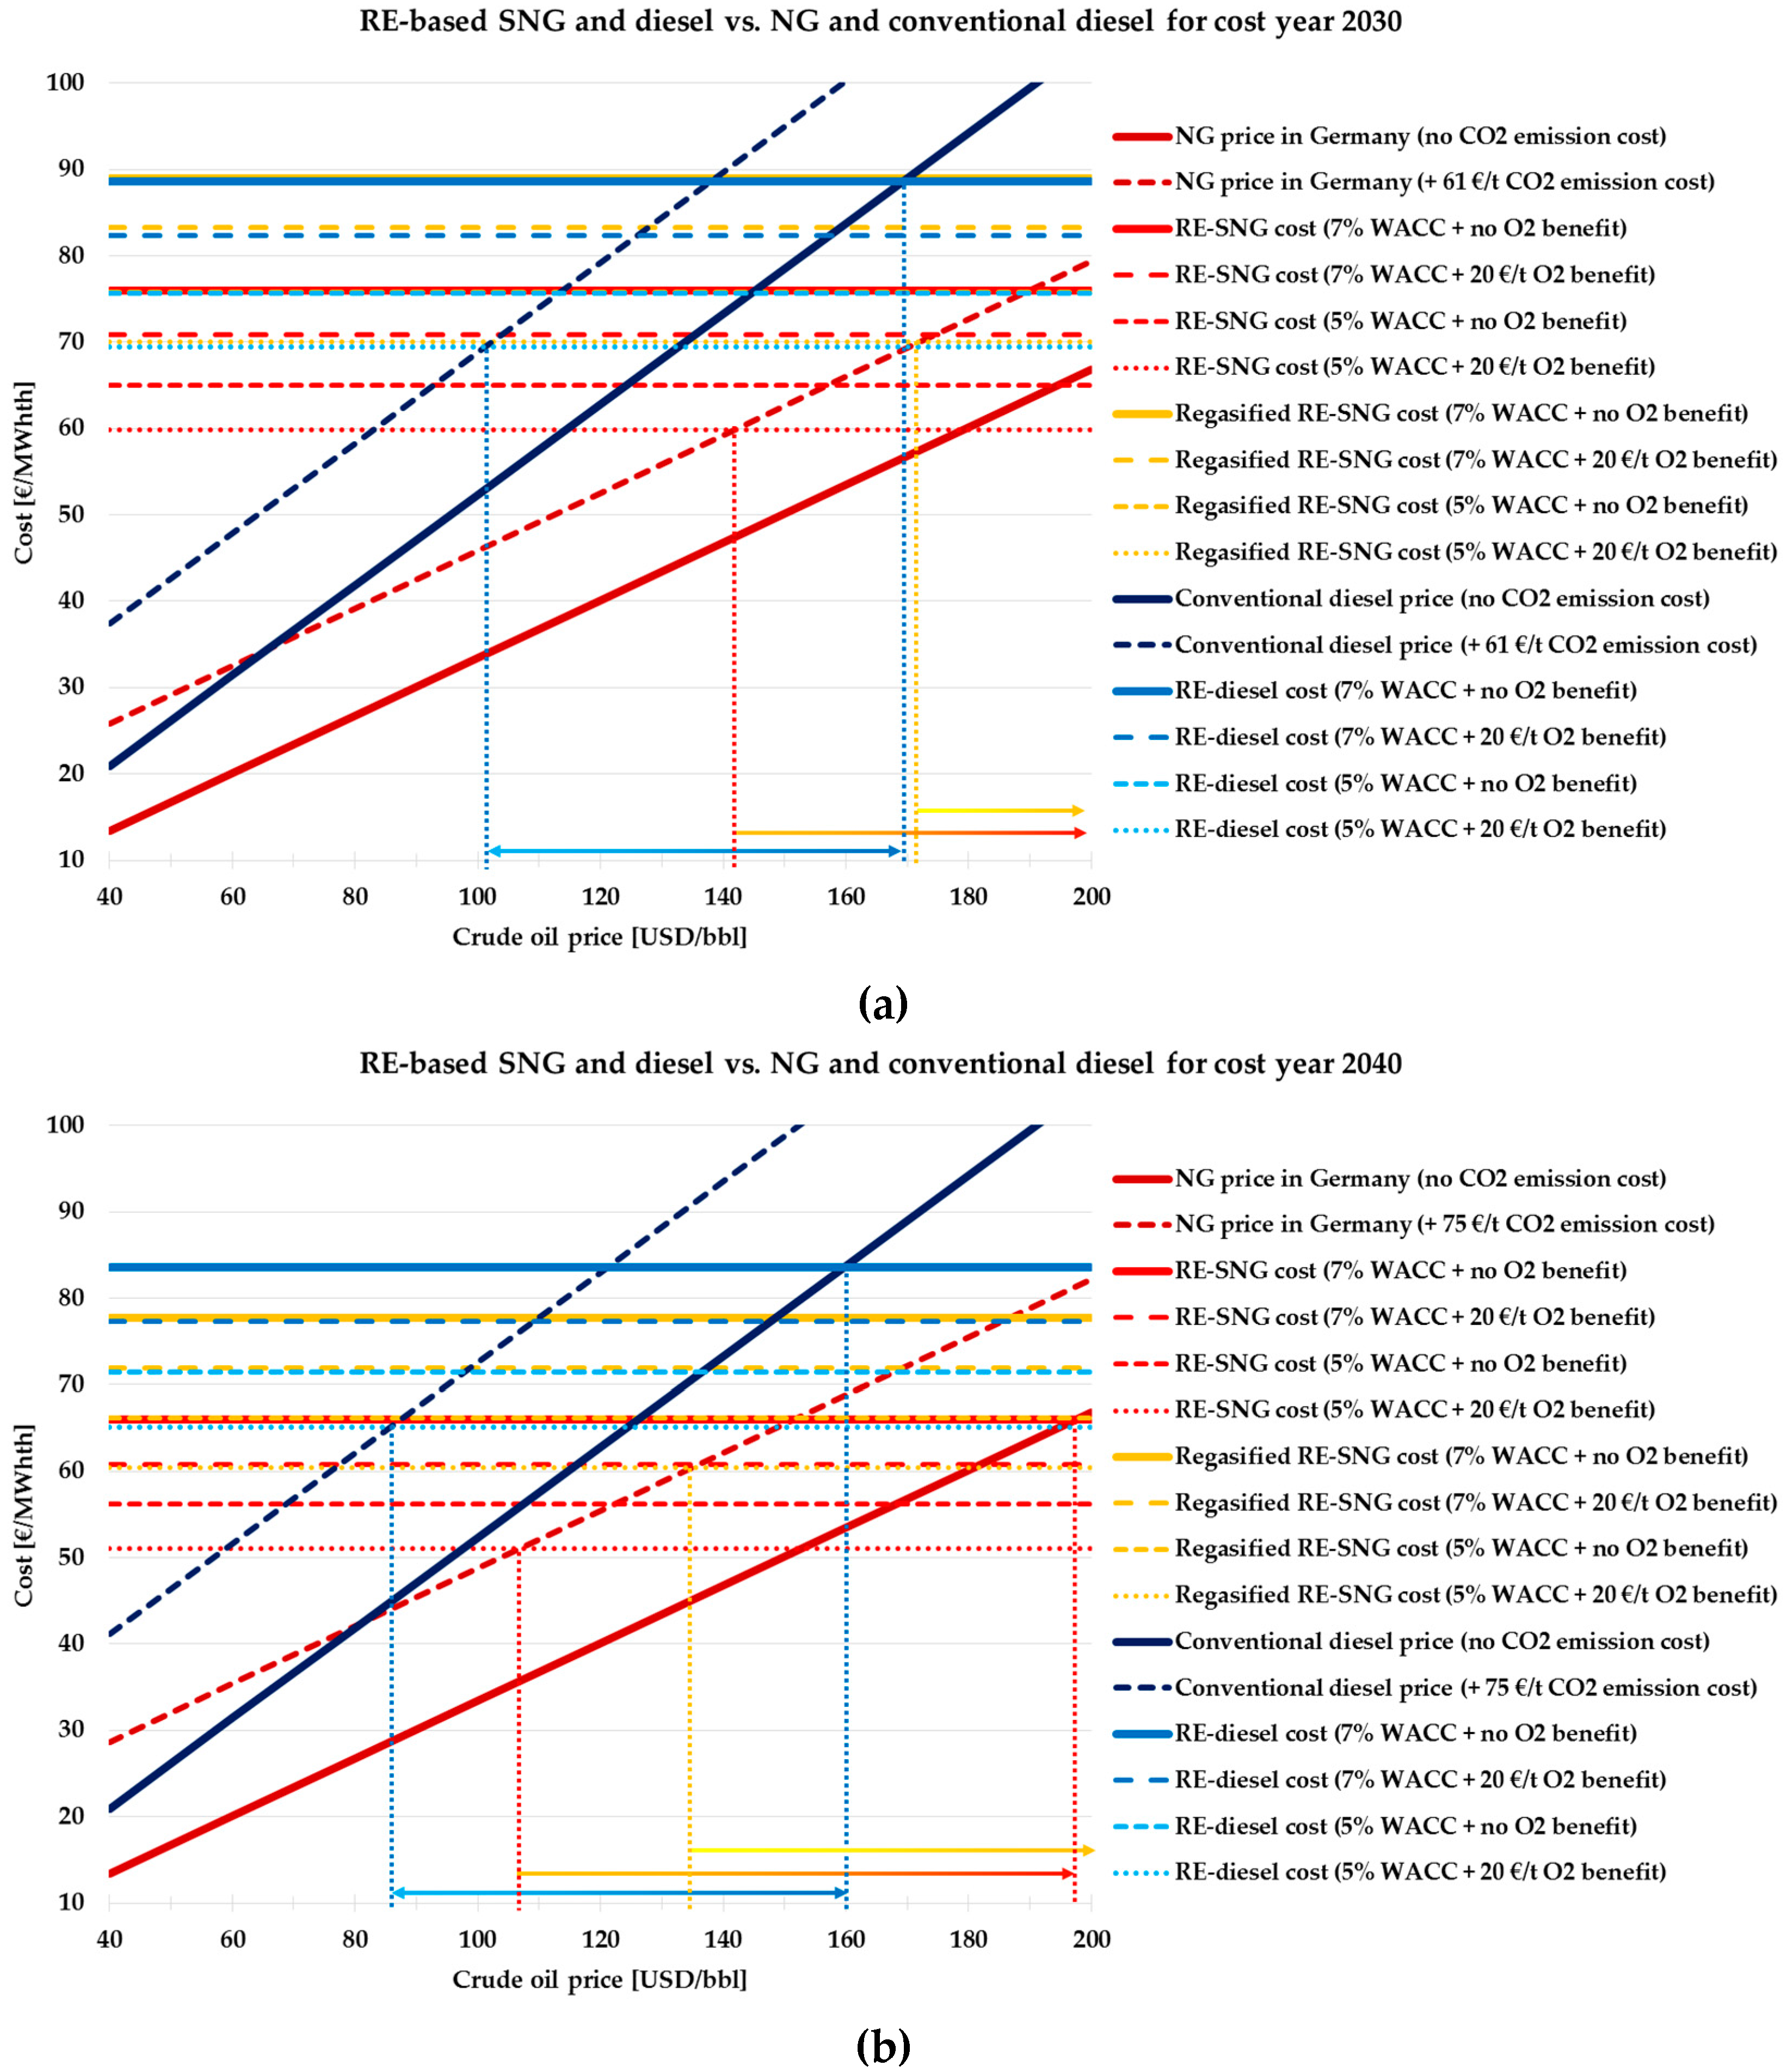
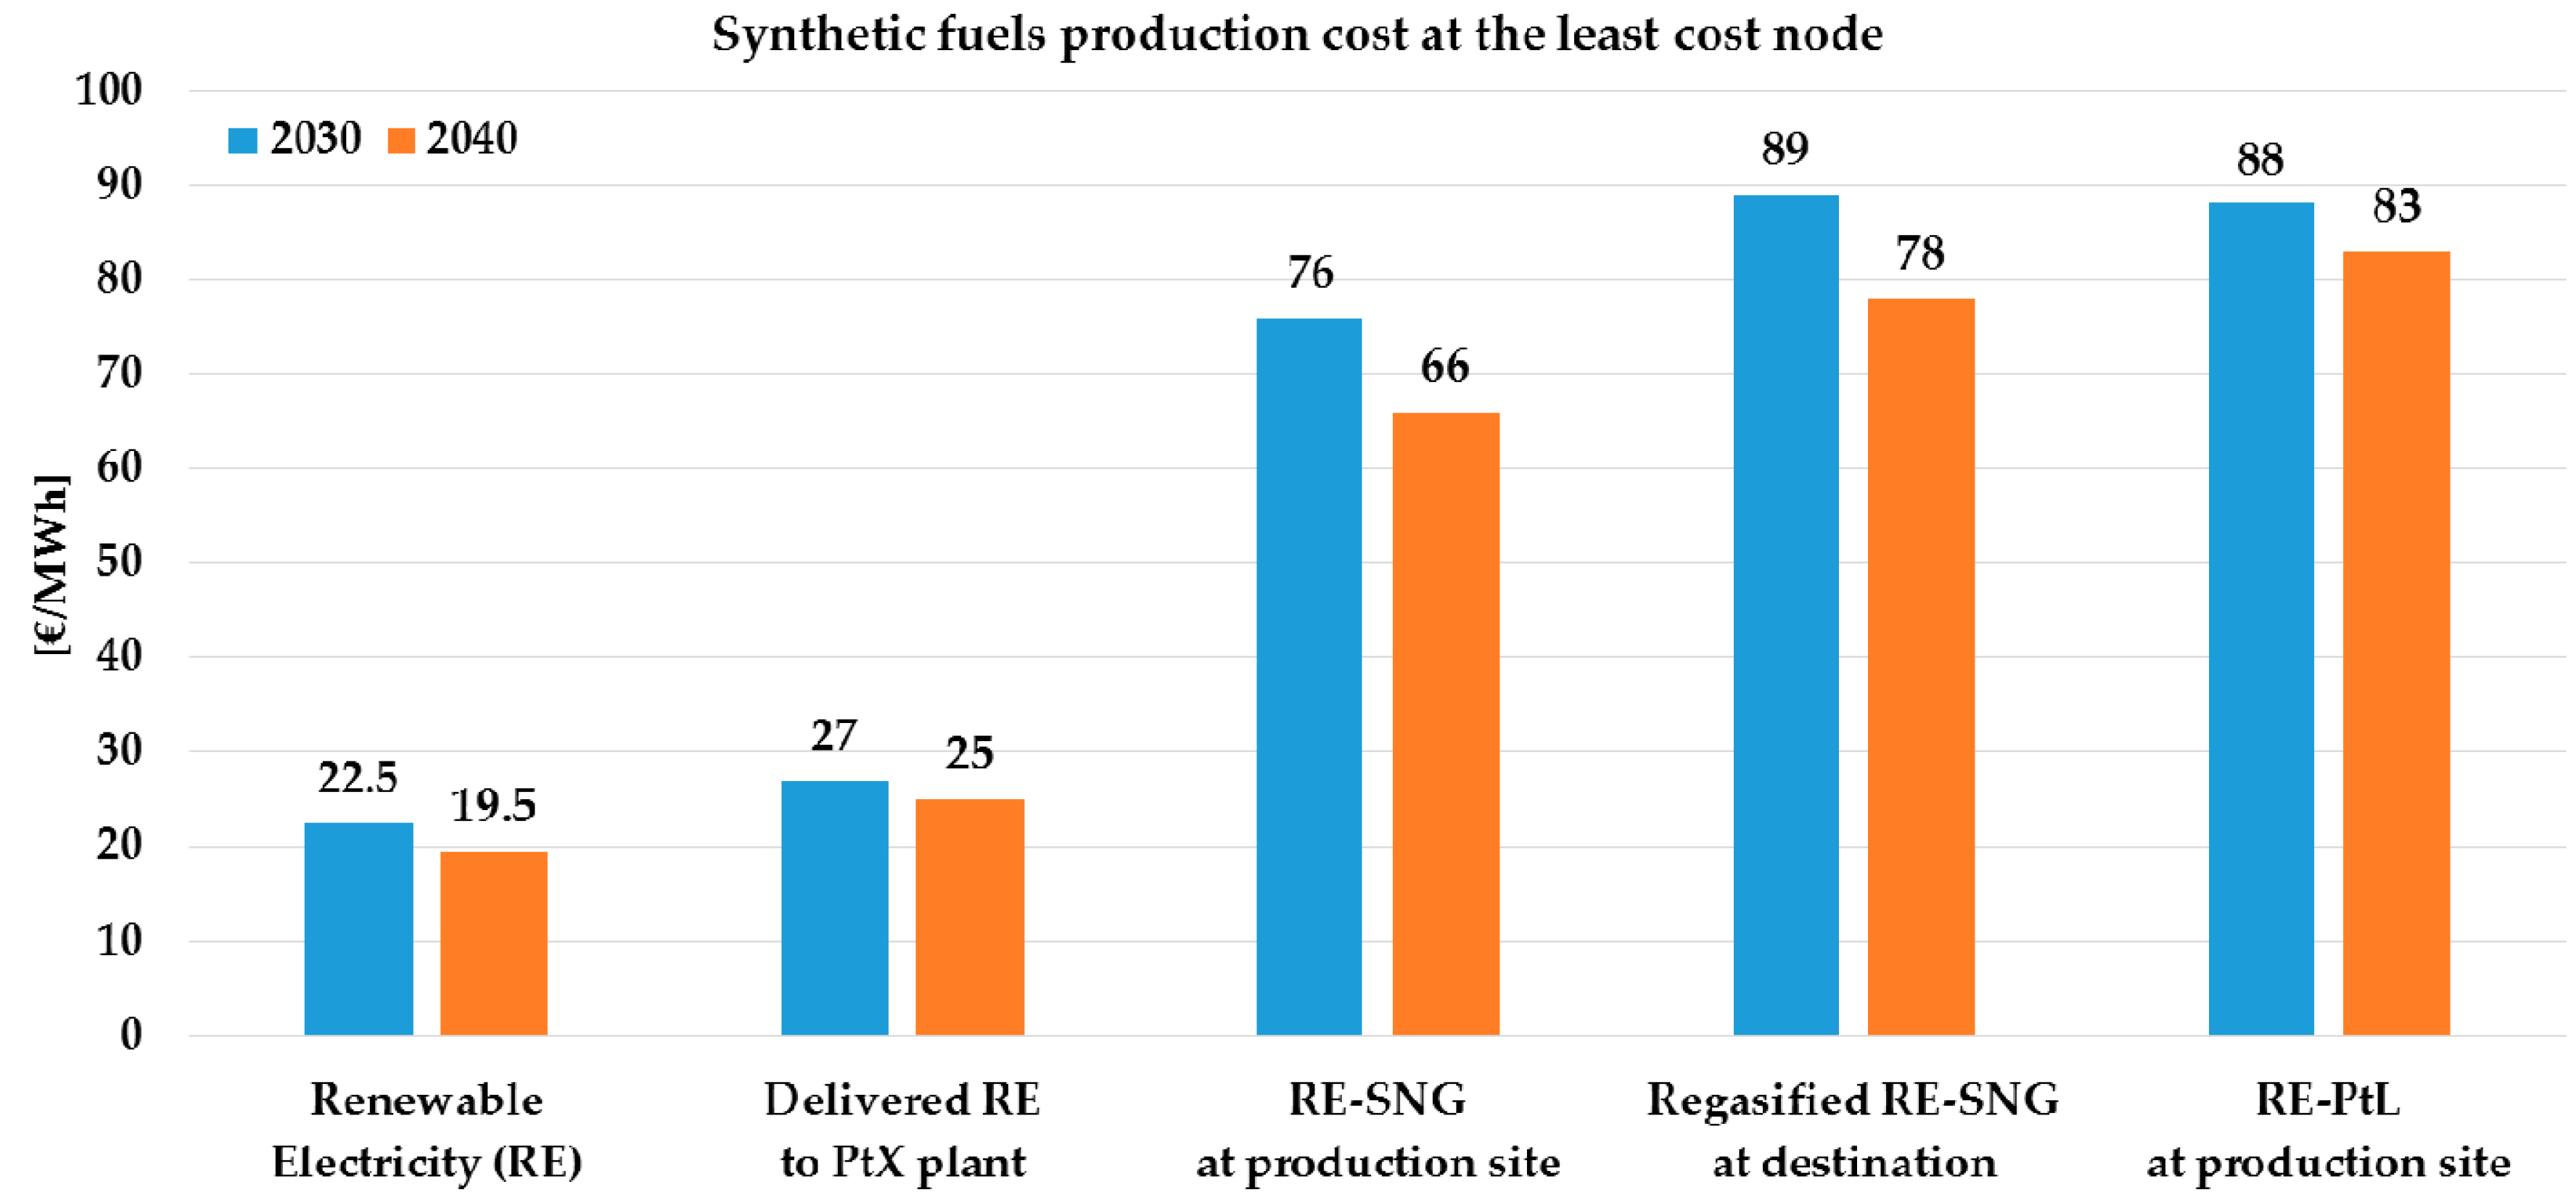
Synthetic fuel production for Europe based on hybrid PV–Wind power plants in the Maghreb region is technically feasible by the year 2030. In general, the system can run if the final product is cost competitive or there is a ban on fossil fuels. This study shows that, for the base scenario, RE-diesel produced in the Maghreb region in 2030 can reach fuel-parity with RE-diesel in the EU for a crude oil price of 169 USD/bbl, while RE-SNG in Southern Europe and regasified RE-SNG in Finland would not reach fuel-parity for the studied crude oil price of up to 200 USD/bbl. These are more than the prices of conventional fossil diesel or NG in today’s markets. However, application of CO
2 emission cost, a profitable business case for O
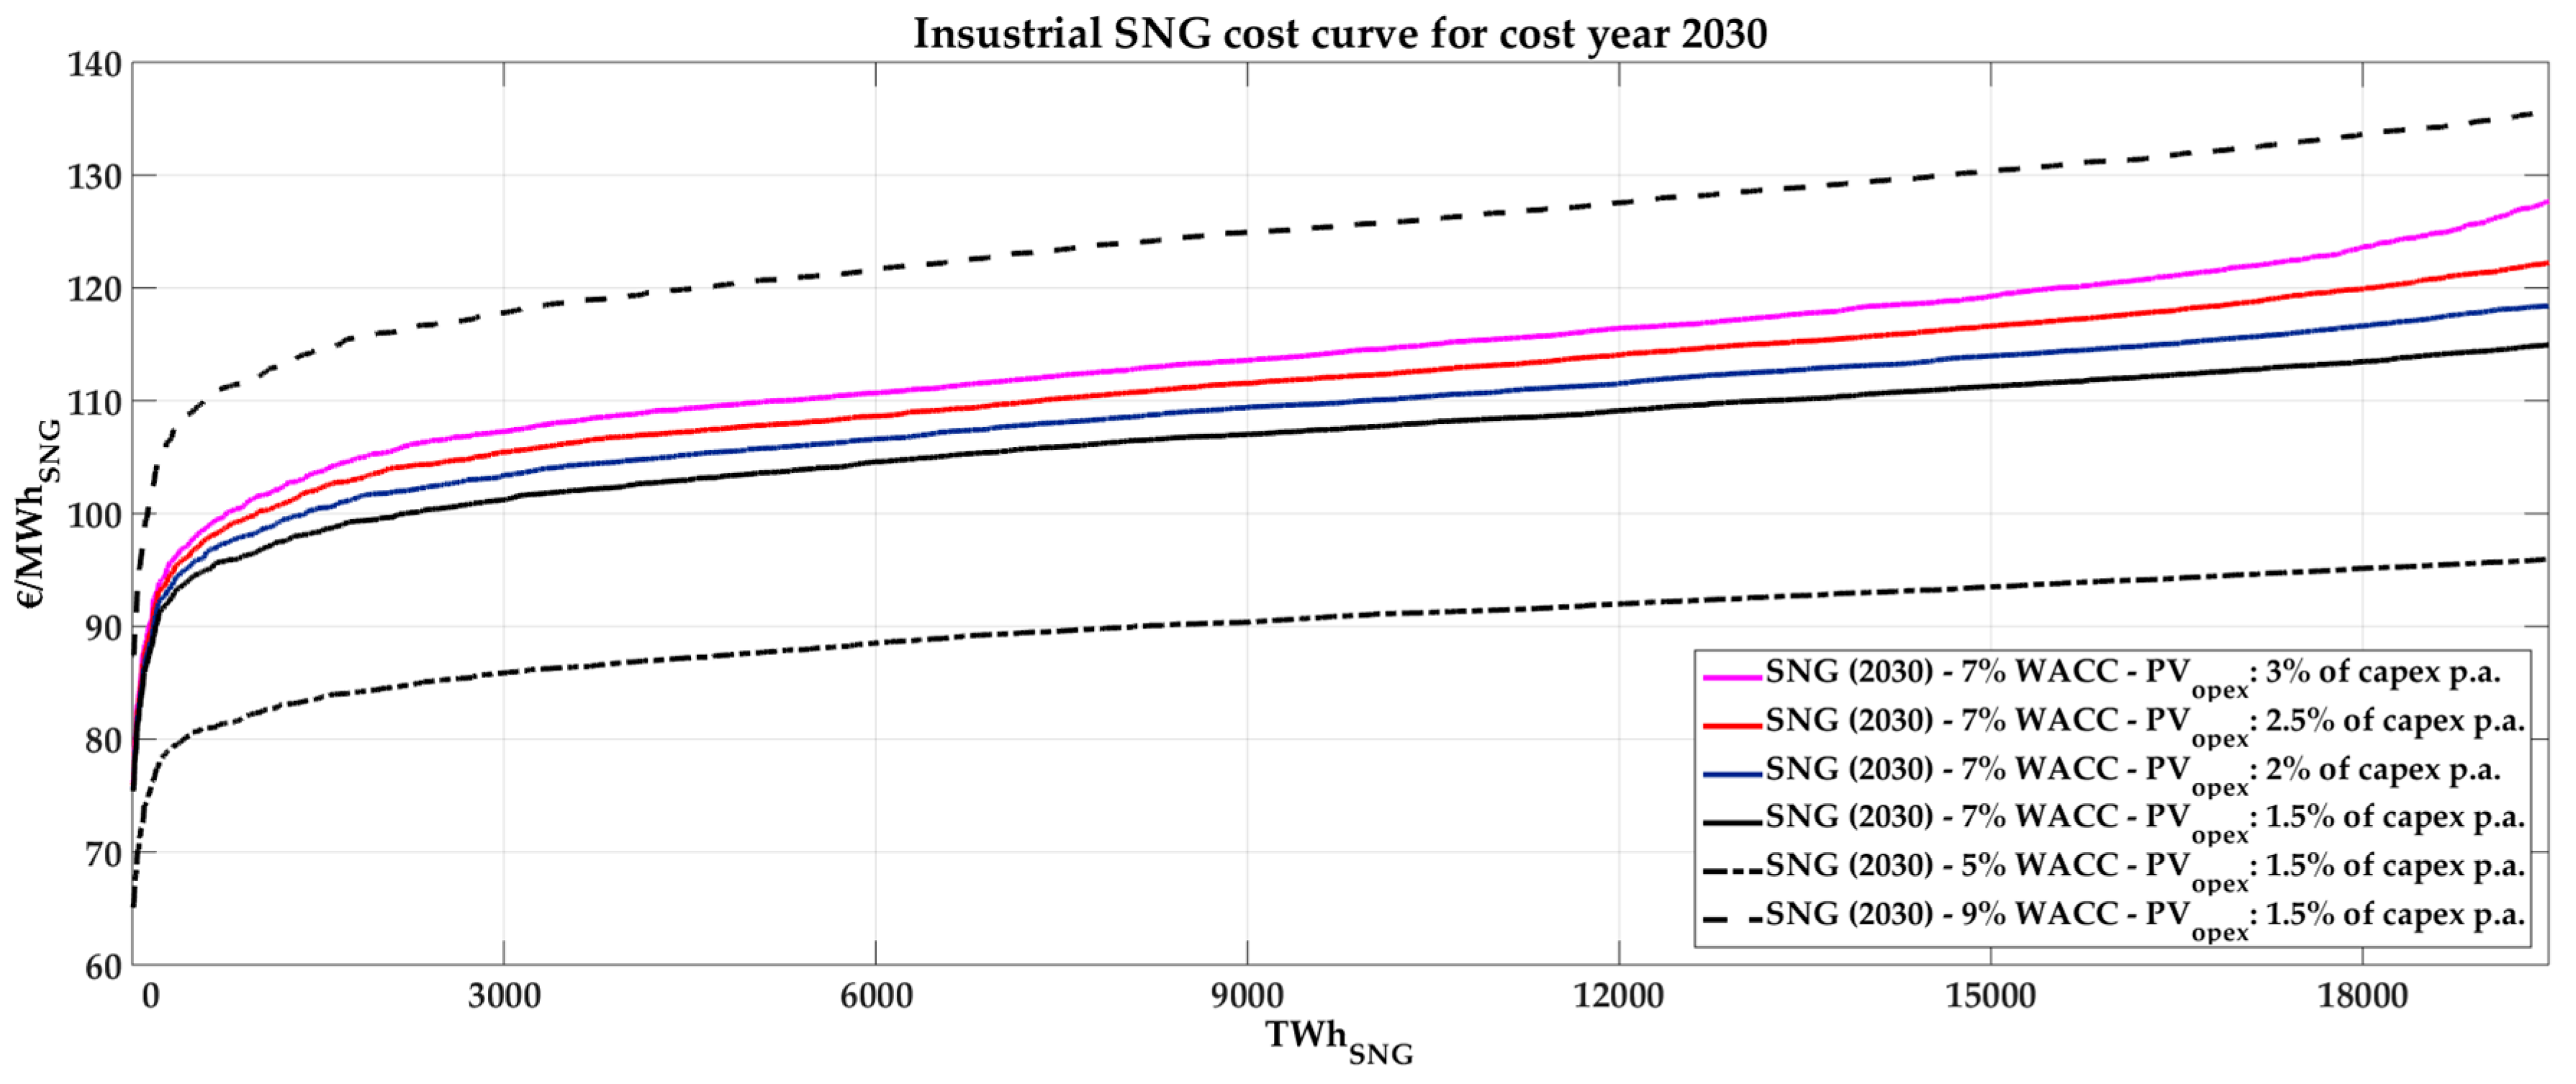
2, a feasible business case at a de-risked 5% WACC level, further advances in technologies, or cost reductions by 2040 can decrease the fuel-parity for RE-diesel and RE-SNG to crude oil prices of 86 and 107 USD/bbl, respectively. For this matter, a study of oxygen demand in the Maghreb region and Southern Europe is essential. In addition, the improvement of stability in the region will encourage investors to choose the Maghreb region for their investment in this sector. However, the Opex for solar PV might be higher in some parts of the Maghreb region with very harsh climate. The WACC may vary between 5% and 9% around the assumed 7%, depending on economic and political constraints. To reflect the impact of these factors, sensitivity analyses have been performed for WACC and the solar PV Opex for PtG in 2030, as an example. As illustrated in
Figure 17, a WACC of 9% would increase the SNG production cost by about 17%. However, the corresponding return on equity would be around 18% (for 5% interest rate and 70% debt financing), a level that reflects either extreme high risk or a business case which is close to being greedy. The solar PV Opex sensitivity analysis shows that a 0.1% absolute increase of annual Opex as a percentage of Capex leads to 1.08% higher PV LCOE and 0.4% higher synthetic fuels cost. The lower impact on fuel final production cost is because the optimized combination of different technologies would be rebalanced in order to minimize the cost effect of PV LCOE. For example, more wind power or batteries would be installed in the newly optimized system. Moreover, the Opex increase effect is almost negligible for production up to 300 TWh
th in the least cost production sites characterized by a very low share of PV (
Figure 9a).
Apart from direct air capture (DAC), other carbon capture and utilization (CCU) methods such as CO
2 from waste-to-energy plants, pulp and paper plants and the raw material from cement mills could be used in order to give the model more flexibility to find the least cost option. The direct air capturing CO
2 units in the current system are mainly powered by waste heat from the PtG or PtL plants and can deliver CO
2 with a cost range of 30–80 €/tonne in an optimized PtX system. Any other CO
2 source has to compete with this cost reference to achieve a positive effect on the overall cost-optimized system. Aghahosseini et al. [
55] concluded for the Middle East and Northern Africa (MENA) region that the sector integration of a 100% renewable electricity system with seawater desalination and industrial gas demand could lead to an additional cost benefit for the total energy system of 10.8%, due to an increased level of flexibility, which may be used for a further optimization of the utilization of intermittent RE sources. The PtX options discussed in this article have not yet been integrated in a comprehensive energy system analysis investigating further potential cost reductions due to more flexibility.
RE-diesel would be a more attractive case than SNG if the current energy system continued. Nevertheless, the production cost of synthetic fuels is not the only factor when choosing one fuel as the best option. Preference also depends on each one’s application and the corresponding demand. However, the world’s energy system will become mainly electrified in future, thus the market size for hydrocarbons would shrink to mainly aviation, heavy vehicles, and non-energetic industrial purposes. Thus, the chances are high that there would always be a surplus of crude oil and NG, which can easily keep the market price below the synthetic fuels production cost.
On the other hand, there would be more restrictions on fossil-based hydrocarbons due to environmental issues and emissions cost, in particular due to the global net zero agreement at COP21 in Paris. The standards for fuel quality may rise to a limit at which NG and conventional diesel and jet fuel cannot be produced at that quality anymore. In that case, carbon-neutral, sulfur-free SNG and SLF can be considered as one of the main substitutions, even at a higher production cost. In that case, RE-synthetic fuels produced in the Maghreb region would be one of the cheapest available options for Europe. Thus, a decent market potential is seen for both SNG and RE-diesel for the EU in 2030 and 2040, which the Maghreb region can address and gain a significant share.


