
Towards Urban Resilience: A Multi-Criteria Analysis of Seismic Vulnerability in Iasi City (Romania)


Abstract
:1. Introduction
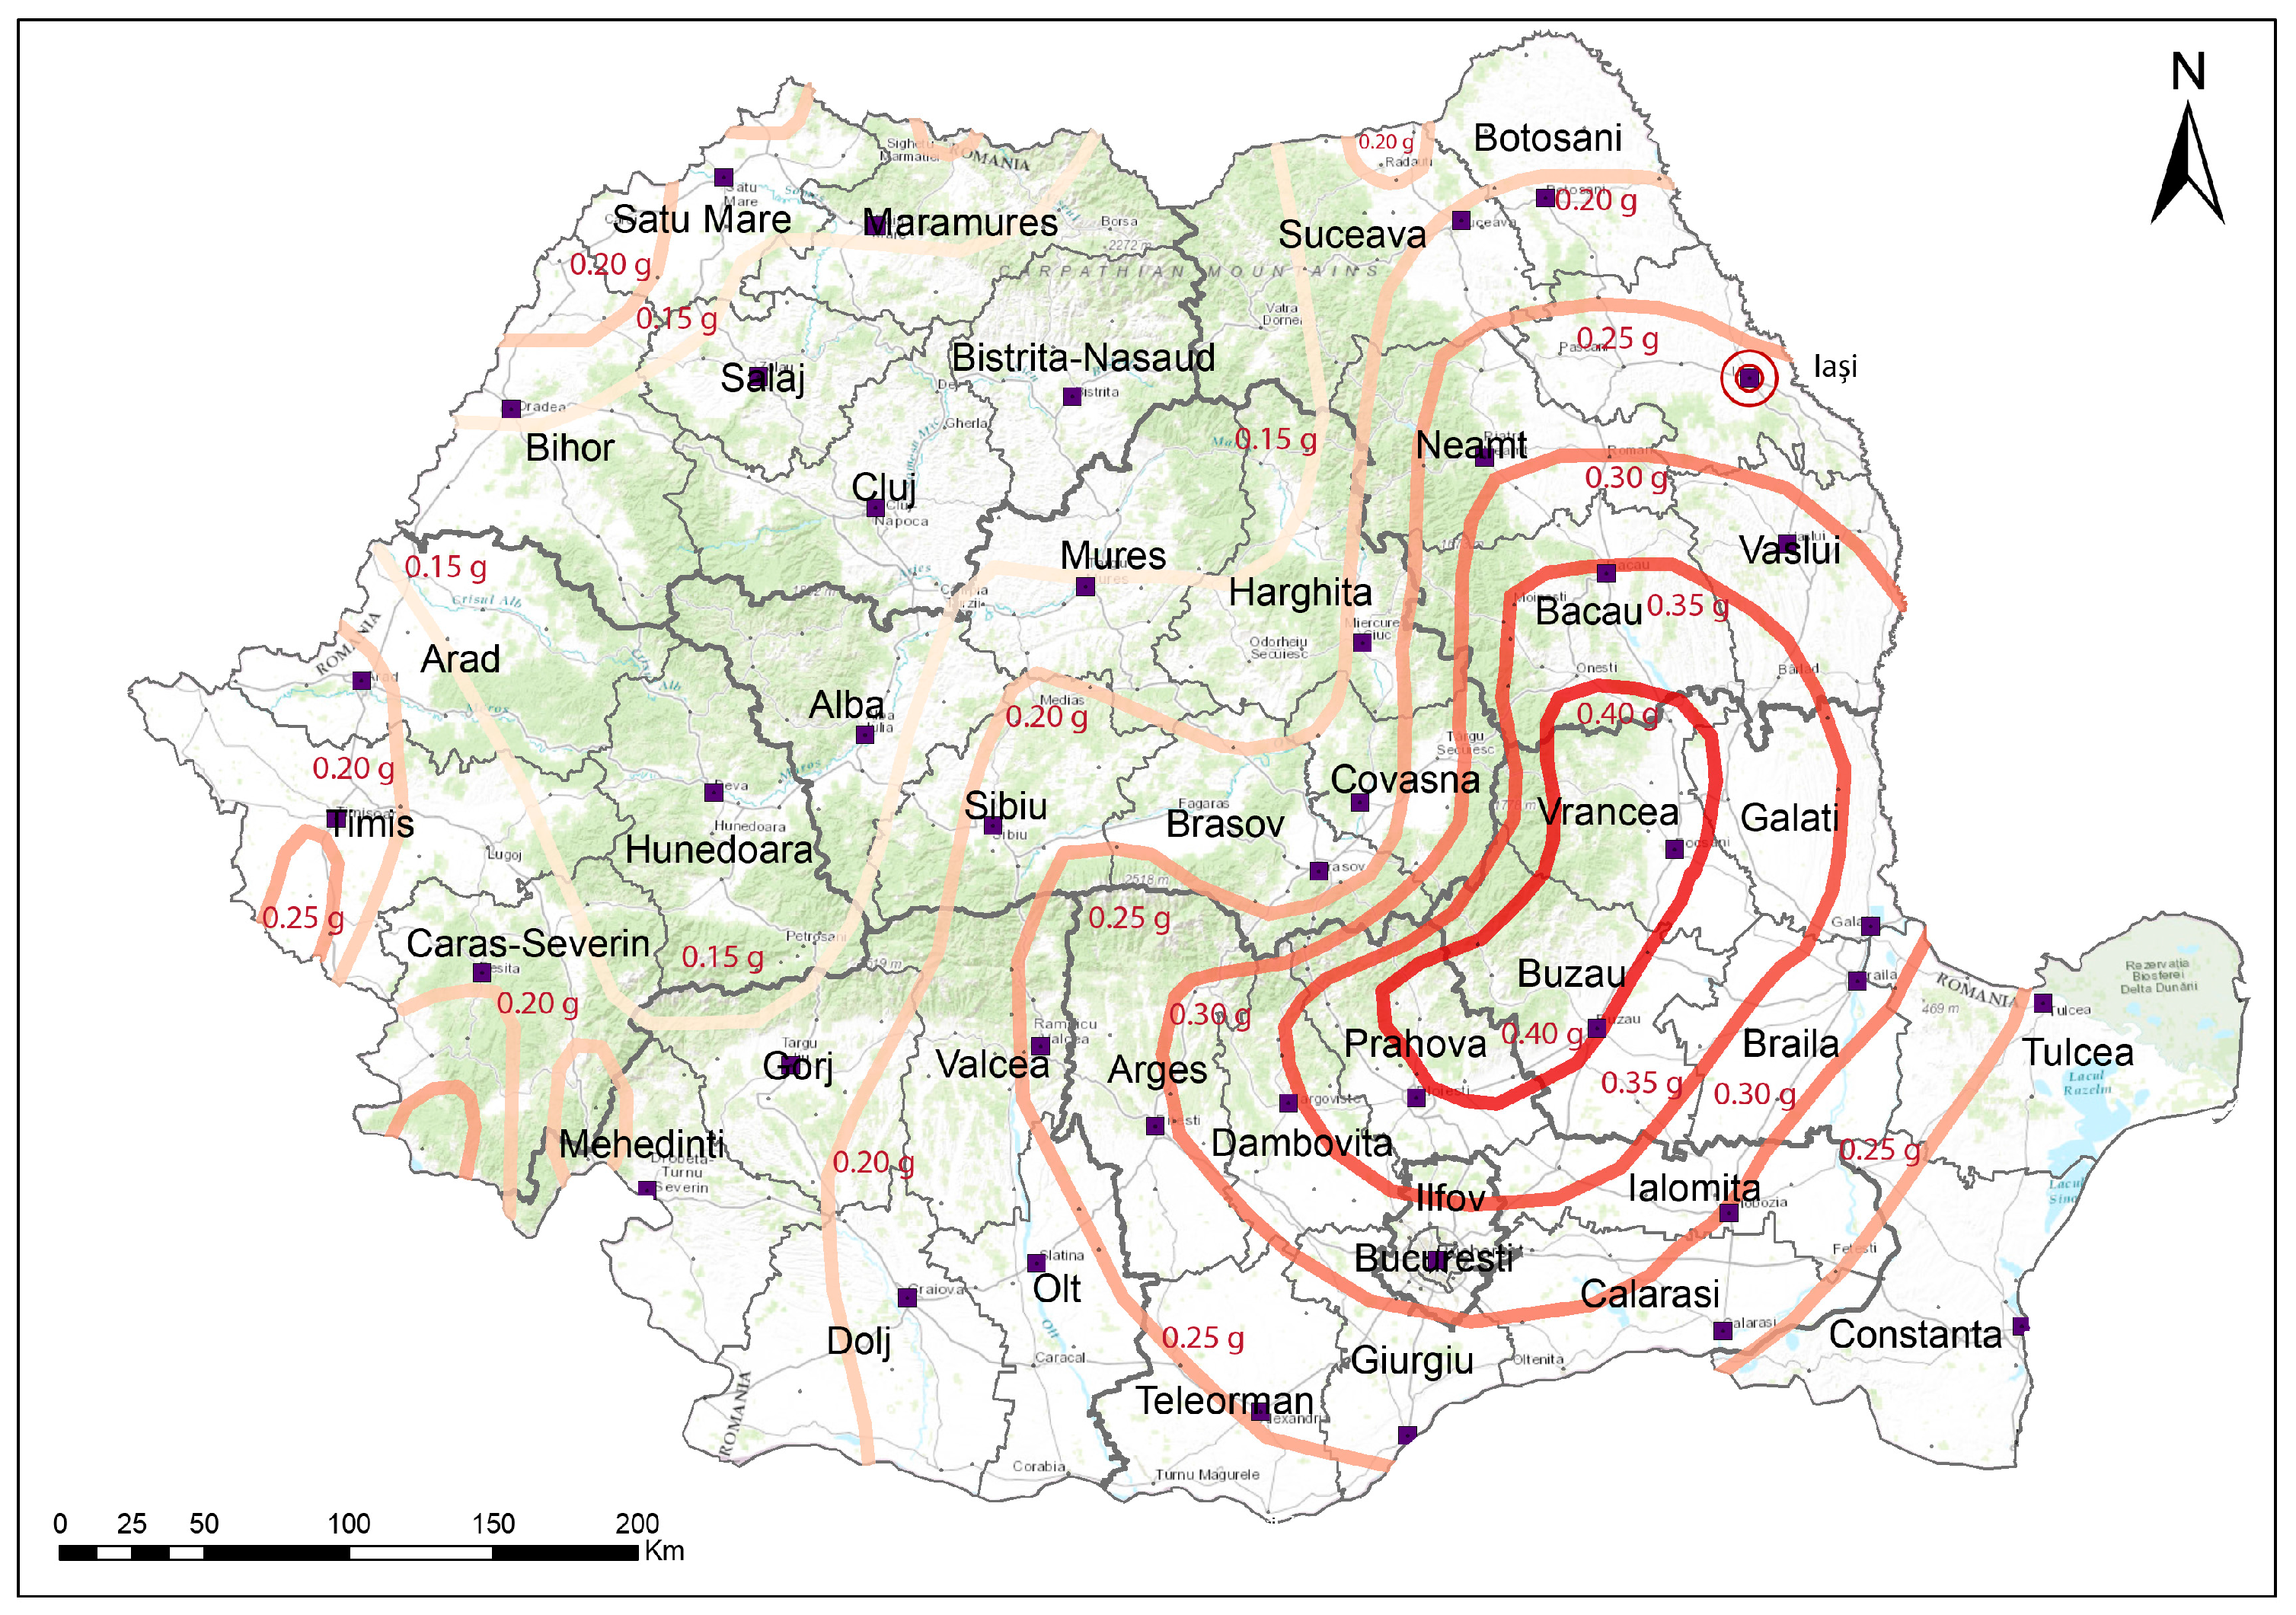
2. Study Area
3. Materials and Methods
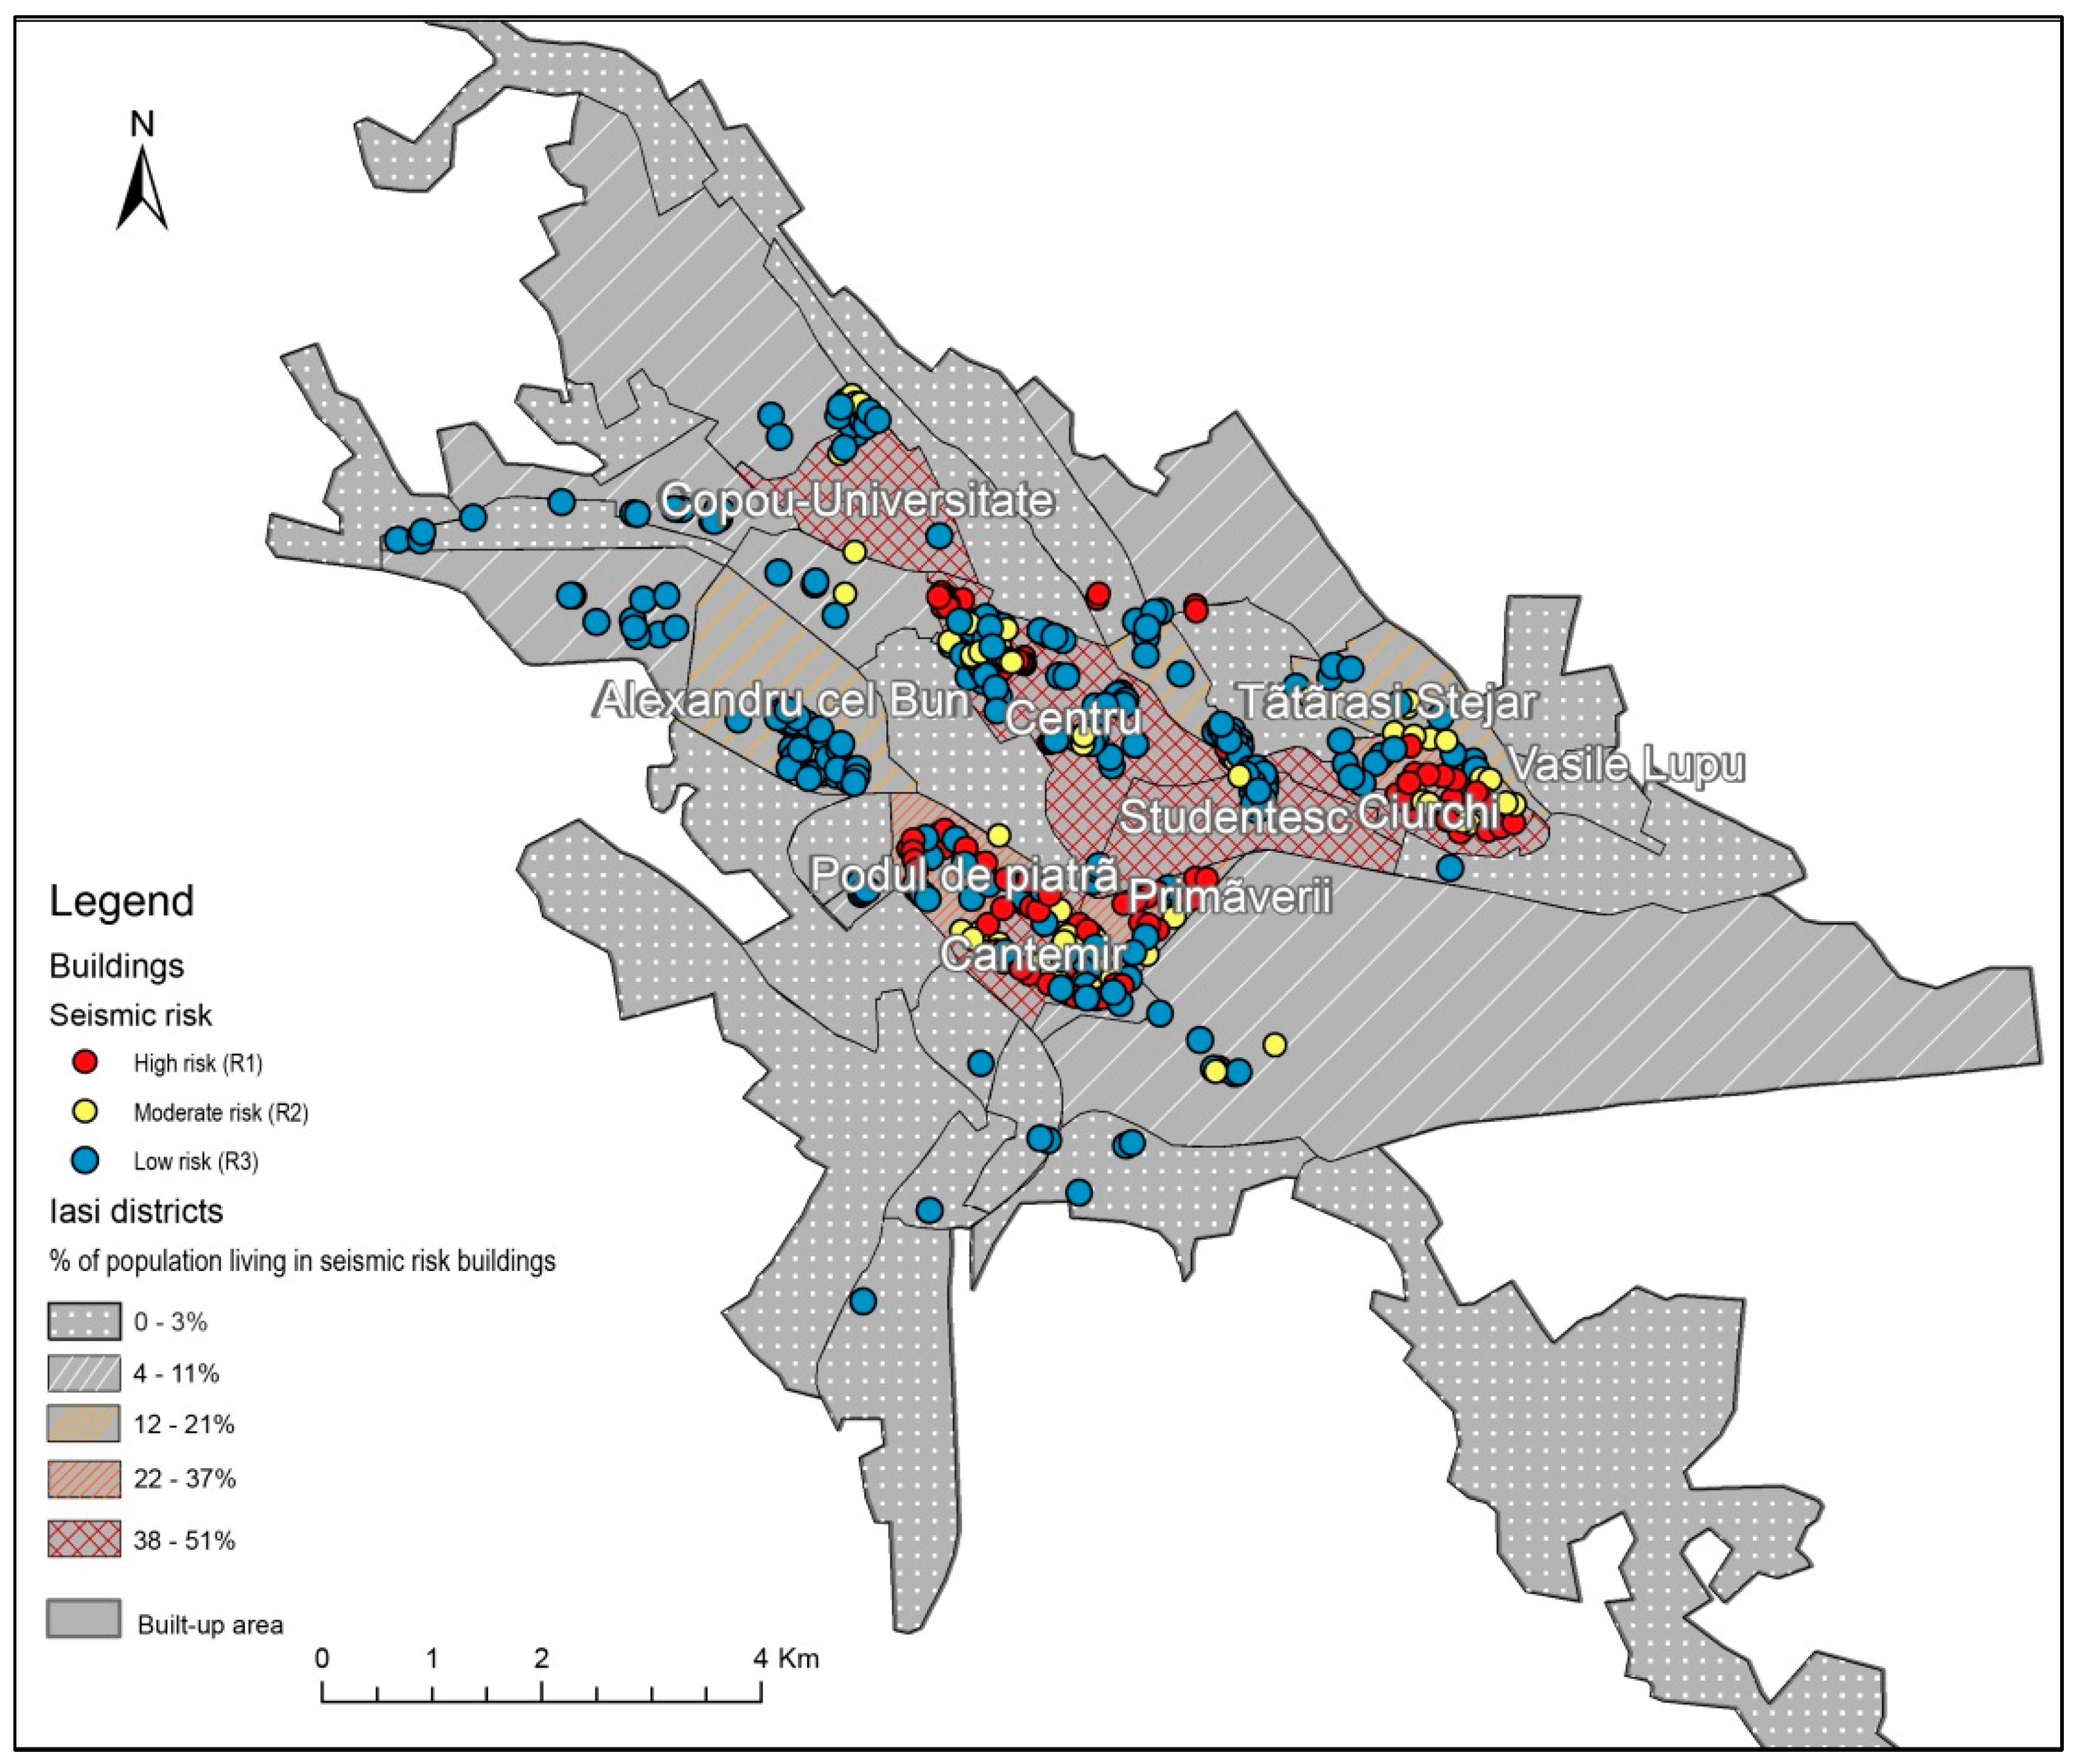
- High risk (R1)—Risk of collapsing in case of an earthquake with a magnitude higher than 7;
- Average risk (R2)—No major risk of collapsing in case of earthquake, but risk of structural damages;
- Low risk (R3)—Small damages in walls or decorations that can endanger the safety of the inhabitants; and
- No risk (R4)—No major risk in case of earthquake. Buildings with no risk were not taken into consideration in the present study.
4. Results
4.1. Physical Vulnerability
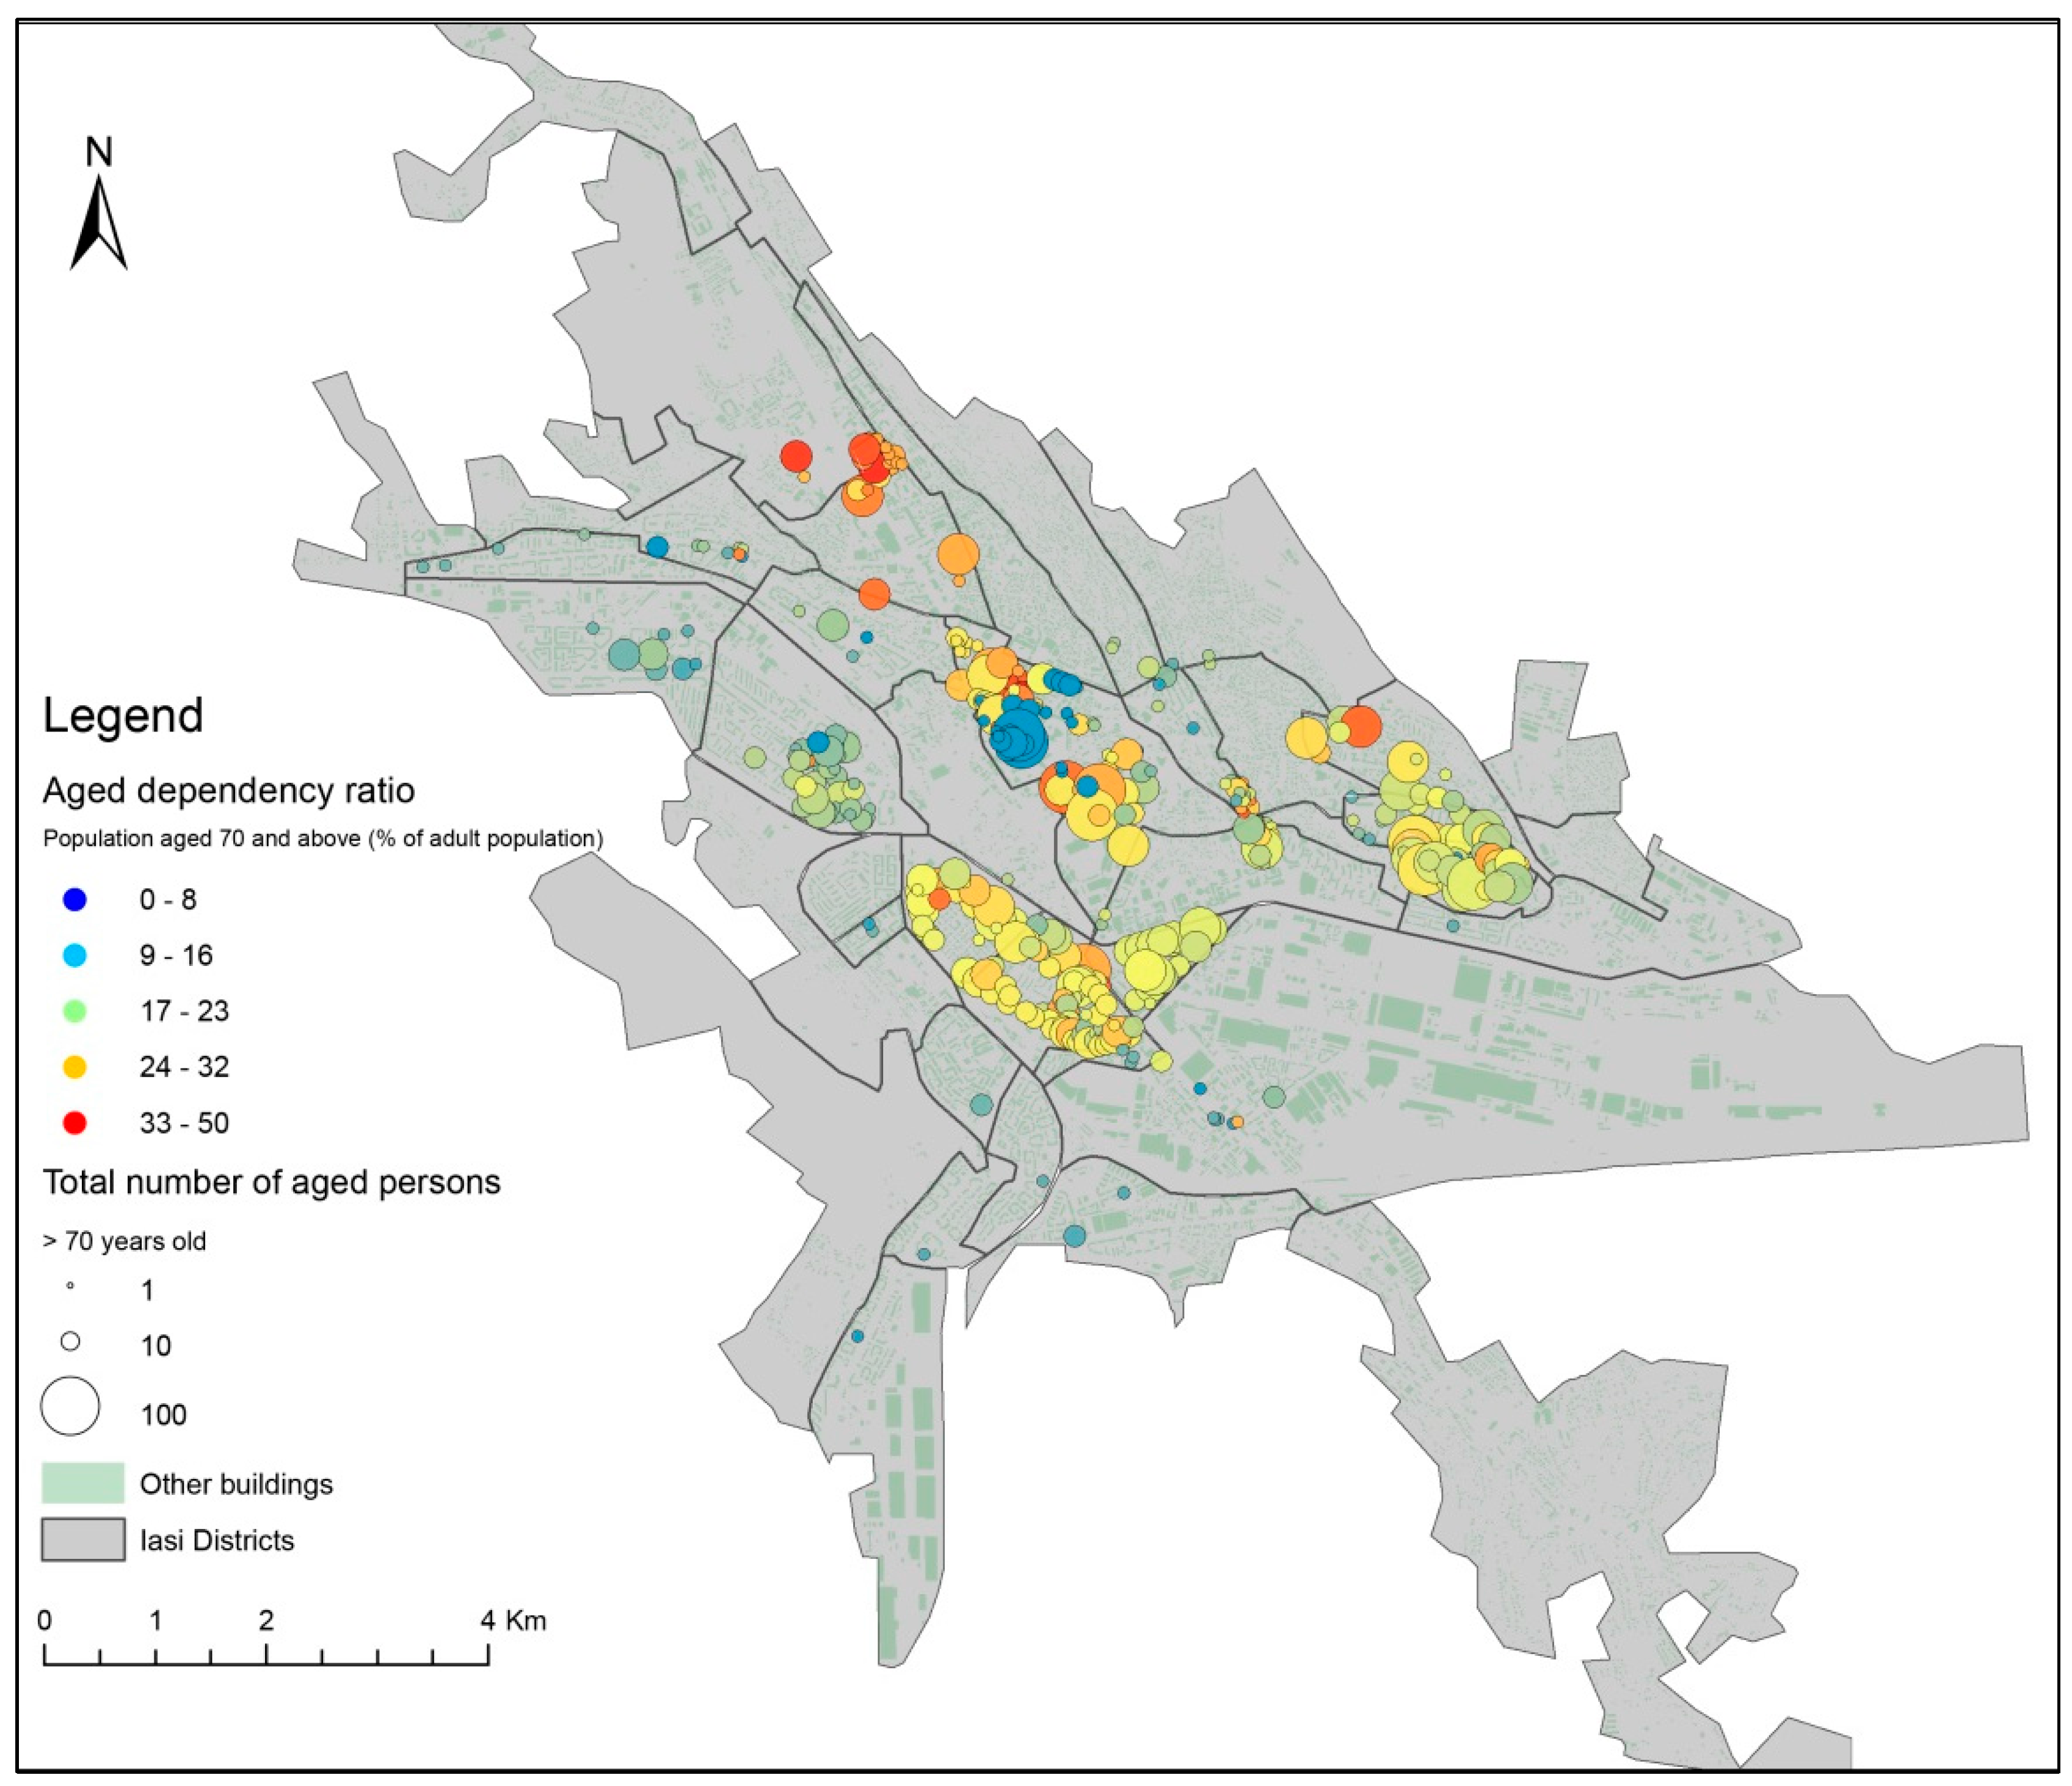
4.2. Social-Economic Vulnerability
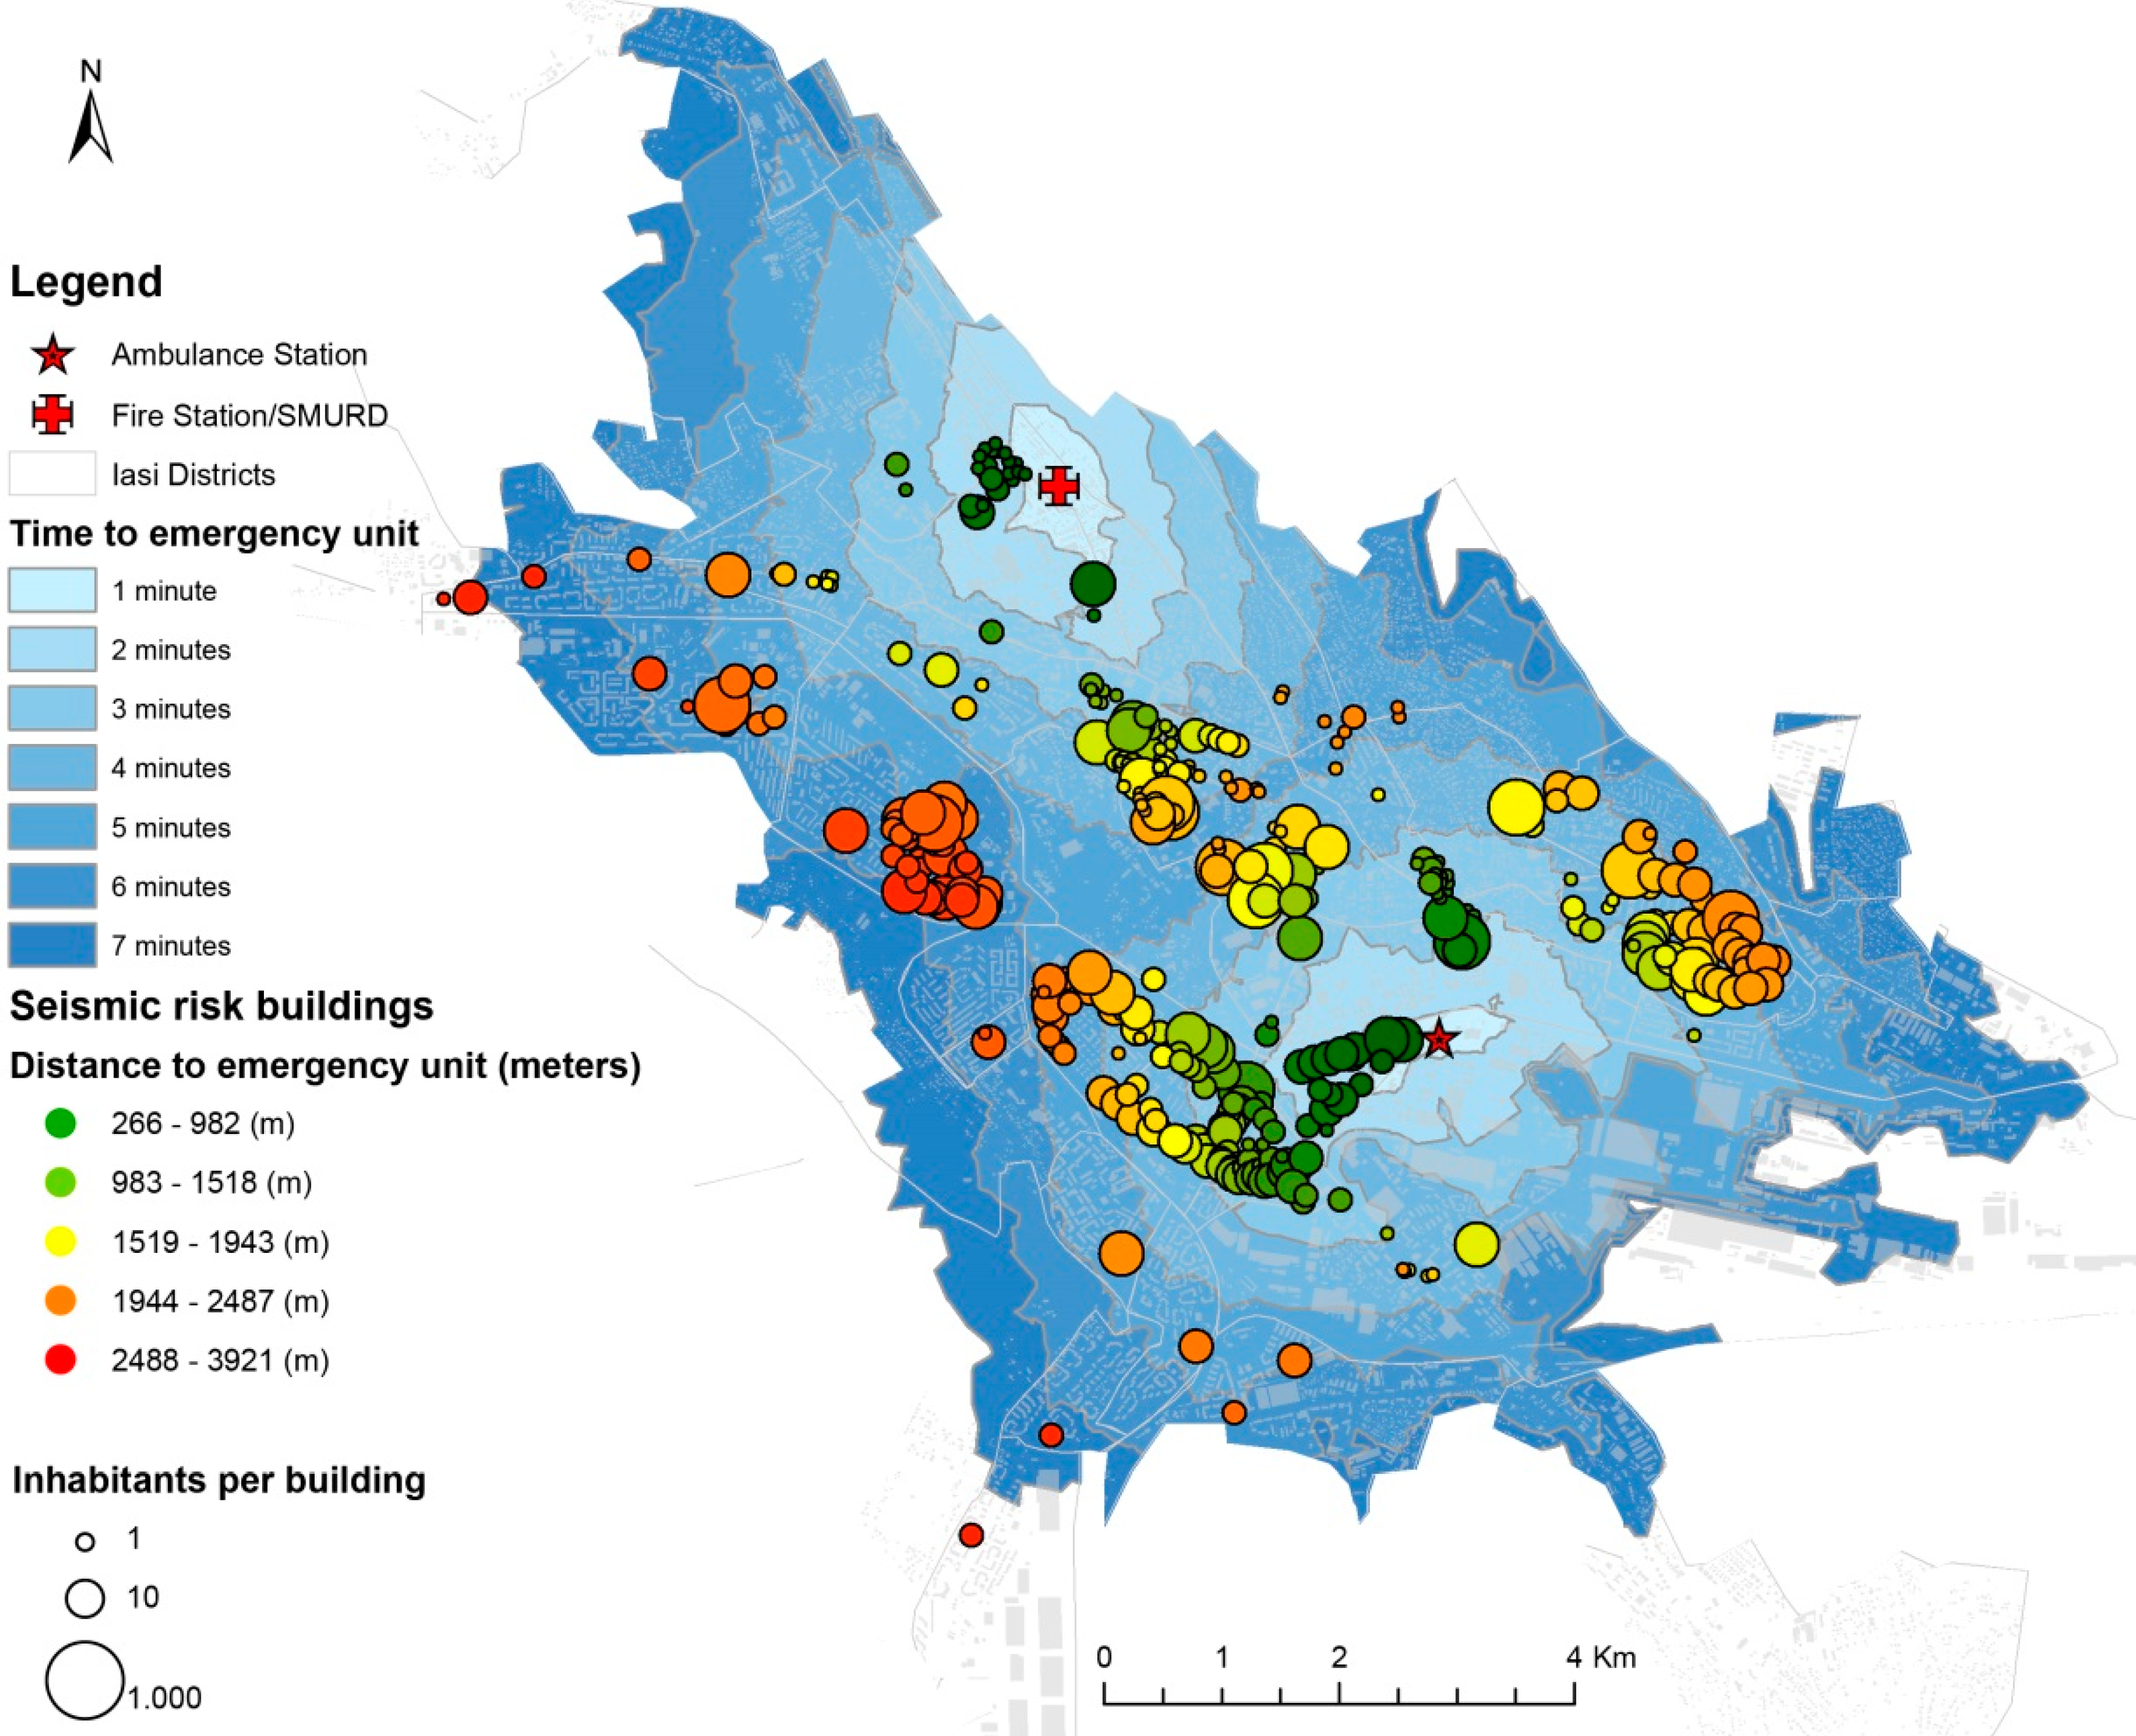
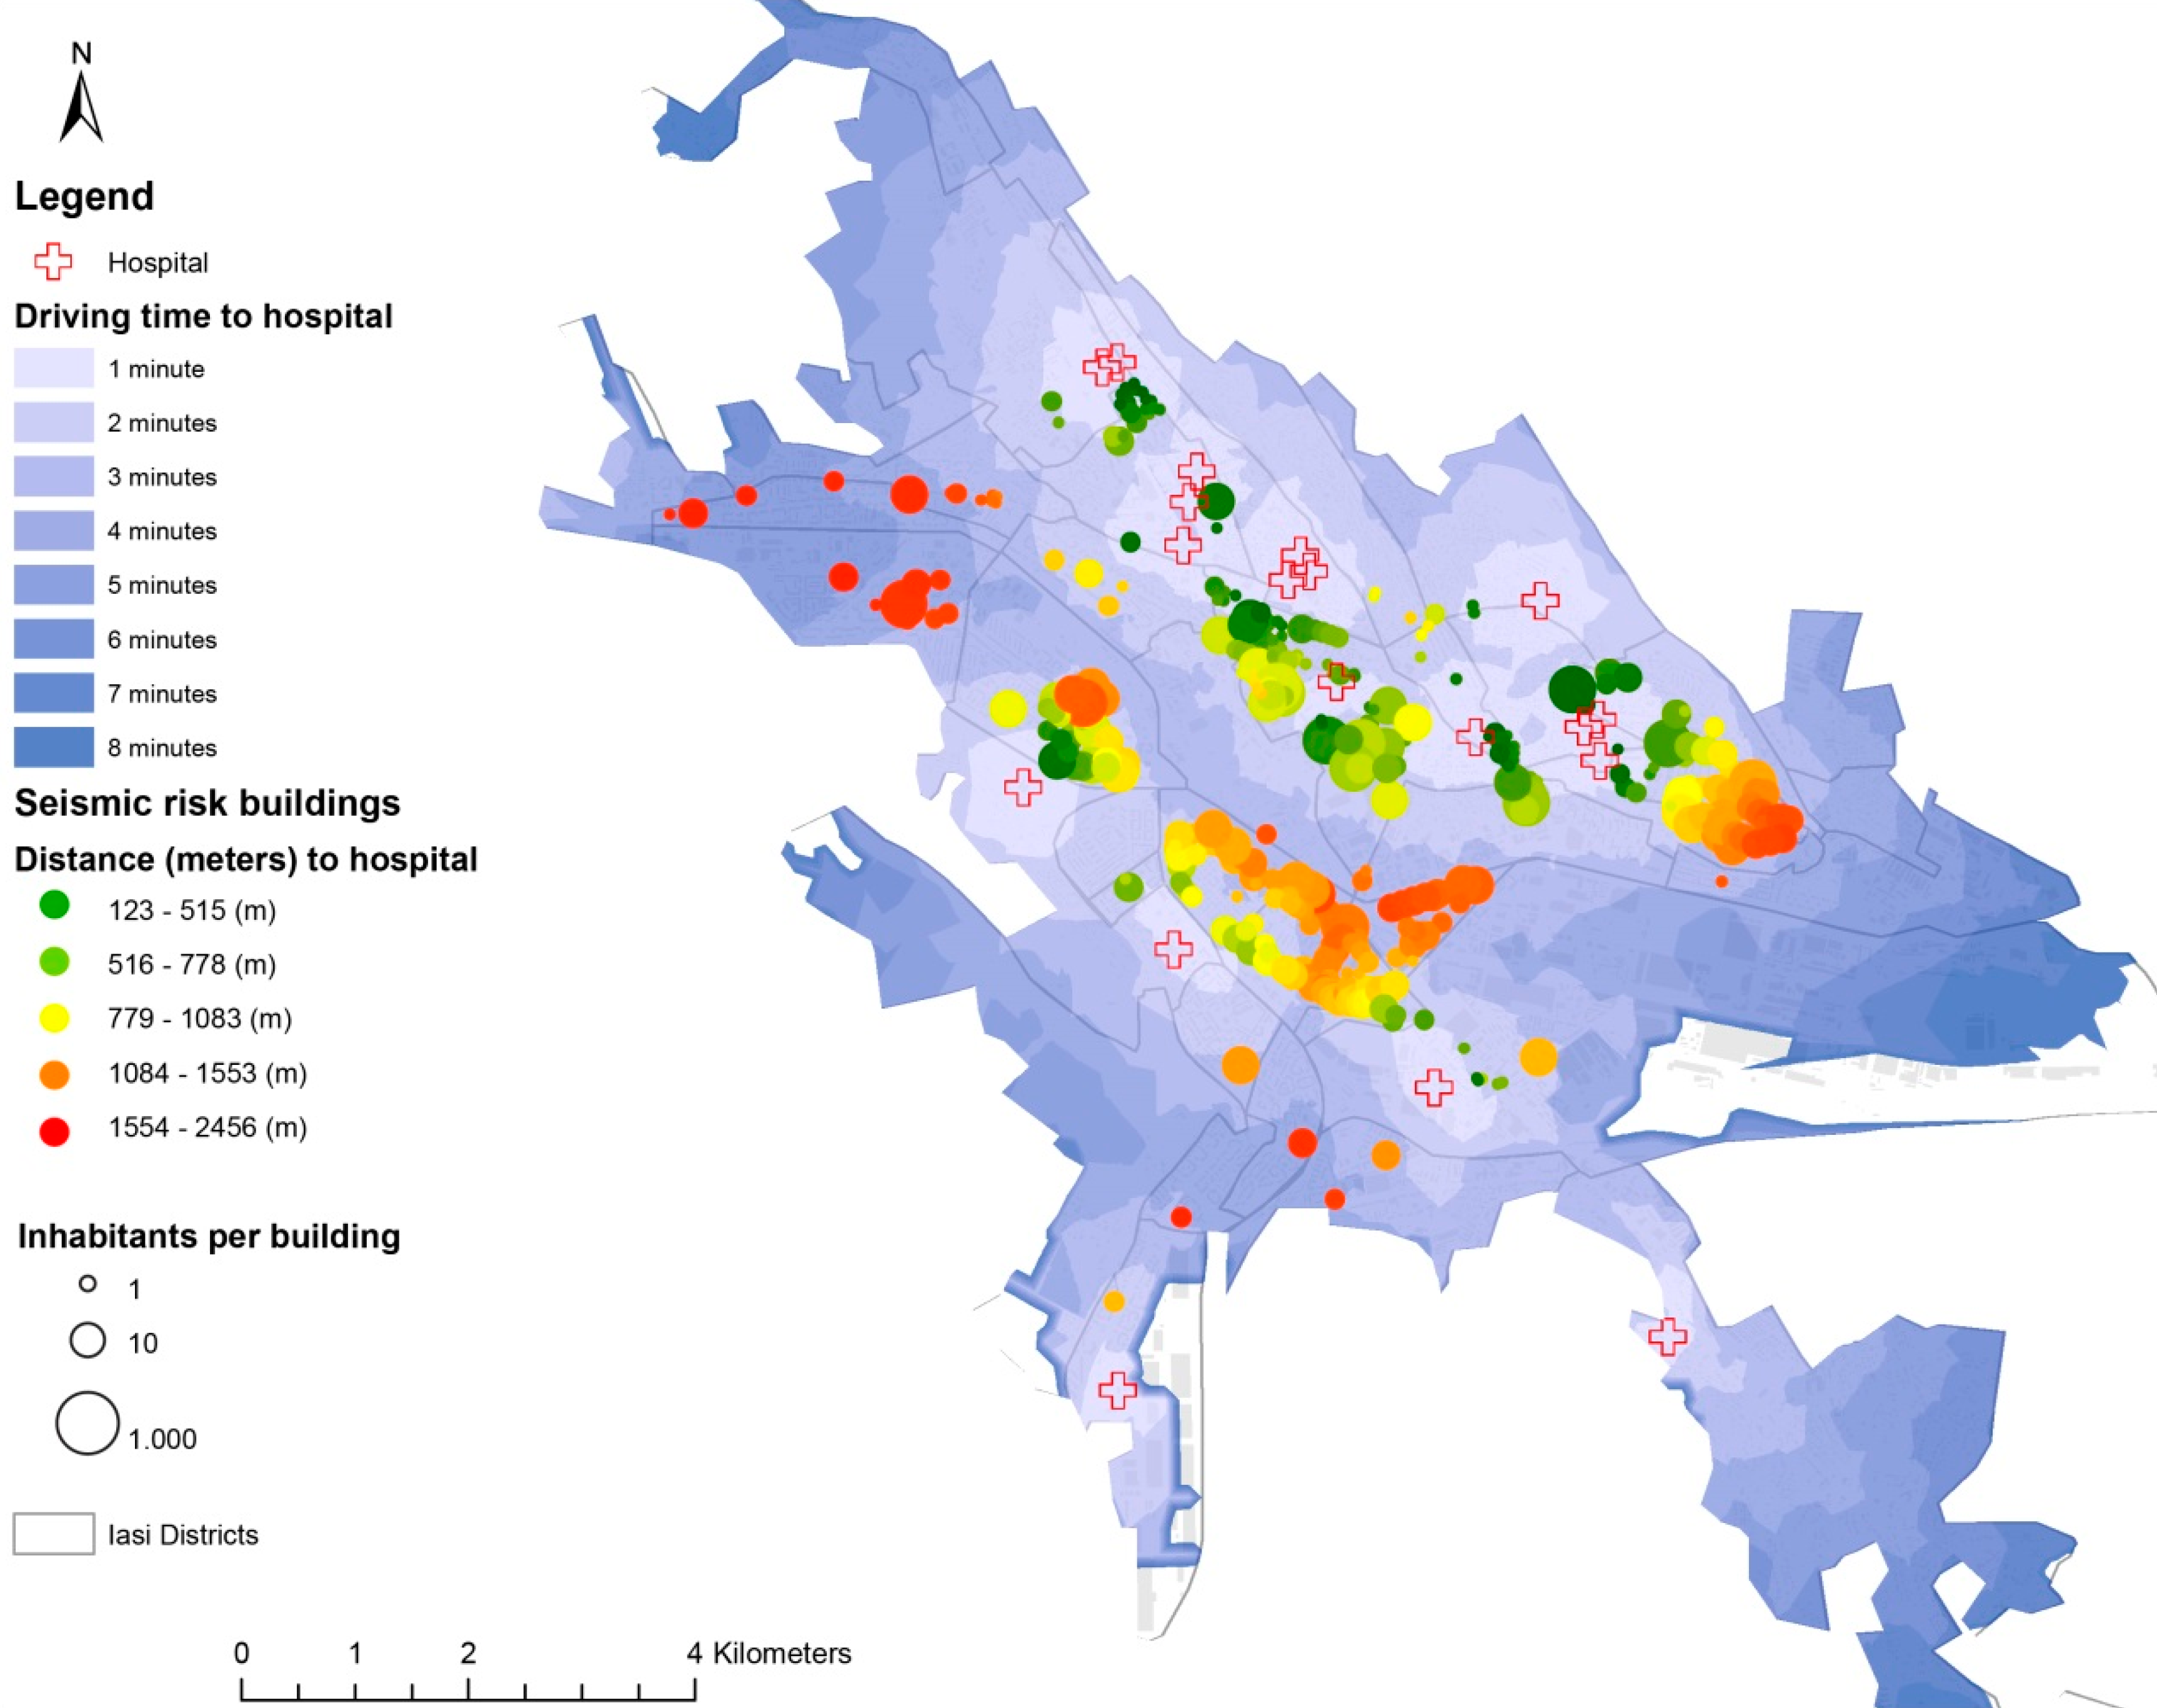
4.3. Systemic Vulnerability
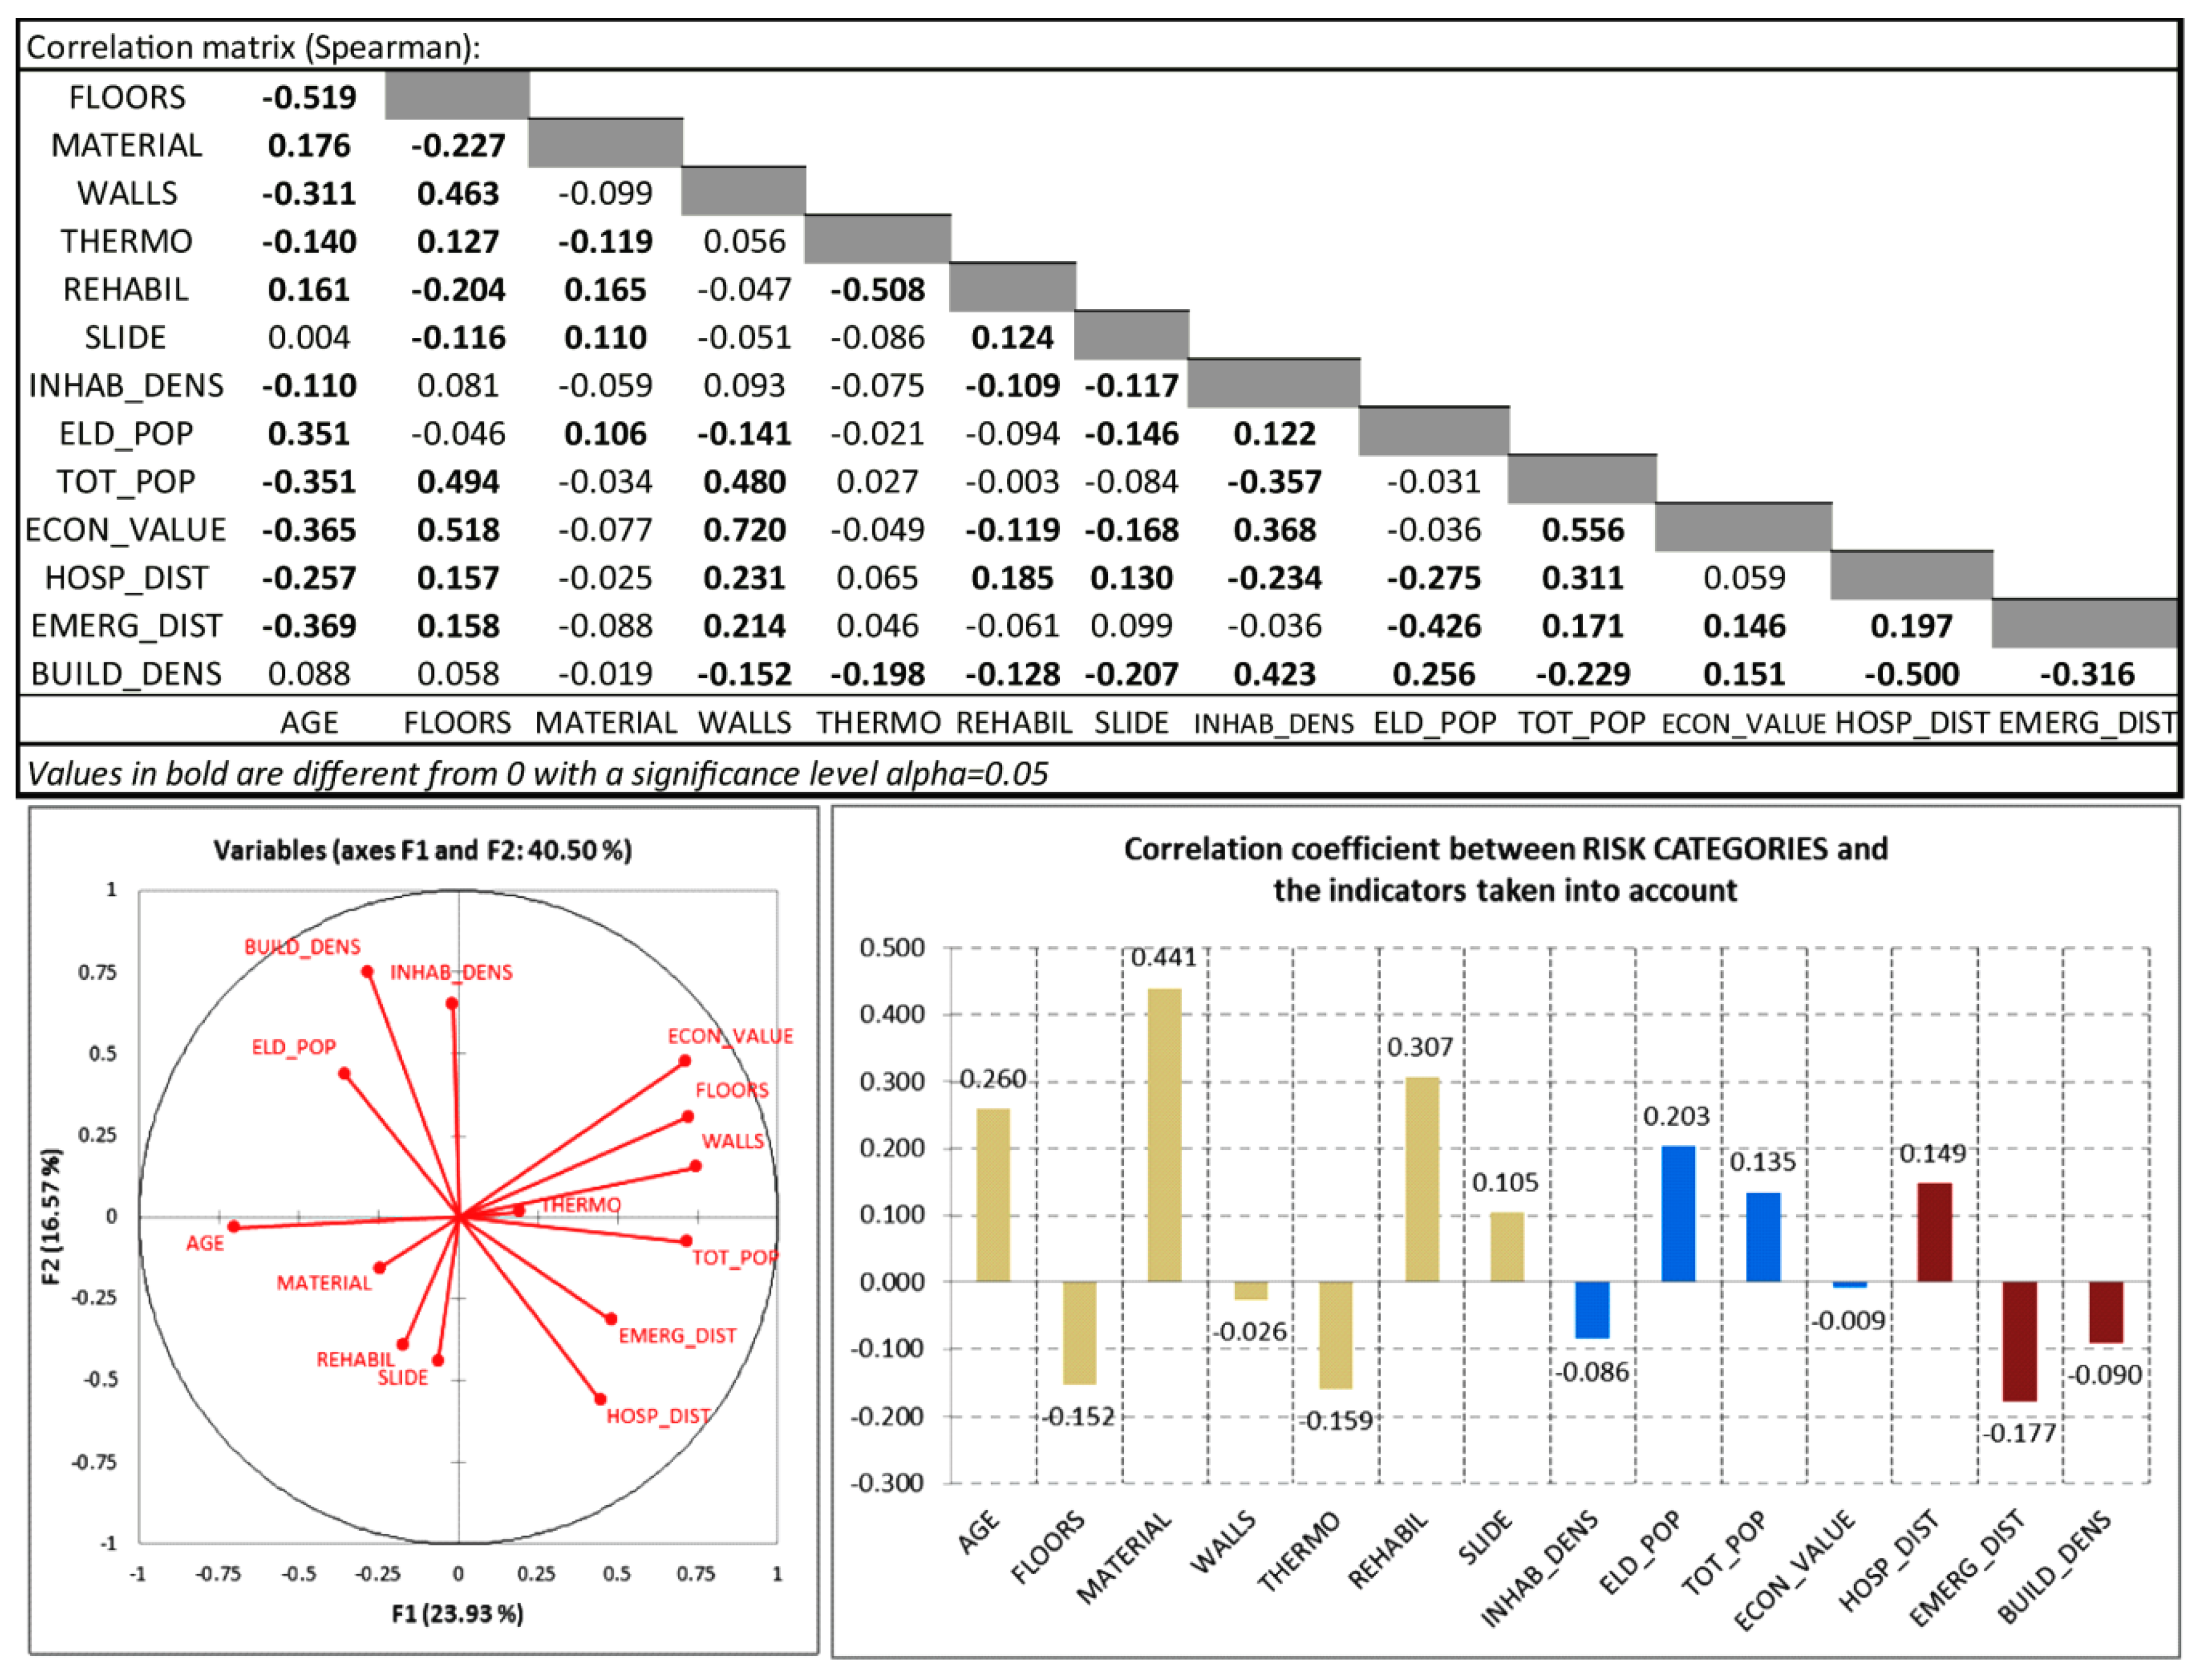
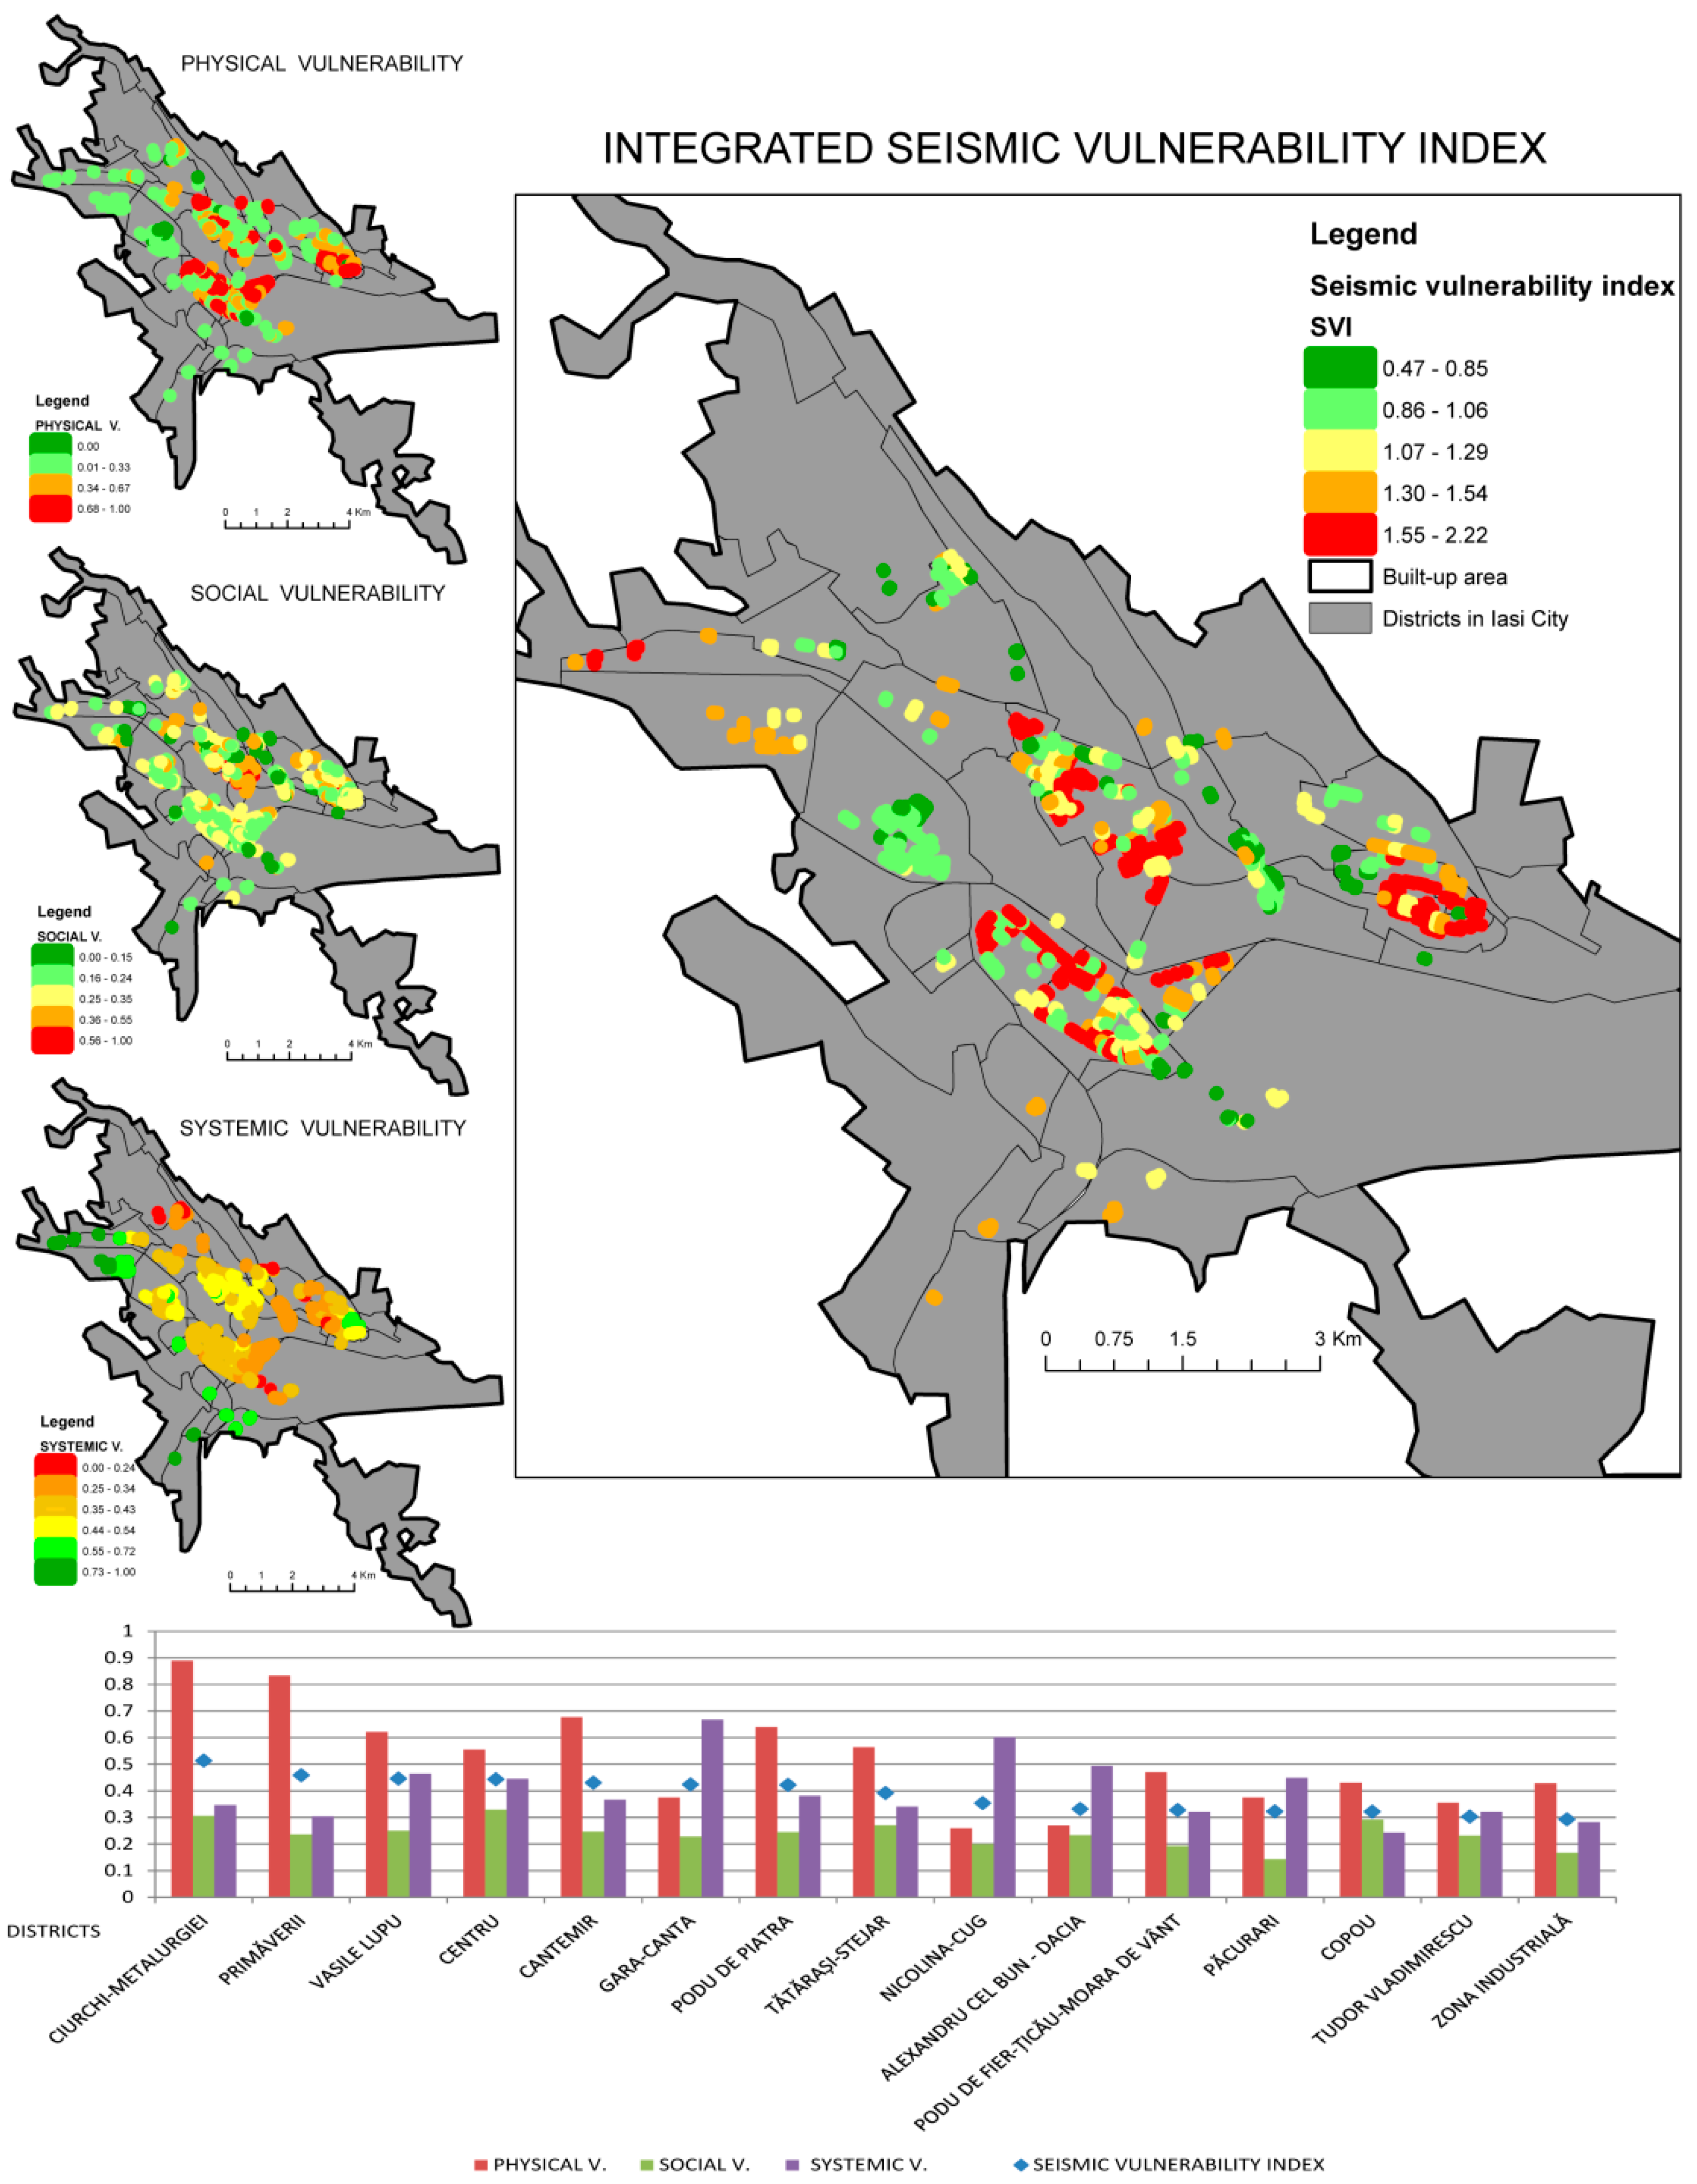
4.4. Integrated Assessment of Vulnerability
5. Discussion and Conclusions
- Retrofitting vulnerable buildings in order to reduce the physical damage of the built environment;
- Making technical audits for more buildings that might be vulnerable in order to provide reports indicating the category of risk in case of an earthquake;
- Reducing spatial barriers and discontinuities in order to provide fluent transport and effective intervention in case of disaster;
- Planning places for gathering and relocating densely populated area after an earthquake, increasing potential for rescue and supplementing centers of intervention and health care (including the regional hospital in the western part of the city); and
- Informing and instructing the sensitive population in order to properly react in extreme situations caused by earthquakes [53].
Acknowledgments
Author Contributions
Conflicts of Interest
References
- Hewitt, K. Risk and disasters in mountain lands. In Mountains of the World—A Global Priority; The Parthenon Publishing Group: London, UK, 1997; pp. 371–408. [Google Scholar]
- Proag, V. The concept of vulnerability and resilience. Procedia Econ. Financ. 2014, 18, 369–376. [Google Scholar] [CrossRef]
- Rashed, T.; Weeks, J. Assessing vulnerability to earthquake hazards through spatial multicriteria analysis of urban areas. Int. J. Geogr. Inf. Sci. 2003, 17, 547–576. [Google Scholar] [CrossRef]
- Calvi, G.M.; Pinho, R.; Magenes, G.; Bommer, J.J.; Restrepo-Vélez, L.F.; Crowley, H. Development of seismic vulnerability assessment methodologies over the past 30 years. ISET J. Earthq. Technol. 2006, 43, 75–104. [Google Scholar]
- Barbat, A.H.; Carreño, M.L.; Pujades, L.G.; Lantada, N.; Cardona, O.D.; Marulanda, M.C. Seismic vulnerability and risk evaluation methods for urban areas. A review with application to a pilot area. Struct. Infrastruct. Eng. 2010, 6, 17–38. [Google Scholar] [CrossRef]
- Pelling, M.; Maskrey, A.; Ruiz, P.; Hall, P.; Peduzzi, P.; Dao, Q.-H.; Mouton, F.; Herold, C.; Kluser, S. Reducing Disaster Risk: A Challenge for Development; United Nations Development Programme (UNDP): New York, NY, USA, 2004. [Google Scholar]
- Frerks, G.; Warner, J.; Weijs, B. The politics of vulnerability and resilience. Ambient. Soc. 2011, 14, 105–122. [Google Scholar] [CrossRef]
- Banica, A.; Muntele, I. Urban vulnerability and resilience in post-communist Romania (comparative case studies of Iasi and Bacau cities and metropolitan areas). Carpathian J. Earth Environ. Sci. 2015, 10, 159–171. [Google Scholar]
- Cutter, S.L.; Boruff, B.J.; Shirley, W.L. Social vulnerability to environmental hazards. Soc. Sci. Q. 2003, 84, 242–261. [Google Scholar] [CrossRef]
- Sinha, N.; Priyanka, N.; Joshi, P.K. Using Spatial Multi-Criteria Analysis and Ranking Tool (SMART) in earthquake risk assessment: A case study of Delhi region, India. Geomat. Nat. Hazards Risk 2016, 7, 680–701. [Google Scholar] [CrossRef]
- Walker, B.B.; Taylor-Noonan, C.; Tabbernor, A.; Bal, H.; Bradley, D.; Schuurman, N.; Clague, J.J. A multi-criteria evaluation model of earthquake vulnerability in Victoria, British Columbia. Nat. Hazards 2014, 74, 1209–1222. [Google Scholar] [CrossRef]
- Cardona, O.D.; Hurtado, J.E. Holistic seismic risk estimation of a metropolitan center. In Proceedings of the 12th World Conference of Earthquake Engineering, Auckland, New Zealand, 30 January–4 February 2000.
- Masure, P. Gemitis: An integrated and participative risk reduction strategy for the sustainable development of cities. In Proceedings of the EGS-AGU-EUG Joint Assembly, Nice, France, 6–11 April 2003; p. 9109.
- Carreño, M.-L.; Cardona, O.D.; Barbat, A.H. Urban Seismic Risk Evaluation: A Holistic Approach. Nat. Hazards 2007, 40, 137–172. [Google Scholar] [CrossRef]
- Wei, B.; Su, G.; Qi, W.; Sun, L. The Livelihood Vulnerability of Rural Households in Earthquake-Stricken Areas—A Case Study of Ning’er, Yunnan Province. Sustainability 2016, 8, 566. [Google Scholar] [CrossRef]
- Lin, S.-K. Vulnerability, Risks, and Complexity: Impacts of Global Change on Human Habitats; Kabisch, S., Kunath, A., Schweizer-Ries, P., Steinfuehrer, A., Eds.; Hogrefe and Huber Publishers: Ashland, OH, USA, 2012. [Google Scholar]
- National Institute of Building Sciences and Federal Emergency Management Agency. Multi-Hazard Loss Estimation Methodology, Earthquake Model: HAZUS-MH MR1, Advanced Engineering Building Module: Technical and User’s Manual; National Institute of Building Sciences and Federal Emergency Management Agency: Washington, DC, USA, 2003; p. 690. [Google Scholar]
- Zadeh, M.A.; Ngah Designation, I.B.; Alizadeh, E.; Shahabi, H. Application of Spatial Multi-Criteria Evaluation (SMCE) in Classification of earthquake hazard (Case study: Amol county). Int. J. Eng. Res. Technol. 2012, 1, 7. [Google Scholar]
- Alam, N.; Alam, M.S.; Tesfamariam, S. Buildings’ seismic vulnerability assessment methods: A comparative study. Nat. Hazards 2012, 62, 405–424. [Google Scholar] [CrossRef]
- Sokolov, V.Y.; Wenzel, F.; Mohindra, R. Probabilistic seismic hazard assessment for Romania and sensitivity analysis: A case of joint consideration of intermediate-depth (Vrancea) and shallow (crustal) seismicity. Soil Dyn. Earthq. Eng. 2009, 29, 364–381. [Google Scholar] [CrossRef]
- Marmureanu, G.; Marmureanu, A.; Cioflan, C.O.; Ionescu, C. Essential tools to mitigate Vrancea strong earthquakes effects on Moldavian urban environment. Environ. Eng. Manag. J. 2013, 12, 65–79. [Google Scholar]
- Ardeleanu, L.; Leydecker, G.; Bonjer, K.-P.; Busche, H.; Kaiser, D.; Schmitt, T. Probabilistic seismic hazard map for Romania as a basis for a new building code. Nat. Hazards Earth Syst. Sci. 2005, 5, 679–684. [Google Scholar] [CrossRef]
- Marmureanu, G.; Popescu, E.; Popa, M.; Moldovan, A.I.; Placinta, A.O.; Radulian, M. Seismic zoning characterization for the seismic hazard assessment in south-eastern Romania territory. Acta Geod. Geophys. Hung. 2004, 39, 259–274. [Google Scholar] [CrossRef]
- Sandi, H.; Pomonis, A.; Francis, S.; Georgescu, E.S.; Mohindra, R.; Borcia, I.S. Seismic vulnerability assessment: Methodological elements and applications to the case of Romania. Constructii 2008, 3, 5–17. [Google Scholar]
- Armas, I. Earthquake risk perception in Bucharest, Romania. Risk Anal. 2006, 26, 1223–1234. [Google Scholar] [CrossRef] [PubMed]
- Bostenaru Dan, M.; Armas, I. Earthquake impact on settlements: The role of urban and structural morphology. Nat. Hazards Earth Syst. Sci. 2015, 15, 2283–2297. [Google Scholar] [CrossRef]
- Armas, I.; Gavris, A. Census-based Social Vulnerability Assessment for Bucharest. Procedia Environ. Sci. 2016, 32, 138–146. [Google Scholar]
- Leon, F.; Atanasiu, G.M. Seismic Hazard Analysis of Iasi City Using Geographical Information Systems. In Proceedings of the 2nd Nordic Geographers Meeting, Meeting the Waves of Globalisation—Local, Regional and Environmental Response, Bergen, Norway, 15–17 June 2007.
- Bunea, G.; Atanasiu, G.M. Overview of Romania’s seismicity focusing on the North-Eastern region. Bul. Inst. Politeh. Din Lasi Sect. Constr. Arhit. 2014, 60, 43. [Google Scholar]
- Leon, F.; Atanasiu, G.M.; Galea, D. Using Data Mining Techniques for the Management of Seismic Vulnerability. Key Eng. Mater. 2006, 326, 501–504. [Google Scholar] [CrossRef]
- Toma, A.-M.; Atanasiu, G.M.; Toma, I.-O. GIS Based Seismic Risk Evaluation of Tall Residential Buildings of Romanian Urban Areas-Case Study for the City of Iasi. In Proceedings of the International Conference on Engineering UBI2011—Innovation and Development, Covilha, Portugal, 28–30 November 2011.
- Toma, A.M.; Toma, I.O. Seismic risk evaluation of typical residential buildings of Romania urban areas. In Proceedings of the 14th International Multidisciplinary Scientific GeoConference & EXPO SGEM2014, Sofia, Bulgaria, 19–25 June 2014; pp. 129–136.
- Banica, A.; Grozavu, A.; Rosu, L.; Muntele, I. Aspects concerning seismic vulnerability of buildings in Iasi city, Romania. In Proceedings of the 16th International Multidisciplinary Scientific GeoConference & EXPO SGEM2016, Sofia, Bulgaria, 28 June–7 July 2016; pp. 87–94.
- Rosu, L. Exploring the walkability concept in a post-socialist city through GIS analysis. The case study of Iasi, Romania. Analele Stiintifice Ale Univ. Al Cuza Din Iasi Ser. Noua Geogr. 2015, 60. [Google Scholar] [CrossRef]
- Stoleriu, O.M. Evolutia uman-geografica si urbanistica a orasului Iasi in perioada postbelica. In Terra Nostra; Editura Terra Nostra: Iasi, Romania, 2008. (In Romanian) [Google Scholar]
- Barbu, N.; Ungureanu, A. Geografia Municipiului Iasi; Universitatea Alexandru Ioan Cuza Iasi: Iasi, Romania, 1987. (In Romanian) [Google Scholar]
- Rosu, L.I.; Blageanu, A. Evaluating performances of a public transport network in a post-socialist city using quantitative spatial approach. Urbani Izziv 2015, 26, 103–116. [Google Scholar] [CrossRef]
- Atanasiu, G.M.; Leon, F. Evaluating the vulnerability of existing infrastructure exposed to dynamic/seismic loading. Bычислительные Tехнологии 2006, 11, S7. [Google Scholar]
- Ministry of Transport, Construction and Tourism. Seismic Design Code—P100. Part I—P100-1/2006: Design Rules for Buildings; Ministry of Transport, Construction and Tourism: Bucharest, Romania, 2006; pp. 12–13. (In Romanian) [Google Scholar]
- Martins, V.N.; e Silva, D.S.; Cabral, P. Social vulnerability assessment to seismic risk using multicriteria analysis: The case study of Vila Franca do Campo (Sao Miguel Island, Azores, Portugal). Nat. Hazards 2012, 62, 385–404. [Google Scholar] [CrossRef]
- Gheorghe, D.; Armas, I. GIS based decision support system for seismic risk in Bucharest. Case study—The historical centre. J. Eng. Stud. Res. 2015, 21, 35. [Google Scholar]
- Armas, I.; Ionescu, R.; Posner, C.N. Flood risk perception along the Lower Danube river, Romania. Nat. Hazards 2015, 79, 1913–1931. [Google Scholar] [CrossRef]
- Bica, A. Vulnerabilitatea Seismica a Fondului Construit din Romania la Actiunea Cutremurelor Vrancene; Universitatea Tehnica de Constructii Bucuresti: Bucuresti, Romania, 2013. (In Romanian) [Google Scholar]
- Oiste, A.-M.; Breaban, I.G. Analysis of relief Iasi city and urban environment quality, using GIS techniques. Agron. Ser. Sci. Res. 2012, 55, 243–248. [Google Scholar]
- Rezaie, F.; Panahi, M. GIS modeling of seismic vulnerability of residential fabrics considering geotechnical, structural, social and physical distance indicators in Tehran using multi-criteria decision-making techniques. Nat. Hazards Earth Syst. Sci. 2015, 15, 461–474. [Google Scholar] [CrossRef]
- Eastman, J.R. IDRISI Andes Guide to GIS and Image Processing; Clark Labs: Worcester, MA, USA, 2006; pp. 87–131. [Google Scholar]
- Frigerio, I.; Ventura, S.; Strigaro, D.; Mattavelli, M.; De Amicis, M.; Mugnano, S.; Boffi, M. A GIS-based approach to identify the spatial variability of social vulnerability to seismic hazard in Italy. Appl. Geogr. 2016, 74, 12–22. [Google Scholar] [CrossRef]
- Saaty, T.L. A scaling method for priorities in hierarchical structures. J. Math. Psychol. 1977, 15, 234–281. [Google Scholar] [CrossRef]
- Haki, Z.G. Assessment of Social Vulnerability Using Geographic Information Systems: Pendik, Istanbul Case Study; Middle East Technical University: Ankara, Turkey, 2003. [Google Scholar]
- Luca, O.; Stanescu, A.-A.; Gaman, F. Considerations related to housing and seismic risk. Urban. Arhit. Constr. 2016, 7, 125. [Google Scholar]
- Lungu, D. Seismic risk mitigation in the Romania-Synergy from international projects. In Proceedings of the World Conference on Disaster Reduction, Hyogo, Japan, 8–22 January 2005.
- Renn, O.; Klinke, A. A Framework of Adaptive Risk Governance for Urban Planning. Sustainability 2013, 5, 2036–2059. [Google Scholar] [CrossRef]
- Saizen, I.; Sasi, P.K.C. Awareness Workshop as an Effective Tool and Approach for Education in Disaster Risk Reduction: A Case Study from Tamil Nadu, India. Sustainability 2015, 7, 8965–8984. [Google Scholar]


| Indicator/ACRONIM | Description | Data Source | References |
|---|---|---|---|
| Seismic risk categories/RISK | Established by the official experts’ reports made until 2015 by taking into account physical characteristics and state of buildings | Iasi City hall—public information | [30] |
| Age of buildings/AGE | It also helps determine the type of construction and materials in a certain area | City hall site, GIS database that included information from other scientific papers, older maps | [10,40,41,42] |
| Number of floors/FLOORS | It distinguishes the percent of buildings with one or two floors from those that have 3 or more floors | Field research, Google Street | [10,42] |
| Structural types of buildings/MATERIAL | The materials have different stiffness, strength and ductility capacity to inertial forces that exert stresses. Two main categories were taken into account: (a) unreinforced masonry buildings; and (b) reinforced concrete buildings | Existing databases, field research | [40,42] |
| Total area of exterior walls/WALLS | The walls provide the primary lateral resistance/stability to earthquake loads. Determined by calculations considering the perimeter and the height of buildings, also taking into account the average percentage of openings which could be an evidence of soft-story mechanisms | GIS database, own calculations | [17] |
| Thermic rehabilitation/THERMO | Improving thermo-isolation should succeed or be a part of the consolidation process of buildings. Otherwise it represents a drawback for a future structural rehabilitation | Google street, field research | [22,28,43] |
| The state of building structure/REHABIL | Obtained from numerical simulation or field survey to assess damage of a structure | Former studies, field research | [31,41] |
| Terrain landslide susceptibility/SLIDE | Gives an insight on the increasing damages caused by associating earthquakes to geology, slope and land use | Published work data | [44] |
| Indicator/ACRONIM | Description | Data Source | Reference |
|---|---|---|---|
| Population density/INHAB_DENS | A high concentration of population within a relatively small area can increase damages in case of a strong seismic event | Census data 2011, field research, estimation | [14] |
| The percent of elder population/ELD_POP | Elder population is more sensitive to injures and life losses, especially when there are old people living alone (>70 years old) | Census data 2011, field research, estimation | [11] |
| Total number of inhabitants/TOT_POP | Gives an indication on total human losses or injures that could take place in case of a disastrous earthquake | Census data 2011, field research, estimation | [40] |
| Empirical economic losses/ECON_VALUE | Based on the estimated value of each building, it takes into account specific indicators of building values distribution and presumes, in addition, that, generally, the more expensive the residence the higher the value of the assets that could be subject to destruction in case of earthquake | GIS database, own calculations, real estate market and minimum prices established | [42] |
| Indicator/ACRONIM | Description | Data Source | Reference |
|---|---|---|---|
| The density of buildings/BUILT_DENS | Density and height of buildings, at district scale, could facilitate the occurrence of barriers in case of collapse | GIS Database, Google Street views | [27] |
| Distance to hospitals/HOSP_DIST | Distance from hospitals and trauma centers gives a certain level of population vulnerability to adverse health outcomes just after a major earthquake | GIS Database, Google Street views | [11] |
| Distance to emergency services/EMERG_DIST | Time for emergency services (ambulance, SMURD, firemen) is highly important in order to get to damaged building and contribute to saving lives | GIS Database, Google Street views | [3,11] |
| Scales | Degree of Preferences | Explanation |
|---|---|---|
| 1 | Equally | Two activities contribute equally to the objective |
| 3 | Moderately | Experience and judgment slightly to moderately favor one activity over another |
| 5 | Strongly | Experience and judgment strongly or essentially favor one activity over another |
| 7 | Very strongly | An activity is strongly favored over another and its dominance is shown in practice |
| 9 | Extremely | The evidence of favoring one activity over another is of the highest degree possible of an affirmation |
| 2, 4, 6, 8 | Intermediate values | Used to represent compromises between the preferences in weights 1, 3, 5, 7 and 9 |
| Reciprocals | Opposites | Used for inverse comparison |
| Indicator | Weight (Priority) | CR | Category | Weight (Priority) | CR | Final index |
|---|---|---|---|---|---|---|
| AGE | 22.8% | 0.042 | Physical vulnerability | 59.5% | 0.006 | Integrated seismic vulnerability index |
| MATERIAL | 37.6% | |||||
| WALLS | 13.7% | |||||
| FLOORS | 8.7% | |||||
| SLIDE | 8.8% | |||||
| REHABIL | 5.7% | |||||
| THERMO | 2.7% | |||||
| INHAB_DENS | 29.6% | 0.008 | Social-economic vulnerability | 27.6% | ||
| ELD_POP | 6.9% | |||||
| TOT_POP | 51.5% | |||||
| ECON_VALUE | 12.1% | |||||
| EMERG_DIST | 60.0% | 0.000 | Systemic vulnerability | 12.8% | ||
| HOSP_DIST | 30.0% | |||||
| BUILD_DENS | 10.0% |
© 2017 by the authors. Licensee MDPI, Basel, Switzerland. This article is an open access article distributed under the terms and conditions of the Creative Commons Attribution (CC BY) license ( http://creativecommons.org/licenses/by/4.0/).
Share and Cite
Banica, A.; Rosu, L.; Muntele, I.; Grozavu, A. Towards Urban Resilience: A Multi-Criteria Analysis of Seismic Vulnerability in Iasi City (Romania). Sustainability 2017, 9, 270. https://doi.org/10.3390/su9020270
Banica A, Rosu L, Muntele I, Grozavu A. Towards Urban Resilience: A Multi-Criteria Analysis of Seismic Vulnerability in Iasi City (Romania). Sustainability. 2017; 9(2):270. https://doi.org/10.3390/su9020270
Chicago/Turabian StyleBanica, Alexandru, Lucian Rosu, Ionel Muntele, and Adrian Grozavu. 2017. "Towards Urban Resilience: A Multi-Criteria Analysis of Seismic Vulnerability in Iasi City (Romania)" Sustainability 9, no. 2: 270. https://doi.org/10.3390/su9020270
APA StyleBanica, A., Rosu, L., Muntele, I., & Grozavu, A. (2017). Towards Urban Resilience: A Multi-Criteria Analysis of Seismic Vulnerability in Iasi City (Romania). Sustainability, 9(2), 270. https://doi.org/10.3390/su9020270