2.1. The Coffee Sector in Ethiopia
Ethiopia is the most important coffee-producing and -exporting country in Africa and the fifth most important coffee producer worldwide [
27]. The sector accounts for 24% of total foreign exchange earnings [
26] and provides a livelihood for more than a quarter of the country’s population [
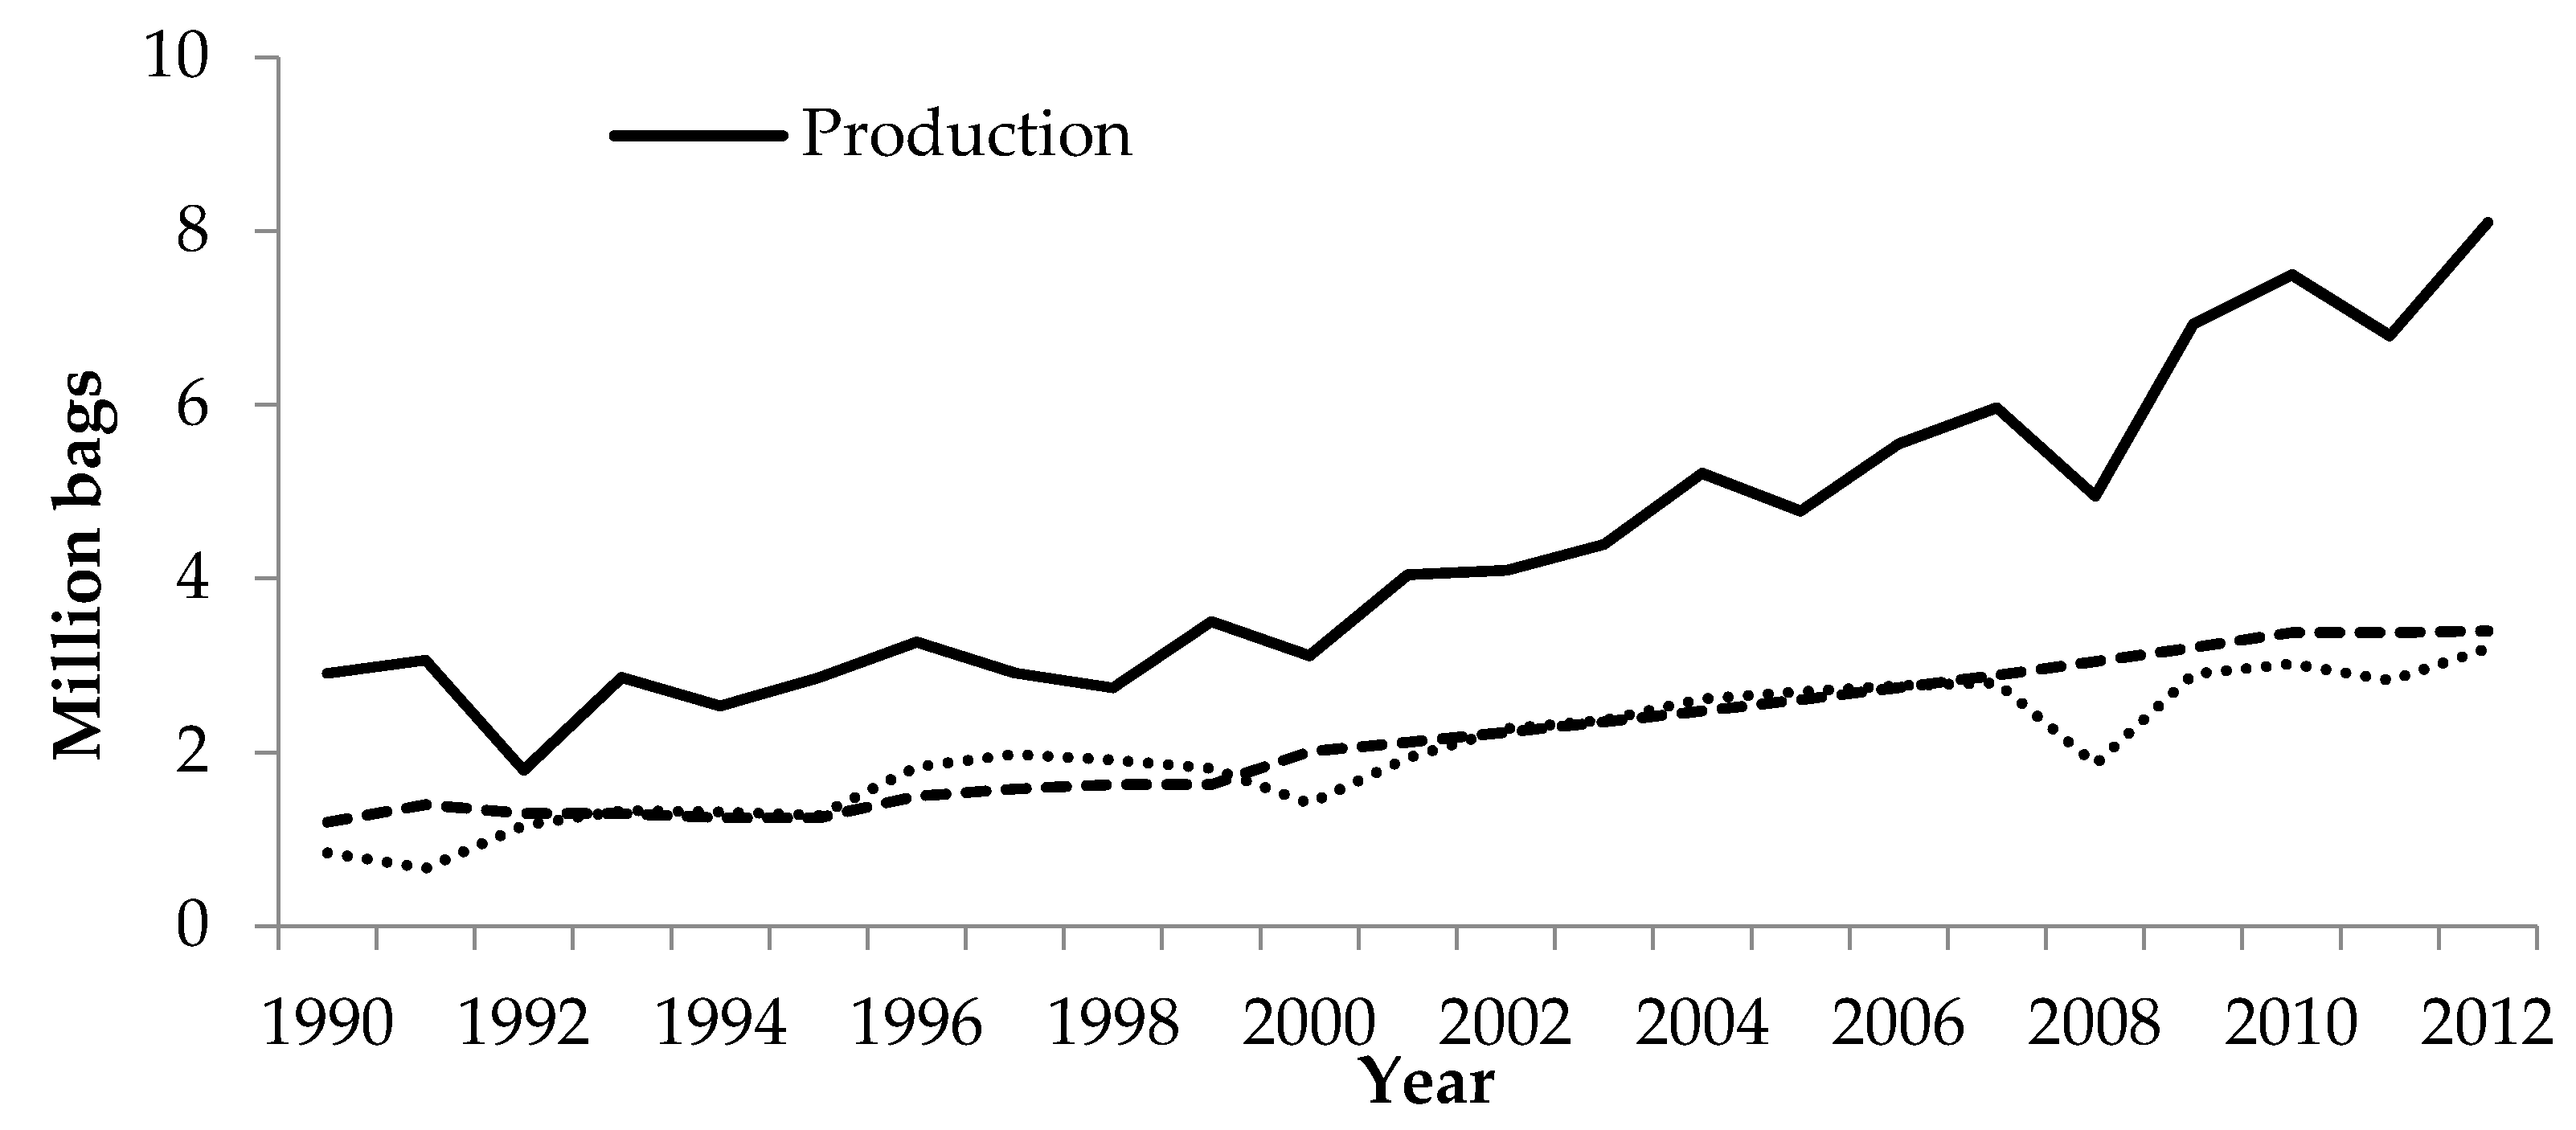
28]. Over the period 1990–2013, coffee production in Ethiopia increased from 2.9 million bags (with one bag equivalent to 60 kg) to 8.1 million bags; and exports increased from 0.85 to 3.2 million bags (
Figure 1). Ethiopia has a specific coffee culture and tradition, and about 50% of production is consumed domestically (
Figure 1). There is a difference in quality between coffee for the local market and export coffee. In an attempt to increase coffee exports and earnings, the government prohibits the sale of export quality coffee on the local market. The coffee sector in Ethiopia is largely a smallholder sector with 95% of production realized on small family farms with an average farm size of less than 2 ha [
29], and the remainder on large plantations. In general, agro-chemical input use is not common among smallholder coffee producers in Ethiopia, with an estimated 6% of producers using chemical fertilizer and 2% using pesticides or other agro-chemicals [
30]. There are more than 4 million coffee-producing farm-households in the country and coffee contributes to up to 50% of total income for these households [
31]. A substantial share of smallholder coffee farmers is organized in cooperatives—there are 465 primary coffee cooperatives in the country—but independent smallholder coffee production is also common.
Ethiopian coffee is exported through three channels: (1) a private sector supply chain; (2) a supply chain including parastatal firms; and (3) a supply chain including cooperatives and cooperative unions. Due to structural reforms and the gradual privatization of state farms since 1991, the share of coffee exported by cooperative unions and the private sector is increasing while that of parastatal firms is decreasing [
26]. The Ethiopian Commodity Exchange (ECX) was established in 2008 to control coffee quality and facilitate marketing. ECX sets requirements for quality and grading systems, transaction size, and payment and delivery modalities. Almost all coffee destined for export is sold on the ECX floor. Yet, cooperative unions and private producer-exporters are allowed to export directly; in which case ECX only grades the coffee [
28]. Export taxes were removed after the 2002 coffee crisis [
26] but the government still intervenes in the sector through export bans for large private traders who excessively hoard coffee (more than 500 ton) without having a shipment contract with importers. Value-adding in the coffee sector is low: only 30% of export coffee is sold as washed coffee [
26]. Washed and unwashed coffee beans are graded based on cup tests and physical inspection from 1 to 5, with 1 representing the highest quality and 5 the lowest. Grades 1 and 2 are usually assigned to washed coffee, grades 3 to 5 to unwashed coffee and coffee falling outside the grades are rejected for export [
26].
PSS started to emerge in the coffee sector in southwestern Ethiopia in the early 2000s [
32]. Certification to PSS is mainly cooperative-based and currently 29% of primary coffee cooperatives are Organic certified, 27% Fairtrade, and 2% Rainforest Alliance or Utz—resulting in about 5% of coffee exported as certified coffee [
30]. Minten et al. [
26] estimate the price premium for Fairtrade (FT) and Organic (Org) certified Ethiopian coffee to be, on average, 9% of the conventional price at export level over the period 2006–2013, of which only a third is transmitted to farmers [
30]. In this paper, we focus on Org, FT, double Fairtrade-Organic (FT-Org) and Rainforest Alliance (RA) certification. As RA focuses more (but not exclusively) on environmental issues such as biodiversity conservation, Org on organic production methods, and FT on producer welfare and empowerment; we expect to find the largest income enhancing and poverty-reducing effects of FT certification.
2.2. Data Collection
We collected original data from Southwestern Ethiopia through a farm-household survey and through semi-structured interviews with coffee cooperatives and key informants. Data were collected in 2014. A multi-stage stratified random sampling strategy was used. We first purposively selected four districts (
woredas) in the adjacent Kaffa and Jimma zones, where
Coffea arabica originates and where the first certification schemes emerged in 2005. The two zones are similar in biophysical and socioeconomic characteristics. We then listed all coffee cooperatives in these districts and stratified them according to certification scheme, including RA certified, FT certified, Org certified, double FT-Org certified and non-certified cooperatives. In order to sample certified and non-certified cooperative members from the same district, we randomly selected one certified cooperative in each district and one non-certified cooperative in all but one district, because in one district we could not identify a non-certified coffee cooperative. Our sample includes seven cooperatives of which four are certified, each to a different scheme, and three are not certified (
Table 1). Finally, we randomly selected farmers from the cooperative member lists. Farmers in a certified cooperative are usually all certified. To construct a good control group, we purposefully oversampled farmers from non-certified cooperatives relative to the total membership. The final sample includes 425 households, including 270 certified coffee farmers and 155 non-certified coffee farmers (
Table 1). This sample size is comparable with previous studies that compare the impact of different standards [
12,
21].
The survey was implemented using a structured questionnaire, consisting of detailed modules on: (i) household characteristics; (ii) child labor and schooling; (iii) land ownership and use; (iv) coffee production and marketing; (v) other crop production; (vi) livestock ownership and production; (vii) forest use; (viii) off-farm income; (ix) asset ownership and living conditions; (x) social capital and credit; and (xi) decision making. It should be noted that quantitative survey data collection among farm-households is common in agricultural and development economics. We have followed standard procedures in developing the questionnaire and in implementing the survey in the field, with a team of well-trained enumerators and several survey coordinators. Survey data are prone to measurement error and imprecision but we do not see any reasons for systematic measurement error in our data that could lead to biased results. Semi-structured interviews were carried out with cooperative committees, district officials, officials from the coffee unions and some coffee experts.
2.3. Econometric Approach
To assess the impact of certification to different standards on the welfare of farm-households, we estimate regression models of the following type:
where
Yi measures the welfare outcome of household
i,
Xi a vector of control variables,
Ti our treatment variable and
εi the idiosyncratic error term;
α,
β and
γ are parameters to be estimated. We are primarily interested in estimating the impact on poverty, but to understand the channels through which poverty effects possibly occur, we include additional outcome indicators. We use the following four outcome indicators and estimate the model separately for each indicator: (1) coffee yield, measured as the dry cherry equivalent in kg per ha; (2) coffee income, measured as the log of net income from coffee production (i.e., this is net coffee income, calculated as the difference between coffee revenue—coffee produced × coffee price—and coffee-related variable costs—hired labor, transportation, certification, seedling material and seedling transportation); (3) household income, measured as the log of total household income (i.e., household income is composed of farm income—including income from coffee, other crops and livestock rearing—and off-farm income—including income from wage work, non-farm self-employment, collection and gathering of forest products and income transfers, whereas income includes cash income as well as income from subsistence agricultural production and collection of forest products, valued at market prices); and (4) poverty, measured as a binary variable for having a per capita income that falls below the national poverty line (we use the national poverty line of Ethiopia, equaling 3781 ETB (Ethiopian Birr) per adult equivalent per year [
33].). For the first three dependent variables, which are continuous, we use a linear regression model and ordinary least squares estimation while for the latter binary variable, we use a probit estimation. The income variables are log-specified in order to reduce the impact of potential influential observations and to be able to interpret results directly in percentage terms. For all models, we report heteroskedasticity-robust standard errors (sandwich variance estimators); and for the probit model, we report marginal effects at the sample means.
Our main variable of interest is
, a vector of mutually exclusive binary variables for certification to FT, Org, FT-Org and RA standards. Non-certified farmers are used as control group. Membership in a certified cooperative is likely not randomly distributed among coffee farmers. We therefore include a large vector of observable farmer characteristics,
. We include variables reflecting different forms of capital ownership that are selected based on standard micro-economic theory as reflected in the sustainable livelihoods framework [
34,
35]. Different forms of capital of a household, including human, natural, physical, social and financial capital, along with household preferences, determine the livelihood strategies of a household and the welfare outcome of these strategies. We include the following variables in the vector
: gender, age and education of the household head; household size and number of dependents; total land ownership (in the models on total income and poverty) or coffee area, coffee age and coffee tree density (in the models on coffee yield and income) and respective squares; livestock ownership (measured in tropical livestock units); the number of relatives in the region (as a measure of social capital; i.e. this indicator concerns the number of relatives in the region with whom a household has a relationship. With quantitative survey data, it is difficult to measure social capital in all its dimensions and from our data, only this indicator of social capital is available. Although this indicator does not capture different components or different forms of social capital, it at least allows controlling for differences in social relations among coffee farmers to some extent); number of years a farmer stayed in a cooperative; and distance to the district town. We are unable to control for other observable and unobservable factors that may affect farmer’s self-selection into a certified cooperative and their welfare outcome. Given that we cannot identify valid instruments, we refrain from an instrumental variable estimation to control for selection bias and unobserved heterogeneity. In addition, it is particularly difficult to single out the effect of certification from the effect of membership in specific cooperatives and from the location of farmers because villages usually only include one coffee cooperative and members of a specific cooperative are usually either all certified or all not certified.
As an alternative method to control for potential selection bias, we additionally estimate the impact of membership in a certified cooperative using propensity score matching (PSM) [
36] combined with a sensitivity analysis that tests the assumption of selection on observables. We estimate the average treatment effect (ATE) of certification to the four different certification schemes on the four outcome indicators. We first estimate the propensity scores (PS), or the probability a household is a member of a certified cooperative, using a series of probit models for the four mutually exclusive treatments/certification schemes. In this model, we only include variables that are not possibly influenced by the treatment or certification [
37]: gender, age and education of the household head; household size and number of dependents; total land ownership; livestock ownership; the number of relatives in the region (as a measure of social capital); and distance to the district town. Multiple binary models were chosen in favor of multinomial PS models as the latter are computationally more demanding and are considered less robust as a misspecification in one equation could render all other conditional estimates inconsistent [
38]. We then matched households using a kernel matching method with the default Gaussian kernel. This allows use of information from all non-certified/control households and a weighting function to construct the counterfactual outcome, and reduces variance [
37]. After matching, we estimate the ATE as the weighted difference between treated and matched control households using bootstrapped standard errors.
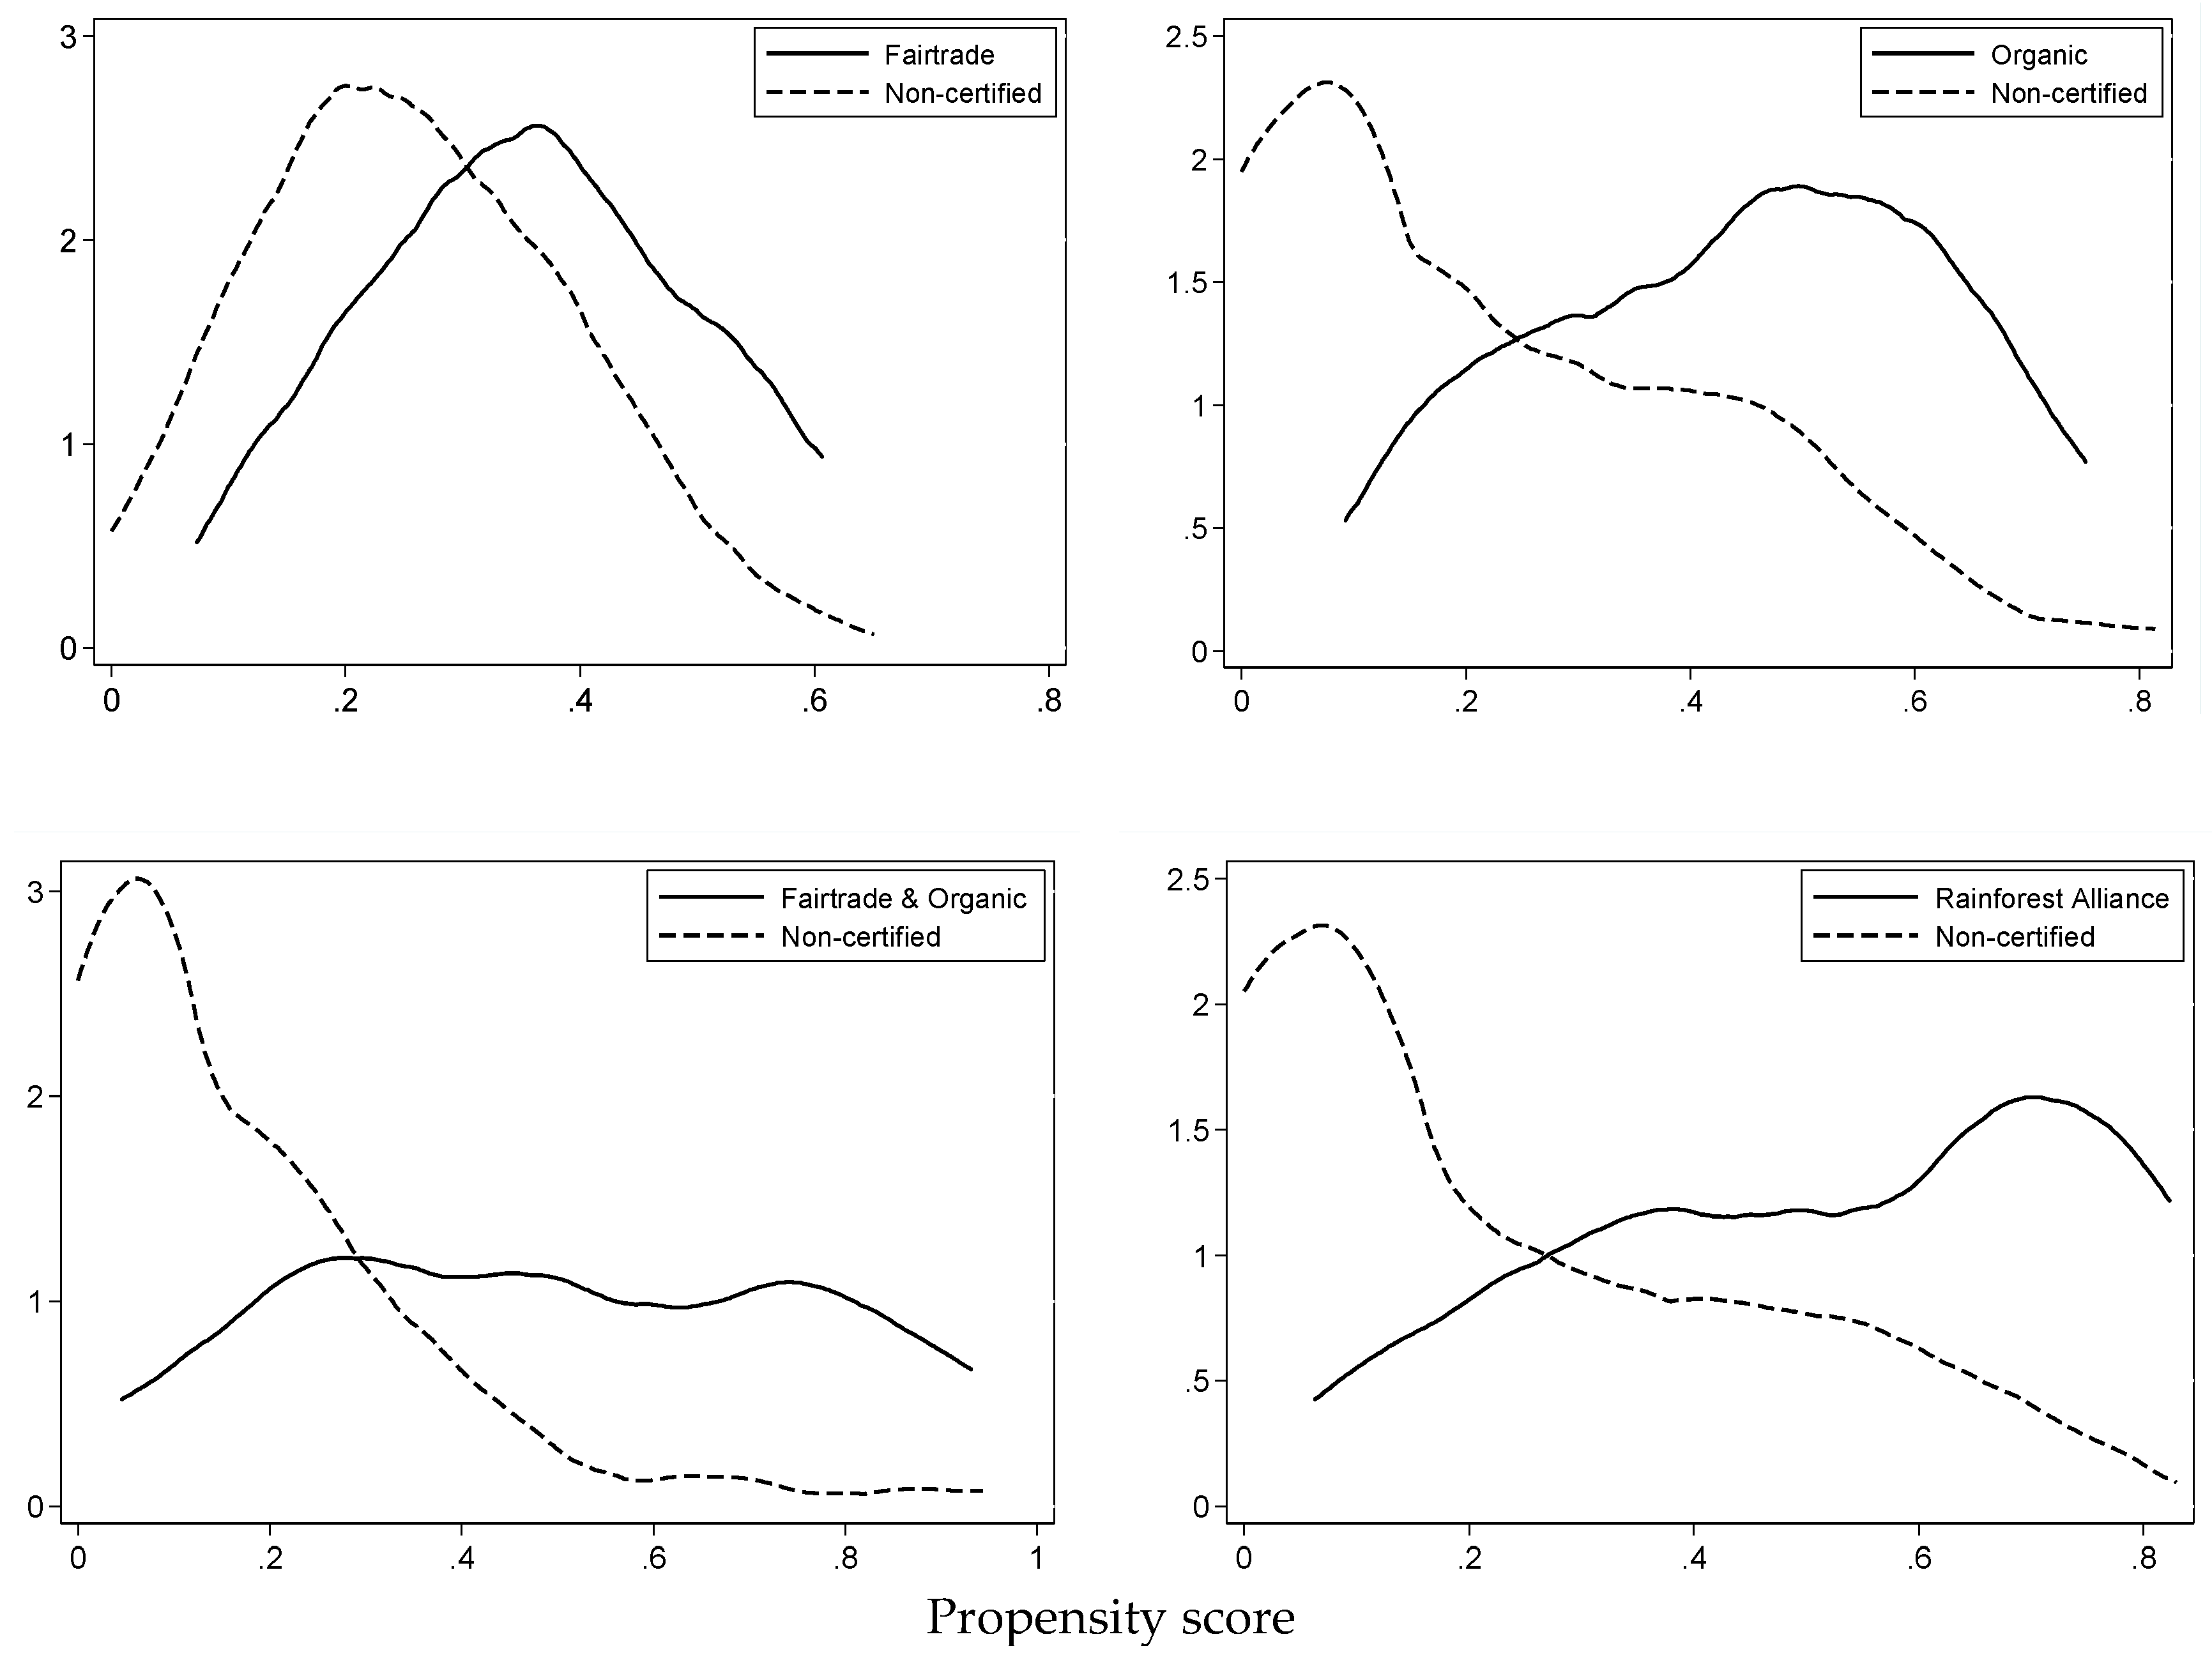
The validity of PSM relies on two essential assumptions. First, the common support or overlap condition requires that treatment observations have comparison control observations nearby in the propensity score distribution [
37]. We only use observations in the common support region (i.e., where the PS of treated observations is not lower than the PS of control observation and the PS of control observations is not larger than the PS of treated observations). We visually compare overlap in the propensity score distribution between certified and non-certified observations. We further assess balancing properties by comparing covariate means between treated and matched controls using two-sided
t-tests. Overall balancing properties are further tested by re-estimating the propensity score on the matched sample and looking at the Pseudo
R2—which should be low—and performing a likelihood ratio test on the joint significance of all regressors—which should be rejected [
37]. Second, the conditional independence assumption requires that given observable variables, potential outcomes are independent of treatment assignment [
39,
40]. This implies that selection into treatment is based entirely on observable covariates, which is a strong assumption. We test the robustness of our results against violation of this assumption, using a simulation-based sensitivity analysis as proposed by Ichino et al. [
41]. The method simulates a binary confounder to mimic a possible unobserved influential factor and compares these PSM results with the baseline results. The data were analyzed by STATA software version 14 (StataCorp, College Station, TX, USA).


