1. Introduction
Although China has a wealth of energy resources, coal is still the main source of energy production. The long-term coal-fired electricity production and consumption has led to a high proportion of coal in the energy system. Coal accounted for 64% of China’s total energy consumption in 2015, and 60% of China’s electricity is supplied by coal currently. Power structure clean development issues, such as haze and other prominent environmental problems, the overcapacity of coal-fired power generation, and the low proportion of renewable energy consumption have become constraints on China’s energy revolution and low-carbon development.
In recent years, the Chinese renewable energy construction scale has expanded unceasingly, which provides effective support for the development and optimization of the power source structure. However, due to the time-variability, uncontrollability, and the intermittent nature of renewable energy, China has experienced a huge waste of electric energy, poor coordination of regional power development, and production problems with peak load regulation and grid stability. Power construction is fast but inefficient. National Energy Board data show that in the first half of 2016, 32.3 billion kWh of wind power was abandoned. Therefore, the optimal allocation of energy resources and the utilization efficiency still needs to be greatly improved. China has clearly put forward the crucial development goal of promoting the rational development and utilization of renewable energy in the 13th Five Year Plan [
1]. It is necessary to use technological innovation and management to improve the power source structure of China and to support the supply side reform of the power sector.
The evolution of the power structure is a long-term, dynamic, complex, and interactive process. The system structure is influenced by various factors such as socio-economic development, industrial policy formulation, and technological innovation. A clean low-carbon power source structure is the inevitable trend of China’s future development. With the continuous reform of China’s supply side and the deepening of power system reform under the comprehensive control of internal and external factors, China must deal with the prominent issues of total quantity control, structural optimization, coordinated development between the main bodies, and government integration with the market.
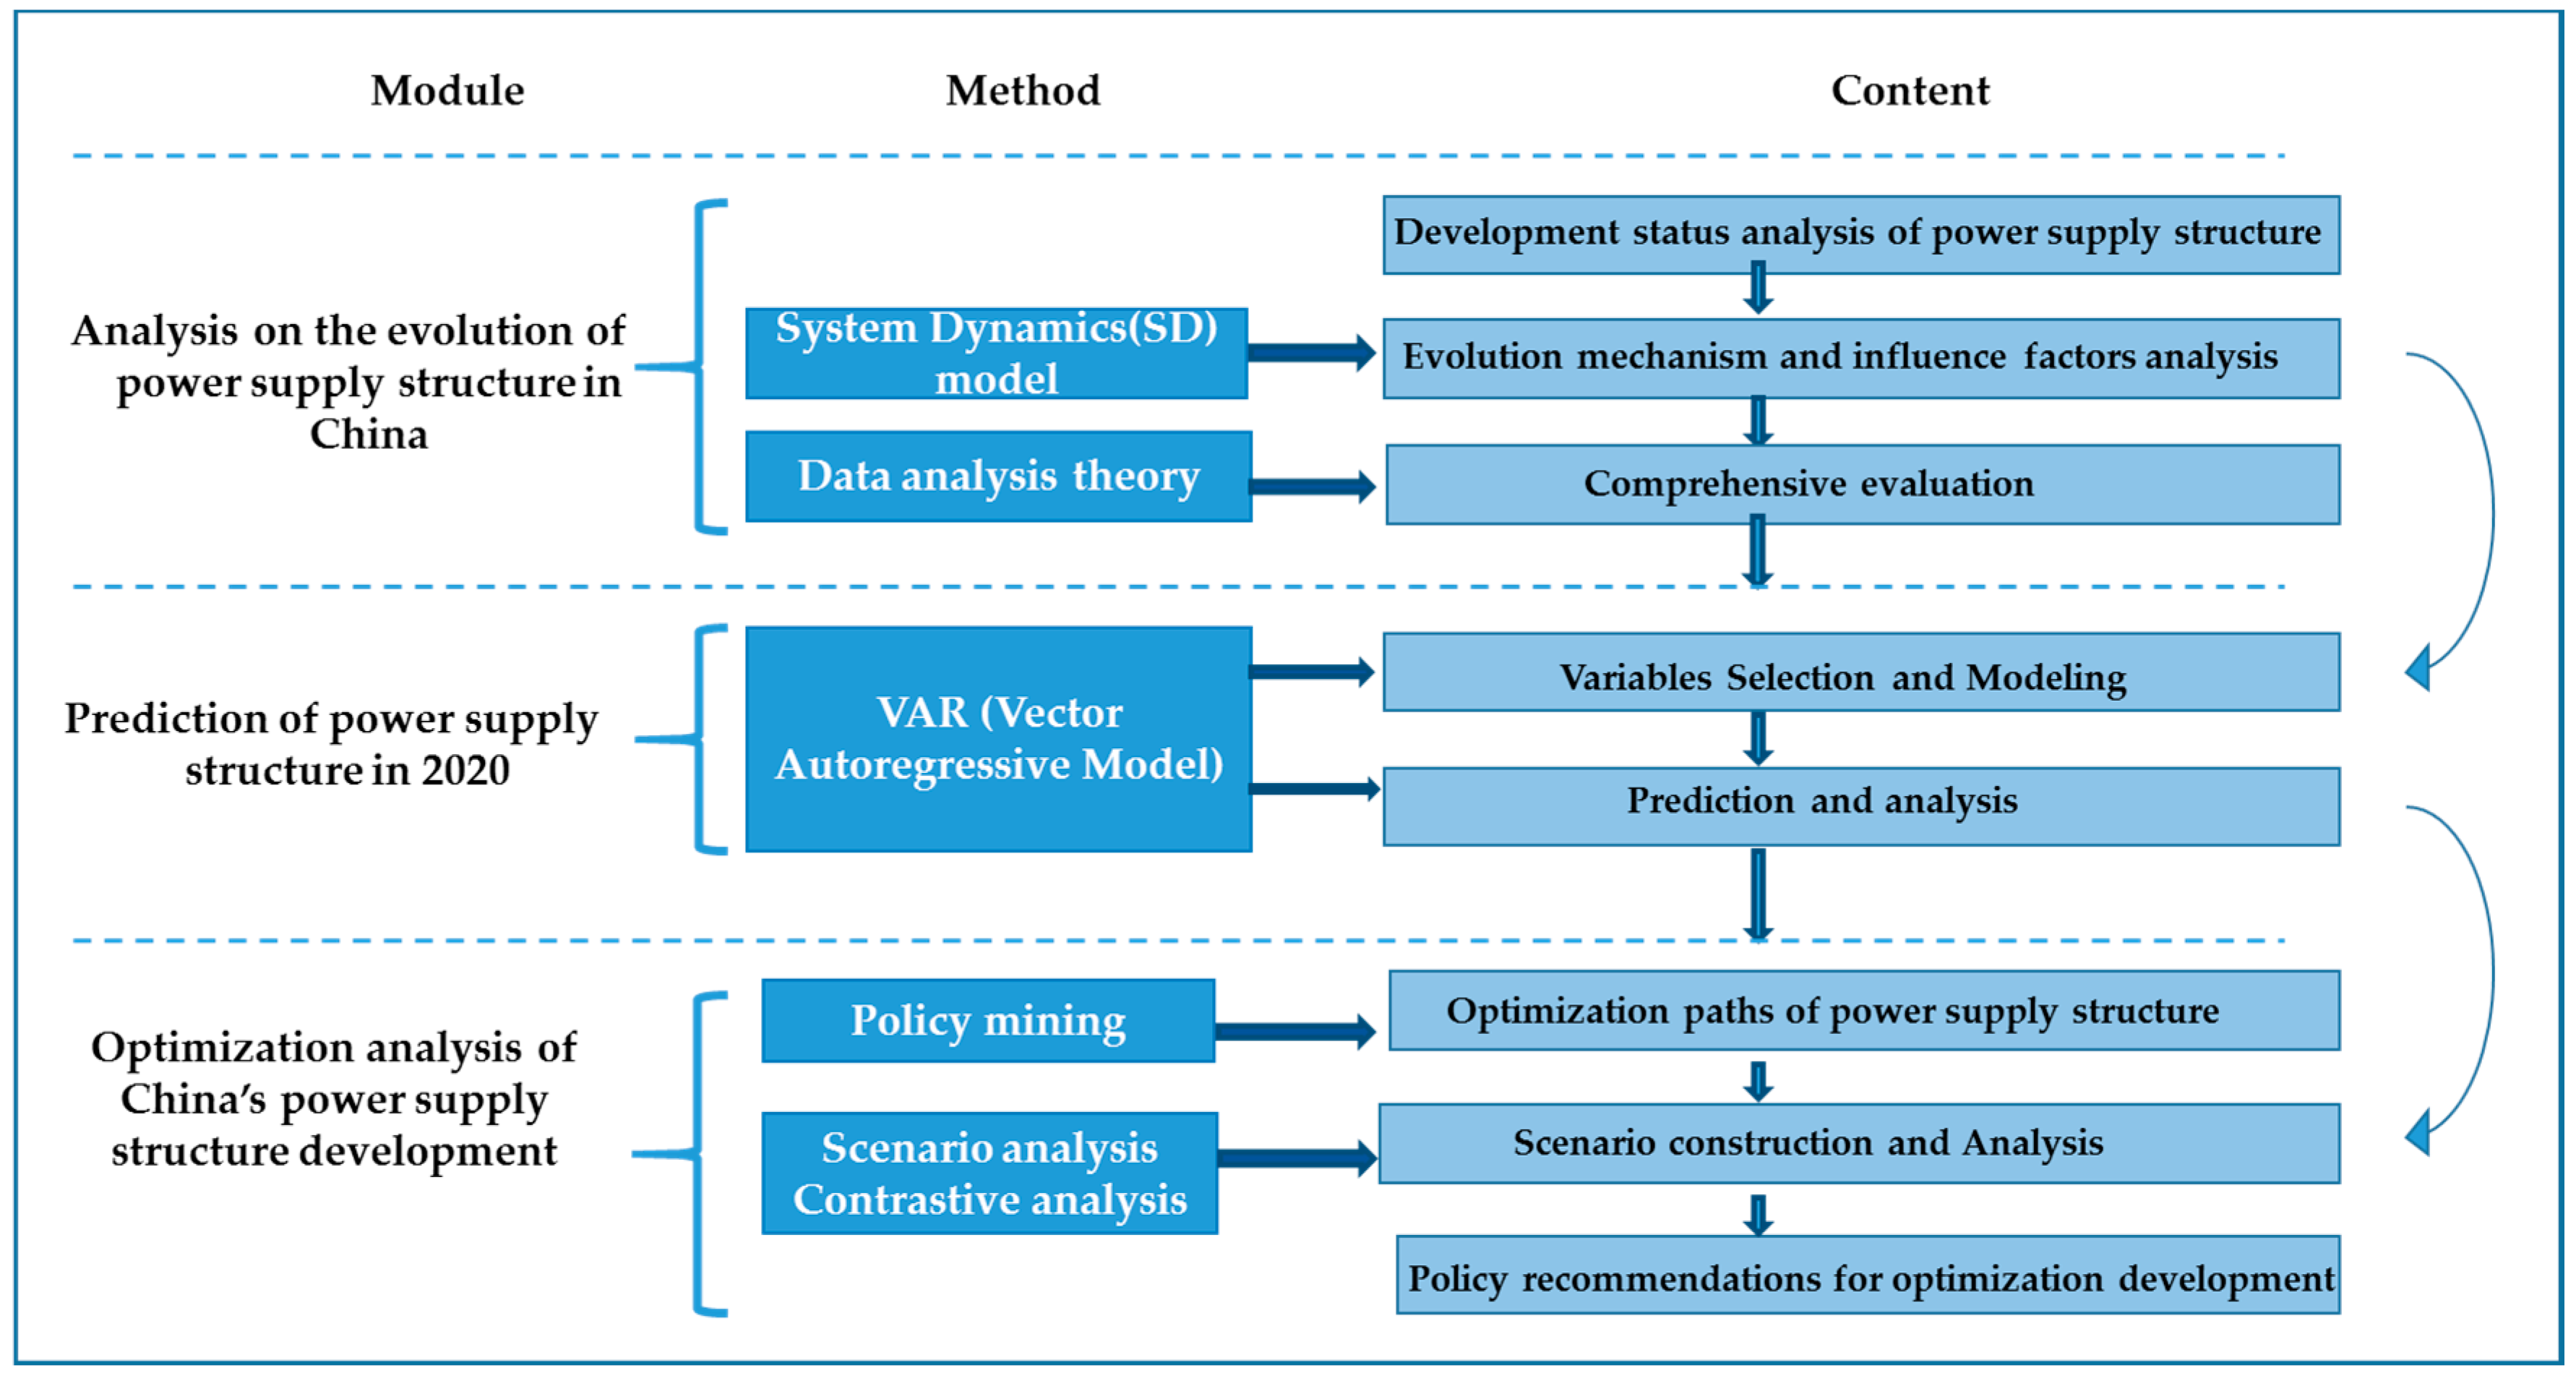
In this paper, based on data mining of the process of China’s power supply structure, we present in-depth studies of the evolution mechanism and the key influence factors, construct a clean development forecasting model of the power supply structure, and put forward the optimized development path. These studies can provide theoretical support and practical references for the overall optimization of the power supply structure and its green and efficient harmonious development in China.
2. Literature Review
In the context of clean development, single power development, the driving force of power supply structure adjustment, and the methods of structure analysis are the main research directions in the existing literature.
Thermal power occupies a dominant position in China’s power structure, which has posed a challenge for the clean development of the power industry [
2], so that clean energy still has a long way to go toward China’s power supply structure clean development. Peggy and Kenneth [
3] argued that China’s over-investment in thermal power capacity has resulted in an abnormal development of the overall power industry. Murata et al. [
4] studied the benefits of the Clean Development Mechanism (CDM) in China on energy conservation and emission reduction. Menegaki et al. [
5] believe that renewable energy sources that can hedge the risks of traditional energy price volatility are critical to China’s sustainable development. The increase in clean energy generation makes China’s irrational power structure gradually move towards a rational and stable structure [
6]. Feng et al. [
7] expounded the status and development of wind power installations in China, the distribution of wind resources, and the distribution of large-scale wind power installations, and concluded that China’s wind power has great potential. In the process of expanding renewable energy, the resulting problems are increasingly significant. Because the use of renewable energy technology is not fully mature, Siddiqui et al. [
8] confirmed that a significant amount of R&D investment to reduce costs by promoting technological advances has reduced the market competitiveness of renewable energy sources compared to traditional fossil fuels. After analyzing the development of distributed power generation from the aspects of the power system, technology, and economic obstacles, Liu et al. [
9] pointed out that there are still many problems such as high cost, excessively high selling price, poor regulating ability, and insufficient consumption space with regards to renewable energy in China.
The evolution of the power supply structure may be affected by multiple factors such as resource conditions, system optimization, and environmental protection [
10]. El-Kordy’s research suggested that externalities and environmental costs need to be considered when installing new power generators [
11]. Gong et al. [
12] believed that Environmental Dynamic Models are important tools for understanding and predicting the impacts of global and environmental changes due to natural or anthropogenic factors. John et al. [
13] demonstrated that the carbon intensity is strongly related to energy intensity, type, and structure by using the Laspeyres model. Hirstet al. [
14] explored the key role of low-carbon factors in power plans from the perspective of policy and technology. At the same time, politics has increasingly become a decisive factor in the direction and speed of the development of individual energy sources, especially renewable energy [
15]. The policies promulgated by the government guide the direction of power structure change [
16]. In the case of the electricity market not being mature, the Chinese government began to guide the conversion of the power supply structure, vigorously promoting renewable energy development [
17].
In the analysis of the power supply structure, the existing literature has deeply studied many methods and models. Steenhof et al. [
18] constructed a relatively complete evaluation index system of China’s power structure optimization and used fuzzy pattern recognition, principal component analysis, and other methods to analyze the degree of optimization in order to provide a more intuitive basis for power supply structure adjustment decisions. Cai et al. [
19] used the Long-range Energy Alternatives Planning System (LEAP) modelto predict and analyze the future power supply structure of China, and concluded that replacing coal-fired power plants with more efficient nuclear power is the future development trend in China. At present, there are three kinds of models commonly used in research: (1) Systematic models such as the System Dynamics(SD) model, gray system prediction model, and the Artificial Neural Network(ANN) model [
20]; (2) Inheritance structure models, such as the LEAP model; (3) Hybrid class models. The System dynamics(SD) model was first proposed by the American scholar Forrester in the early 1950s [
21], and it can solve problems of a complex system with high order and nonlinear multiple feedback, so it has been widely used in the energy research field [
22]. Hosseini et al. [
23] analyzed the future trend of conventional and unconventional oil production and capacity expansion rates using a system dynamics approach. Alexander et al. [
24] evaluated Mekong Delta adaptation strategies with system dynamics modeling. Bowen Xiao et al. [
25] used the method of system dynamics to analyze the current situation of natural gas power generation, influencing factors, and the development trend of installed capacity. The Vector Autoregressive Model (VAR) model based on economic theory can be used to predict the dynamic relationship between energy and the economy because it can provide a more accurate forecast value [
26]. Bin et al. [
27] used the Vector Autoregressive model to analyze the influencing factors of the changes in carbon dioxide emissions in China’s iron and steel industry.
The related research has described the change of the single power and the whole power supply structures, and analyzed the development trend of the power supply structure with the combination of economic and environmental factors. At present, there are few studies on the analysis of the evolution mechanism and evaluative features of the power supply structure. Studies on the integration of power supply structure adjustment with new market changes and new policies and regulations are still sorely lacking. In this paper, based on the analysis of China’s power supply structure clean evolution and forecasting model construction, we analyzed the new situation and its complex environment, and proposed the optimization of China’s power supply structure development, in order to provide a reference for the analysis and optimization of China’s power supply structure clean development.
4. Evolution of China’s Power Supply Structure Clean Development
Power structure adjustment should not only meet the requirements of the system power consumption and load level, but should also ensure the security, stability, and economic operation of the power system. Therefore, the evolution of the power structure is a long-term, dynamic, complex, and interactive process, which is influenced by the characteristics of the power system and the national economic development, power demand, technical level, resource endowment, and government policy. Studies on the evolution mechanism must take the influence of multiple factors such as the power system, economy, and environment into account, with the purpose of grasping the power structure evolution direction and trend accurately.
4.1. Analysis of the Current Situation of the Power Supply Structure in China
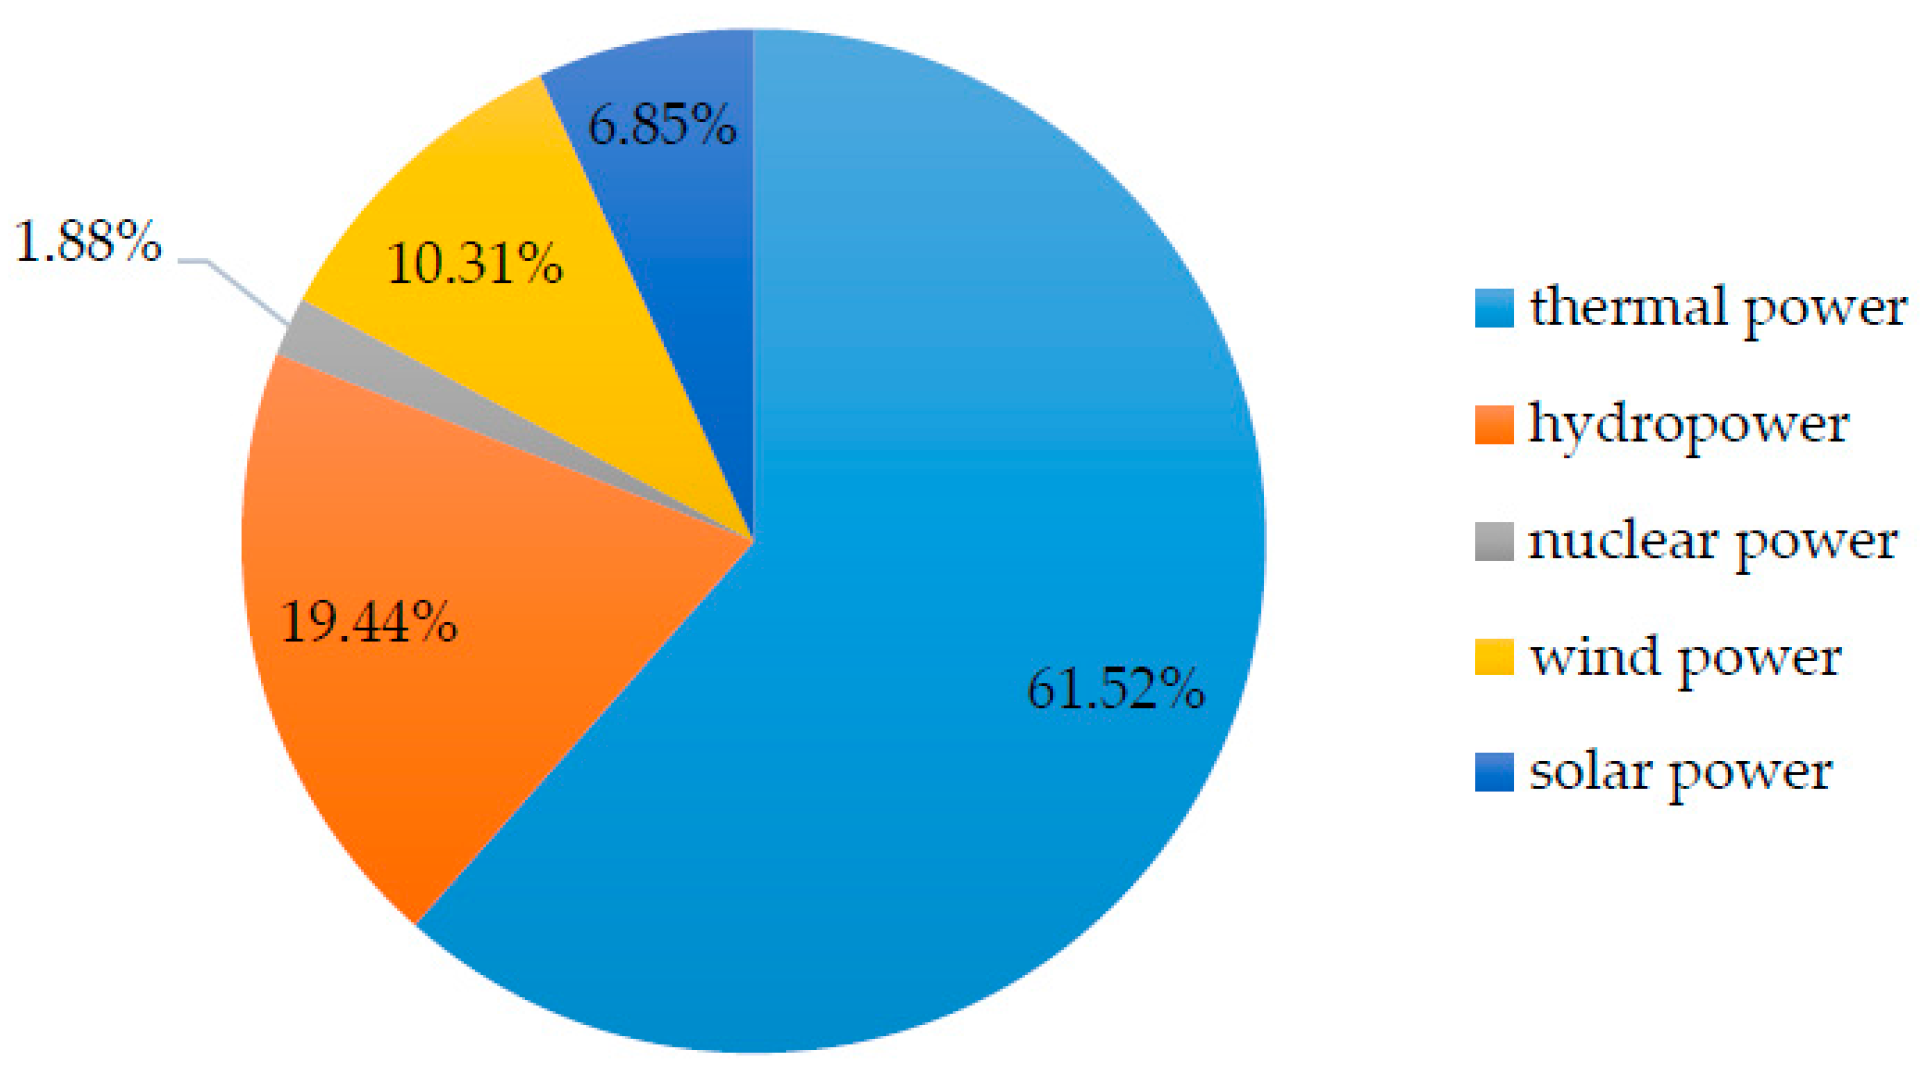
China has been committed to the optimization of the power structure adjustment, but thermal power still dominates the power supply structure (
Figure 3). Nuclear power, hydropower, wind power, solar power, and other renewable energy sources have been developed to a certain extent. Fossil fuel energy generation occupies 65.93% of the power supply structure. Coal is still the main fossil fuel energy source for power generation; its proportion is still as high as 59.01%. The share of gas-fired and oil-fired power generation is small. Regarding non-fossil fuel power generation, the highest proportion comes from hydropower. Pumped storage power is also developing in certain areas. Wind power has become the third largest power supply source in China.
In the overall context of clean development, the proportion of thermal power in China’s power supply structure shows a downward trend. At the same time, there is strong momentum in the development of renewable energy. Thermal power has the natural advantages of availability, economy, and safety, while renewable energy power generation has problems of instability and dissipation. Therefore, China’s thermal power-based power supply structure has not changed for a long time. In recent years, with the guidance of China’s national policy and the rising level of marketization, the rapid development of clean energy is moving the power supply structure in the direction of clean evolution.
4.2. Analysis of the Clean Evolution Mechanism of China’s Power Supply Structure Based on the System Dynamics Method
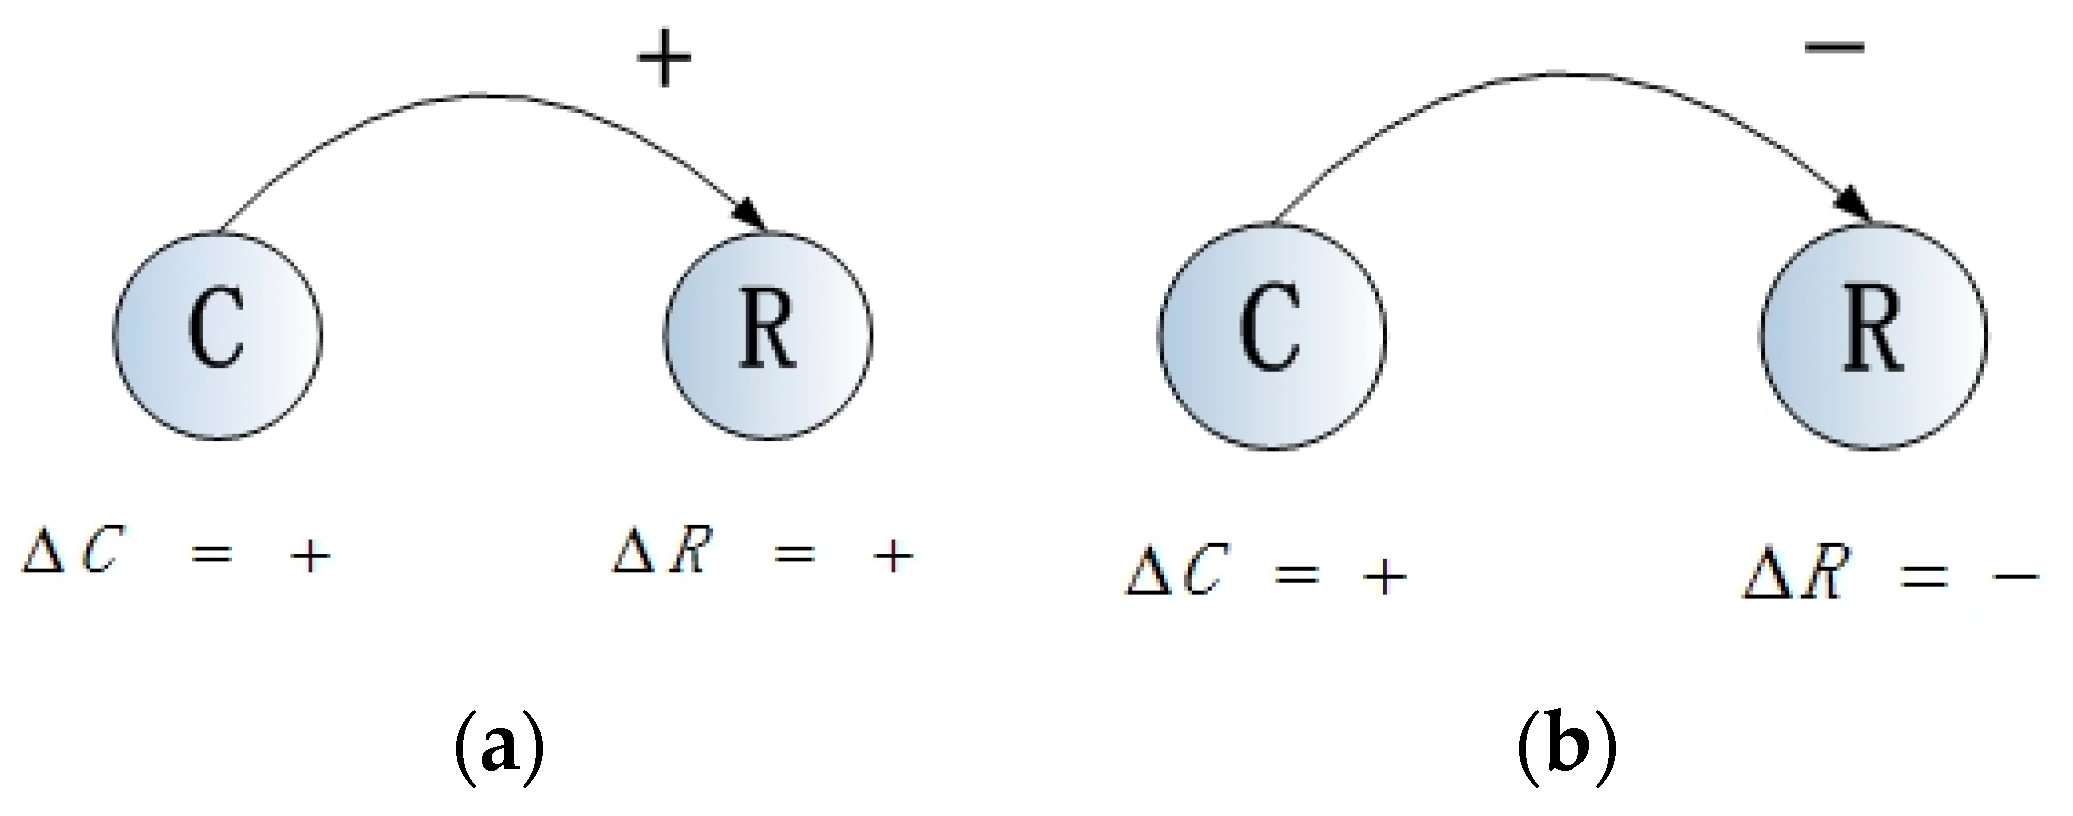
System dynamics is applicable to the dynamic behavior of complex feedback systems and is widely used in the study of social economic systems. It emphasizes the interrelationship and interaction between the system and the environment. The behavior pattern and characteristics of the system are mainly rooted in its internal dynamic structure and feedback mechanism. The research object is the power supply structure system in China. The evolution of the power supply structure is the result of a series of factors interacting with each other, which is consistent with the law of cause and effect. There are multiple feedbacks within the power system, and many of the complex interdependencies cannot be described linearly. Therefore, the construction of the power structure evolution mechanism analysis system founded on system dynamics helps to clarify the main influencing factors of the evolution of the power structure, and sort out the system structure and the logical relationship of elements.
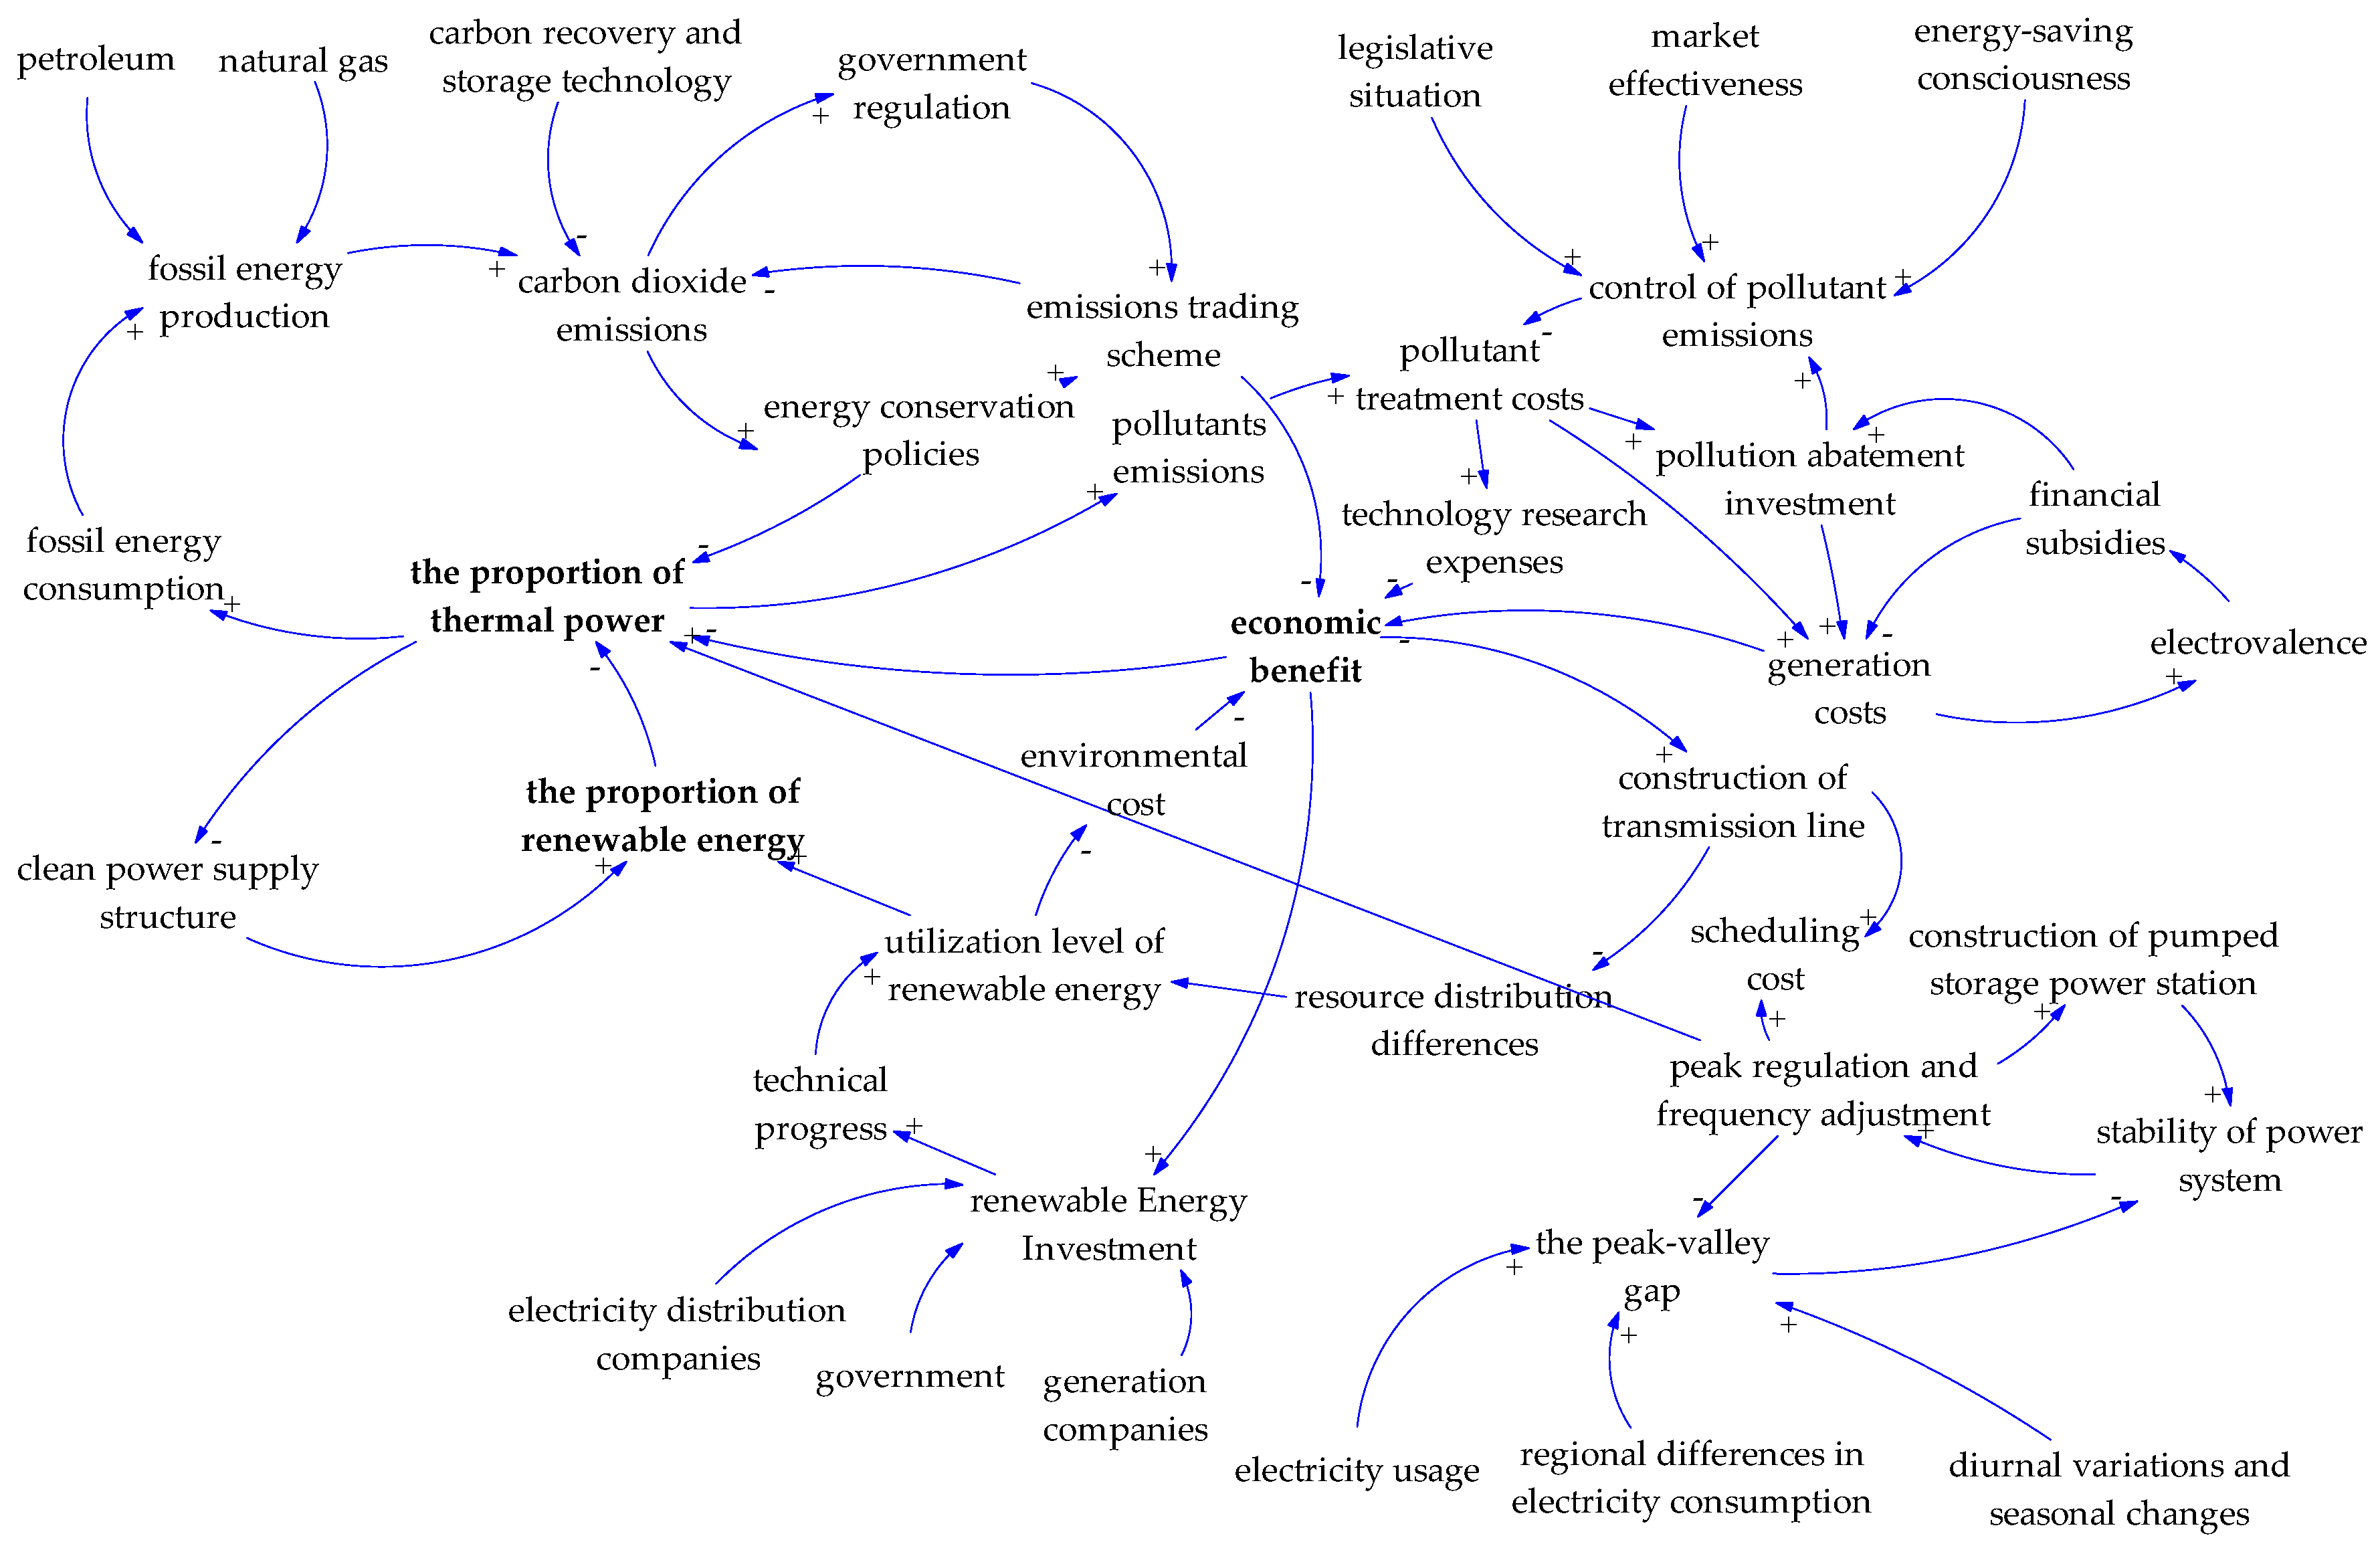
In the evolution of China’s power structure, the environmental factors of carbon emissions and environmental pollution are significant in restricting the expansion of thermal power. The power system stability and power generation cost, which are determined by the characteristics of the power system, have a negative causal relationship with the increase of the proportion of renewable energy power generation. Consequently, this paper analyzes the interaction between the power supply system and three subsystems: the whole electric power system, environment, and policy. After considering the interaction mechanism among the subsystems, the power system evolution mechanism analysis system is constructed, as shown in
Figure 4.
Through the analysis of the causal diagram of system dynamics, it is found that in the process of evolution, the integration of the power system itself determines that the thermal power, with strong peaking capacity, can occupy the basic position in the power supply structure. Additionally, it is difficult to improve the proportion of renewable energy in the short term because of low on-grid energy and backward transmission facilities. Although thermal power has basic advantages, its development is controlled by government-led carbon emissions trading and environmental costs. The increase of the economic benefit brought by the government’s compensation for renewable energy has become the main driving force of its development. The increase in the share of renewable energy has benefited greatly from the gradual increase in the level of utilization and from the acceleration of the grid construction, to a certain degree.
Thus, under the guidance of environmental pressure, policy, and the power system itself, the key to thermal power development is to reduce energy consumption and pollutant emissions in order to achieve cleaner production.
Under the support of the policy to understand the regional and user differences, rational distribution, accelerating the construction of the power grid infrastructure is important for breakthroughs in renewable energy. It is the fastest way to realize breakthrough development of renewable energy, by a rational power generation layout and by promoting grid infrastructure construction after mastering the regional and user differences.
4.3. Comprehensive Evaluation of China’s Power Supply Structure Clean Development
In this paper, the evolution of China’s power structure from 1952 to 2015 is analyzed from two dimensions: time and space. Data processing and computational analysis help us to further explore the evolution characteristics and build a comprehensive evaluation system of the clean development of China’s power supply structure, as shown in
Figure 5 below.
4.3.1. Evaluation of Diversity
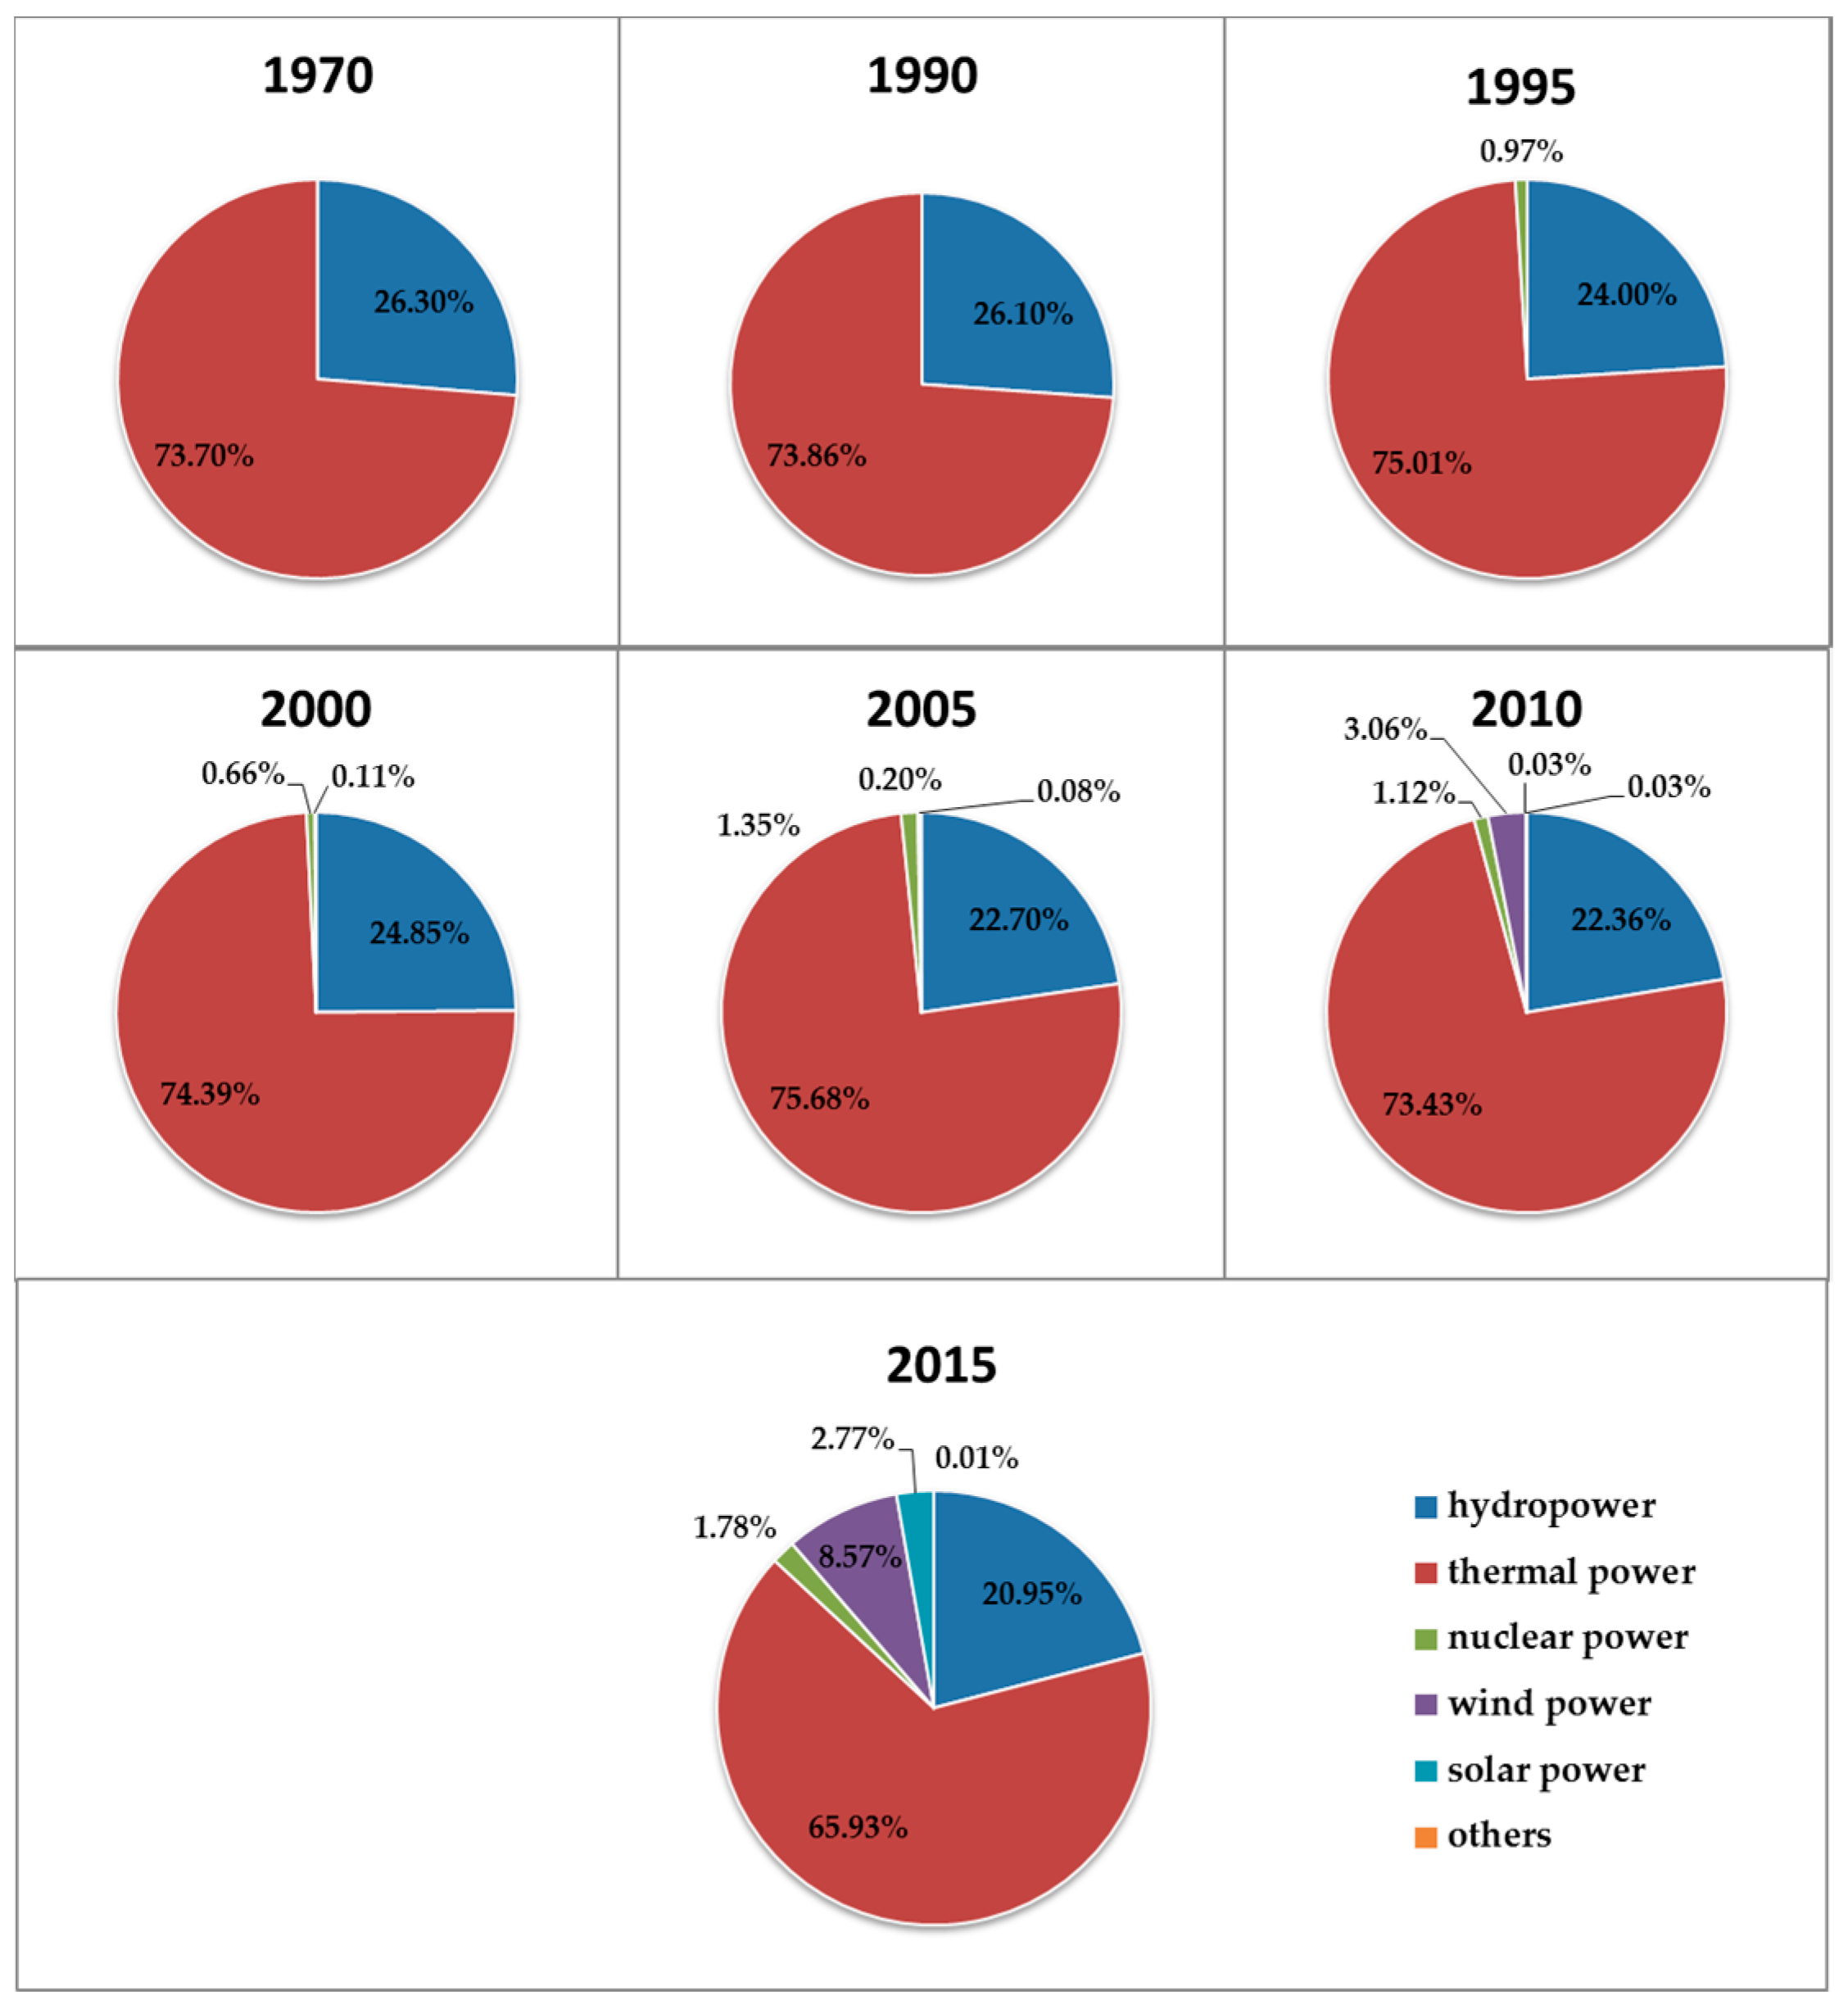
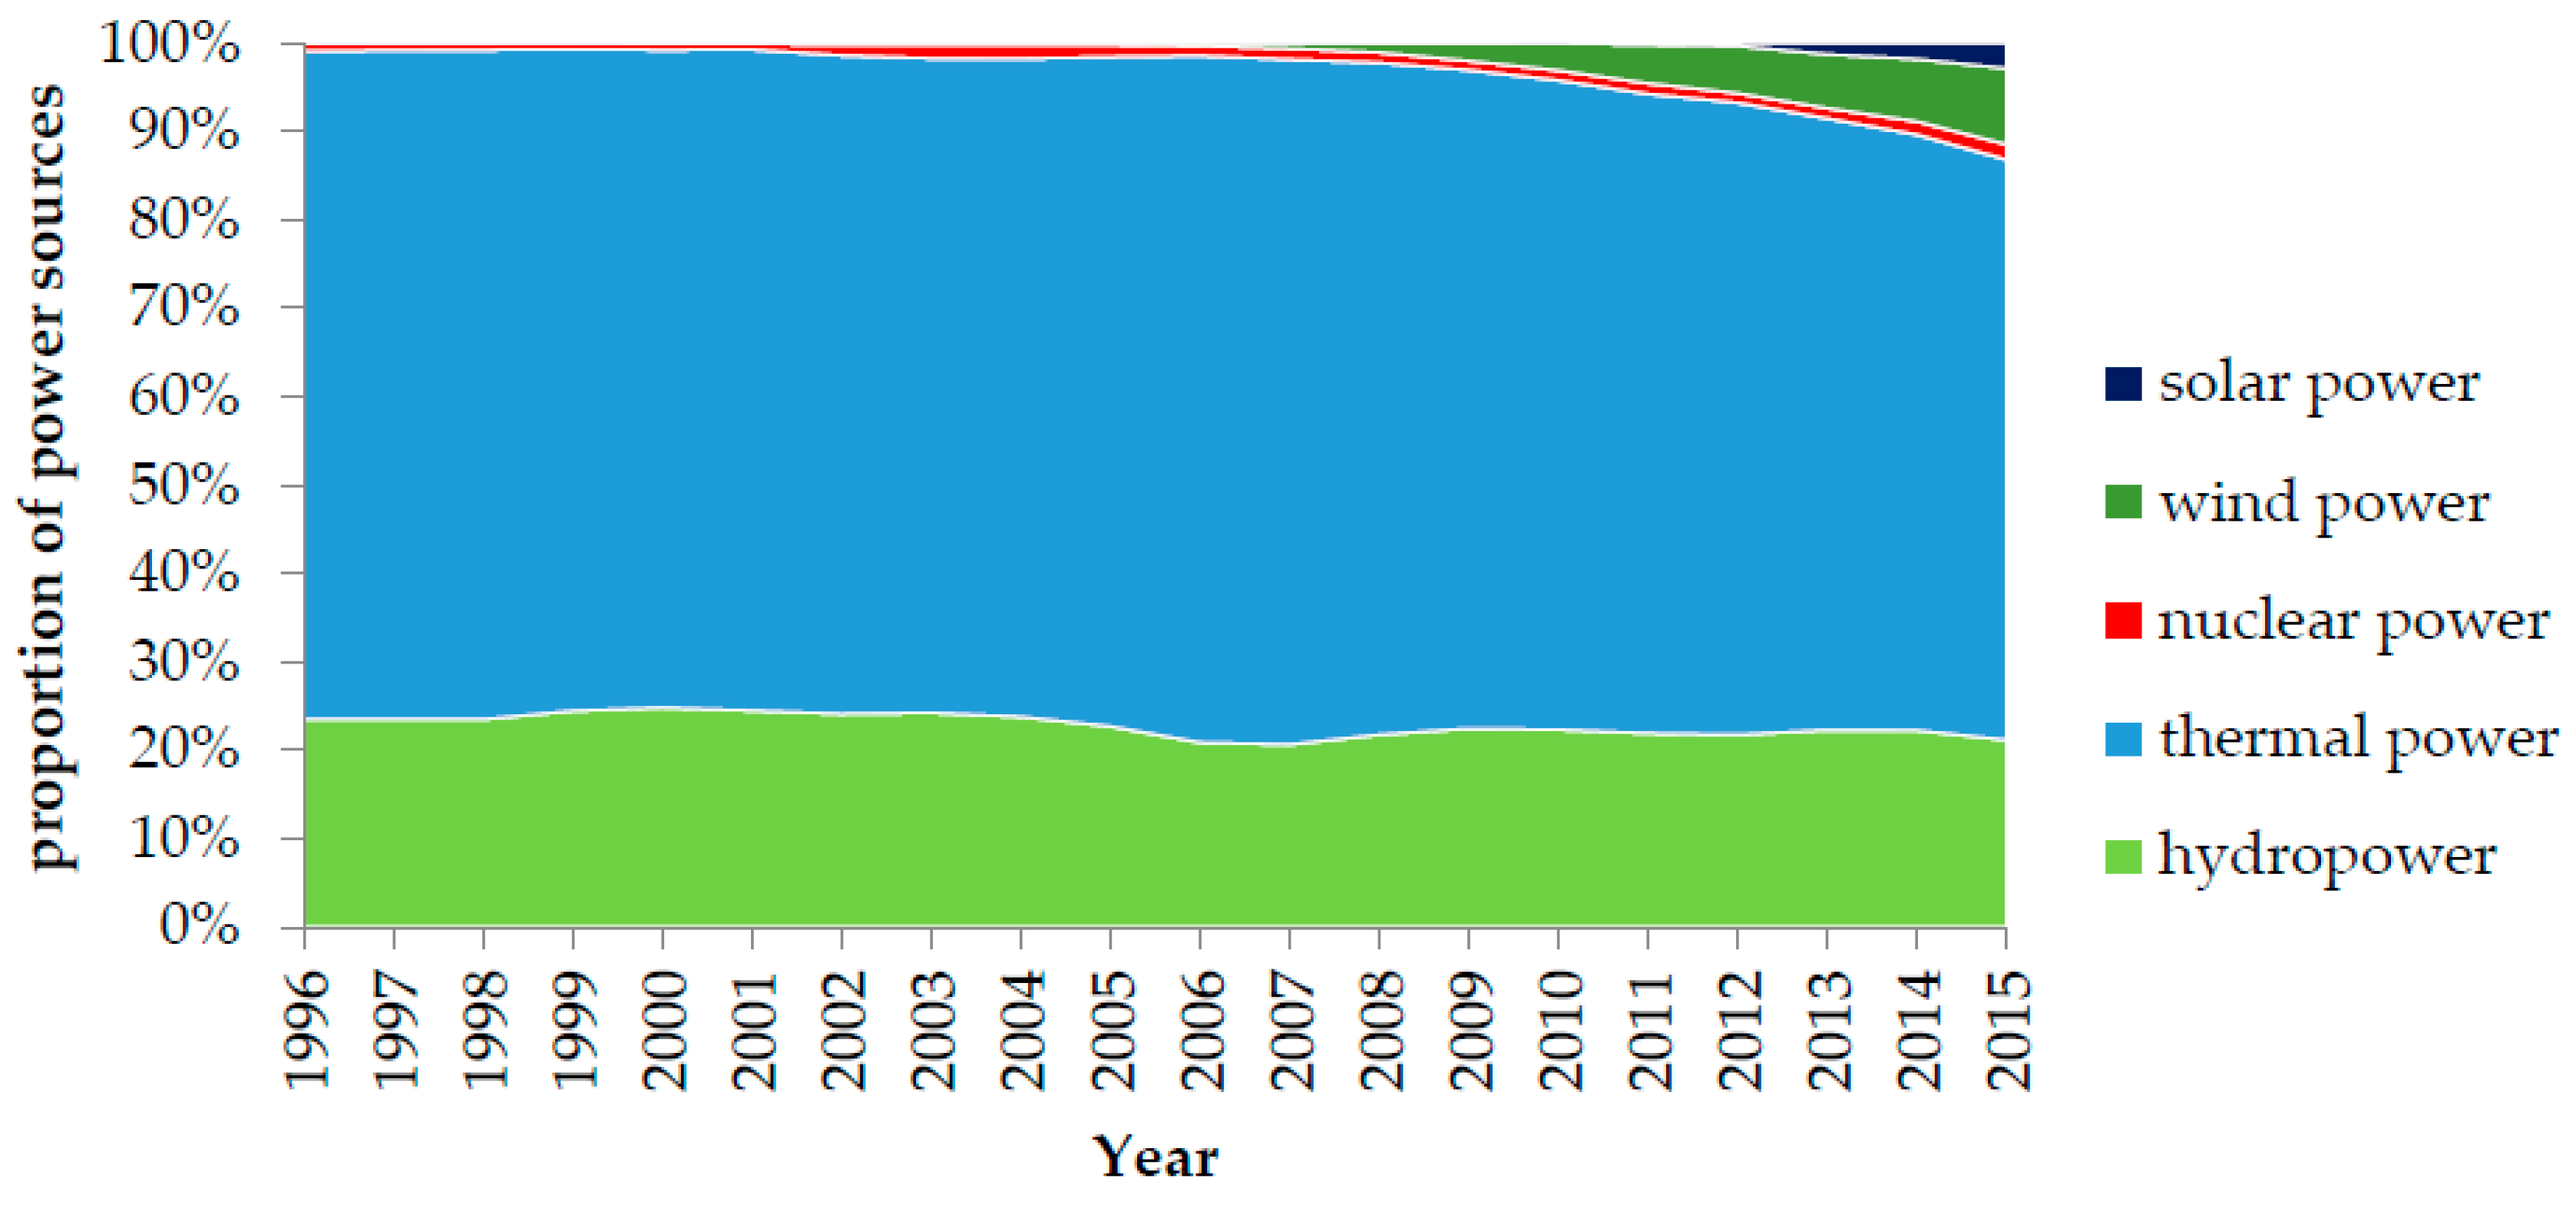
The types of power supply are increasingly diversified in China. In the early 1970s, as shown in
Figure 6, China’s power industry relied solely on thermal power and hydropower. Today, thermal power, nuclear power, and various types of renewable energy jointly constitute China’s power supply system. With the further maturation of technology, biomass, tidal energy, geothermal energy, and other types of renewable energy sources also began to generate electricity. Diversification is the best choice to change China’s over-reliance on coal and to ensure the safety and stability of the power supply under the influence of environmental and policy factors. Competition among different types of power supply, such as thermal power and renewable energy, stimulates the transformation of the power supply structure to one that is clean and highly efficient.
4.3.2. Evaluation of Distribution Rationality
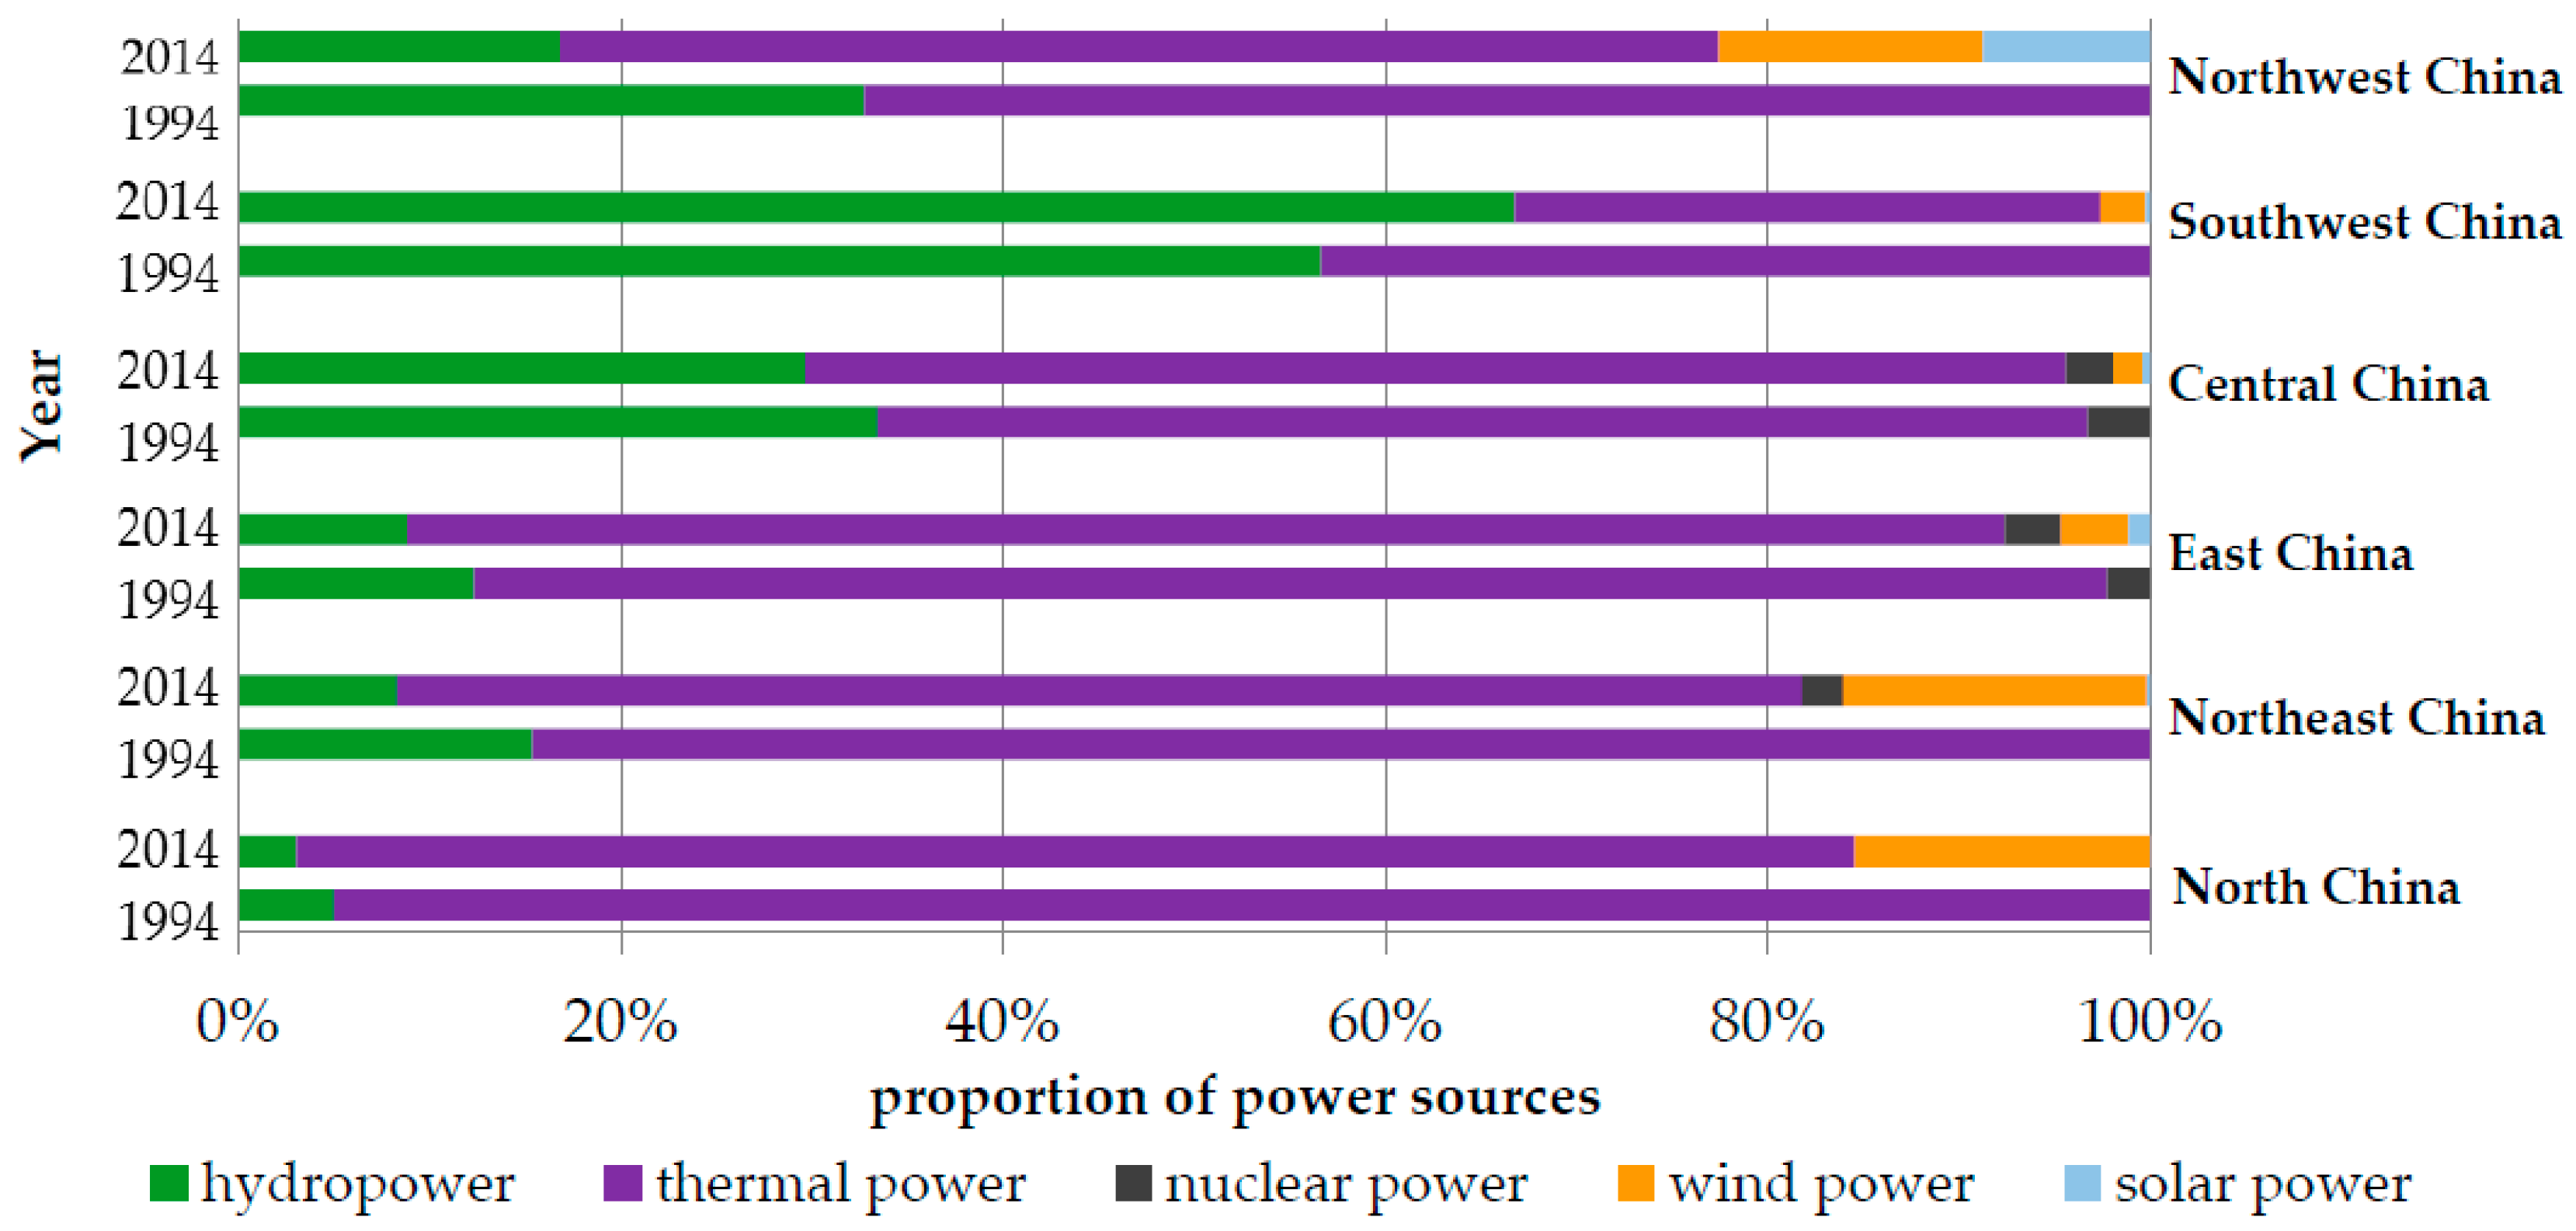
Resource development, environmental pollution, policy, and other factors make the regional power structure differentiation become increasingly prominent. As shown in
Figure 7, in the initial stage of evolution, the vast majority of regions have only two types of power supply, and thermal power occupied the dominant position. The diversification of the power supply has promoted the development of new energy sources in different regions. The diversity of resources widened the regional power supply structure differences. In coal-rich areas such as Shanxi Province, thermal power has the absolute dominant position, while the southwestern region is dominated by hydropower. The regional distribution of a single power supply also shows a distinct character. For example, under the influence of the Fukushima disaster and other factors, China’s nuclear power installed capacity is limited to coastal areas due to prudence and safety considerations. Solar power generation is mainly concentrated in the northwestern region on account of solar energy resource constraints.
4.3.3. Evaluation of Energy Efficiency
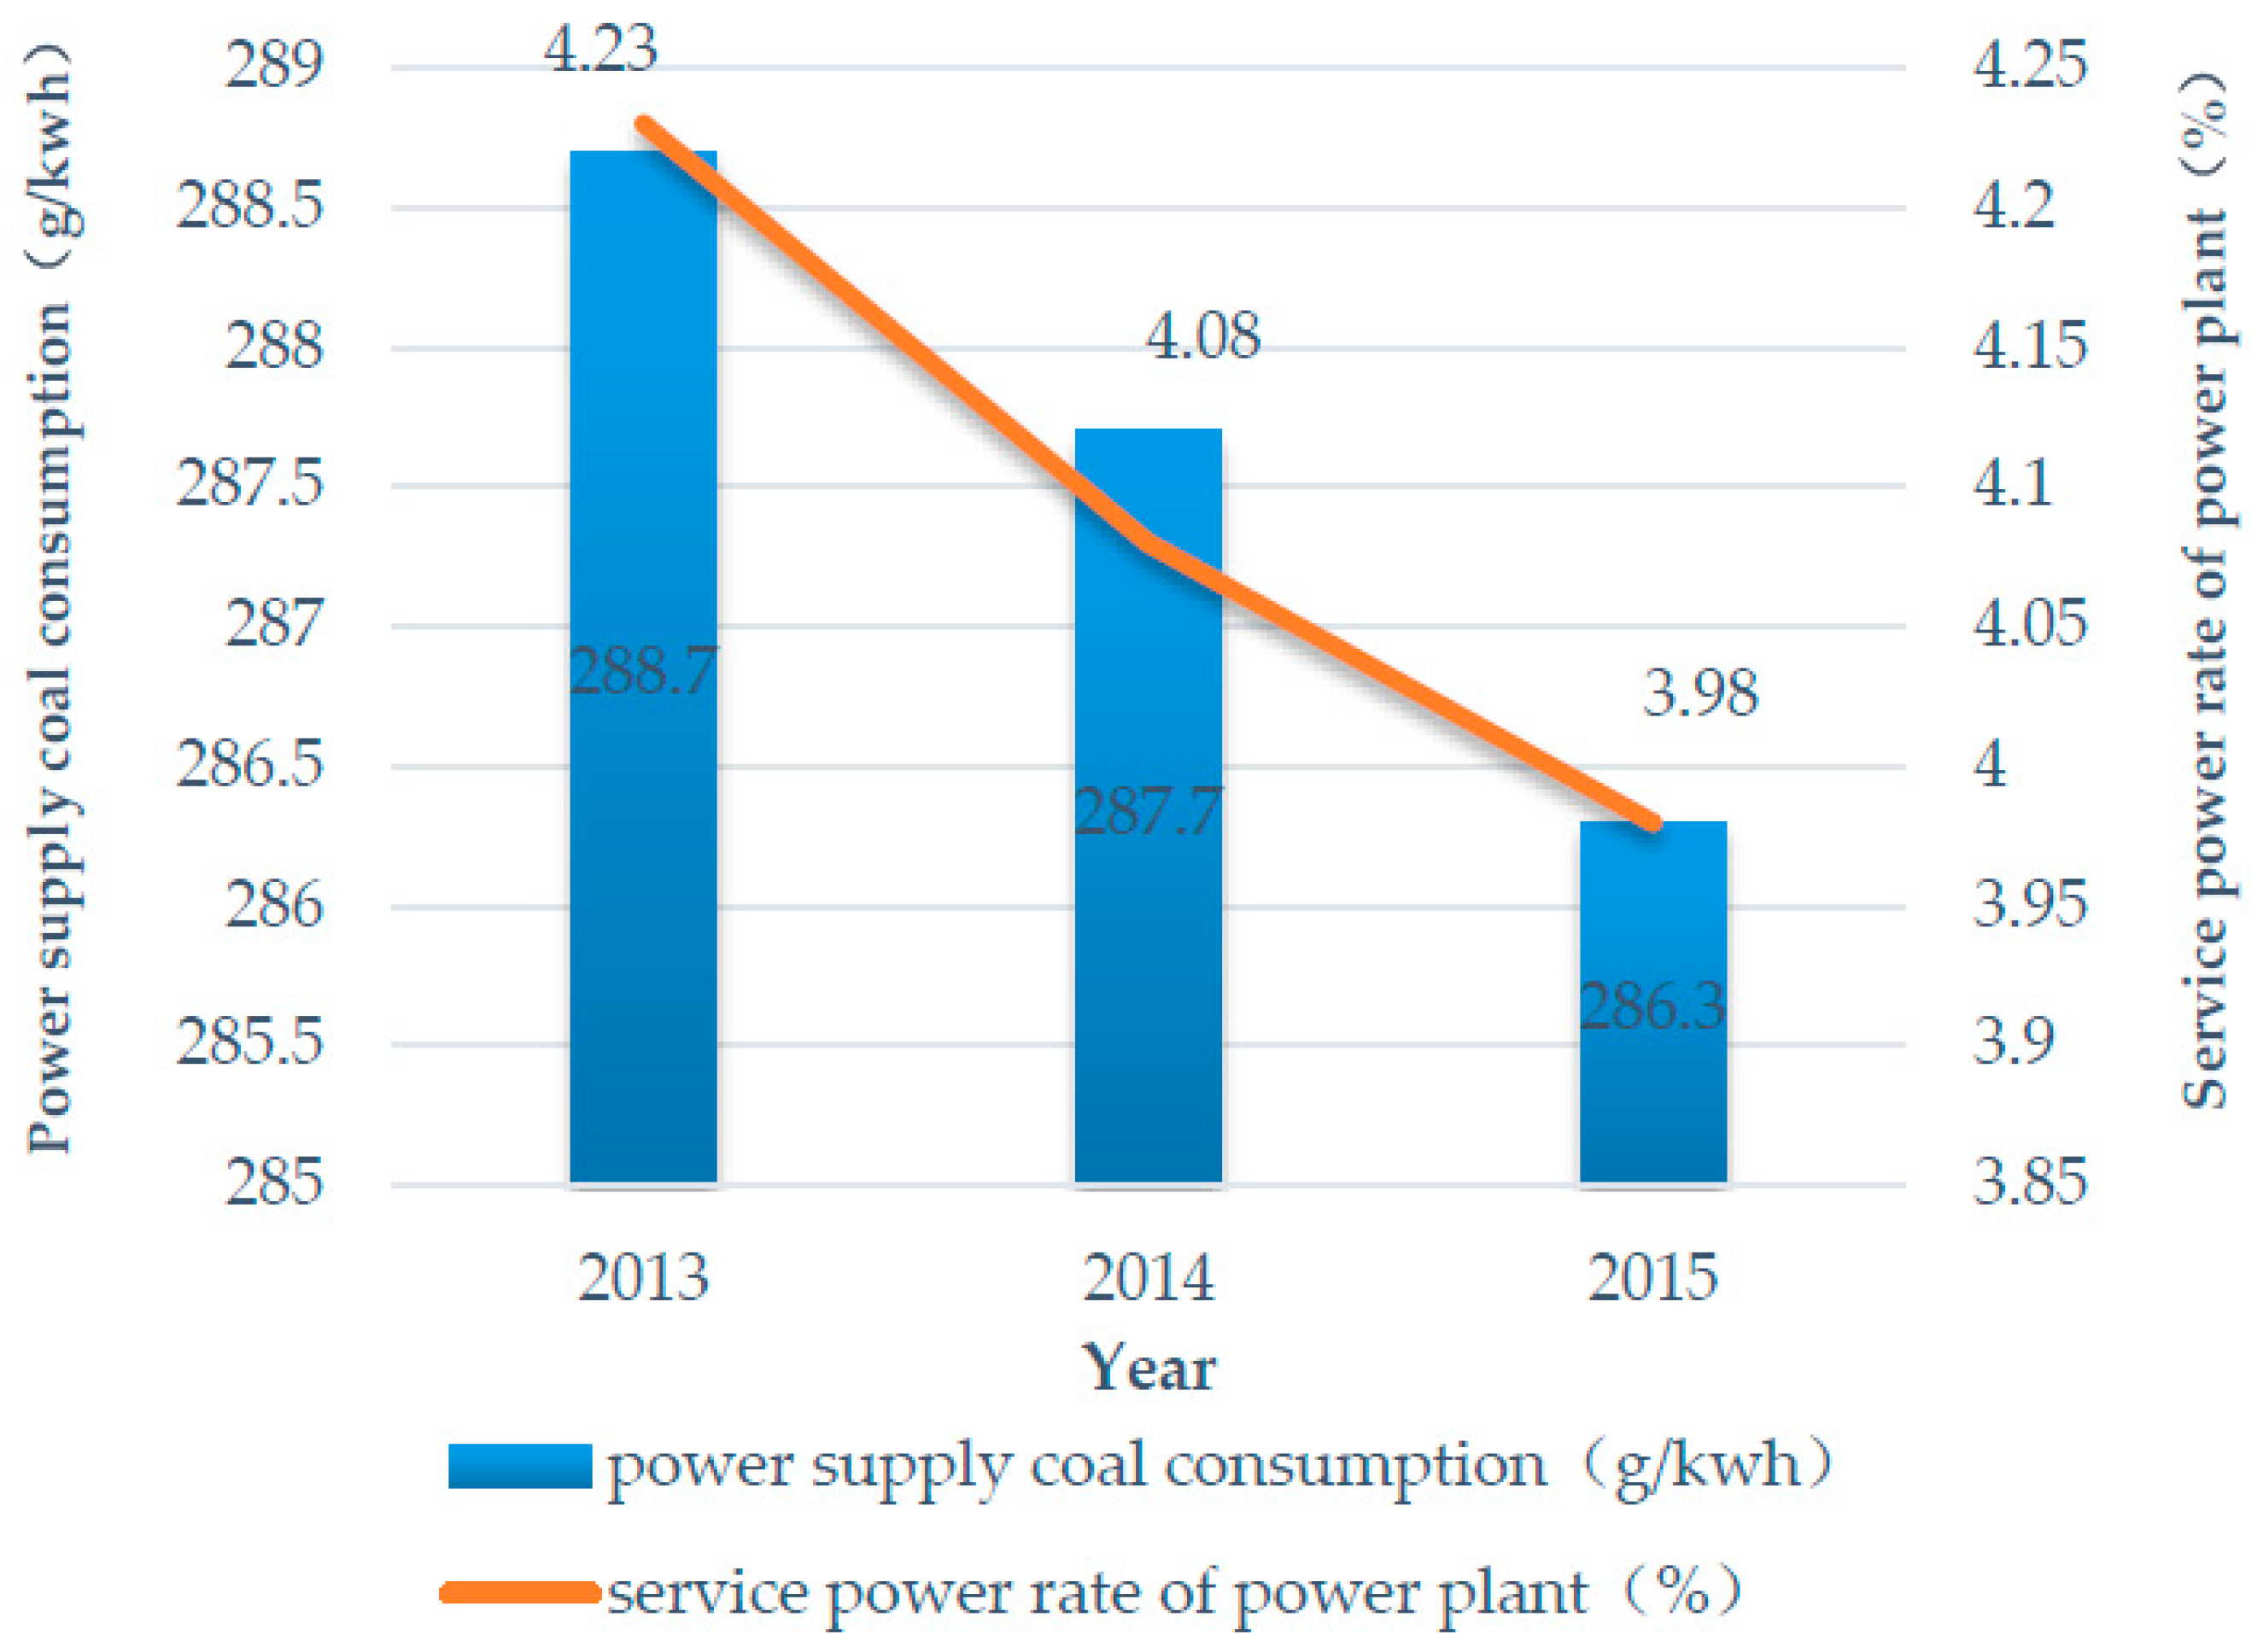
The direct result of the power structure evolution is the promotion of both single power generation efficiency and the whole operation efficiency of the electric power system. An efficient and reasonable power structure should not only be able to meet the electricity demand, but should also maintain reasonable and stable operation of the power system as a whole, so that the supply side and demand side can gain maximum benefits. From the power system operation point of view, the optimal standard of the power supply structure does not exist. However, there is still room for the optimization of the power supply structure within a single power supply. Further optimization of the structure adjustment could do better in fitting the characteristics of the low load, medium load and peak load while continuously improving the power generation efficiency and benefits. The replacement of inefficient thermal power generation units, the development of efficient energy sources such as nuclear power, and the construction of peaking power source are driving the power structure towards the direction of business-like evolution. As shown in
Figure 8, under the request of clean development, the proportion of large units of thermal power increased significantly while the power consumption rate and the station service power consumption decreased rapidly. The power generation efficiency has been gradually improved. The imperative increase in the proportion of pumped storage and other peak power set China’s power system operation on a mature and efficient development path.
4.3.4. Evaluation of Clean Utilization
Based on carbon emissions and pollutant emissions incentives, the clean development of China’s power path is reflected by two aspects: the clean use of fossil fuels and the positive development of non-fossil fuel energy sources.
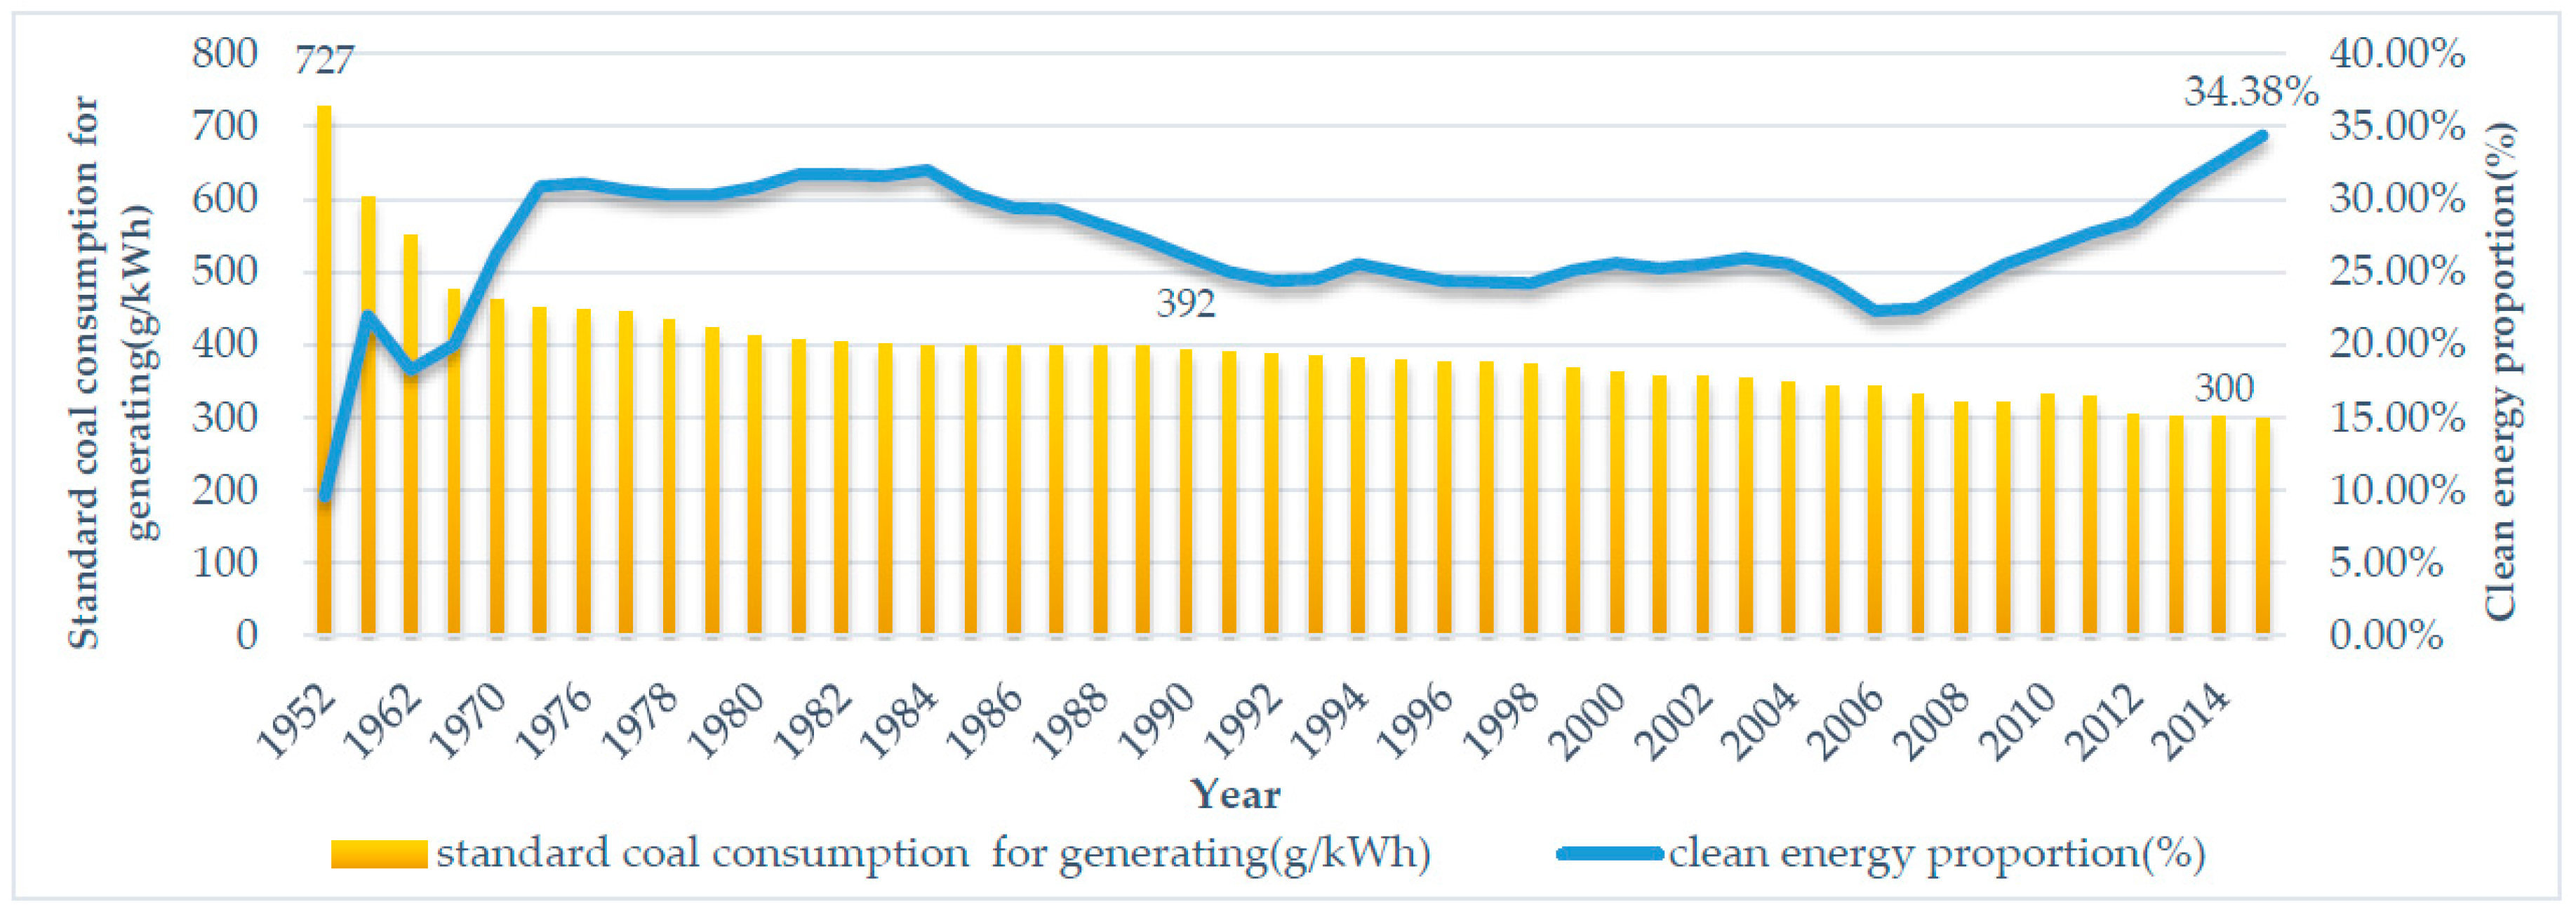
The resistance to the clean development of China’s power structure mainly comes from coal-fired power generation. From the trend of the evolution of China’s power structure, as shown in
Figure 9, the proportion of natural gas and methane in thermal power generation increased year after year, and clean production technologies such as the flue gas desulfurization (FGD) method was gradually popularized. As shown in
Figure 9, the proportion of clean energy in the power supply structure also showed an upward trend. With the gradual maturation of power generation technology, the renewable energy industry has developed rapidly. Renewable energy, as well as nuclear power with non-pollutant emissions, are the main forces in the clean evolution of China’s power supply structure.
4.3.5. Evaluation of Low Carbonization Development
Under the requirement of sustainable development, low carbonization is the inevitable result of the power structure evolution. Clean utilization and species diversity contributes to the low-carbon transformation of the power supply structure. China’s power industry made great efforts to change from the energy-intensive traditional industrial model to a low-carbon mode. Rapid development of the low carbon power supply (especially wind power and solar power) facilitated the boost of the renewable energy proportion.
With the support of national policy, wind power and solar power generation had amazing growth. As shown in
Figure 10, after the explosive growth in the early stages of development, the growth rate gradually flattened because of the increasingly saturated wind power marketand the rationality of development. In addition to wind power and solar power generation, the types of renewable energy power generation are increasingly diversified, including direct combustion of agricultural waste, power generation by garbage incineration, cogeneration, biogas, gasification, and biomass power generation. These power generation methods not only became mature technologies, but also made great progress in cost reduction and the promotion of economic efficiency. Many new energy power stations have good performance and have made outstanding contributions to reduce pollutant and carbon emissions from power generation.
5. Prediction of the Power Structure Evolution Trend Based on the VAR Model
5.1. VAR Model Establishment
Considering the power supply structure as a whole, under the interaction of the power system, environmental pressure, and policy, the development of various power sources has interactive influence. The variation of the installed capacity of one type of power supply may be directly or indirectly influenced by the installed capacity of the last period or the last several periods. It is appropriate to analyze and predict the power supply structure of China by using the Vector Autoregressive Model(VAR), which is suitable for multiple time series variables. One of the applications of the unconstrained VAR model is to make predictions. The VAR model regards every endogenous variable as a function of the hysteresis of all the endogenous variables in the system. Based on this model, the evolution trend of the power supply structure in the future is predicted.
The system dynamics analysis of the evolution of the power supply structure in
Section 4.2 shows that the key factors affecting the development of thermal power are energy consumption, pollutants, and carbon dioxide emissions. The acceleration of grid infrastructure construction is an important way to promote the proportion of renewable energy in the power supply structure. For the sake of data validity, integrity, and completeness, as shown in
Table 1, this paper selected the proportion of five primary power supply types and influence factors from 1994 to 2015 to build the model.
Figure 11 shows the raw data of the proportion of the main power sources. Prior to 2005, there was no separate statistics on coal-fired power generation and gas-fired power generation. Therefore, the thermal power data in this paper include both coal-fired and gas-fired power generation.
The share of geothermal power generation, marine energy, and other new energy sources in China’s current power supply structure is still very small. Therefore, we can assume that hydropower, thermal power, nuclear power, wind power, and solar power constitute the overall power supply structure, namely:
In order to eliminate heteroscedasticity of the time series and guarantee the data’s stability, this paper preprocesses each variable in advance. There are a lot of missing values for the data of previous years, since wind power and solar power generation started much later. The missing values are altered to constants ζ, which are sufficiently small so that the conversion of data will not change the trend of the original time series. Then, we take the logarithm of all data. After the completion of data pre-processing, Augmented Dickey-Fuller tests are used to check whether each series has a trend.
Upon inspection, the original sequences are non-stationary. It is necessary to test the stationarity of the first difference of the series. The results of the first difference Augmented Dickey-Fuller (ADF) test are shown in
Table 2. After the first difference, the time series are stationary series except for W
1 and E
3. The prerequisite for constructing the VAR model is that the time series is homogeneous. Thus, this paper builds the model with six sequences, excluding the two variables W
1 and E
3. The cointegration test is carried out in the next step because of the nonstationarity of the original data. Results are presented in
Table 3.
The trace test indicates no more than three cointegrating equations at the 0.05 level. This is likely to be associated with a small amount of sample data and does not affect the construction of the VAR model [
35]. As shown in
Table 4, the optimal lag order of the VAR model is 2, by the principle of the minimum Akaike Information Criterion(AIC) and Schwarz Criterion(SC).
The VAR (2) model is constructed as
Table 5.
A sufficient and necessary condition for a stable VAR model is that all eigenvalues are within the unit circle.
Figure 12 indicates that no root lies outside the unit circle. VAR (2) satisfies the stability condition which can be applied in the power supply structure prediction. The model fitting degree, R2, is greater than 70%.
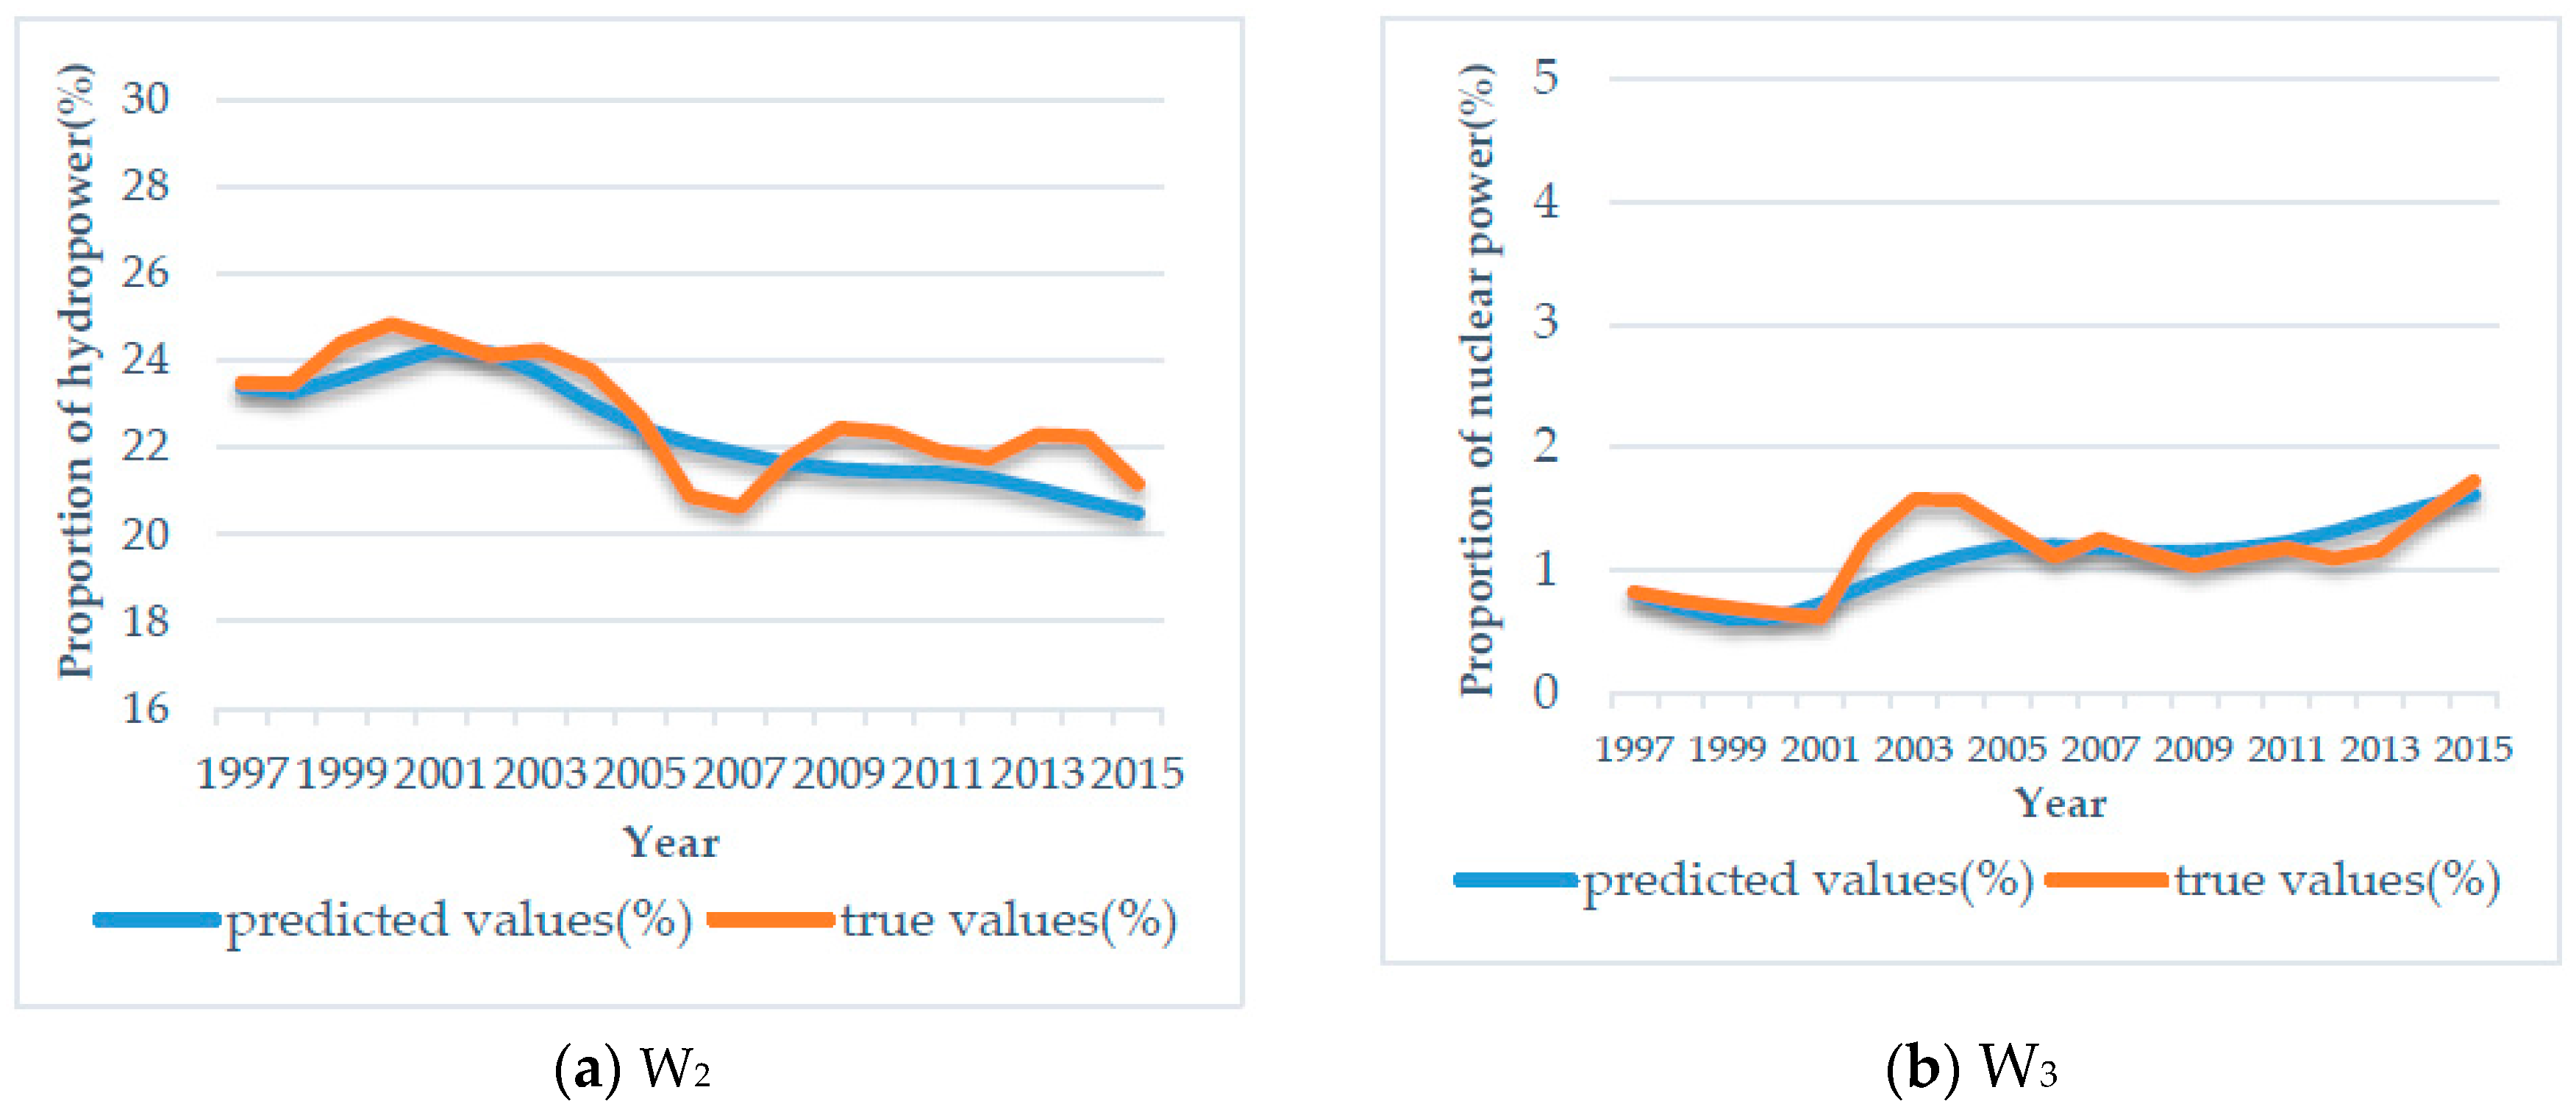
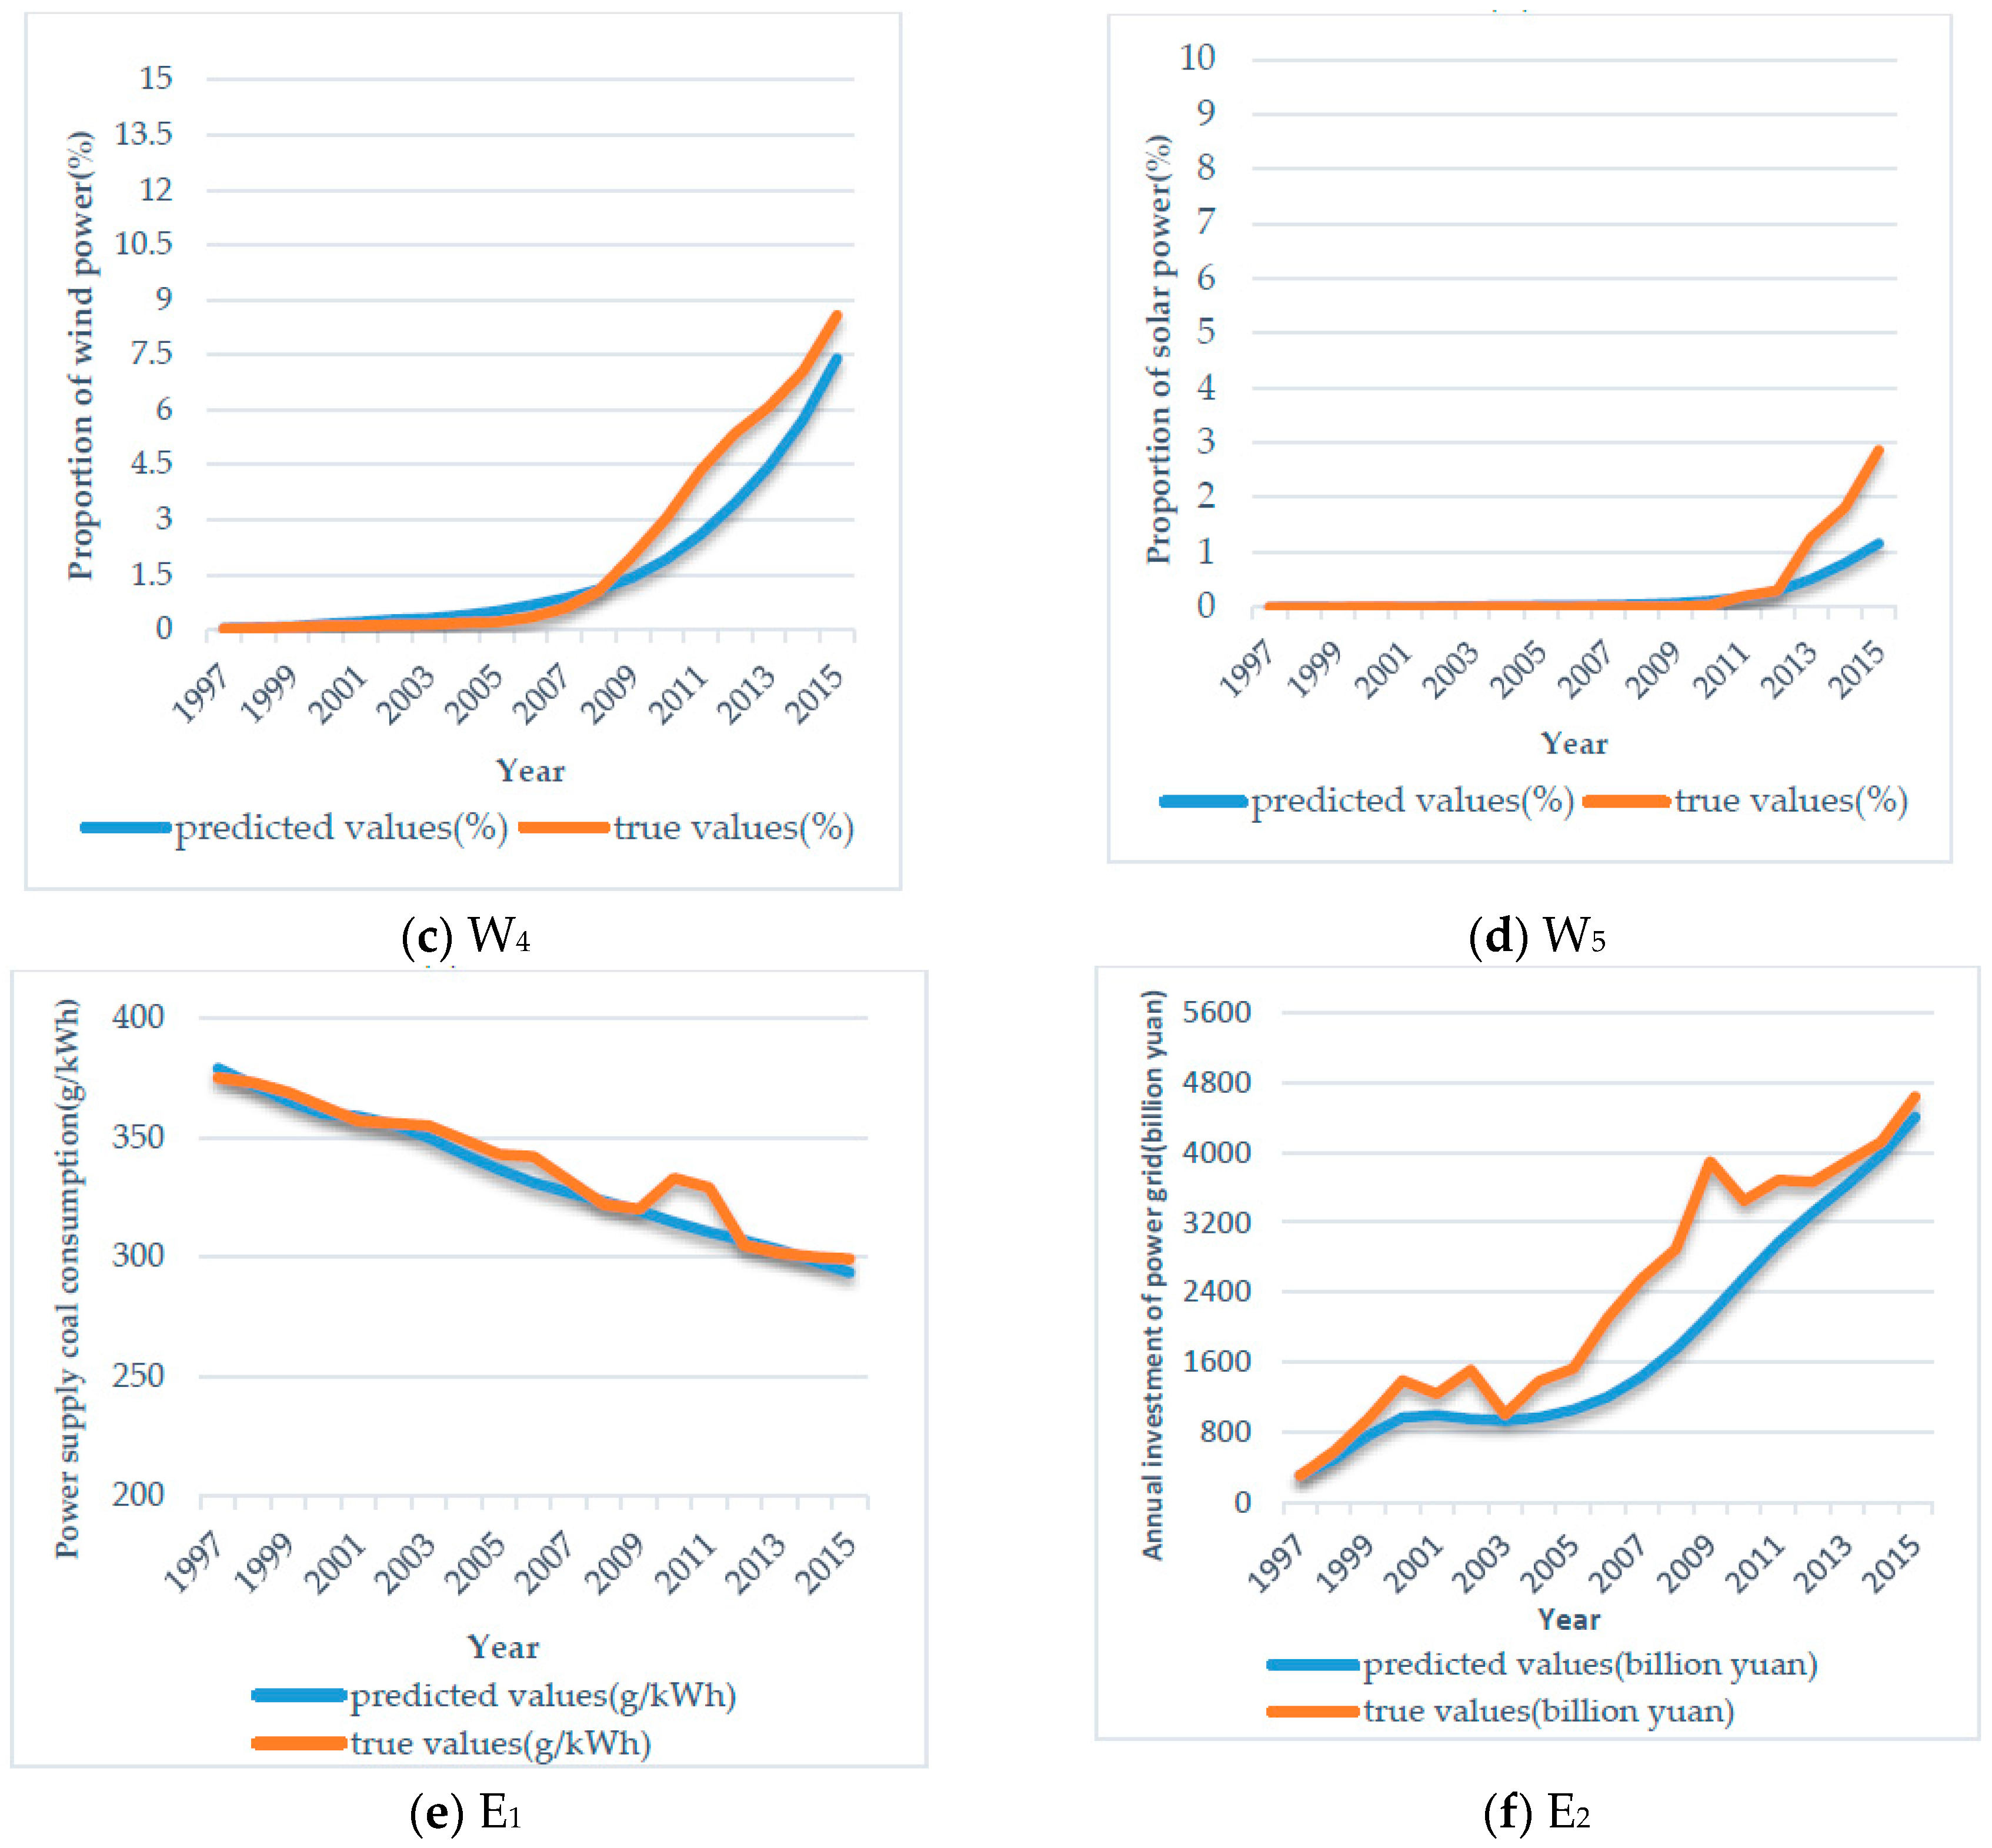
Through the VAR (2) model, we obtain the growth rate of each time series in the next five years, to calculate the predicted value. Comparison of the predicted values and the real values can help us to understand the accuracy of the model (
Figure 13). The curves of the VAR (2) model fit the trend of each time series well, but it is smoother than the real value curves, which is consistent with common sense. Because the proportion of the various types of power supply may be subject to the macroeconomic environment, policies, and other uncontrollable factors, their volatility is relatively large.
In a word, the model is credible. Analysis of the forecast results will be presented in
Section 5.2. From the trend of the time series evolution, W
3 may increase slowly. W
2 and E
1 may show a downward trend in the next five years, while W
4, W
5, and E
2 show a more obvious growth trend.
5.2. Forecasting Results Analysis
In this paper, we construct the stable VAR (2) model to forecast the power structure of China in 2020, and the results are shown in
Figure 14.
The proportion of thermal power generation in 2020 will be lower than 62%; it falls by 4.13% compared with that of 2015. However, thermal power still occupies the main position in the power supply structure, which will pose huge challenges to carbon dioxide reductions and haze governance in China. Nuclear power development is relatively conservative. Compared with 2015, its share rises only 0.15%. Hydropower, wind power, and other renewable energy sources in 2020 account for 36.6% in the power supply structure. Within five years, it increases by about 4%. This is a considerable improvement, because renewable energy accounted for only 25% in 2010. Among the renewable energy sources, only the proportion of hydropower may slightly decline. China’s hydropower development started relatively early, so it’s potential is insufficient compared with new energy sources such as wind power. Wind power remains as China’s third major power supply. The proportion of solar power has also been greatly improved. If the issue of renewable energy reception is better resolved, its proportion may grow faster.
Overall, in the next five years, China’s power supply structure will move in the direction of clean and low-carbon production, which presents a more obvious optimization.
6. Optimization Analysis of China’s Power Supply Structure Clean Evolution Based on Policy Guidance
Policy usually plays an important guiding role in the evolution of the power supply structure [
36]. The results from the analysis of the evolution mechanism indicated that policy has been one of the important driving factors in the evolution of the power supply structure in China. Power development policy will have a direct or indirect impact on the installed capacity of various power supply types. In particular, coercive and restraining policies for the power supply structure adjustment are particularly effective. Because of the long construction period of large-scale power projects, it is necessary to make adjustments to the structure and the overall arrangement in advance, in order to avoid huge wastes of investment and resources. Policy planning will help to meet the power supply in a more economical, clean, and efficient way, and support the healthy development of the national economy. Policy is not suitable for further data modeling since it is difficult to quantify.
In this section, firstly, the paper discusses the recent power supply policy in China, and then carries out the optimized scenario analysis. Finally, the paper analyzes and summarizes the future direction of China’s power supply structure under the influence of policy factors, compared with the VAR forecasting results.
6.1. Power Supply Structure Optimization Path under the Policy Guidance
Various types of policies, such as macroeconomic policies, national development plans, and industrial policies will have an impact on the further optimization of the power structure [
37]. The research range focuses on electric power planning in the 13th Five-Year Plan and policies enacted by China’s National Energy Administration the National Development and Reform Commission in the last two years. Through combing and analyzing these policies, the power supply structure optimization path under policy guidance can be presented.
As shown in the
Table 6, electric power planning conveys a clear signal to the directions of main power sources development from 2016 to 2020. The overall development of thermal power may be inhibited. Gas-fired power shows higher levels of government support than for coal-fired power. China is still cautious about nuclear power. Safety is the priority in the development process. Renewable energy development is strongly encouraged by the state. The positive hydropower development under the premise of environmental protection is affirmed. Planning stresses that wind power should be focused on both the development and decentralized development. On the contrary, solar energy should focus on distributed development.
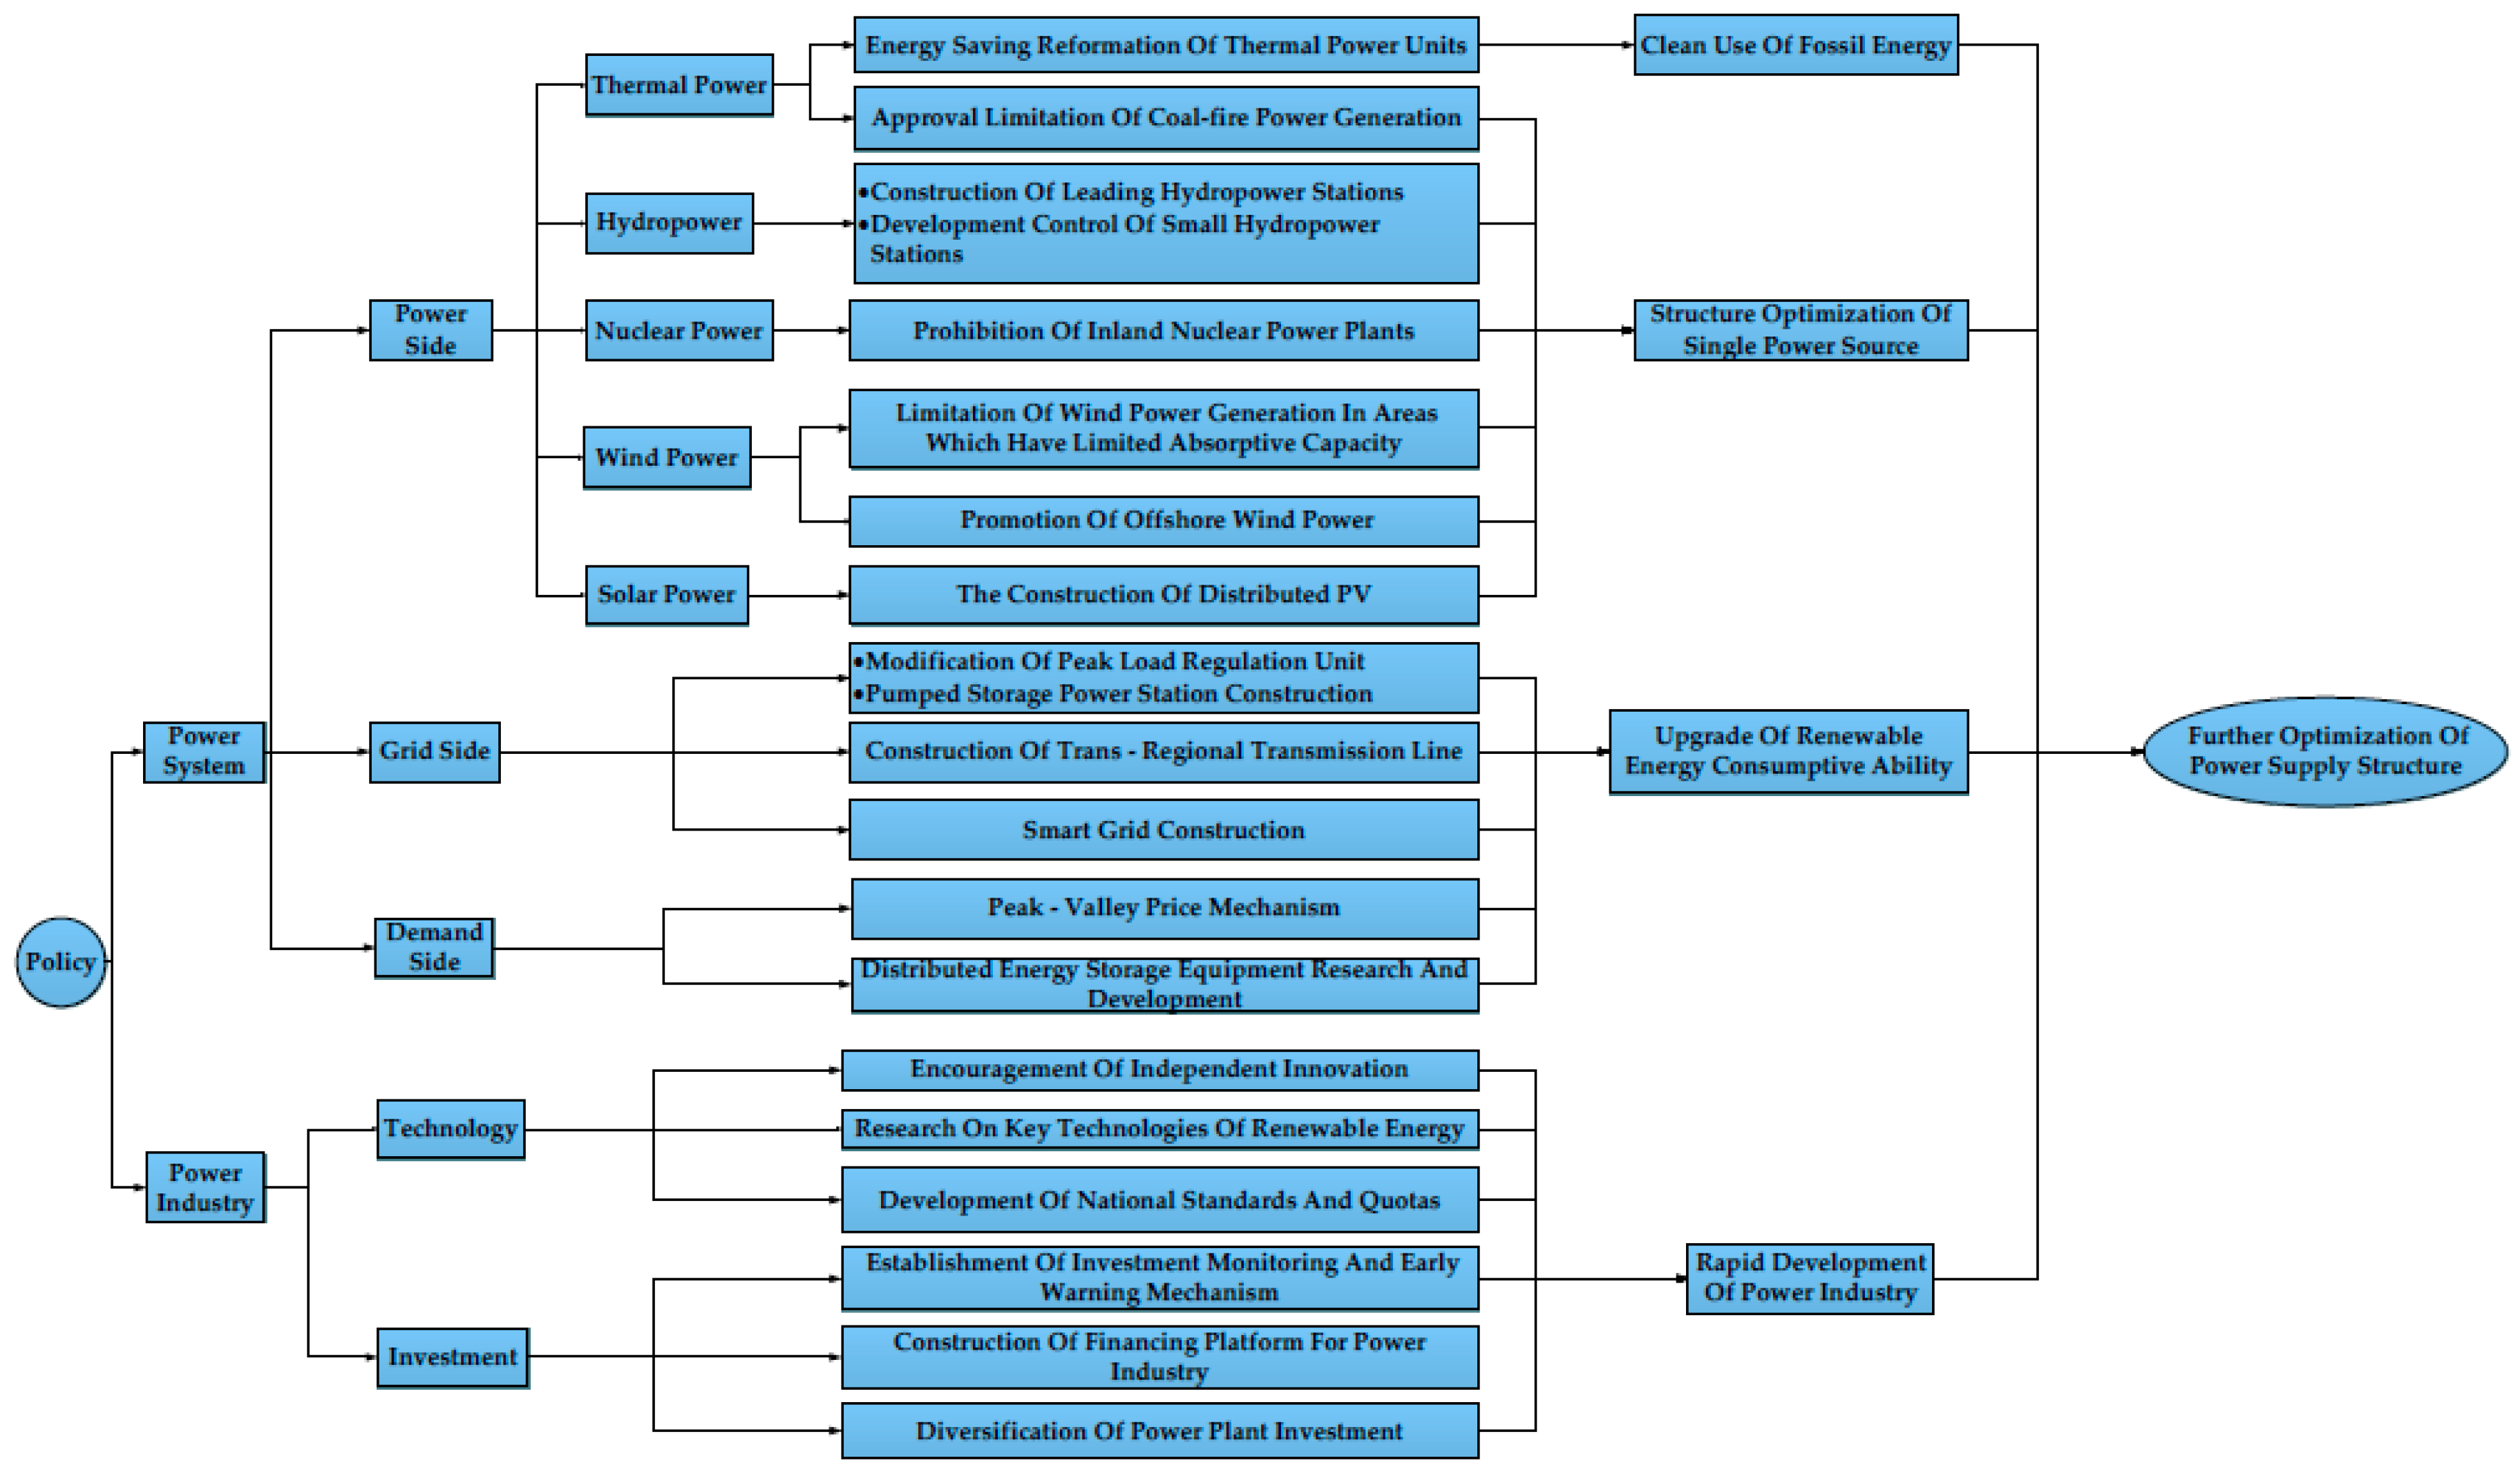
Combining the policy analysis, we can draw the main optimization path of the power structure under the policy guidance. As shown in
Figure 15, the policy mainly promotes the optimization of the power supply structure through the power system and through industrial development. Clean energy utilization of fossil fuel energy, the optimization of the power source internal structure, and the upgrading of the renewable energy absorption capacity are the main guiding directions of the policy in the measures regarding electric power systems. Suppression of new coal-fired power plants and the upgrading of coal-fired units will promote the clean and efficient development of thermal power. Recently, the gradual seriousness of renewable energy curtailment made the government begin to pay more attention to its orderly development. Peaking powers such as pumped storage power are valued as unprecedented. The strong capacity of peak shaving will promote grid-connected generation and consumption of renewable energy. Improvement of energy storage technology on the user-side and electricity usage will all contribute to the stability of the power grid. From the industrial point of view, technological innovation and capital will stimulate the rapid development of the new energy industry. Ultimately, these will help to further optimize the power supply structure.
6.2. Prospect of China’s Power Supply Structure Optimization in 2020 Based on Scenario Analysis
Scenario analysis which combines qualitative analysis with quantitative analysis can be used to predict and analyze the direction of the power supply structure optimization under the policy guidance. It recognizes the diversity of outcomes. The analysis of system dynamics indicates that carbon emission is also an important factor affecting the evolution of the power supply structure. Because of the non-stationarity of the carbon emission data, this paper does not include it in the construction of the VAR model. With the establishment of the unified national carbon trading market in 2017, low-carbon development becomes even more urgent for the whole power system. Based on the analysis of policy, the paper constructs two scenarios to analyze the development of the power supply structure in 2020. Carbon emission is the key distinguishing factor of the scenario assumptions. The expected rate of increase for each power supply is shown in
Table 7.
(1) Baseline Scenario
This scenario set is in reference to the 13th Five-Year electric power plan. Planning is very crucial and indispensable pilot work. According to the load forecasting of a certain period of time, it can systematically consider the coordination among all kinds of power sources on the premise of meeting the demand of power load growth and various constraints. Therefore, it has scientific and practical value for research. In this scenario, by 2020, China’s economy will maintain steady and moderate growth. There will be more emphasis on quality and efficiency, as well as the evolution of the power supply structure. The growth rates of this scenario are based on the targets set forth for electric power planning of the 13th Five-Year Plan published by the National Development and Reform Commission (NDRC) and the National Energy Administration (NEA).
(2) The Enhanced Low-Carbon Scenario
After the start of the national carbon emissions trading market in 2017, the cost of carbon emissions will force an adjustment for the power enterprises which generating power from fossil fuels. Renewable energy may have a larger preponderance than ever before. We assume that the carbon dioxide emissions constraint in this scenario is stronger than for the baseline scenario. It is estimated that the growth rate of thermal power generation with large carbon emissions will continue to slow down, and zero-emission conventional hydropower and wind power will develop rapidly. Nuclear power and pumped storage power are vulnerable to the impact of this policy, therefore, they will have moderate growth. Blind investment and expansion of renewable energy will result in a large amount of abandoned electricity. As shown in
Table 7, this paper makes some adjustments to their growth rates [
38].
Based on the installed capacity of each power source in 2015 and different growth rates, this paper calculates the optimal power supply structure individually in 2020. The results are presented in
Table 8.
In the enhanced low-carbon scenario, the share of thermal power is lower than in the baseline scenario. The proportion of hydropower is essentially flat. However, there are differences in the internal structure of hydropower. Conventional hydropower in the enhanced low-carbon scenario occupies a larger proportion. The growth of wind power is far beyond the plan expectations when taking the carbon emissions factor into account. On the contrary, the development of solar energy may be quite slow.
We can add the VAR model prediction results to the comparative analysis. Thermal power is still the most important power source in China among the three scenarios. Similarly, the thermal power proportion has a significant decline compared with 2015. The lowest proportion of thermal power appears in the enhanced low-carbon scenario. The proportion of hydropower in the three scenarios is relatively close. Wind power in the enhanced low-carbon scenario shows a substantial increase.
In conclusion, under the influence of multiple factors such as carbon dioxide emissions and policy, the share of thermal power will decrease significantly in the next five years while the proportion of clean energy will rise rapidly. Clean development and low carbonization of the power supply structure will deepen.
7. Suggestions on Clean Development of the Power Supply Structure in China
Through the analysis of the evolution of the power supply structure, prediction, and optimization, the diversification and cleanliness of the power supply structure in China is improved under the policy guidance, but there is still a gap regarding the optimization target. The power industry is a comprehensive one across all walks of life. It thus requires higher levels of policy coordination and a rational layout to drive the efficient allocation of resources within the industry. In the face of huge environmental pressure and the weak growth of power demand in China, the method of making a more rational and scientific adjustment of the power structure still remains a great problem. Combined with the optimization paths, this paper puts forward the following policy recommendations:
7.1. Promote Well-Rounded Industrial Innovation
At present, China needs to promote ideological innovation, technological innovation, and management innovation regarding the low efficiency of the power generation industry caused by insufficient electricity demand and excess supply. Conventional wisdom holds that consumption is determined by production. This concept should be changed in order to control the blind expansion of installed capacity. Key technological innovations such as special high-voltage transmission technology, high-efficiency photovoltaic cells, low-cost photothermal generators, large-capacity inverters, and micro-inverters should also be strengthened in various industries to reduce operating costs while improving the power generation efficiency. The innovations and breakthroughs of new technology can promote the technological innovation of the whole industry chain. In terms of fossil fuel energy generation, it is feasible to raise efficiency by optimizing the control technology and the unit supply structure, as well as establishing a diversified development concept. These changes will bring new vitality to the industry. Industrial business model innovation is also crucial. China should implement the “go-out” strategy of hydropower, thermal power, nuclear power, and grid projects to drive the export trade of related equipment, technology and services, and strengthen technical exchanges.
7.2. Impel the Coordinated Development of the Power Supply
The key of power structure optimization focuses on how to coordinate large-scale clean energy centralization and improve overall power system efficiency. The application of large grid-connected renewable energy puts forward higher requirements of peak regulation and reliable operation. Promoting the construction of the energy interconnection is essential for the fleet development of the electric power industry. The energy interconnection involves a great many sectors such as power generation, transmission and distribution, electricity sales, and use. With the help of power electronic technology and information technology, it is easy to realize the interconnection of energy sources and information flows of various centralized power supplies, distributed power supplies, energy storage devices, and electric power units. It is obvious that the energy interconnection can rationally allocate energy resources to solve the problem of new grid-connected energy sources so as to achieve the purpose of promoting the coordinated development of fossil fuel energy and renewable energy. The power generation side can use the energy trading platform to carry out on-line electricity trading, reselling, and other services to prevent the waste of electricity which will facilitate better demand-side management.
7.3. Deepen the Power System Reform and Strengthen Policy Support for Clean Development
In order to allow the market to play a decisive role in the allocation of resources, the government should continue to deepen the new round of power system reform. In addition to the public welfare of electricity, purchase prices and grid-connection prices should be formed by the market. China should actively promote the marketization of electricity prices on the power generation side and the sales side, and separate the transmission and distribution price from the generation and sale tariffs to establish a huge four-in-one power market including power capacity, electric energy, auxiliary services, and the renewable energy quota market. The introduction of financing and project modes of operation including contract energy management, energy saving leasing, and carbon trading is necessary. The government should improve the renewable energy price policy and subsidy policy, as well as separate the benchmark price and financial subsidy of coal-fired power generation in order to meet the needs of the current market-oriented power reform. At present, the development of new energy industries rely on government subsidies. Therefore, it may be helpful to change the current situation by changing a differential subsidy into a fixed subsidy and by promoting a quota system and a green certificate trading mechanism. The analysis of supply and demand resources and environmental costs should be included in policy-making so as to improve the accuracy and scientificity of the policy. The most important thing is that the government should make clear the direction of the implementation of policies, to ensure the continuity and stability of policies. The use of financial and tax incentives and other means can be used for the development of power to provide policy support. The use of fiscal and tax incentives and other means should be encouraged in order to provide policy support for power development.
7.4. Summary
To promote the efficient use of non-fossil fuel energy installations and the rapid development of renewable energy, scientific planning and energy-saving scheduling of various power sources are important missions of the policy for the requirements of clean energy development. Industrial innovation, the coordinated development of various power sources, and policy support are important driving forces to activate the development potential of the power industry. This paper argues that China’s power structure will be further optimized if the government can do better in these areas.
