Article

Household Livelihood Strategy Choices, Impact Factors, and Environmental Consequences in Miyun Reservoir Watershed, China

1
State Key Laboratory of Urban and Regional Ecology, Research Center for Eco-Environmental Sciences, Chinese Academy of Sciences, Beijing 100085, China
2
Department of Geography, McGill University, Montreal, QC H3A 0B9, Canada
3
School of Economics and Finance, Xi’an Jiaotong University, Xi’an 710061, China
4
Beijing Water Science and Technology Institute, Beijing 100044, China
*
Author to whom correspondence should be addressed.
Sustainability 2017, 9(2), 175; https://doi.org/10.3390/su9020175
Submission received: 5 December 2016 / Revised: 14 January 2017 / Accepted: 18 January 2017 / Published: 25 January 2017
(This article belongs to the Special Issue Sustainable River Basin Management)

Abstract

:
Household livelihood strategies are embedded in the natural and socioeconomic contexts in which people live. Analyzing the factors that influence household livelihood choice and defining their consequences can be beneficial for informing rural household policies. In turn, this has great significance for fostering sustainable livelihood strategies. We grouped household livelihood strategies based on the income distribution of 756 households and analyzed their influencing factors and possible livelihood consequences in the watershed of Miyun Reservoir, the only source of surface water currently available for domestic use in Beijing, China. Local farmers’ livelihood strategies can be grouped into three types: farming, local off-farm, and labor-migrant. Farming households have the lowest livelihood capitals, other than natural capital, compared with labor-migrant households and off-farm households, the latter having better livelihood capital status. Geographical location, natural capital, household structure, labor quality, and ecological policies are the main factors affecting farmers’ choice of livelihood strategy. Local off-farm households have a significantly lower dependency on firewood, land resources, and investment than that of farming and labor-migrant households, and have the highest reliance on fossil fuel. This household classification can help us understand the livelihood characteristics, impact factors, and consequences of different types of household strategies, which also suggest tailored policy and management options to promote sustainable livelihoods based on different household types.

1. Introduction

Rural poverty and environmental degradation are two intertwined challenges developing countries are facing. How to improve rural household livelihoods, and simultaneously realize ecological conservation in rural areas, has become a common concern of global social organizations, and an area of increasing research [1]. In recent years, scholarship on the relationship between agrarian livelihoods and the environment has grown in quantity and sophistication [1,2,3,4]. Livelihood strategies is a term that comprises the range and combination of activities and choices that people make in order to achieve their livelihood goals, including production activities, investment strategies, and reproduction arrangements [5]. Household and individual livelihood strategies are closely related to the natural and socioeconomic contexts in which people live, and can determine the efficiency of natural resource use, as well as the means and intensity of environmental interference [6]. Researches on rural household livelihood strategies, particularly on the types of strategies that rural households typically adopt and the factors that shape these strategies, have contributed to our understanding of the relationships between rural household livelihoods and the natural environment. Understanding these relationships has important implications for realizing a win–win for rural environmental protection and rural household livelihood improvement.
Previous studies of rural household livelihood strategies have tended to divide households into categories on the basis of household income derived from different activities [7,8,9], or on the basis of asset use and labor distribution [10,11]. However, household and individual livelihood strategies are not fully-described only by income, asset use, or labor. These are also determined by the diversity of the households’ assets (tangible resources like physical, financial, or natural capital, and intangible ones like social and human capital), as well as the social institutions that govern how or whether one has access to assets [12,13,14,15,16,17,18]. Therefore, livelihoods are not merely a summary measure of cash-equivalent resources, but are complex, multidimensional, and closely related to the natural and socioeconomic contexts in which people live [19,20,21]. In this study we recognize all these factors underpin livelihood dynamics, and we use a variety of measures from our own field collected data to categorize different livelihood types in an effort to try to better capture these issues. In addition, most studies on household livelihood strategies are mainly focused on community or local scales, with few studies defining strategy types and their influencing factors within specific management units, such as the watershed scale as is the case we present here.
We investigated the watershed of the Miyun Reservoir, the only source of surface water currently available for domestic use in Beijing, China. Ecosystem services (e.g., water provision, soil retention, water purification) in the watershed are extremely important for water conservation. The watershed crosses two administrative regions, Hebei Province and Beijing, which represent a large variation in resource endowments, economic and social conditions, living standards, and rural household livelihood activities. In this area, rural household livelihoods are gradually transitioning from traditional agriculture to more diversified strategies. Consequently, there have been changes observed in livelihood consequences, including dependence on natural resources, the ways in which land resources are utilized and the efficiency of their use, and household welfare, amongst other factors. We adopted a stratified sampling method, using data from a household survey based on participatory rural appraisal. We then identified household livelihood strategies through factor and cluster analyses based on distribution of income, and explained the influencing factors of different types of livelihood strategies and their livelihoods consequences. We aimed to classify household livelihood strategy choices and understand their livelihood characteristics, impact factors, and possible livelihood consequences. Finally, we hope to provide tailored policy and management options to promote sustainable livelihoods based on our findings.

2. Conceptual Framework

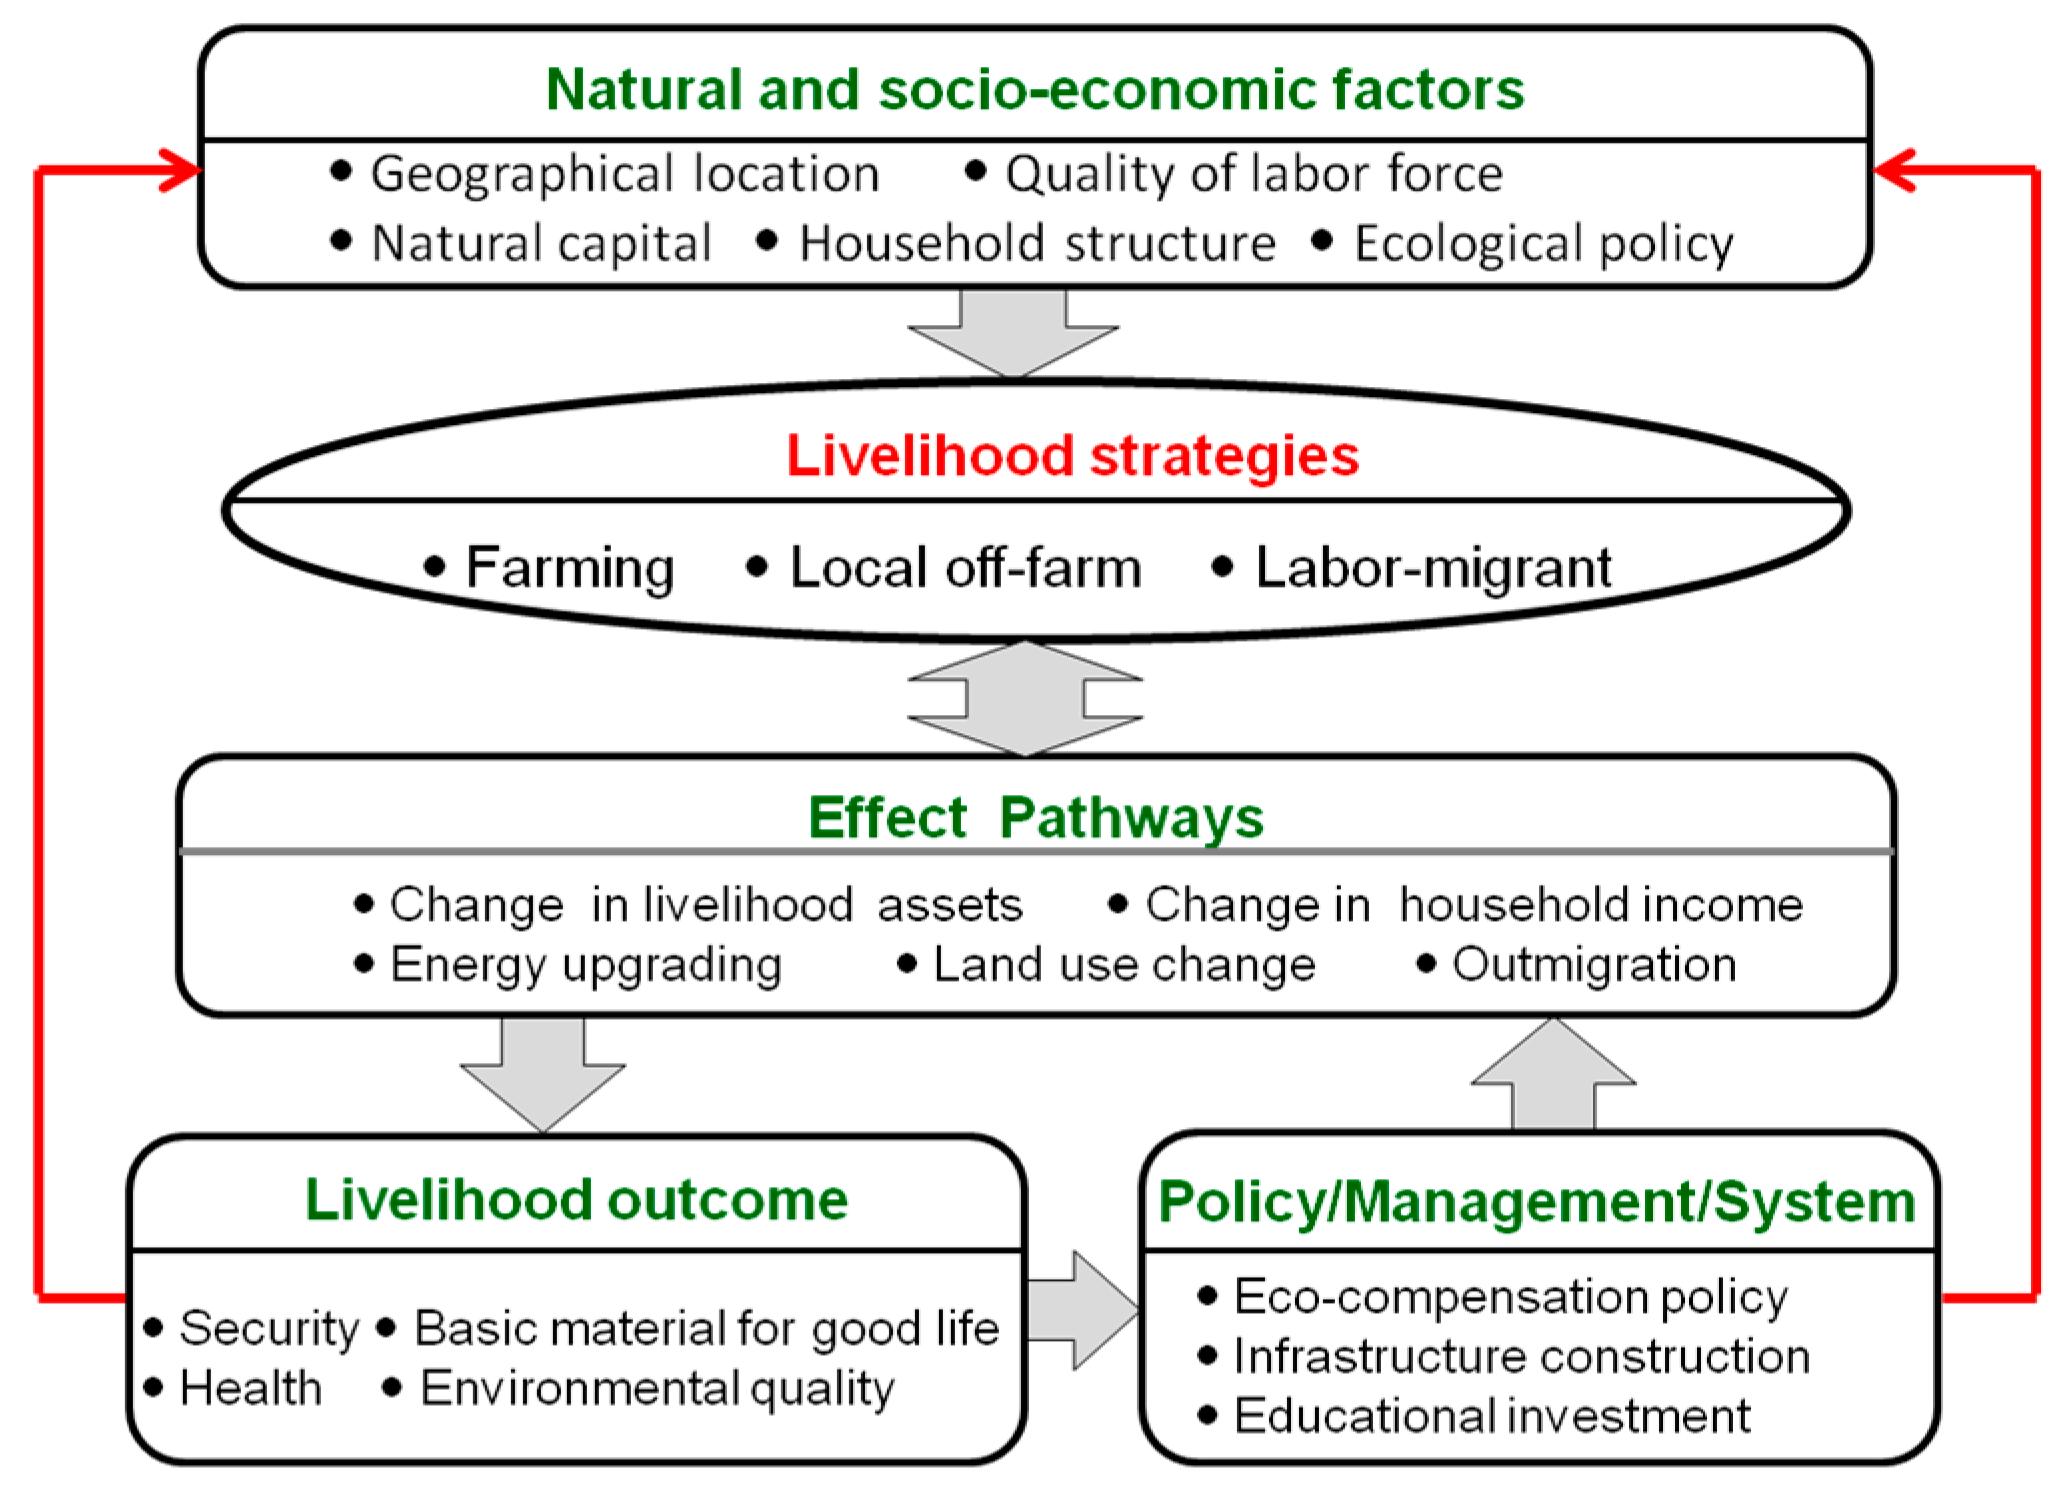
To provide the conceptual and theoretical foundations of this study, we present a conceptual framework (Figure 1) for household livelihood sustainability analysis based on the sustainable rural livelihood framework [21]. Natural (e.g., geographical location, resource endowment, etc.) and socioeconomic (e.g., market fluctuations, education level, policy background, etc.) contexts influence household decisions to engage in various livelihood strategies (e.g., farming, local off-farm or labor-migrant) [6,22,23,24,25]. Subsequently, different strategies can result in different livelihood outcomes (including security, basic material for good life, health, and environmental quality) through changes in livelihood assets, income, energy utilization, land use, outmigration, etc. These outcomes impact the overall sustainability of a livelihood portfolio. In light of these different livelihood consequences and contexts, policy makers try to improve the sustainability of household livelihood outcomes through policy innovation (e.g., eco-compensation, infrastructure construction, educational investment) [26,27,28,29,30]. Here, we first classify household livelihood strategy choices and then examine factors that impact different types of livelihood strategies and their possible livelihood consequences based on our data. Finally, we provide tailored policy and management options with the goal of promoting more sustainable livelihood options based on the above findings.

3. Study Area and Methods

3.1. Study Area

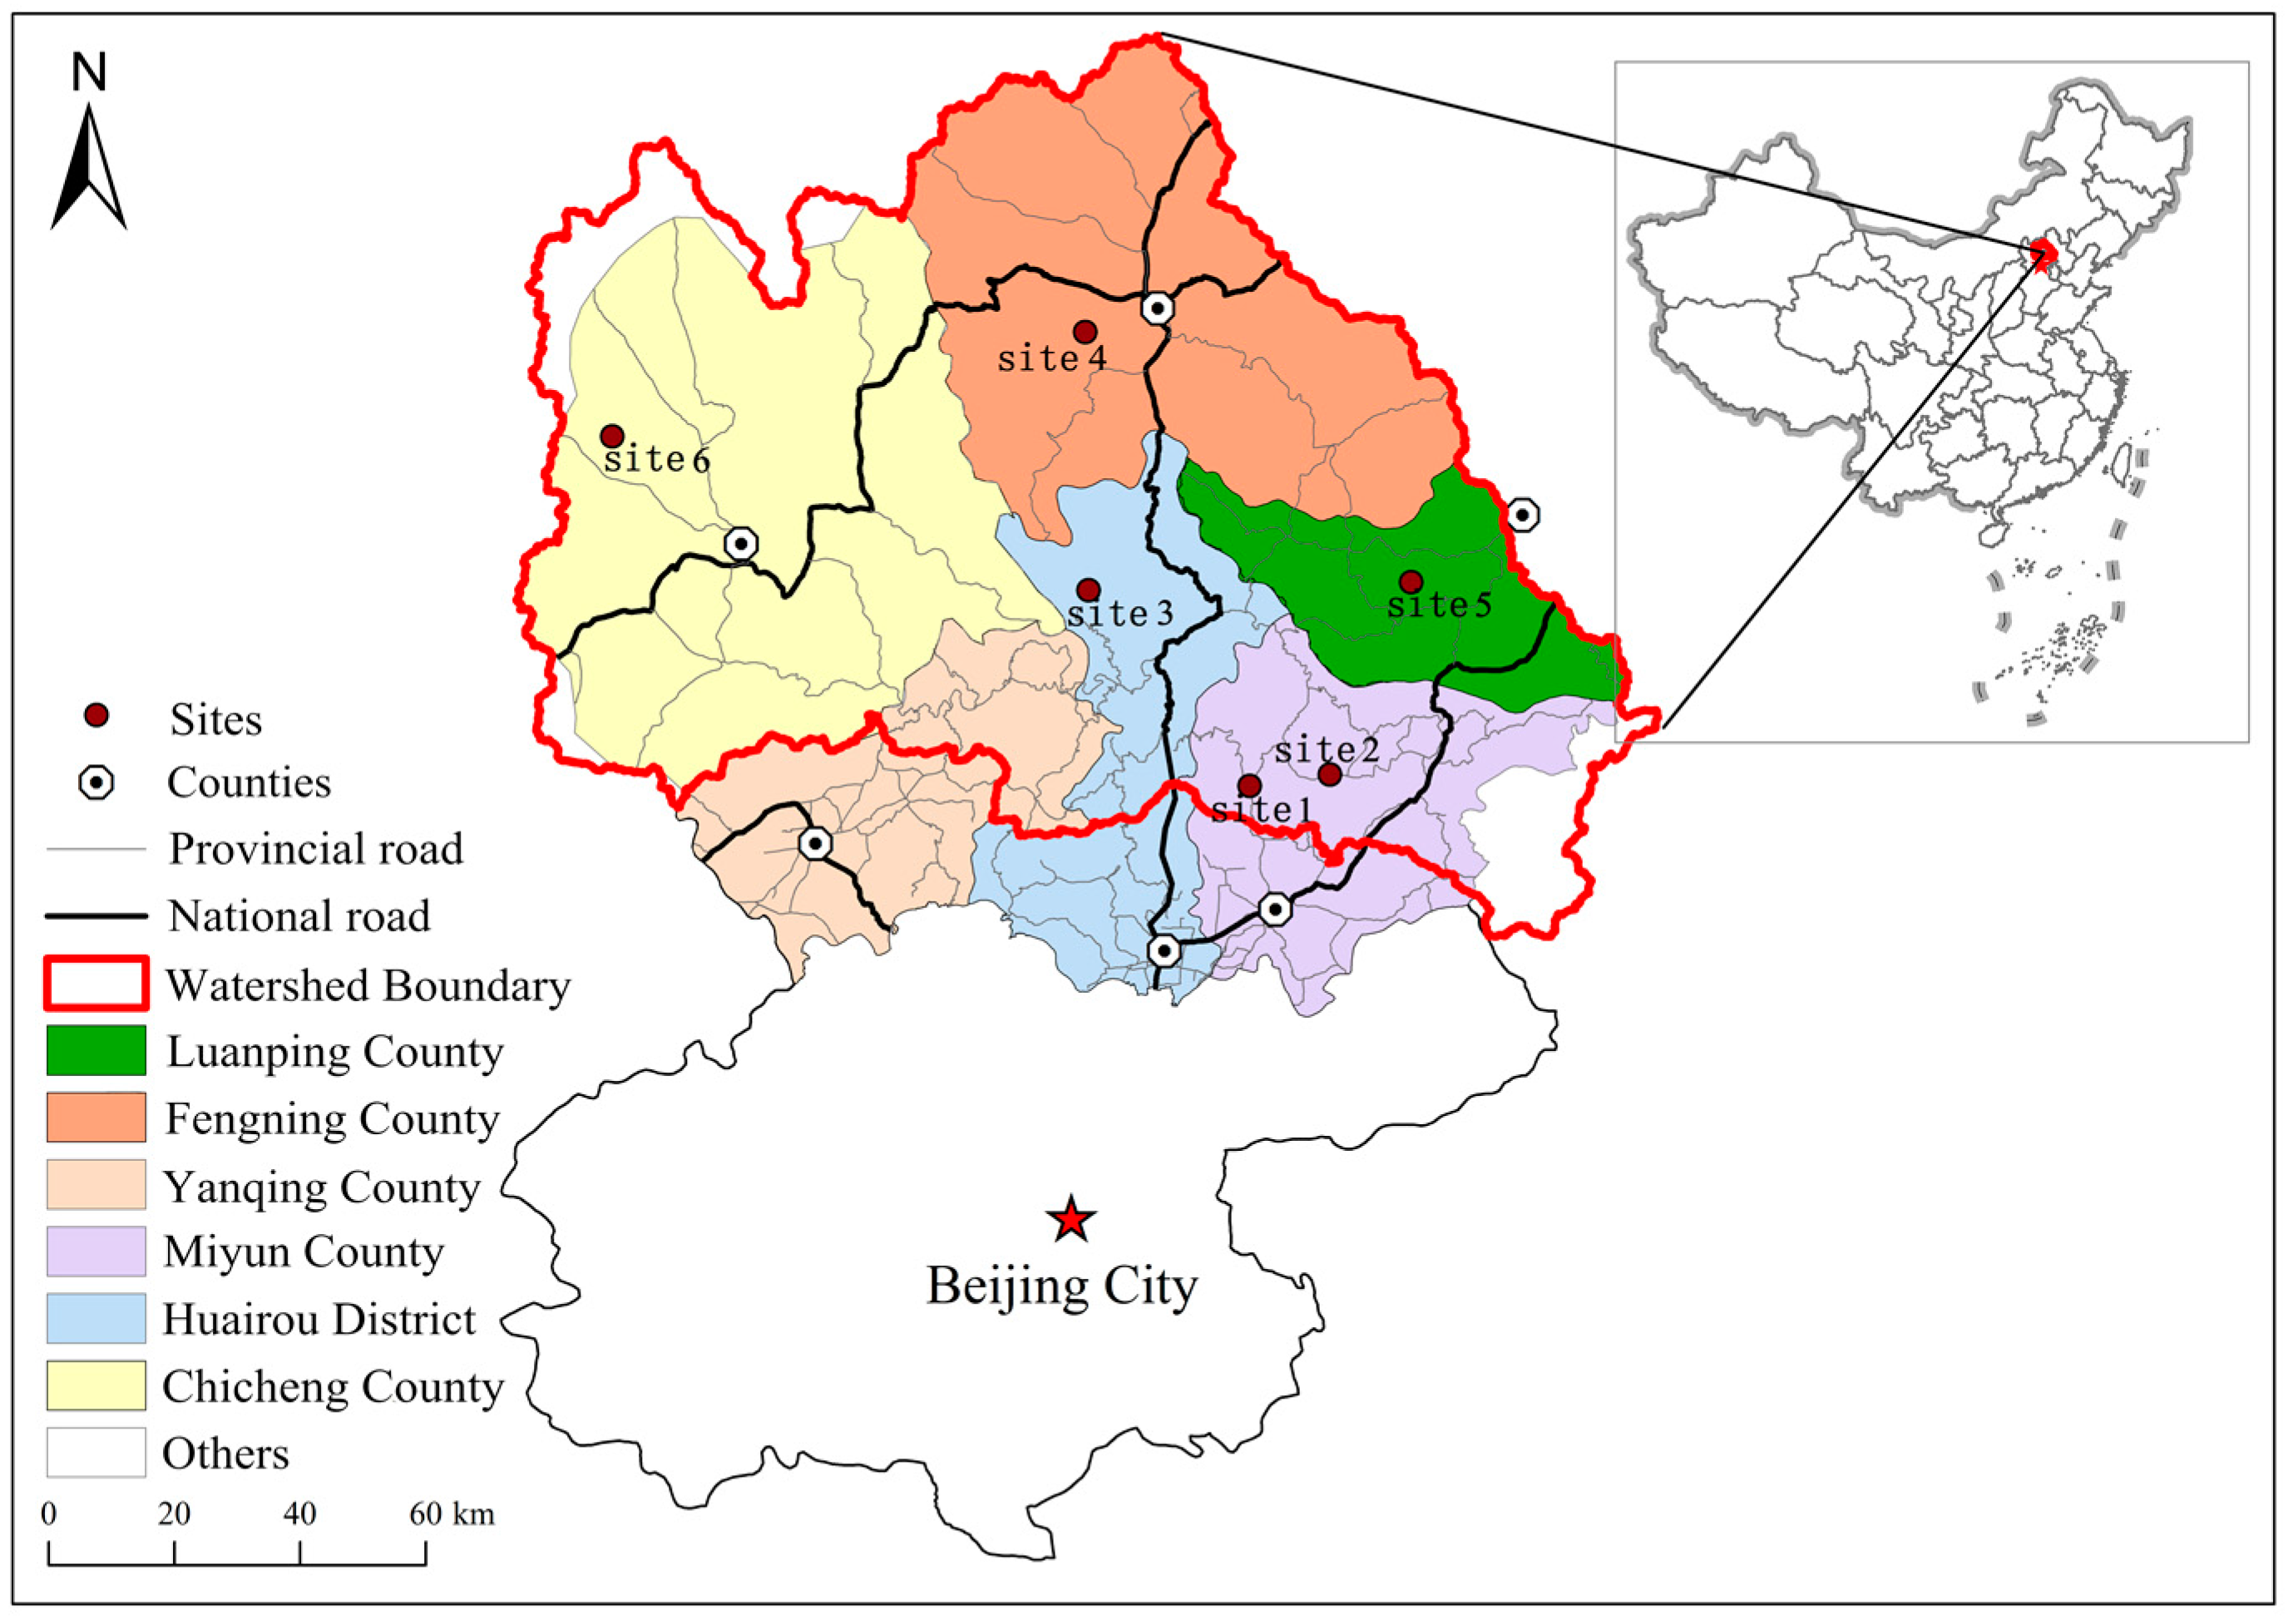
The study was conducted in the Miyun Reservoir Watershed (40°19′–41°38′N, 115°25′–117°35′E), which is located about 100 km north of Beijing, China (Figure 2) and is the major surface water source for Beijing with a total area of approximately 1.52 square kilometers. The terrain is high in the northwest, with the mountains rising to between approximately 1000 m and 2300 m, and low in the southeast, composed mainly of hills and a few plains and floodlands.
The Miyun Reservoir Watershed crosses two administrative regions: Hebei Province and Beijing. About four-fifths of the watershed is located in Hebei Province with the remaining one-fifth in the greater municipality of Beijing (Figure 2). The watershed is, therefore, affected by many factors such as geographical location and natural environment conditions, and there are large variations in the level of living standards and rural household livelihood activities across the area. The average net income of farmers in the Beijing townships is about three times that found in the Hebei Province [30].

3.2. Data Collection

Data were collected from detailed household surveys fielded in August 2014 in the upstream watershed of the Miyun Reservoir. Participatory rural appraisal and multistage stratified cluster sampling were used in the investigation. The survey participants were distributed across five counties, different distances away from Beijing city. In each county, we selected 1–2 townships that represented the average standard of living of the county; in each township, we selected one village that represented the average standard of living of the township. Ultimately, we selected six villages among the five counties as our survey samples. To capture spatial and jurisdictional differences, two villages were selected within Miyun County in Beijing. House to house surveys were conducted in these six villages, according to the total number of households in each village. We worked with a large team of 8–10 people, spent two to three days and surveyed between 101 and 147 households per village (accounting for approximately 35% of the total number of households in each village), attempting to survey all households available. We carried out in-depth interviews with household members using semi-structured questionnaires. In total, 756 valid questionnaires were obtained. The questionnaire survey mainly focused on sociodemographic information of household members and their livelihood activities, agriculture investments and outputs, household incomes and expenditures, and energy consumption. We predominantly selected household heads as interviewees, as they were usually the household decision makers and knew the key information about the family. We also verified summaries of our data with village leaders to ensure reliability and accuracy of data.

3.3. Data Analyses

Against the backdrop of large-scale urbanization and rapid economic growth, traditional farming is no longer the only way rural residents can make a living; they are often faced with diverse and abundant livelihood activities from which they may choose. To investigate livelihood strategies and determinants, we conducted three stages of analysis.
First, given the key role of the source of household income and labor force allocation in understanding its livelihood strategy, we used factor analysis to reduce the number of dimensions though which these factors are used to explain household livelihood strategies. According to whether the eigenvalues are greater than 1, we extracted three comprehensive factor dimensions from seven variables that describe the source of livelihoods, which explained 62.06% of the variability in rural household livelihood strategies. The variables we included in the cluster analysis were:
(1)
Total income: the sum of incomes that all family members earned, including wage income, operational income, property income, and transfer income;
(2)
Agricultural income: the income that farmers obtained by farming, operating orchards, and breeding livestock;
(3)
Tourism income: the income that family members obtained from other service industries such as tourism, hospitality, and entertainment;
(4)
Agri-business income: income generated by family members engaged in the processing of agricultural products (e.g., rice milling, oil pressing, and medicinal materials processing), agricultural services (e.g., irrigation and grain reaping), commerce, and repair services;
(5)
Other local non-farm income: income generated by family members engaged in transportation, construction projects, and other industrial or manual labor as well as education, health, and government departments;
(6)
Remittance income: income sent home by migrant workers;
(7)
Moving out for work: whether family members had moved out for work or not.
Next, we used k-means cluster analysis to classify all samples and define clusters of household livelihood strategy types. Considering the livelihood activities in the study area, we identified livelihood strategies by clustering households based on the share of household income generated by different livelihood activities and household members’ migration for work.
Third, after determining livelihood strategy groups, we used a multinomial logistic model to analyze determinants of livelihoods strategies. The model simulated the farmers’ livelihood strategy choice based on the strategy that maximized their own effectiveness, i.e., that ensured the maximum benefit to households. The probability calculation of farmers to choose a specific livelihood strategy was:
Prob ( Y i = j ) = e x i j B i j 1 + k = 0 m e x i j B i j = F j ( X i , B )
j = 0 , 1 , 2 , , m ;   i = 1 , 2 , 3 , , N   and   B 0 = 0
where, Prob ( Y i = j ) represents the probability of household i choosing livelihood strategy j out of m strategies, x i j represents the factors that influence household livelihood strategy selection, B i j represents the corresponding parameters of the model to be estimated. The model selected nine independent variables that reflect five general aspects that influence household livelihood strategies: geographical location, natural capital, household structure, labor quality, and ecological policy [15]. The independent variables were land area, household size, skills training, skill, the average age of household laborers, the average education level of laborers, amount paid from the ecological compensation funds, the distance from Beijing city, and the distance from the local county capital city. As can be seen, these factors are not just measures of income, but also relate to the local social, institutional, and ecological contexts in which household livelihood decisions are embedded.
Rural households’ livelihood behavior can ultimately influence the quality of the rural environment through the utilization of natural resources. Finally, in order to compare differences in the extent of natural resource utilization between different households, we selected the following independent variables to measure the households’ land resource utilization and energy utilization: crop yield per mu (1 mu = 1/15 ha), expenditure on fertilizers and pesticides, and consumption of firewood, coal, liquefied petroleum gas, and electricity. Statistically significant differences were analyzed using one-way ANOVA with the software stata13.

4. Results

4.1. Household Livelihood Strategy Classification

Factor 1 was significantly positively correlated with total income and choices of outmigration for work. Factor 2 was significantly positively correlated with tourism revenues, while factor 3 was significantly positively correlated with agriculture revenues (Table 1). Household livelihood strategies, therefore, can be divided into three patterns: farming, local off-farm, and labor-migrant. Among the 756 peasant households, the three patterns account for 56.7%, 13.1%, and 30.2% of the total, respectively.
The three types of household incomes present obviously different characteristics (Table 2). Agricultural income in farming households was significantly higher than that of the other two types, accounting for 51.19% of the total income. In addition, the local non-farming incomes of local off-farm households was significantly higher than that of the other two types of households, accounting for 55.87% of the total income. The remittances of labor-migrant households were significantly higher than the other two types of households, accounting for 51.16% of the total income.

4.2. Livelihood Capital of Different Livelihood Strategies

Households following different types of livelihood strategies had significantly different characteristics in livelihood capitals. Compared with households mainly engaged in farming, off-farm households had significantly lower natural capitals and significantly higher education levels of household laborers as well as physical capitals, social capitals, and financial capitals. Labor-migrant households had significantly lower natural capital and average age of household laborers, and significantly higher household sizes (Table 3). In comparison to local off-farm households, labor-migrant households had significantly lower education levels, as well as lower physical, social, and financial capitals.

4.3. Factors that Influence Livelihood Strategy Choices

Geographical location, natural capital, household structure, quality of labor force, and ecological policy were the main factors affecting farmers’ choices of livelihood strategies. Households that followed a farming livelihood strategy had significantly higher natural capitals than that of other farmers (Table 3). Owing to a greater demand for agricultural labor force, they are more likely to choose farming as their main livelihood strategy.
Table 4 shows factors that are associated with different livelihood strategies compared against predominantly farming strategies. Compared with farming households, shorter distances from the city, less natural capital, higher quality of household laborers, and higher ecological compensation funds were the main factors that promoted farmers to choose local off-farm livelihood strategies. Less natural capital and larger family size are the major contributors to making farmers migrate out for work (Table 4) relative to farming strategies. In addition, we found that the closer farmers lived to Beijing or their local county seat, the higher the rate of off-farm employment. A major reason for this is a reduction in transportation costs that have come with urbanization, which has enhanced local tourism and business, and proximity to the city market access leads to greater off-farm employment opportunities [31].

4.4. Livelihood Consequences of Different Livelihood Strategies

Livelihood strategies differ for different groups of households based on the contextual conditions outlined above, and households following different livelihood strategies may have different livelihood consequences. There are significant differences between farming households and the other two household groups in economic incomes, with local off-farm and labor-migrant households in general having higher income per capita than farming households. Thus, non-agricultural work appears to improve well-being for households. Farming and labor-migrant households have a higher intensity land utilization than local off-farm households, which reflected in crop yield and expense of fertilizer and pesticides. In terms of energy consumption, farming households use significantly higher levels of firewood than local off-farm households, and there is no difference with labor-migrant households. In addition, compared with farming and labor-migrant households, local off-farm households have significantly lower fertilizer and pesticide expenses, and significantly higher consumption of total energy, made up of fossil energy and electricity (Table 5).

5. Discussion

Against the backdrop of rural-urban transformation in China, great changes have taken place in the rural human-environment relationships, and the choices of household livelihood strategies have become more diversified [32,33,34]. In this article, local households can be grouped into three types that pursue similar livelihood strategies, specifically, farming, local off-farm, and labor-migrant. Although the households chose local off-farm strategies relatively less often, their livelihood level, impact factors, and livelihood consequences are significantly different from those of the other two types of households. Households following different livelihood strategies hold widely different asset endowments. In our research, the choice of household livelihood strategy was strongly related to geographical location (such as the distance from the nearest market), natural capital, household structure, and ecological policies. It is helpful for managers and policy makers to develop appropriate policies and programs according to different types of livelihood strategies and characteristics. Appropriate management can promote the improvement of peasant household welfare and facilitate more sustainable development in these areas.
Households that engaged in the local non-farm livelihood strategies were able to earn higher incomes. Previous research on rural poverty reduction has also shown that alternative livelihoods have important implications for alleviating poverty as well as furthering conservation objectives in rural areas [7,35]. However, farming households tend to fail to engage in other livelihood activities, particularly in non-farm/commercial strategies, due to limitations of labor quality (education level, skills), financial capital, geographical location, and other factors. Decision-makers should increase non-agriculture employment skills training and provide vocational guidance to those in the agricultural labor force who would like to get non-agricultural employment or work in town. Meanwhile, we also found that high ecological compensation has a direct positive effect on the choice of local off-farm livelihood strategies, and, therefore, decision-makers should provide more eco-compensation to farmers, especially those in poor and remote areas, for improving household financial capital. In addition, many studies have shown that non-farm activities are relatively rare in remote rural areas due to poor transport infrastructure and a shortage of skills [7,11]. We also found that nearer to the urban centers and towns, there were greater off-farm employment opportunities. Thus, improving road infrastructure and transport services may help stimulate a part of the agricultural labor force to transfer to the non-agricultural sector, which may also help in alleviating poverty and increasing resilience [24,25].
Different livelihood strategies not only affect the welfare level of households, but non-farm employment and rural-to-urban labor migration can more generally lead to lower dependency on agriculture and local natural resources.
First, our study found that the farming households were more likely to rely on firewood for cooking and heating, as has been found in earlier work in the same region [36]. This can cause substantial, long-term impacts on the local environment, such as deforestation and soil erosion [37,38,39]. However, local off-farm households were found to have significantly higher total consumption of commercial energy amongst the three household types identified in our study. Commercial energy such as electricity and liquefied gas are available in rural areas and can substitute firewood use, however, due to the low incomes in these areas, especially for farming households, there remains a reluctance to buy commercial energy, and many rural residents still spend time in firewood collection. These findings indicate that the decision-makers need to attach importance to energy structure change for ecological restoration in the countryside. Policies that facilitate the development of alternative energy use, such as providing a discount for commercial energy, particularly for farming households, could substantially reduce the consumption of firewood.
Second, some evidence has shown that farming households tend to increase crop yields through heavy input of pesticides and fertilizers [40]. This mode of modern agriculture also brings with it a series of adverse environmental impacts [41]. Ecological agriculture programs and conservation-oriented training programs, concentrating on basic scientific and technological research, should be provided free to farmers who participate in ecological agriculture.
Third, we found that local off-farm households have the lowest land use efficiency and a large amount of agricultural land around them is abandoned. Because this abandonment of arable land results from changes in livelihood activities, the government should make vigorous efforts to restructure the management of natural resources to achieve the goal of rural development and ecological protection. For example, giving subsidies to farmers to convert abandoned cultivated land into economic forests, providing incentives to increase the scale of agricultural operations, and encouraging agricultural land transfers, among other policies, should be implemented [42,43].
Finally, non-farm employment and labor migration increase dependency on the general economy and job market. Meanwhile, the farm is still managed by a portion of the household and can act as a “backup” household livelihood strategy, which helps increase overall household resilience.
Our study focuses only on the Miyun Reservoir watershed, and does not include the outside overflow of environmental impacts of migration [44]. For example, migrant workers move out from rural areas for employment, which can reduce the population carrying capacity on the local ecological environment and provide the most basic conditions for ecological restoration. However, on a regional scale, whether this shift of part of the labor force from rural to urban areas increases the pressure on urban environments is unknown. Therefore, we still need more information regarding the large-scale effects caused by changes in household livelihood strategies; carrying out comprehensive assessments and considering sustainable development goals from multiple dimensions will be necessary in the future.
In conclusion, we identified livelihood strategies by clustering households based on the share of household income generated by different livelihood activities and the ability of household members to migrate for work. The variables we include in the cluster analysis are total income, agricultural income, tourism income, agri-business income, other local non-farm income, remittance income, and moving out for work. Then we provide tailored policy and management options to promote sustainable livelihoods based on our findings. Our study could be of great value and serve as a reference for further analyses of rural household livelihood characteristics, as well as provide a basis for managing the sustainable utilization of natural resources and poverty reduction at the watershed scale.

Acknowledgments

We thank the National Natural Science Foundation of China (41371538, 71673219), National Key Research and Development Program of China (No. 2016YFC0503401), and the Canadian Social Science and Humanities Research Council (No. 430-2014-00861) for support.

Author Contributions

Hua Zheng and Brian E. Robinson conceived and designed this study, Wenjia Peng, Hua Zheng, Brian E. Robinson, Fengchun Wang and Cong Li participated in the field survey; Wenjia Peng analyzed the data and wrote the manuscript, Hua Zheng, Brian E. Robinson and Cong Li revised the manuscript. All authors read and approved the manuscript.

Conflicts of Interest

The authors declare no conflict of interest.

Appendix A. Explanatory Variable Definition

Table A1. The definition of explanatory variable in this paper.
Explanatory VariablesUnitDefinition
Natural capital
Land area per capitamuAverage land area (in mu) per capita in each household
Land areamuTotal land area of each household l
Human capital
Household sizecapitaNumber of household members
Number of household laborerscapitaNumber of household laborers
Average education level of household laborersDummy variableIlliteracy = 1; Primary school = 2; Junior high school = 3; Senior high school = 4; Technical secondary school = 5; Bachelor degree or above = 6
Average age of household laborersyearAverage age of household laborers
TrainingDummy variableReceiving job training = 1
SkillDummy variableMastering some skill = 1
Physical capital
House value yuanMarket value of the house
Quantity of household durable-Total number of household durables, including mobile phone, air condition, refrigerator, television, tractor, bicycle, motorcycle, car, electric cooker, washing machine, etc.
Social capital
Social relationcapitaNumber of cadres in household members
Communication costyuan/yearCommunication cost in each household
Expense of cash and giftsyuan/yearTotal cash and gifts in each household
Financial capital
SavingDummy variableHave savings = 1
LoanDummy variableBorrowing money from friends and relatives or bank = 1
Ecological compensation fundsyuan/yearEcological compensation funds from government per year per household
Others
Income per capitayuan/yearAverage income per capita last year
Crop yield per mukg/mu/yearAverage crop yield per mu last year
Expense of fertilizeryuan/yearFertilizer expense per household last year
Expense of pesticideyuan/yearPesticide expense per household last year
Consumption of firewoodkg/yearFirewood consumption of per household last year
Consumption of coalkg/yearCoal consumption per household last year
Consumption of LPGkg/yearLPG (liquefied petroleum gas) consumption per household last year
Consumption of electricitykwh/yearElectricity Consumption per household last year
Total energy consumptiontceTotal energy consumption per household last year
Distance from Beijing citykmDistance from the Beijing city
Distance from local county capital citykmDistance from local county capital city

References

  1. Scoones, I. Livelihoods perspectives and rural development. J. Peasant Stud. 2009, 36, 171–196. [Google Scholar] [CrossRef]
  2. Li, B.; Li, X.Y.; Zuo, T. Research and Practice on Means of Livelihood in Rural Development. J. Agrotech. Econ. 2004, 4, 10–15. (In Chinese) [Google Scholar]
  3. Qin, H.; Flint, C.G. Integrating Rural Livelihoods and Community Interaction into Migration and Environment Research: A Conceptual Framework of Rural Out-Migration and the Environment in Developing Countries. Soc. Nat. Resour. 2012, 25, 1056–1065. [Google Scholar] [CrossRef]
  4. Salafsky, N.; Wollenberg, E. Linking livelihoods and conservation: A conceptual framework and scale for assessing the integration of human needs and biodiversity. World Dev. 2000, 28, 1421–1438. [Google Scholar] [CrossRef]
  5. Ellis, F. Household strategies and rural livelihood diversification. J. Dev. Stud. 1998, 35, 1–38. [Google Scholar] [CrossRef]
  6. Wang, C.; Yang, Y.; Zhang, Y. Rural household livelihood change, fuelwood substitution, and hilly ecosystem restoration: Evidence from China. Renew. Sustain. Energy Rev. 2012, 16, 2475–2482. [Google Scholar] [CrossRef]
  7. Alemu, Z.G. Livelihood strategies in rural South Africa: Implications for poverty reduction. In Proceedings of the 2012 Conference on International Association of Agricultural Economists, Foz do Iguacu, Brazil, 18–24 August 2012.
  8. Ellis, F.; Mdoe, N. Livelihoods and rural poverty reduction in Tanzania. World Dev. 2003, 31, 1367–1384. [Google Scholar] [CrossRef]
  9. Soltani, A.; Angelsen, A.; Eid, T.; Naieni, M.S.N.; Shamekhi, T. Poverty, sustainability, and household livelihood strategies in Zagros, Iran. Ecol. Econ. 2012, 79, 60–70. [Google Scholar] [CrossRef]
  10. Brown, D.R.; Stephens, E.C.; Ouma, J.O.; Murithi, F.M.; Barrett, C.B. Livelihood Strategies in the Rural Kenyan Highlands; Cornell University: Ithaca, NY, USA, 2006. [Google Scholar]
  11. Jansen, H.G.; Pender, J.; Damon, A.; Wielemaker, W.; Schipper, R. Policies for sustainable development in the hillside areas of Honduras: A quantitative livelihoods approach. Agric. Econ. 2006, 34, 141–153. [Google Scholar] [CrossRef]
  12. Leo, D.H.; Annelies, Z. Exploring the frontier of livelihood research. Dev. Chang. 2005, 36, 27–47. [Google Scholar]
  13. Bebbington, A. Capitals and capabilities: A framework for analyzing peasant viability, rural livelihoods and poverty. World Dev. 1999, 27, 2021–2044. [Google Scholar] [CrossRef]
  14. Bury, J. Livelihoods in transition: Transnational gold mining operations and local change in Cajamarca, Peru. Geogr. J. 2004, 170, 78–91. [Google Scholar] [CrossRef]
  15. Scoones, I. Sustainable Rural Livelihoods: A Framework for Analysis; IDS: Brighton, UK, 1998. [Google Scholar]
  16. Leach, M.; Mearns, R.; Scoones, I. Environmental entitlements: Dynamics and institutions in community-based natural resource management. World Dev. 1999, 27, 225–247. [Google Scholar] [CrossRef]
  17. Ribot, J.C.; Peluso, N.L. A theory of access. Rural Sociol. 2003, 68, 153–181. [Google Scholar] [CrossRef]
  18. Schoenberger, L.; Turner, S. Negotiating Remote Borderland Access: Small-Scale Trade on the Vietnam–China Border. Dev. Chang. 2008, 39, 667–696. [Google Scholar] [CrossRef]
  19. Ellis, F. The determinants of rural livelihood diversification in developing countries. J. Agric. Econ. 2000, 51, 289–302. [Google Scholar] [CrossRef]
  20. Binder, C.R.; Hinkel, J.; Bots, P.W.G.; Pahl-Wostl, C. Comparison of Frameworks for Analyzing Social-ecological Systems. Ecol. Soc. 2013, 18, 26. [Google Scholar] [CrossRef]
  21. Department for International Development. Sustainable Livelihoods Guidance Sheets; Department for International Development: London, UK, 2000. [Google Scholar]
  22. Little, P.D.; Smith, K.; Cellarius, B.A.; Coppock, D.L.; Barrett, C. Avoiding Disaster: Diversification and Risk Management among East African Herders. Dev. Chang. 2001, 32, 401–433. [Google Scholar] [CrossRef]
  23. Reardon, T.; Berdegué, J.; Escobar, G. Rural Nonfarm Employment and Incomes in Latin America: Overview and Policy Implications. World Dev. 2001, 29, 395–409. [Google Scholar] [CrossRef]
  24. Huber, F.K.; Morlok, M.; Weckerle, C.S.; Seeland, K. Livelihood strategies in Shaxi, Southwest China: Conceptualizing mountain-valley interactions as a human-environment system. Sustainability 2015, 3204–3229. [Google Scholar] [CrossRef]
  25. Démurger, S.; Fournier, M.; Yang, W. Rural households’ decisions towards income diversification: Evidence from a township in northern China. China Econ. Rev. 2010, 21 (Suppl. S1), S32–S44. [Google Scholar] [CrossRef]
  26. Renwei, H.E.; Liu, S.; Chen, G.; Xie, F.; Yang, X.; Liang, L. Research progress and tendency of sustainable livelihoods for peasant household in China. Prog. Geogr. 2013, 32, 657–670. [Google Scholar]
  27. Liu, J.; Ouyang, Z.; Yang, W.; Xu, W.; Li, S. Evaluation of Ecosystem Service Policies from Biophysical and Social Perspectives: The Case of China. In Encyclopedia of Biodiversity, 2nd. ed.; Academic Press: Waltham, MA, USA, 2013; pp. 372–384. [Google Scholar]
  28. Uchida, E.; Rozelle, S.; Xu, J. Conservation payments, liquidity constraints and off-farm labor: Impact of the Grain for Green program on rural households in China. In An Integrated Assessment of China’s Ecological Restoration Programs; Springer: Berlin, Germany, 2009; pp. 131–157. [Google Scholar]
  29. Zhen, N.; Fu, B.; Lü, Y.; Zheng, Z. Changes of livelihood due to land use shifts: A case study of Yanchang County in the Loess Plateau of China. Land Use Policy 2014, 40, 28–35. [Google Scholar] [CrossRef]
  30. Zheng, H.; Robinson, B.E.; Liang, Y.-C.; Polasky, S.; Ma, D.-C.; Wang, F.-C.; Ruckelshaus, M.; Ouyang, Z.-Y.; Daily, G.C. Benefits, costs, and livelihood implications of a regional payment for ecosystem service program. Proc. Natl. Acad. Sci. USA 2013, 110, 16681–16686. [Google Scholar] [CrossRef] [PubMed]
  31. Pachauri, S.; Spreng, D. Towards an Integrative Framework for Energy Transitions of Households in Developing Countries; Springer: Dordrecht, The Netherlands, 2012; pp. 73–96. [Google Scholar]
  32. Huang, J. The effect of off-farm employment on the decisions of households to rent out and rent in cultivated land in China. China Agric. Econ. Rev. 2012, 4, 5–17. [Google Scholar] [CrossRef]
  33. Huber, F.K.; Yang, Y.; Weckerle, C.S.; Seeland, K. Diversification of Livelihoods in a Society in Transition: A Case Study of Tibetan Communities in Southwest China. Soc. Nat. Resour. 2014, 27, 706–723. [Google Scholar] [CrossRef]
  34. Zhang, F.F.; Zhao, X.Y. A review of ecological effect of peasant’s livelihood transformation in China. Acta Ecol. Sin. 2015, 35, 3157–3164. (In Chinese) [Google Scholar] [CrossRef]
  35. Wang, C.; Yang, Y. Review of research on mountains ecological restoration based on farmer household livelihood evolution. J. Nat. Resour. 2011, 26, 344–352. (In Chinese) [Google Scholar]
  36. Démurger, S.; Fournier, M. Poverty and firewood consumption: A case study of rural households in northern China. China Econ. Rev. 2011, 22, 512–523. [Google Scholar] [CrossRef] [Green Version]
  37. Chen, X.; Frank, K.A.; Dietz, T.; Liu, J. Weak Ties, Labor Migration, and Environmental Impacts: Toward a Sociology of Sustainability. Organ. Environ. 2012, 25, 3–24. [Google Scholar] [CrossRef]
  38. Liu, G.; Lucas, M.; Shen, L. Rural household energy consumption and its impacts on eco-environment in Tibet: Taking Taktse county as an example. Renew. Sustain. Energy Rev. 2008, 12, 1890–1908. [Google Scholar] [CrossRef]
  39. Feng, W.L.; Li, S.Z.; Li, C. Overview and Frame Work for Ecosystem Services and Human Well-being. Resour. Sci. 2013, 35, 1482–1489. (In Chinese) [Google Scholar]
  40. Mclaughlin, D.; Kinzelbach, W. Food security and sustainable resource management. Water Resour. Res. 2015, 51, 4966–4985. [Google Scholar] [CrossRef]
  41. Li, W.H.; Liu, M.C.; Min, Q.W. China’s Ecological Agriculture: Progress and Perspectives. J. Resour. Ecol. 2010, 6, 1015–1021. (In Chinese) [Google Scholar]
  42. Ding, C. Land policy reform in China: Assessment and prospects. Land Use Policy 2003, 20, 109–120. [Google Scholar] [CrossRef]
  43. Lichtenberg, E.; Ding, C. Chapter 5: Assessing Farmland Protection Policy in China. Urban. China Crit. Issues Era Rapid Growth 2007, 25, 59–68. [Google Scholar]
  44. Liu, J.; Hull, V.; Luo, J.; Yang, W.; Liu, W.; Viña, A.; Vogt, C.; Xu, Z.; Yang, H.; Zhang, J. Multiple telecouplings and their complex interrelationships. Ecol. Soc. 2015, 20, 44. [Google Scholar] [CrossRef]
Figure 1. Conceptual framework of household livelihood strategies and livelihood outcomes.
Sustainability 09 00175 g001
Figure 2. Distribution of household survey samples and county boundaries of the study area in the Miyun Reservoir Watershed.
Sustainability 09 00175 g002
Table 1. Extracted factors of household livelihood and correlation with original variables.
VariablesFactor 1Factor 2Factor 3
Agricultural income0.12−0.100.90
Tourism income0.540.54−0.20
Agri-business income0.320.33−0.21
Other local non-farm income0.280.440.33
Remittance income0.61−0.57−0.04
Moving out for work migrating0.47−0.66−0.13
Total income0.920.170.06
Table 2. Income composition of different household livelihood strategies.
VariablesLivelihood Strategy
a. Farmingb. Local Off-Farmc. Labor-Migrant
(N = 429)(N = 99)(N = 228)
MeanSDMeanSDMeanSD
Farming income (%)51.19 b,c355.84 a236.72 a19
Tourism income (%)1.26 b836.65 a,c411.00 b6
Business income (%)0.6 b510.88 a,c281.44 b9
Other local non-farm income (%)18.03 b,c328.34 a195.52 a16
Remittance income (%)2.56 c91.44 c851.16 a,b35
Total incomes (Yuan RMB)14,585.43 b,c17,624.2446,628.87 a,c55,738.9036,116.53 a,b41,206.64
The superscript letters indicate categories that are significantly different at the 5% level to other livelihood type i.
Table 3. Descriptive statistics of livelihood capitals by livelihood strategy.
Livelihood Capital VariablesLivelihood StrategyAverage (N = 756)
a. Farmingb. Local Off-Farmc. Labor-Migrant
(N = 429)(N = 99)(N = 228)
MeanSDMeanSDMeanSDMeanSD
Natural capital
Land area per capita4.8 b,c10.61.90 a4.32.4 a3.83.78.5
Human capital
Household size3.1 c1.43.351.63.6 a1.43.31.4
Number of household laborers2.20.92.31.32.31.22.21.1
Average education level of household laborers2.4 b0.92.87 a,c1.12.5 b0.92.51.0
Average age of household laborers53.6 c10.952.613.650.5 a12.952.512.0
Physical capital
House value 11.0 b27.359.3 a,c109.611.1 b21.517.348.9
Quantity of household durable8.9 b4.512.7 a.c7.79.31 b4.29.55.1
Social capital
Social relation0.10.40.2 c1.50.1 b0.30.10.4
Communication cost81.6 b89.2189.0 a,c376.1102.2 b106.5101.9165.8
Expense of cash and gifts2549.1 b5812.14006.1 a5297.62838.54416.22827.25374.2
Financial capital
Saving0.2 b0.40.3 a,c0.50.2 b0.40.20.4
Loan0.10.30.10.30.10.40.10.3
Ecological compensation funds1774.9 b2816.03031.7 a,c5408.11408.3 b2336.41828.93190.3
The superscript letters indicate categories that are significantly different at the 5% level to other livelihood type i. The definitions of the variables are listed in the Appendix A.
Table 4. Determinants of different livelihood strategies.
Explanatory VariablesLocal Off-FarmLabor-Migrant
CoefficientSECoefficientSE
Geographical location
Distance from Beijing city−0.01461 ***0.003710.001690.00279
Distance from local county capital city−0.02454 ***0.00723−0.005340.00548
Natural capital
Land areas−0.03740 ***0.01032−0.03731 ***0.00879
Household structure
Household size0.153460.102090.18320 **0.06893
Average age of household laborers0.024630.01350−0.009730.00923
Human capital
Average education level of household laborers0.28902 *0.14607−0.033880.10838
Skill0.43586 **0.139940.171420.10683
Training0.431310.45926−0.621130.43857
Ecological policies
Ecological compensation funds0.00012 **0.00004−0.000010.00004
Intercept−1.214821.25675−0.396280.93396
Pseudo R2: McFadden = 0.184; Nagelkerke = 0.216; Cox and Snell = 0.107. Reference category is farming. ***, **, * Indicate statistical significance at the 1%, 5%, and 10% levels, respectively.
Table 5. Main livelihood consequences of different livelihood strategies.
VariableLivelihood StrategyAverage (N = 756)
a. Farmingb. Local Off-Farmc. Labor-Migrant
(N = 429)(N = 99)(N =228)
MeanSDMeanSDMeanSDMeanSD
Economic income
Income per capita4939.0 b,c 5598.215,029.8 a 18,664.511,647.2 a 16,181.48283.512,547.9
Land resource development and investment
Crop yield per mu 322.8 b 198.0133.9 a,c 184.5320.1 b 200.7297.3206.8
Expense of fertilizer963.9 b,c 2171.4139.9 a 276.4540.9 a,b 612.9728.41698.0
Expense of pesticide186.5 b,c 217.036.4 a,c 100.4112.8 a,b 148.5144.6193.6
Firewood consumption
Consumption of firewood2615.4 b 2061.42021.7 a 2031.12334.22466.42452.92194.7
Fossil energy consumption
Consumption of coal987.1 b 1130.81852.5 a,c 3568.241066.7 b 1066.51124.41673.6
Consumption of LPG38.6 b 47.5127.5 a,c 204.252.3 b 96.754.4101.7
Power consumption
Consumption of electricity1089.6 b 1031.93242.6 a,c 4231.61192.0 b 1187.21402.41965.9
Total energy consumption2398.6 b 1426.33083.8 a,c 3100.52329.7 b 1568.52467.51788.6
The superscript letters indicate categories that are significantly different at the 5% level to other livelihood type i. LPG stands for liquefied petroleum gas.

