Article

Decreasing Net Primary Productivity in Response to Urbanization in Liaoning Province, China

1
Jiangsu Provincial Key Laboratory of Geographic Information Science and Technology, Nanjing University, Nanjing 210023, China
2
Department of Geographic Information Science, Nanjing University, Nanjing 210093, China
3
Institute of Applied Ecology, Chinese Academy of Sciences, Shenyang 110016, China
4
Collaborative Innovation Center of South China Sea Studies, Nanjing University, Nanjing 210093, China
5
College of Territorial Resources and Tourism, Anhui Normal University, Wuhu 241000, China
*
Author to whom correspondence should be addressed.
Sustainability 2017, 9(2), 162; https://doi.org/10.3390/su9020162
Submission received: 5 December 2016 / Revised: 10 January 2017 / Accepted: 19 January 2017 / Published: 24 January 2017
(This article belongs to the Section Sustainable Urban and Rural Development)

Abstract

:
Regional ecosystems have been greatly affected by the rapid expansion of urban areas. In order to explore the impact of land use change on net primary productivity (NPP) in rapidly developing cities during the current urbanization process, we quantified land use change in Liaoning province between 2000 and 2010 using net primary productivity as an indicator of ecosystem productivity and health. The Carnegie–Ames–Stanford Approach model was used to estimate NPP by region and land use. We used a unit circle-based evaluation model to quantify local urbanization effects on NPP around eight representative cities. The dominant land use types were farmland, woodland and urban, with urban rapidly replacing farmland. Mean annual NPP and total NPP decreased faster from 2005 to 2010 than from 2000 to 2005, reflecting increasing urbanization rates. The eastern, primarily woodland part of Liaoning province had the greatest reduction in NPP, while the western part, which was primarily farmland and grassland, had the lowest reduction.

1. Introduction

Human activities have caused unsustainable changes on half of the earth’s land surface [1]. Land use change can have a large impact on ecosystems, altering their composition and structure [2], as well as their function, including matter and energy cycles [3,4,5]. In some areas, land that was once fertile and productive—forests, grasslands and farmland—is now predominantly urban [6,7]. The environmental problems caused by urbanization are gaining increasing attention [8,9,10], but are still poorly quantified.
Urbanization can directly lead to land use/cover change, loss of farmland and woodland resulting in vegetation loss. Urbanization is characterized by a loss of vegetation, which can be quantified using net primary productivity (NPP). NPP refers to the net accumulation of photosynthetic carbon by plants as a balance between gross primary productivity and ecosystem respiration. Thus, changes in NPP reflect the ecosystem carbon balance [11,12,13,14,15], and its response to global climate change and human activities [16,17,18].
Previous studies of the responses of NPP to land use change have focused mainly on the large-scale impacts of urbanization on NPP [19,20,21,22,23,24,25,26]. In a global assessment, urban expansion and associated land cover change drives habitat loss and results in the loss of terrestrial carbon stored in vegetation biomass, as confirmed by Imhoff [20]. Seto et al. [24] found that the increasing progress of urbanization and its associated land-cover change lead to species habitat fragmentation and biodiversity loss. Imhoff et al. [19] quantified the spatial distribution of urban areas across the United States using nighttime images from the Operational Linescan System as part of the Defense Meteorological Satellite Program (DMSP/OLS). The effects of urbanization on NPP were then estimated using normalized difference vegetation index (NDVI) data and the Carnegie–Ames–Stanford Approach (CASA) productivity model. For the southeastern United States, Milesi et al. [21] used moderate-resolution imaging spectroradiometer (MODIS) data, a land cover map, and nighttime light data (also derived from the DMSP/OLS) to estimate the extent of urbanization and its impact on NPP. At a smaller scale, Yu et al. [27] estimated the effects of urbanization on NPP in Shenzhen, China, consistent with the findings of Pei et al. [28] throughout China. In addition, Wu et al. [17] applied DMSP/OLS nighttime light imagery data to assess the relative contributions of climate change and urbanization to changes in NPP in the Yangtze River Delta, China, over the last decade. The majority of previous research has focused on the NPP of different land use types with little analysis of the impacts of land use conversion on NPP loss in the urbanization process. A number of papers have come out recently focused on quantitative assessment and influencing factors of the Human Appropriation of Net Primary Production (HANPP) [29,30,31,32].
Liaoning province is ideal for the study of LUCC impacts on NPP because it has experienced rapid economic growth and urbanization, resulting in significant land use change. However, little research has been conducted on the effect of different land use conversion scenarios on NPP in this area. In this study, we focused on the change in actually prevailing NPP in ecosystems over time due to land use change and climate variables in Liaoning province in 2000, 2005 and 2010 to determine trends in their relationship. In particular, we undertook a quantitative analysis in pixel scale throughout the overall balance of climate variation and land use change in causing the NPP change which little prior research investigated. This information can inform low-carbon and sustainable urban development strategies in Liaoning province.

2. Materials and Methods
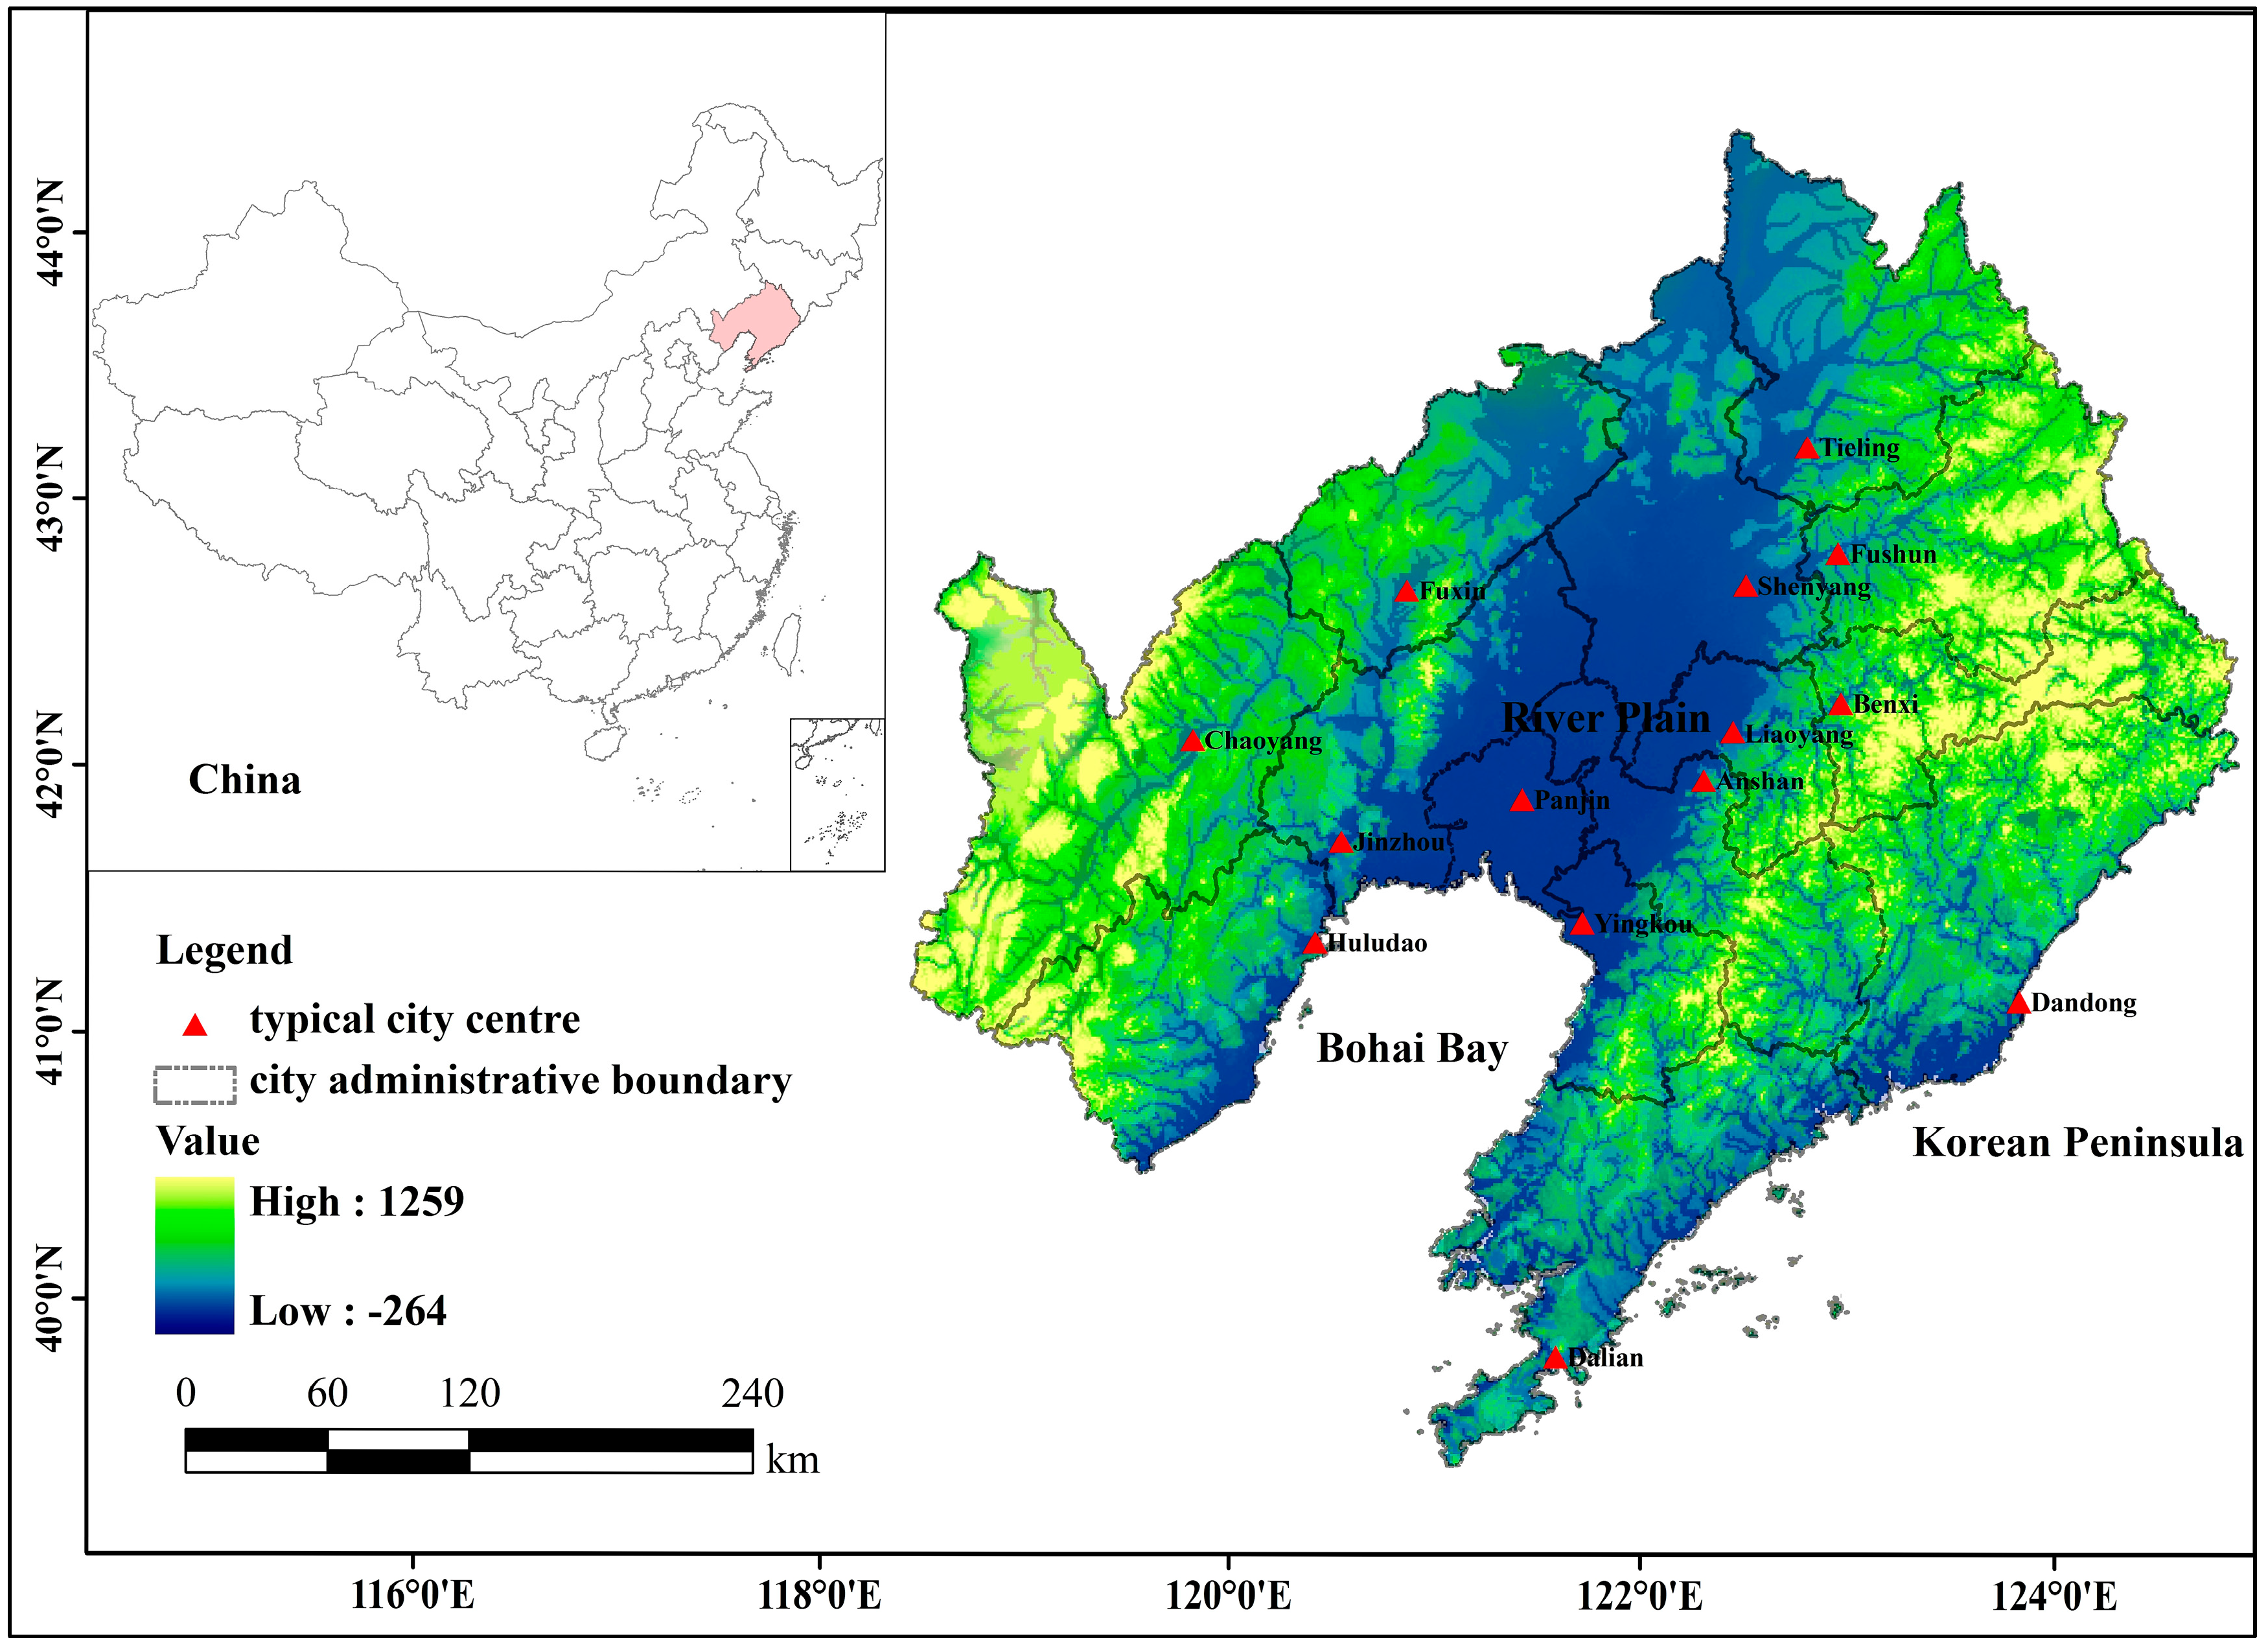
2.1. Study Area

Liaoning province is approximately 148,000 km2 and located in northeastern China (Figure 1). Most of the region has a continental monsoon climate, with high rainfall and temperature occurring together seasonally, and abundant sunshine throughout the year. The terrain generally slopes downward from north to south, with the vast Liaohe River Plain in the center (Figure 1). In recent years, this region has experienced high economic growth and rapid industrial development accompanied by accelerated urbanization under the guidance of local government and policies with a view to “revitalize the northeast old industrial base”. By the end of 2013, urbanization rates of 65% in Liaoning province are among the highest in China. This means that the proportion of urban population in Liaoning province to the total population is 65%.

2.2. Data Collection

Meteorological data from 27 measurement stations in Liaoning province for 2000–2010 were provided by the Chinese National Metrological Information Center and included mean monthly temperature, hours of sunshine, monthly solar radiation and evapotranspiration.
Land use maps for 2000, 2005 and 2010 at 1:100,000 scale were provided by the Data Center for Resources and Environment Sciences, Chinese Academy of Sciences. A series of Landsat images taken of Liaoning province during August 2000, August 2005 and August 2010 were used for visual confirmation because of differences in the spatial scale of national and provincial data. Land use types were classified according to the National Land Classification reference level one classification criteria. Six main land use types were identified: Woodland (WO); Grassland (GR); Wetlands (WE); Farmland (FR); Urban Area (UA); and Bare Land (BA) (Figure 2).
We derived NDVI for 2000, 2005 and 2010 at 250-m resolution from MODIS 16-Day Tiled products (MOD13Q1), which were obtained from NASA’s website (https://lads web.nascom.nasa.gov/data/).

2.3. Characterization of Land Use/Cover Change (LUCC)

Land use and cover change was measured by overlaying land use maps for the different time periods in ArcGIS (ESRI, Redlands, CA, USA). Changes in land use were quantified using transition matrices [33,34,35]. The transition matrices were calculated using pairs of land use maps from 2000 and 2005, 2005 and 2010, and 2000 and 2010. The converted area was calculated in matrices of each land cover type compared with other land use types.

2.4. Simulation of Net Primary Productivity (NPP) Using the Carnegie–Ames–Stanford (CASA) Model

The CASA model was developed to estimate NPP based on light use efficiency [36,37]. In it (Figure 3), NPP is calculated as the product of the amount of photosynthetic active radiation absorbed by green vegetation (APAR) and the light use efficiency (ε): N P P = A P A R ( t ) × ε ( t ) . The value for APAR was calculated from the incident photosynthetic active radiation (PAR) and fraction of incident light absorbed by the vegetation layer (fPAR) as A P A R = f P A R   ×   P A R .
Values for PAR were calculated from global solar radiation and sunshine hours, which were adjusted based on longitude and latitude at a pixel scale. Values for fPAR were calculated using MODIS-derived NDVI:
f P A R = ( S R S R m i n ) × ( f P A R m a x f P A R m i n ) S R m a x S R m i n + f P A R m i n
S R = N I R R E D = 1 + N D V I 1 N D V I
where fPARmin = 0.001, fPARmax = 0.95 (fPARmin and fPARmax are independent of vegetation type [36]), SRmax is the solar radiation (SR) value corresponding to 98% of NDVI values, SRmin is the SR value corresponding to 5% of NDVI values, and NIR and RED are the near-infrared band and red band reflectance, respectively.
Light efficiency was calculated as: ε ( t ) = ε * × T 1 ( t ) × T 2 ( t ) × W ( t ) , where ε* is the maximum energy conversion rate under ideal conditions, T1(t) and T2(t) [37] account for temperature stress, and W(t) accounts for moisture stress. Though the global ε* has been estimated at 0.389 g/MJ (calculated as carbon) by Potter et al. [36] and Field et al. [37], this value was not appropriate for vegetation in China. Because many domestic researches have demonstrated this parameter is not appropriate for the vegetation growth status in China [28,38,39]. In addition, Raymond considered the upper limit of ε* as 3.5 gC/MJ [40], and other studies indicated that the ε* of different vegetation types was 0.09–2.16 gC/MJ [40,41,42,43,44]. Therefore, these studies indicated that the values of ε* for different vegetation type and the same vegetation in different environmental conditions are not consistent. In this study, we directly applied the parameters used in the domestic researches [28,45]. Temperature factors were calculated based on the monthly mean temperature Tmon (°C) and the temperature when NDVI reaches its maximum in the whole year Topt (°C) as:
T 1 = 0.8 + 0.02 T o p t 0.0005 ( T o p t 20 ) 2
T 2 = 1.1814 1 + e x p { 0.2 ( T o p t 10 T m o n ) } × 1 1 + e x p { 0.3 ( T o p t 10 + T m o n ) }
The moisture stress factor W(t) was calculated from monthly-averaged evapotranspiration data:
W ( t ) = E E T ( t ) P E T ( t )
where EET is the estimated evapotranspiration (mm), which was derived from the soil moisture sub-model in CASA, and PET is the potential evapotranspiration (mm), which was calculated using the Thornthwaite method [46].

2.5. Analysis of the Impacts of Urbanization on NPP

We used a correlation analysis of the CASA model outputs to explore the relationship between changes in NPP and LUCC. A unit circle-based evaluation model [47] was used for comparing the scale of urbanization, the changes in NPP and the rate of urbanization in eight representative urban cities. We drew a 20-kilometer radius circle around each city which contains the central city area for each city then compared the spatial patterns of land use and the NPP calculated for the circle in 2000, 2005, and 2010. In order to quantify the climate-driven variability or urbanization in NPP, we performed correlation analyses between NPP and climate or urbanization variables at pixel scale. The Pearson’s coefficient (r) was calculated to show the strength of the NPP and climate relations. Then, a T-test was applied to evaluate whether significant or not and the p value < 0.01 was considered significant. The correlation of two variables (X,Y) was calculated as:
r = ( X i X ¯ ) ( Y i Y ¯ ) ( X i X ¯ ) 2 × ( Y i Y ¯ ) 2
where i indicates number in pixels, ranging from 1 to N. X ¯ and Y ¯ are the averages of X and Y.

3. Results

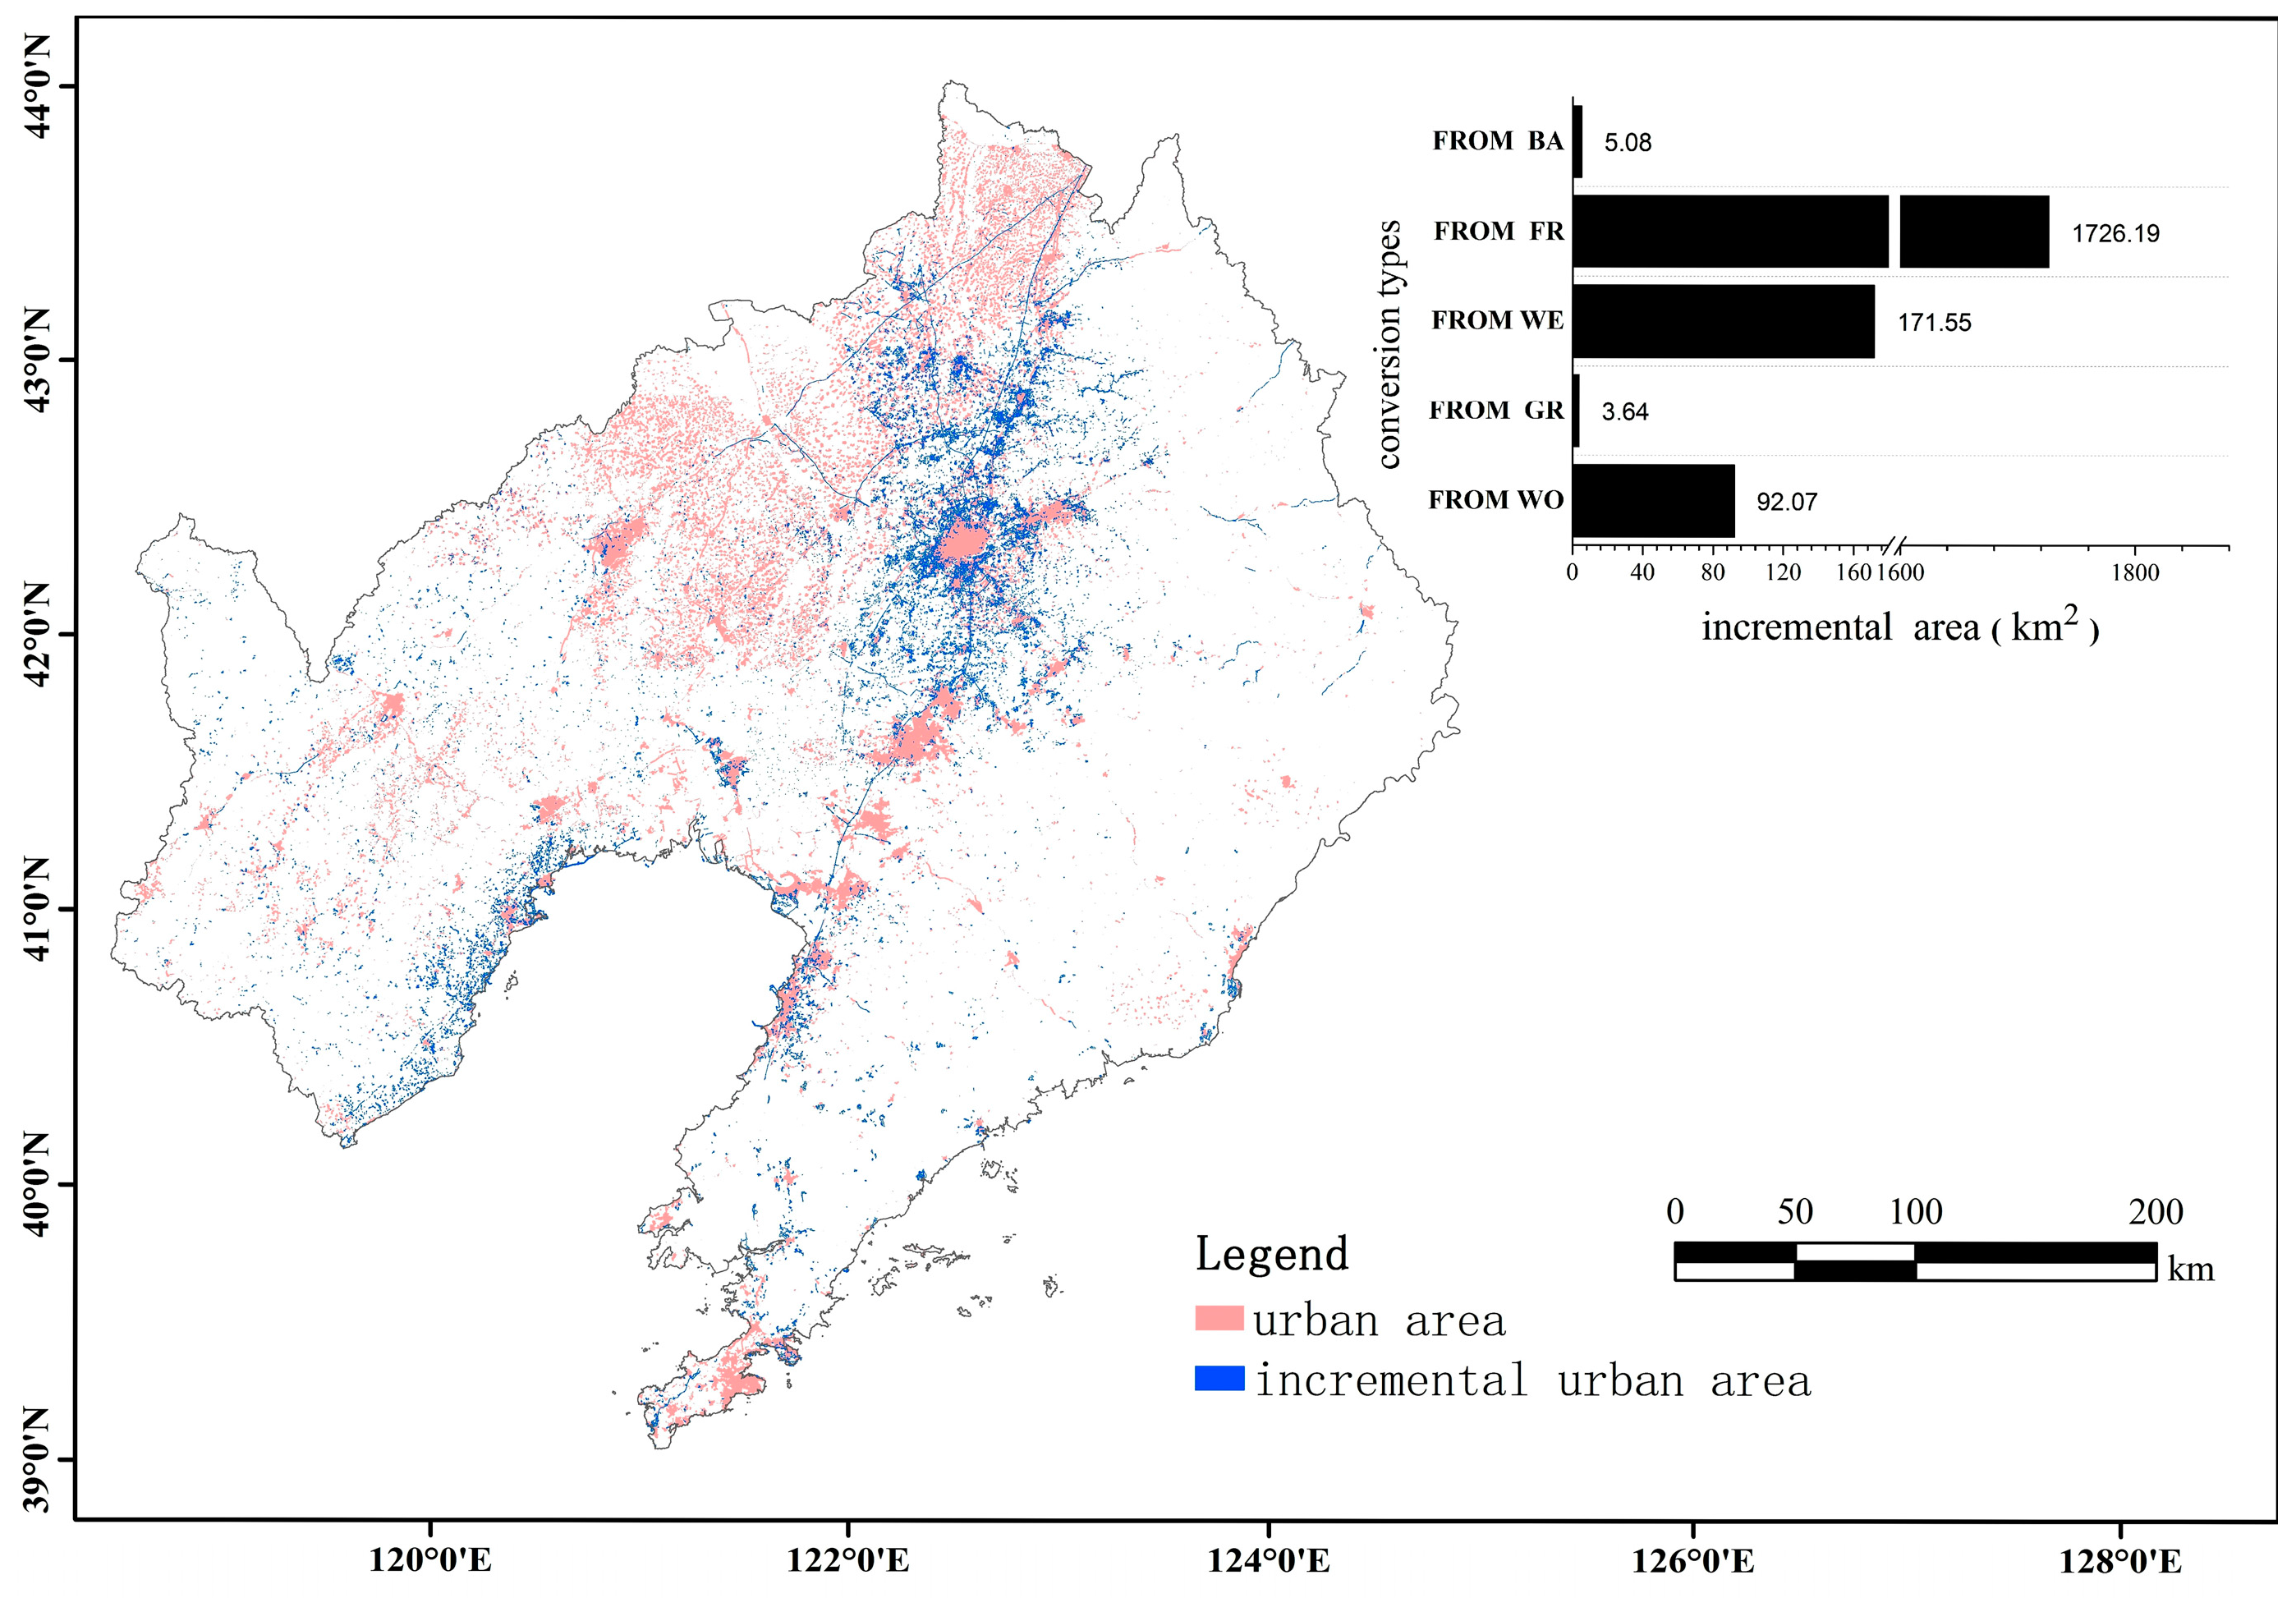
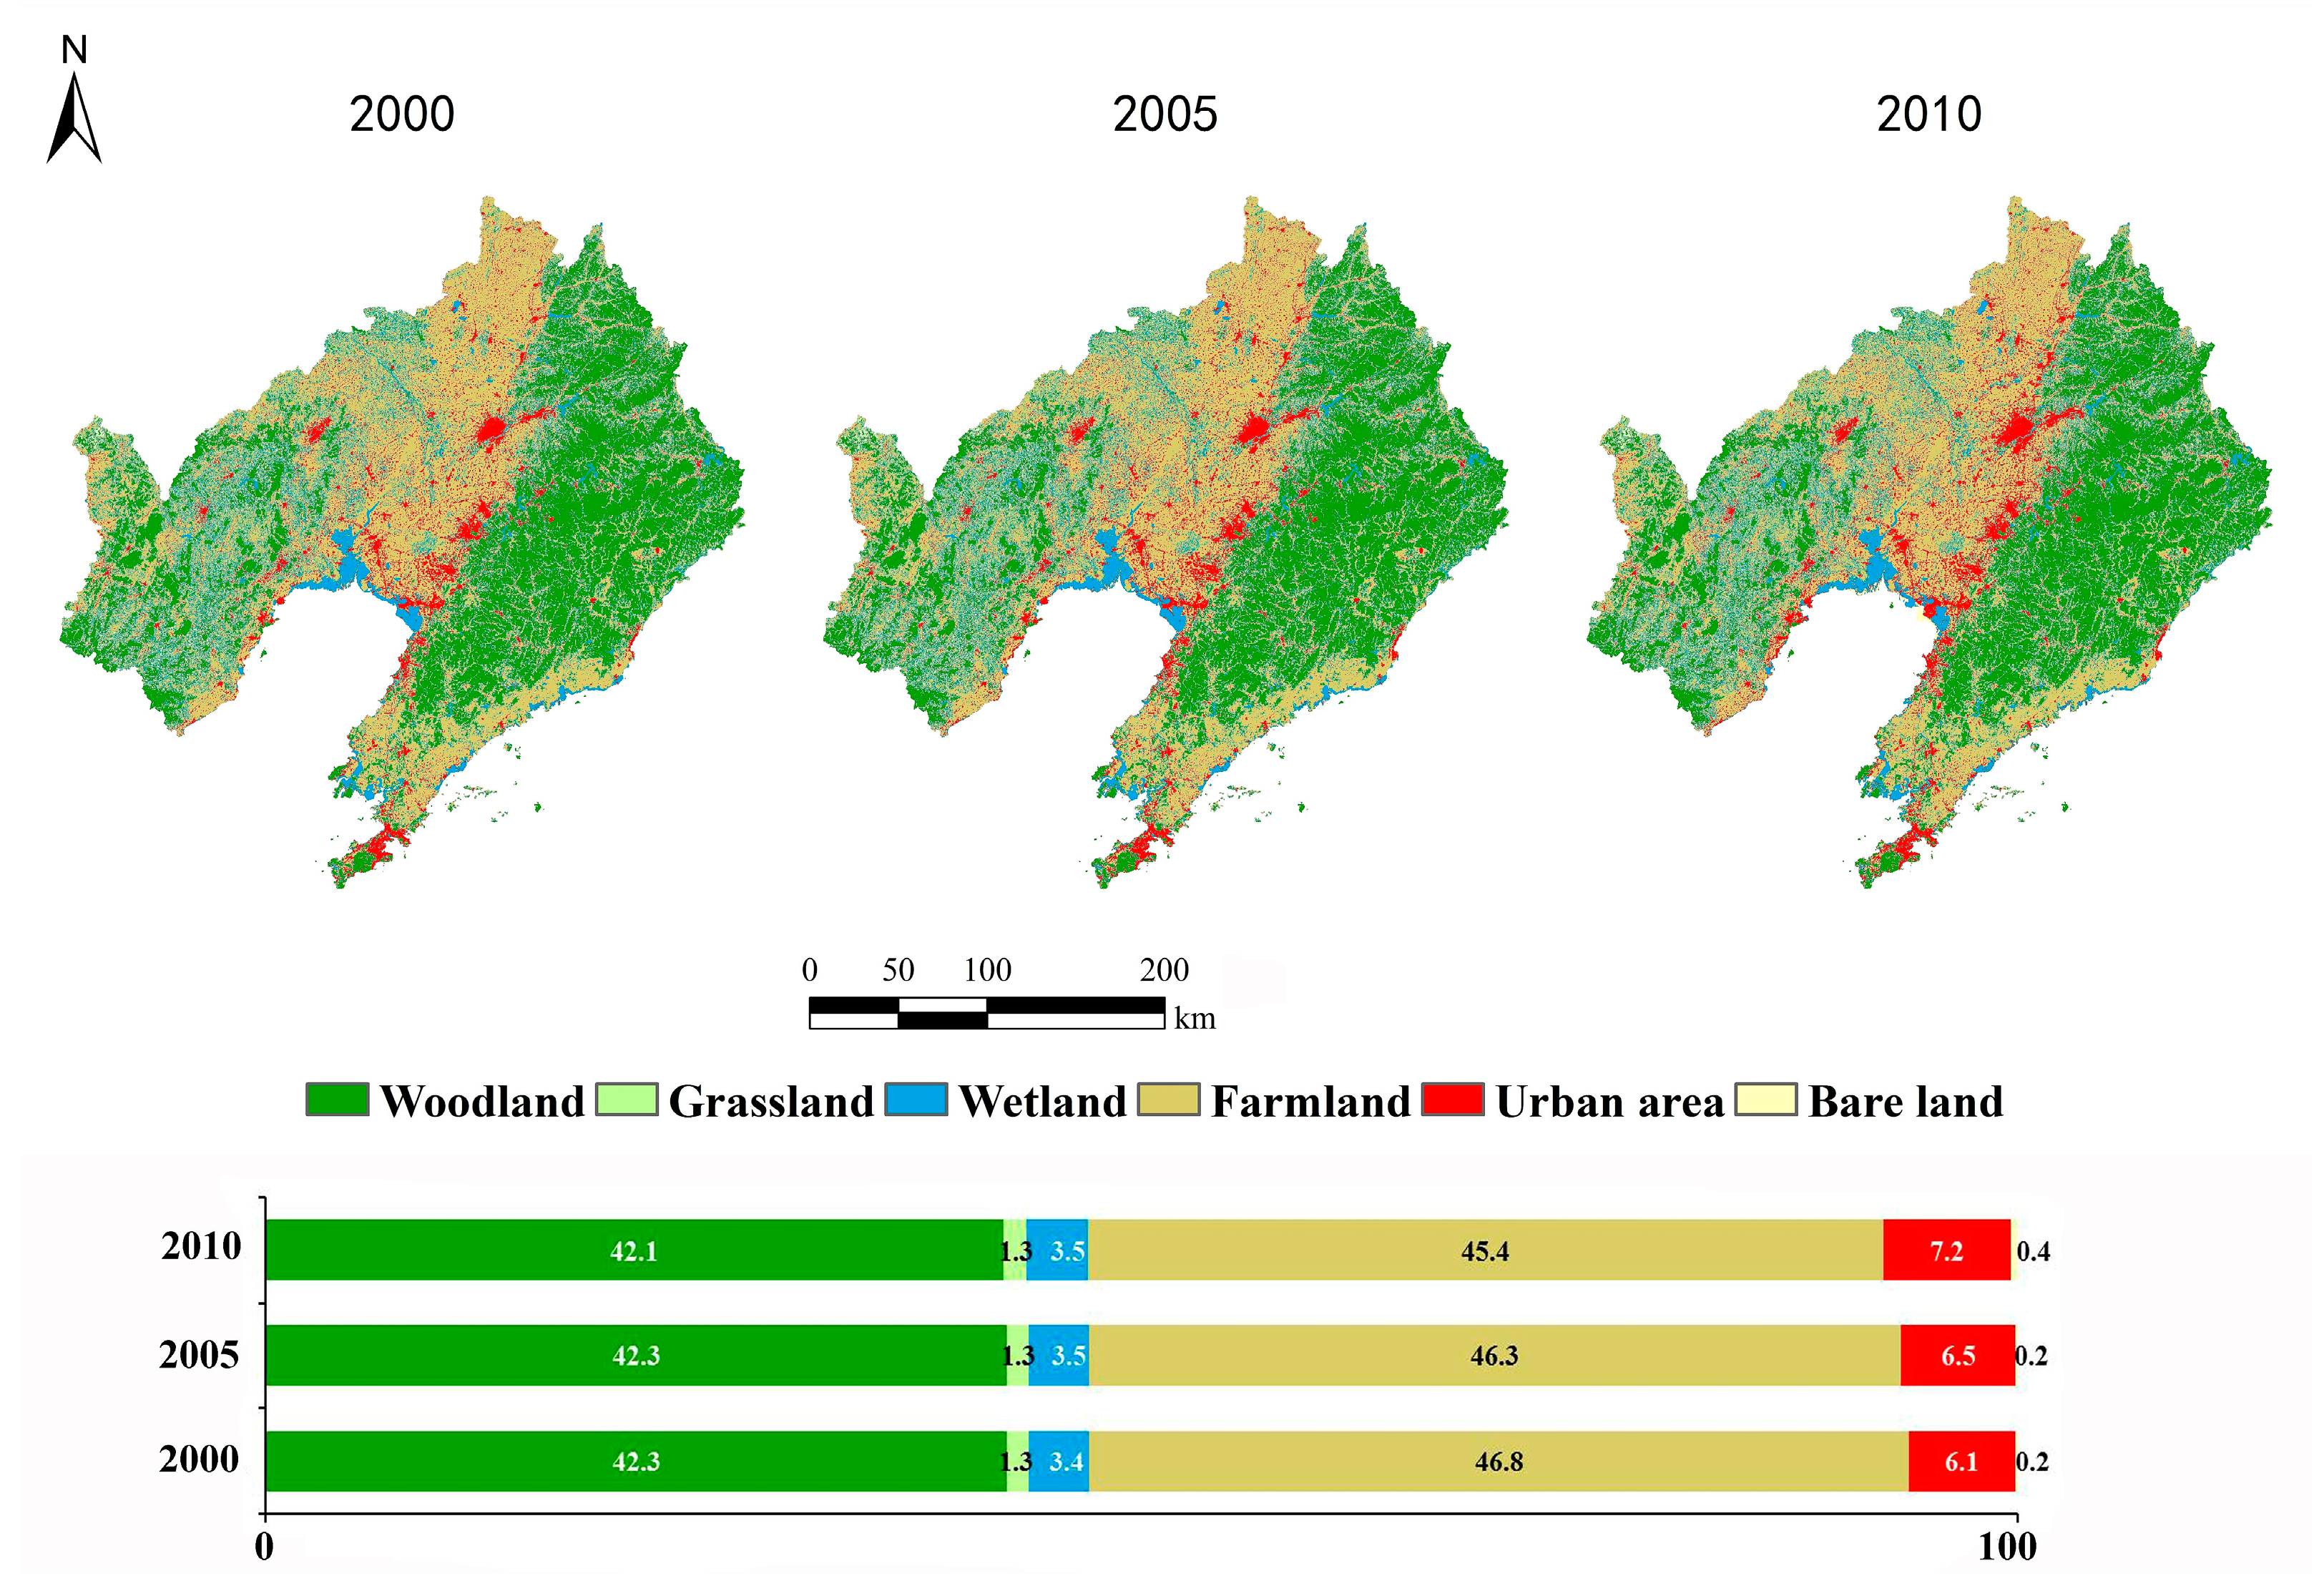
3.1. LUCC in Liaoning Province

Information on land use changes in Liaoning province from 2000 to 2010 was obtained through superimposed statistics using three land use maps from different periods. As shown in Figure 2, farmland, woodland and urban areas were the three main land use types in the research area, with farmland and urban areas having the most significant changes because the area of farmland was reduced and had mainly been transformed to urban areas. The change from farmland to woodland occurred as a result of China’s “Grain for Green” project that involved returning marginal farmlands to forests as part of a policy designed to improve environmental conditions. Total woodland, grassland and bare land areas have seen little change; however, wetland areas have declined as they are converted to farmland and urban areas.
From 2000 to 2005, the total transitional land area in Liaoning province was 2721 km2, 1.86% of the total area (Table 1). Changes in farmland were greatest, with 742 km2 being converted to urban, accounting for 49% of farmland change. The total transitional land area from 2005 to 2010 was smaller than 2000–2005 at 1817 km2, 1.24% of the total area (Table 1). As before, farmland conversion to urban was the greatest change, with 1002 km2 (76% of the changes in farmland) changed to urban. The greatest transition in land use occurred from 2000 to 2010 when 4465 km2 (3% of the total area) were changed. Farmland changed the most with 1726 km2 (62% of the farmland changes) converted to urban areas.
Most of the urbanization occurred in the central part of Liaoning province, where economic development drove large demand for urban expansion (Figure 4). Urban expansion was more rapid in 2005–2010.
Based on the CASA model, the highest NPP was in the eastern half of Liaoning province where woodlands were dominant, while NPP was lower in the west where more of the area was farmland and grassland (Figure 5). Average NPP was 342.46 g C/m2 in 2000, which decreased to 333.36 g C/m2 in 2005 then to 317.40 g C/m2 in 2010.

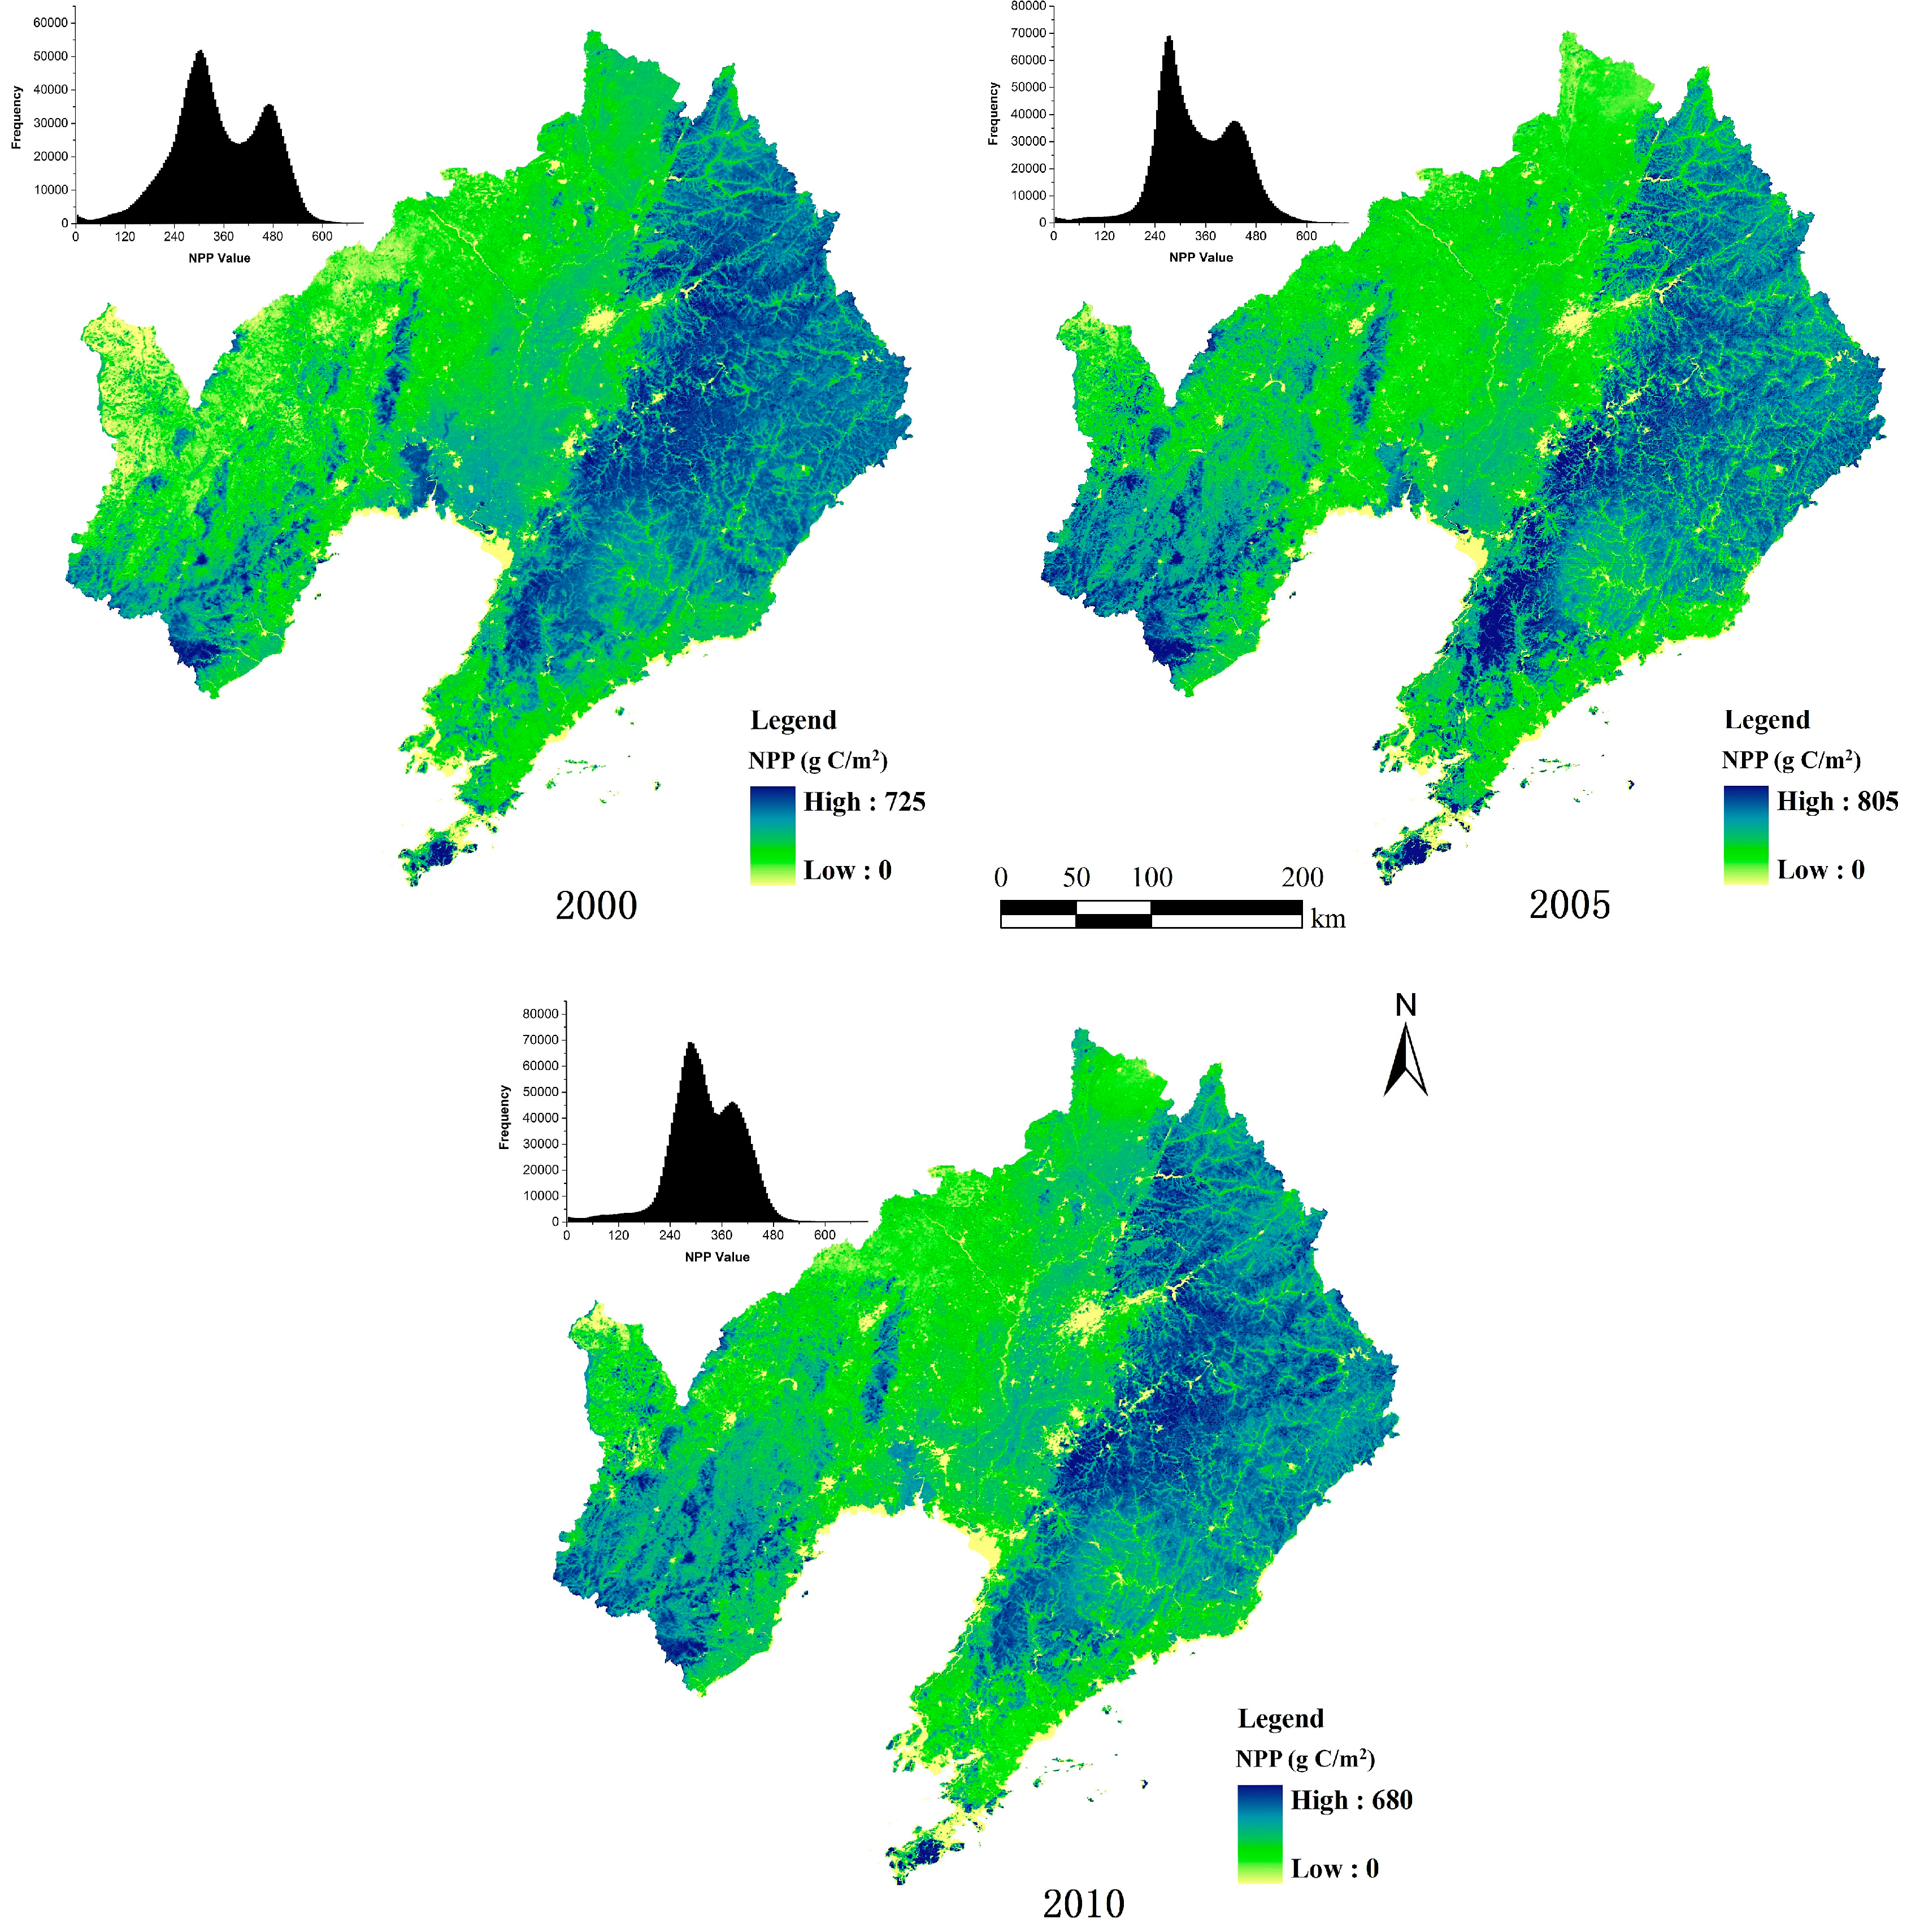
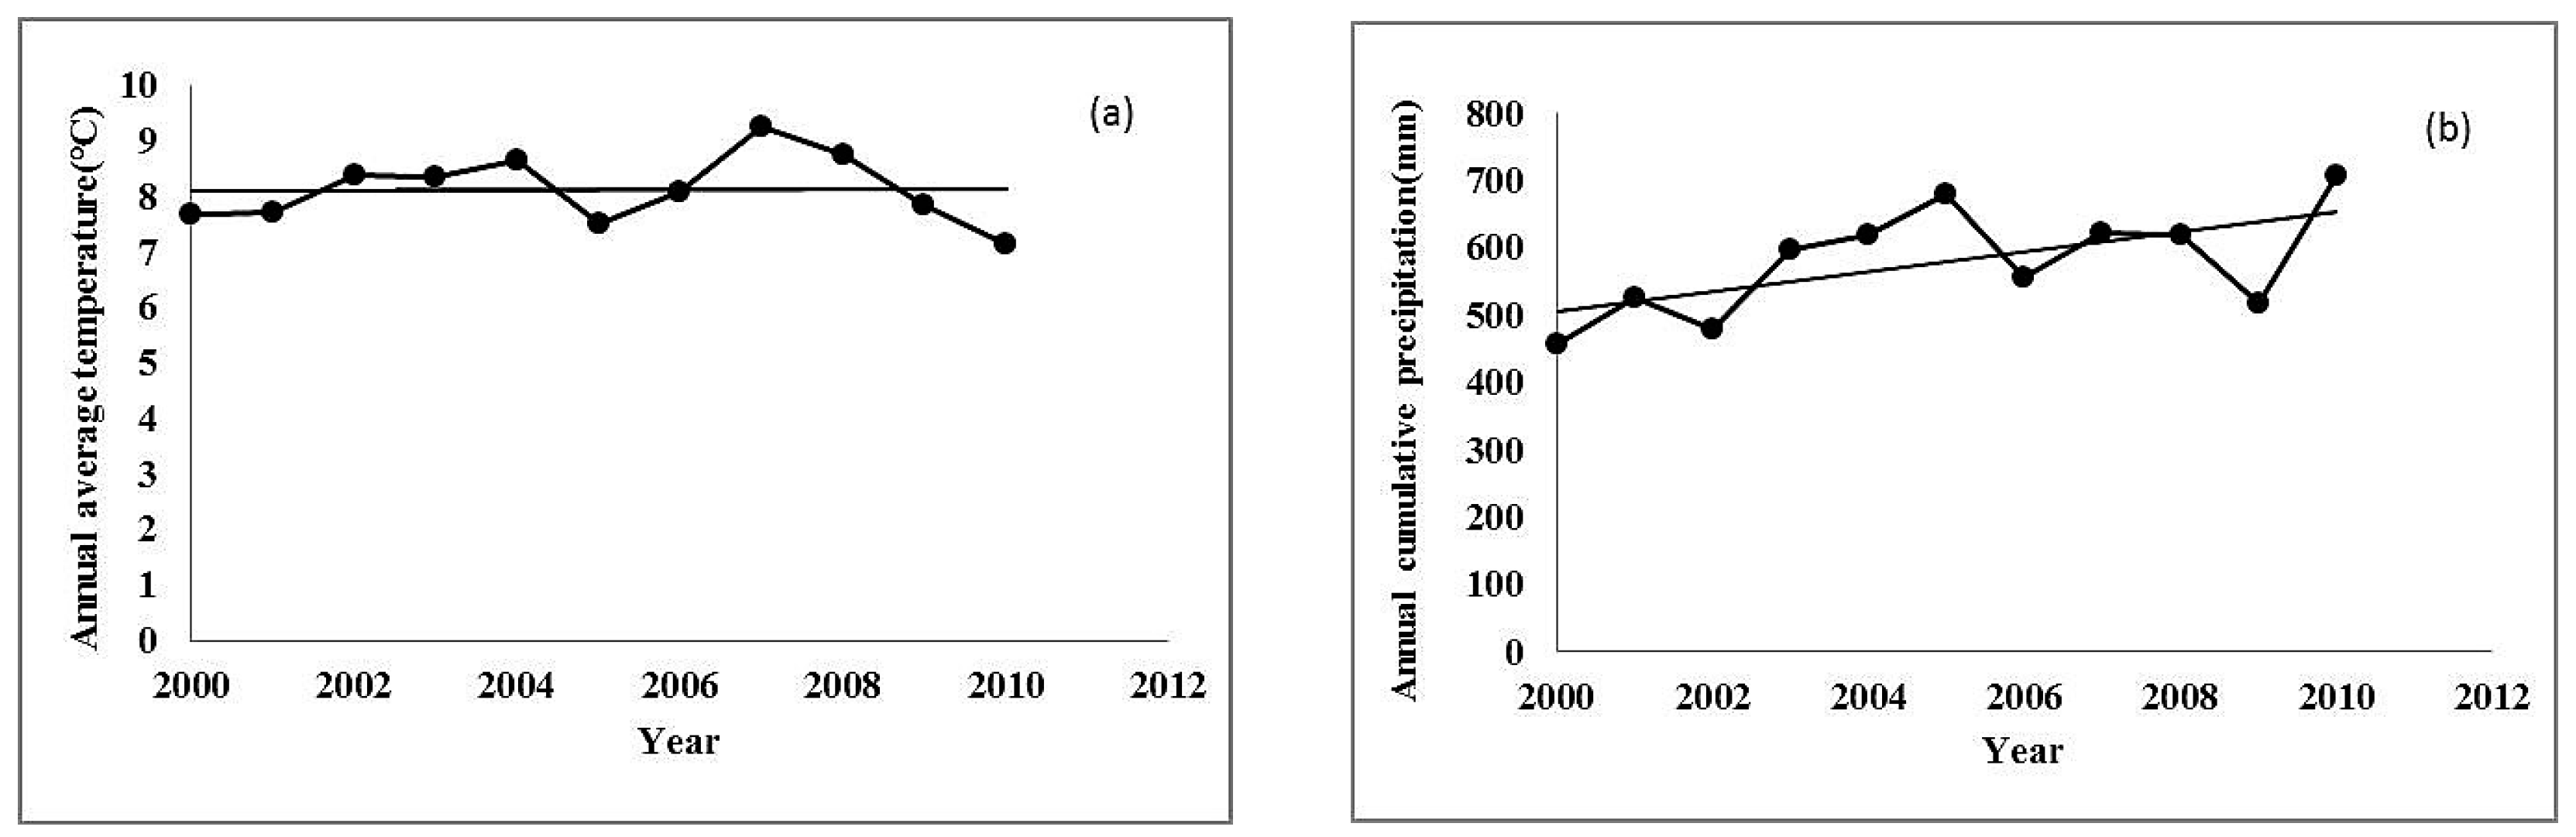
3.2. Impact of Climate on NPP Change

To investigate the climate-driven effect on changes in NPP at the urban area, we performed a simple correlation analysis between annual NPP series and climate conditions. We calculated mean annual air temperature and annual cumulative precipitation during 2000 to 2010 in Liaoning province (Figure 6). The temporal variation showed that mean annual temperature of the province was stable at around 8 °C, the annual cumulative precipitation illustrates a fluctuating increase during the study period.
Figure 7 showed the spatial distributions of the correlation coefficients between annual NPP and climate variables over Liaoning province from 2000 to 2010. The higher r values between annual NPP and annual cumulative precipitation are generally located in west parts of Liaoning where the climate is relatively dry (Figure 7a). In the eastern part of Liaoning province, the precipitation and NPP are negatively correlated, suggesting that an increase in precipitation would result in a decrease in NPP. In addition, variations in temperature secondarily control the variability in NPP in the eastern and southwestern parts of Liaoning which was not as significant as precipitation (Figure 7b).
The correlation coefficient of the critical value of 0.74 and 0.6 indicate 0.01 and 0.05 significance level according to the T test. We calculated the pixel numbers in central urban area combined with the 20 km radius circle around each city when the correlation coefficient had a significant correlation with NPP (|r| > 0.74, p < 0.01). As shown in Table 2, the percentage of pixel numbers is less than 3% in in all cities where the precipitation showed significant correlation with NPP (p < 0.01), with the exception of Dalian city. The percentage of pixel numbers is less than 2% in in all cities where the temperature showed significant correlation with NPP (p < 0.01). All indications suggest that the impact of climate variables on NPP in the central urban area was not significant. Thus, we can conclude that urbanization is the primary cause of NPP change in the central urban areas.

3.3. The Response of NPP to LUCC

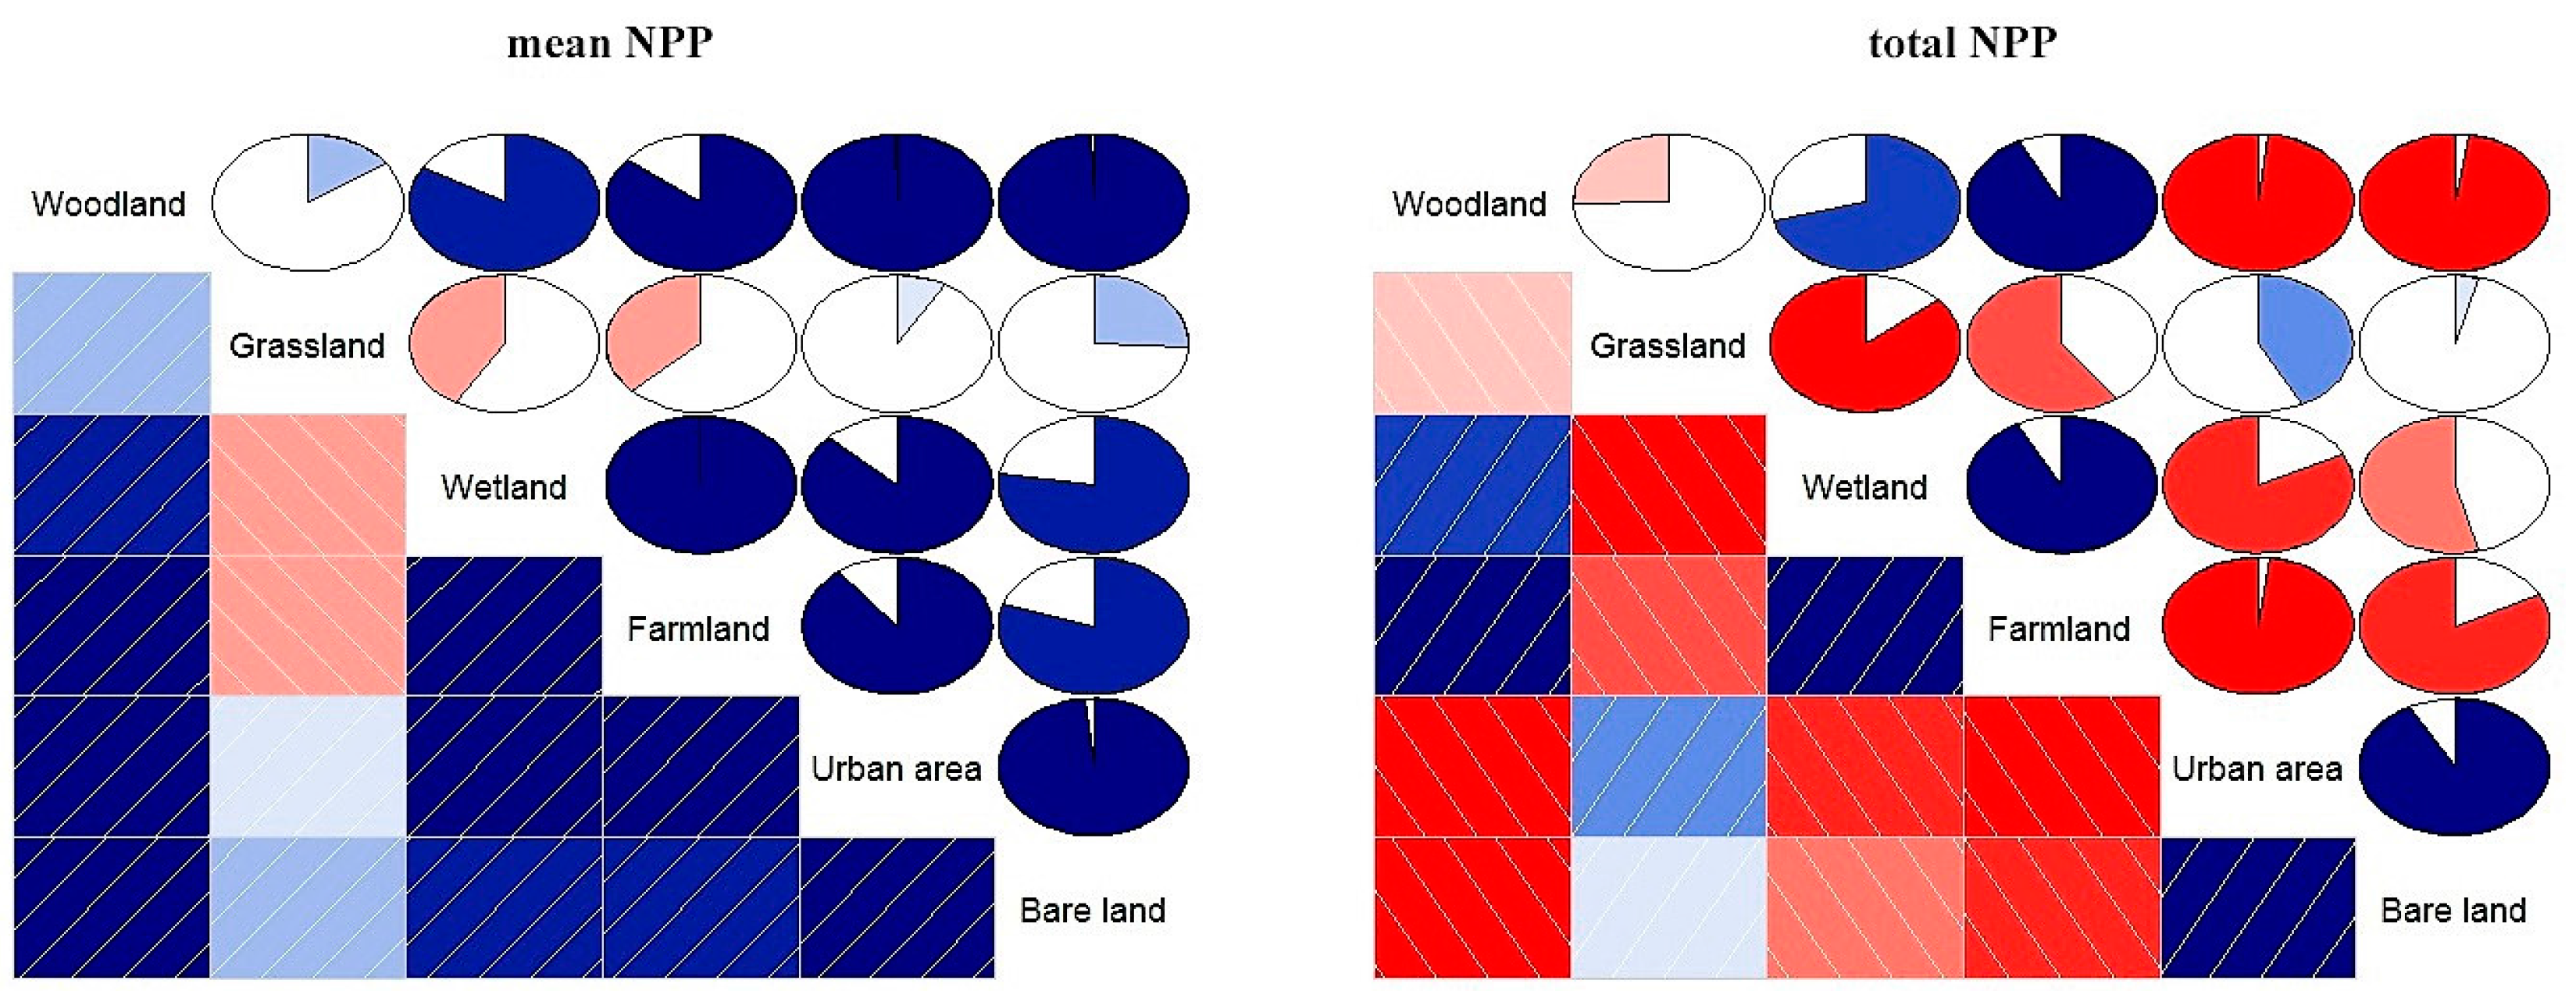
3.3.1. Variations of NPP under Different Types of Land Use

In 2000, the highest mean NPP was in woodland at 418.2 g C/m2 and the lowest was bare land at 226.05 g C/m2 (Table 3). In 2005, woodland still had the highest mean NPP, but wetlands had the lowest values. In 2010, the mean NPP of woodland was still the highest, and bare land was the lowest.
The mean annual NPP for each of the six land use types declined from 2000 to 2010 except for grassland (Table 3). The NPP of woodlands declined fastest at 41.8 g C/m2/y, while wetland NPP decreased by 30.55 g C/m2/y and bare land NPP fell by 25.75 g C/m2/y. Overall, total mean annual NPP decreased by 9.1 g C/m2/y from 2000–2005 and 15.96 g C/m2/y from 2005–2010. Thus, the carbon sequestration capacity of Liaoning province has diminished.
The total annual NPP of each land use type showed a similar trend as the mean annual NPP (Table 3). Woodlands had the highest total NPP, accumulating approximately 25 Tg C/y, while farmland was the second highest with 20 Tg C/y. Bare land had the lowest total NPP of approximately 0.05 Tg C/y. The total NPP of all six land uses decreased by 1.5 Tg C between 2000 and 2005, and by 2.29 Tg C between 2005 and 2010.
We explored the relationships between the annual mean NPP and total NPP of the different land use types from 2000 to 2010 graphically based on Corrgram (Figure 8), where darker colors and greater filled areas in the pie charts indicate stronger relationships. The circles are filled clockwise for positive values, anti-clockwise for negative values which fill an area proportional to the absolute value of the correlation [48]. We found significant positive relationships between the mean annual NPP of the land use types, except for grassland (Figure 8, left). For total annual NPP, urban area and farmland, urban area and woodland, and woodland and bare land had strong negative relationships. These changes in NPP were driven by LUCC and climate change. The total transitional land area from 2000 to 2010 was 4464 km2, 3.05% of the total area (Table 1). Thus, the change in NPP affected by LUCC was smaller than the climate factors in the whole province. However, urbanization was the primary influential factor for causing the NPP change in the area of land use change. In this study, we use the total NPP as the indicator of carbon sequestration capacity in Liaoning province which considered each land use type as a whole and multiplied the mean NPP of each land use type by the area of the land use types. Thus, we easily found that the correlation coefficient between total NPP and land use types to be in keeping with the change in land use. For instance, the strongest negative relationship between total NPP in woodland and total NPP in urban area means that the NPP loss was highest when woodland was converted to the urban area as was often the case in other land use conversions.

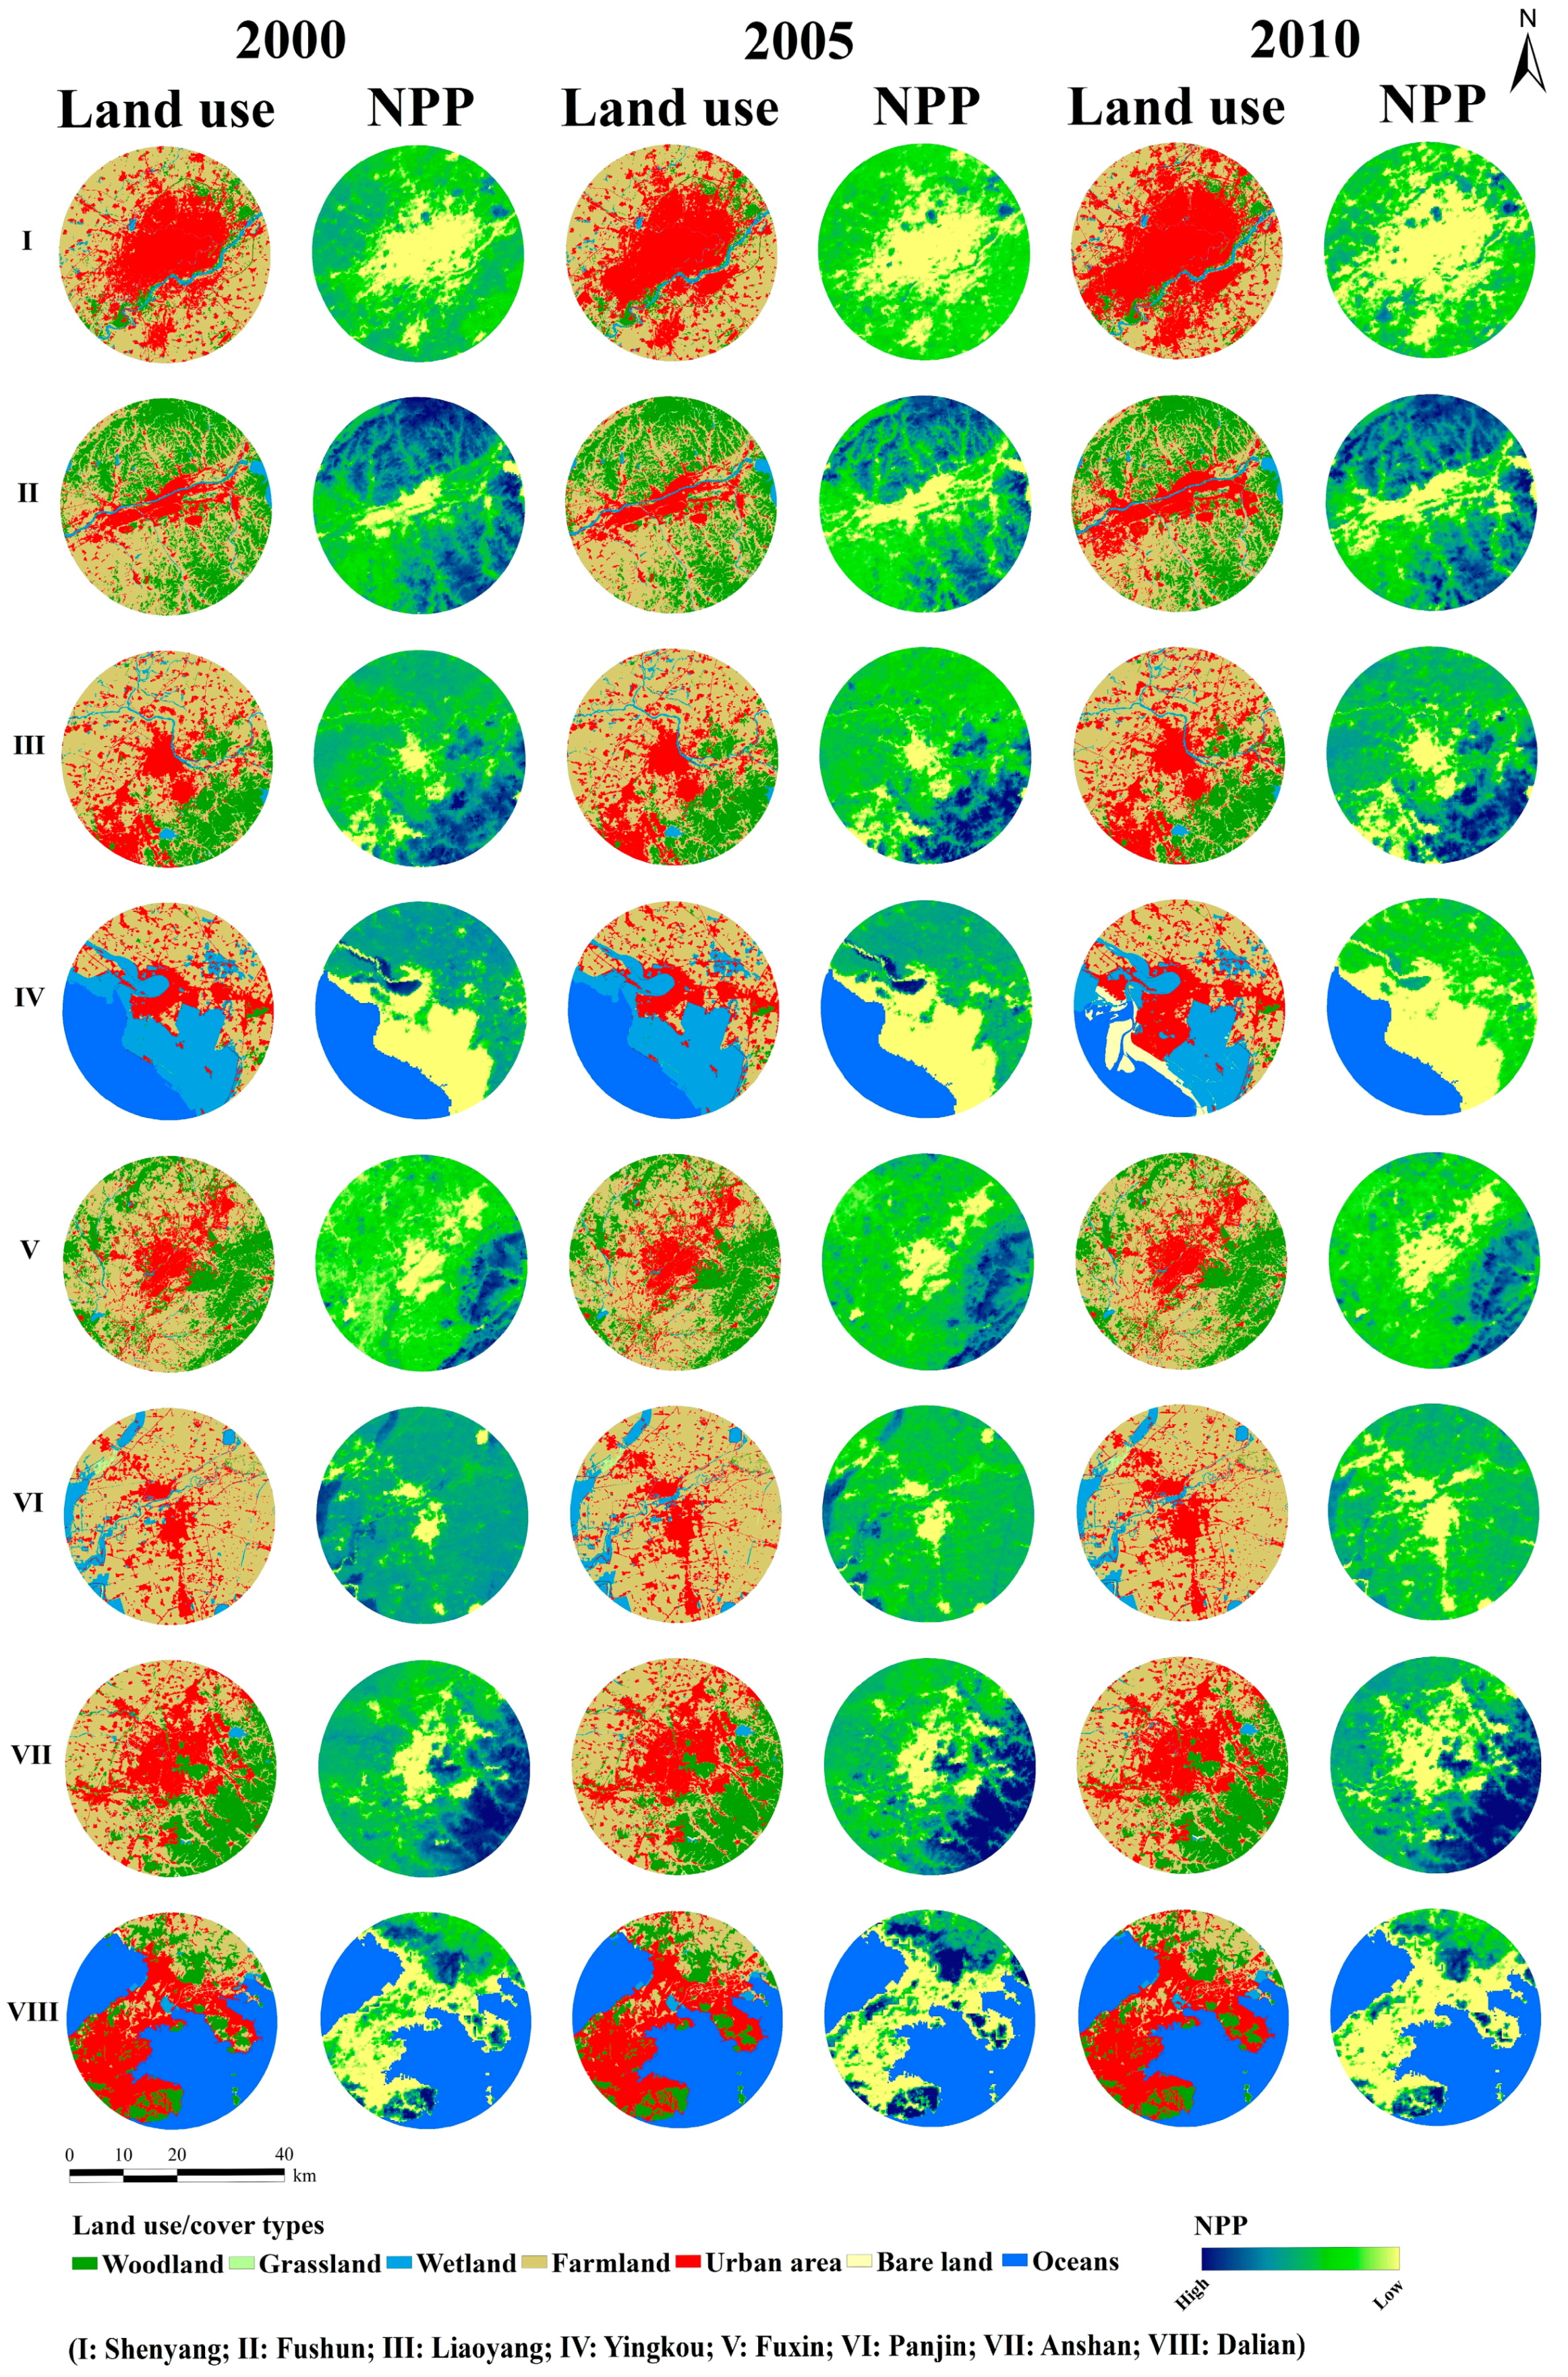
3.3.2. Variations in NPP Due to Urbanization

The unit circle-based evaluation model revealed that the urban area of each circle increased significantly from 2000 to 2010, with a correlating increase in areas of low NPP (Figure 9). The unit circles around Shenyang (city I) and Dalian (city VIII) had a large proportion of urban area. Urbanization radiated outward from the center of the circles and, as urban areas replaced farmland, NPP decreased.
NPP had the correlation with urban expansion in the city circles as was observed in the regional analysis (Figure 9 and Table 4). Urban area increased and NPP decreased in all cities, with the exception of Fuxin city where urban area increased and NPP increased. Fuxin city was located in the northwestern arid area of Liaoning province (see Figure 1), where NPP was mainly affected by the annual cumulative precipitation. Panjin and Yingkou had the greatest decreases in NPP, whereas Shenyang had a smaller decrease in NPP despite the largest increase of urban area.

4. Discussion

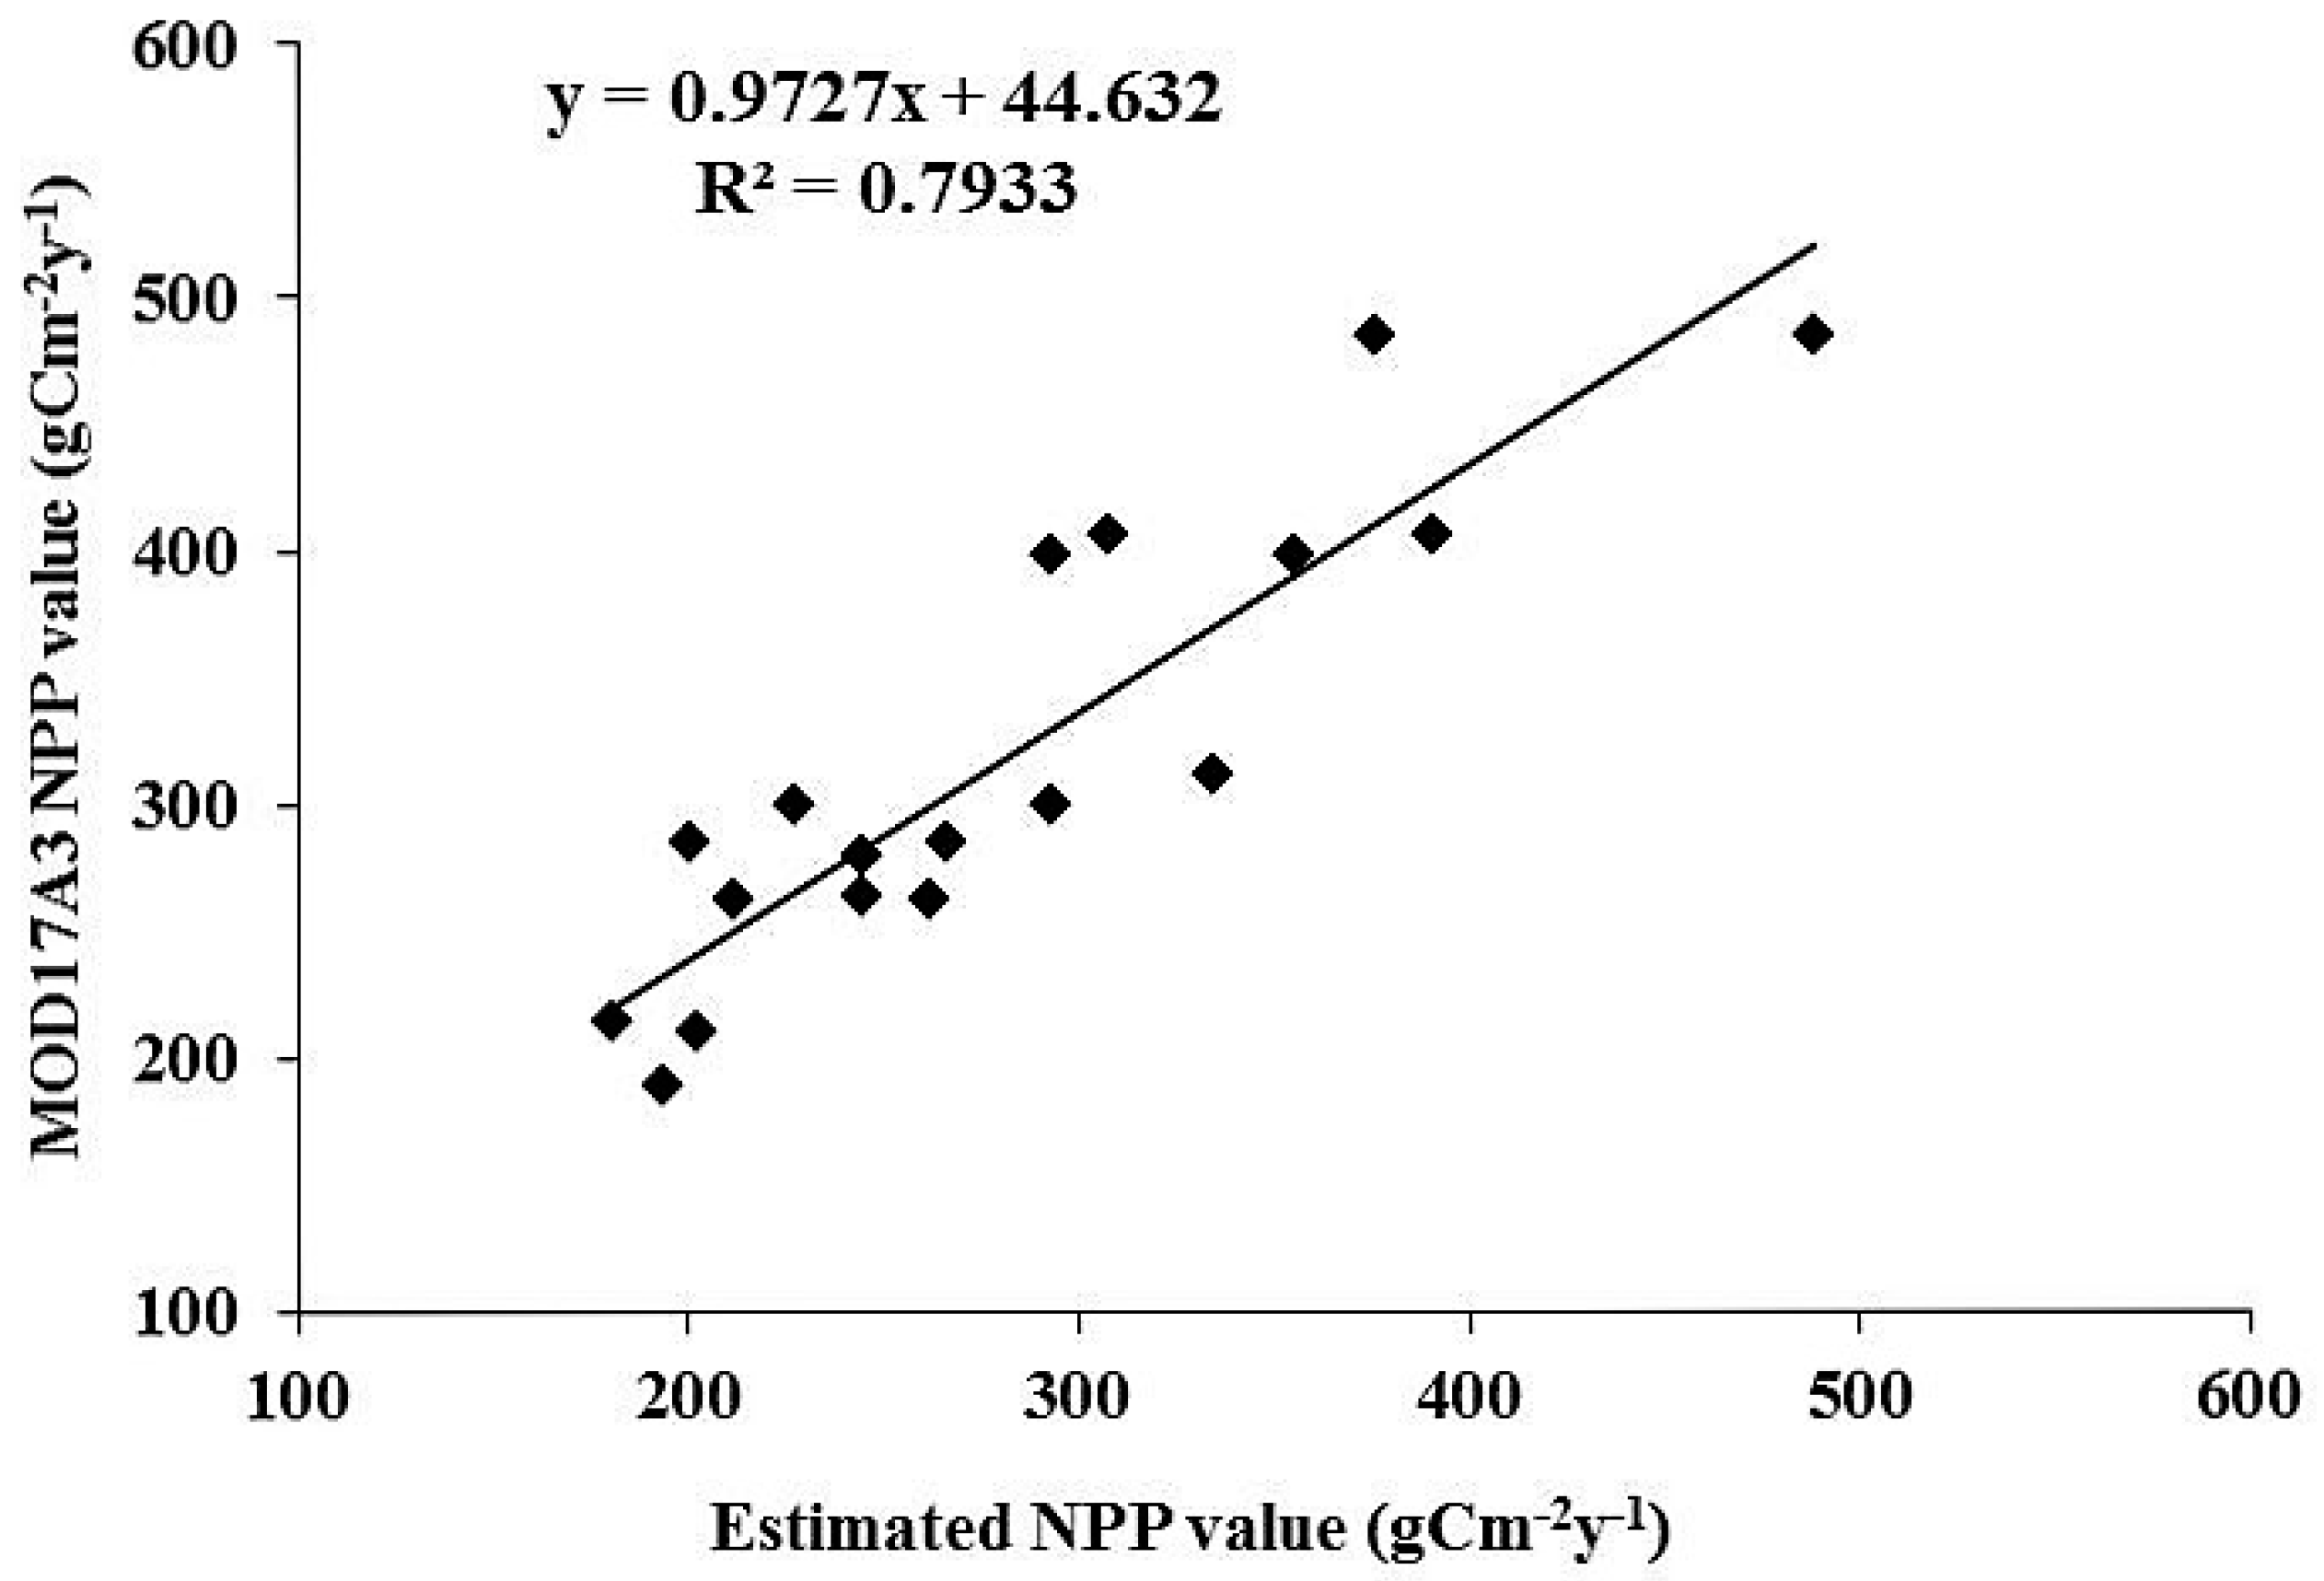
4.1. Validation of the NPP Calculations

Little field data of NPP are available for use in validating the CASA model outputs. We compared our mean annual NPP values for the land use types with MOD17A3 NPP values and NPP values from other domestic simulations (Table 5). In a linear regression between our CASA model results and MOD17A3 data, the mean relative error was 15.71% and the correlation coefficient was 0.89, indicating a strong agreement between the two (Figure 10). Our NPP values were slightly lower than or approximately equal to MOD17A3 and some other simulation work [38,49,50], but higher than the values in Cheng et al. [51] (Table 5). These differences may have been caused by the model, differences in data sources and/or issues with the accuracy of land use type classification.

4.2. Effect of "Grain to Green" Project on NPP Variation

The grain to green project aimed at protecting the ecological environment. It planned to step by step stop farming of cultivated land which had serious soil and water loss desertification, salinization, desertification, low or unstable food production and to afforestation, restore vegetation according to local conditions. According to our results in Table 1, there was slight net loss in woodland area though the Liaoning province launched the project from 2001. Farmland changed with 692.04 km2 converted to woodland (25% of the farmland changes), and woodland changed with 675.52 km2 to farmland and 92.07 km2 to urban area from 2000 to 2010. In addition, the NPP of woodlands declined fastest at 41.8 g C/m2/y in Table 3, which indicated that the woodlands in Liaoning province were not well protected. Thus, from a policy perspective, the grain to green project only works if current woodland is well protected from development.

4.3. The Role of Climate Variation in Causing the NPP Change

The climate variables were the key inputs of the CASA model, and they usually affected NPP change at a large scale [52,53,54]. In this study, we found that the climate conditions affected NPP both on the provincial level and pixel scale. The mean annual temperature of the province did not change obviously; the annual cumulative precipitation illustrates a fluctuating increase during the study period in Figure 6. Our results in Figure 7 show that precipitation was the primary factor in NPP changes and variations in temperature secondarily control the variability in NPP. The reason was that the pixel numbers showing significant correlation (|r| > 0.74, p < 0.01) between precipitation and NPP were higher than temperature and NPP. From the map, we found NPP of an arid area in western Liaoning and a woodland area in eastern Liaoning tended to be more influenced by meteorological factors. From Table 2, we can see that urbanization was the main reason of NPP change in central Liaoning urban agglomeration. In this study, we had made quantitative analysis in pixel scale throughout the overall balance of climate variation and land use change in causing the NPP change which little prior research investigated.

4.4. Loss of NPP Caused by LUCC and Sustainable Development

With the development of human society, the transformation and utilization of nature have been strengthened. Meanwhile, the land use and cover have changed greatly. The process of change is accompanied by the loss of NPP. However, the spatial distribution of global climate and soil conditions is basically stable—the potential net primary productivity of the world cannot be greatly enhanced in the historical period of human activities. Once the loss of net primary productivity caused by land use changes exceeds a certain limit, it will inevitably endanger global nature ecosystem maintenance and regeneration. Therefore, controlling the loss of net primary productivity is the key link in dealing with global change and sustainable development. Measures should be taken through policy management and reasonable urban planning to improve the use efficiency of the developed land. To achieve the goal of sustainable development, more attention should be paid to increasing the utilization efficiency of the net primary productivity of the semi-natural ecosystems and artificial ecosystems by means of engineering techniques. The loss of NPP caused by LUCC and human activities on the surrounding vegetation should be reduced, and then the problem of depletion of biological resources and the sustainable development problem can be solved in the process of urbanization.

5. Conclusions

Changes in net primary productivity (NPP) in Liaoning province between 2000, 2005 and 2010 were estimated using the Carnegie–Ames–Stanford (CASA) model and correlated with land use, climate variables, particularly urbanization. We found that main conclusions can be summarized as follows:
(1)
Land use change was characterized by loss of farmland through urban expansion, and the rate of urbanization increased from 2000–2005 to 2005–2010.
(2)
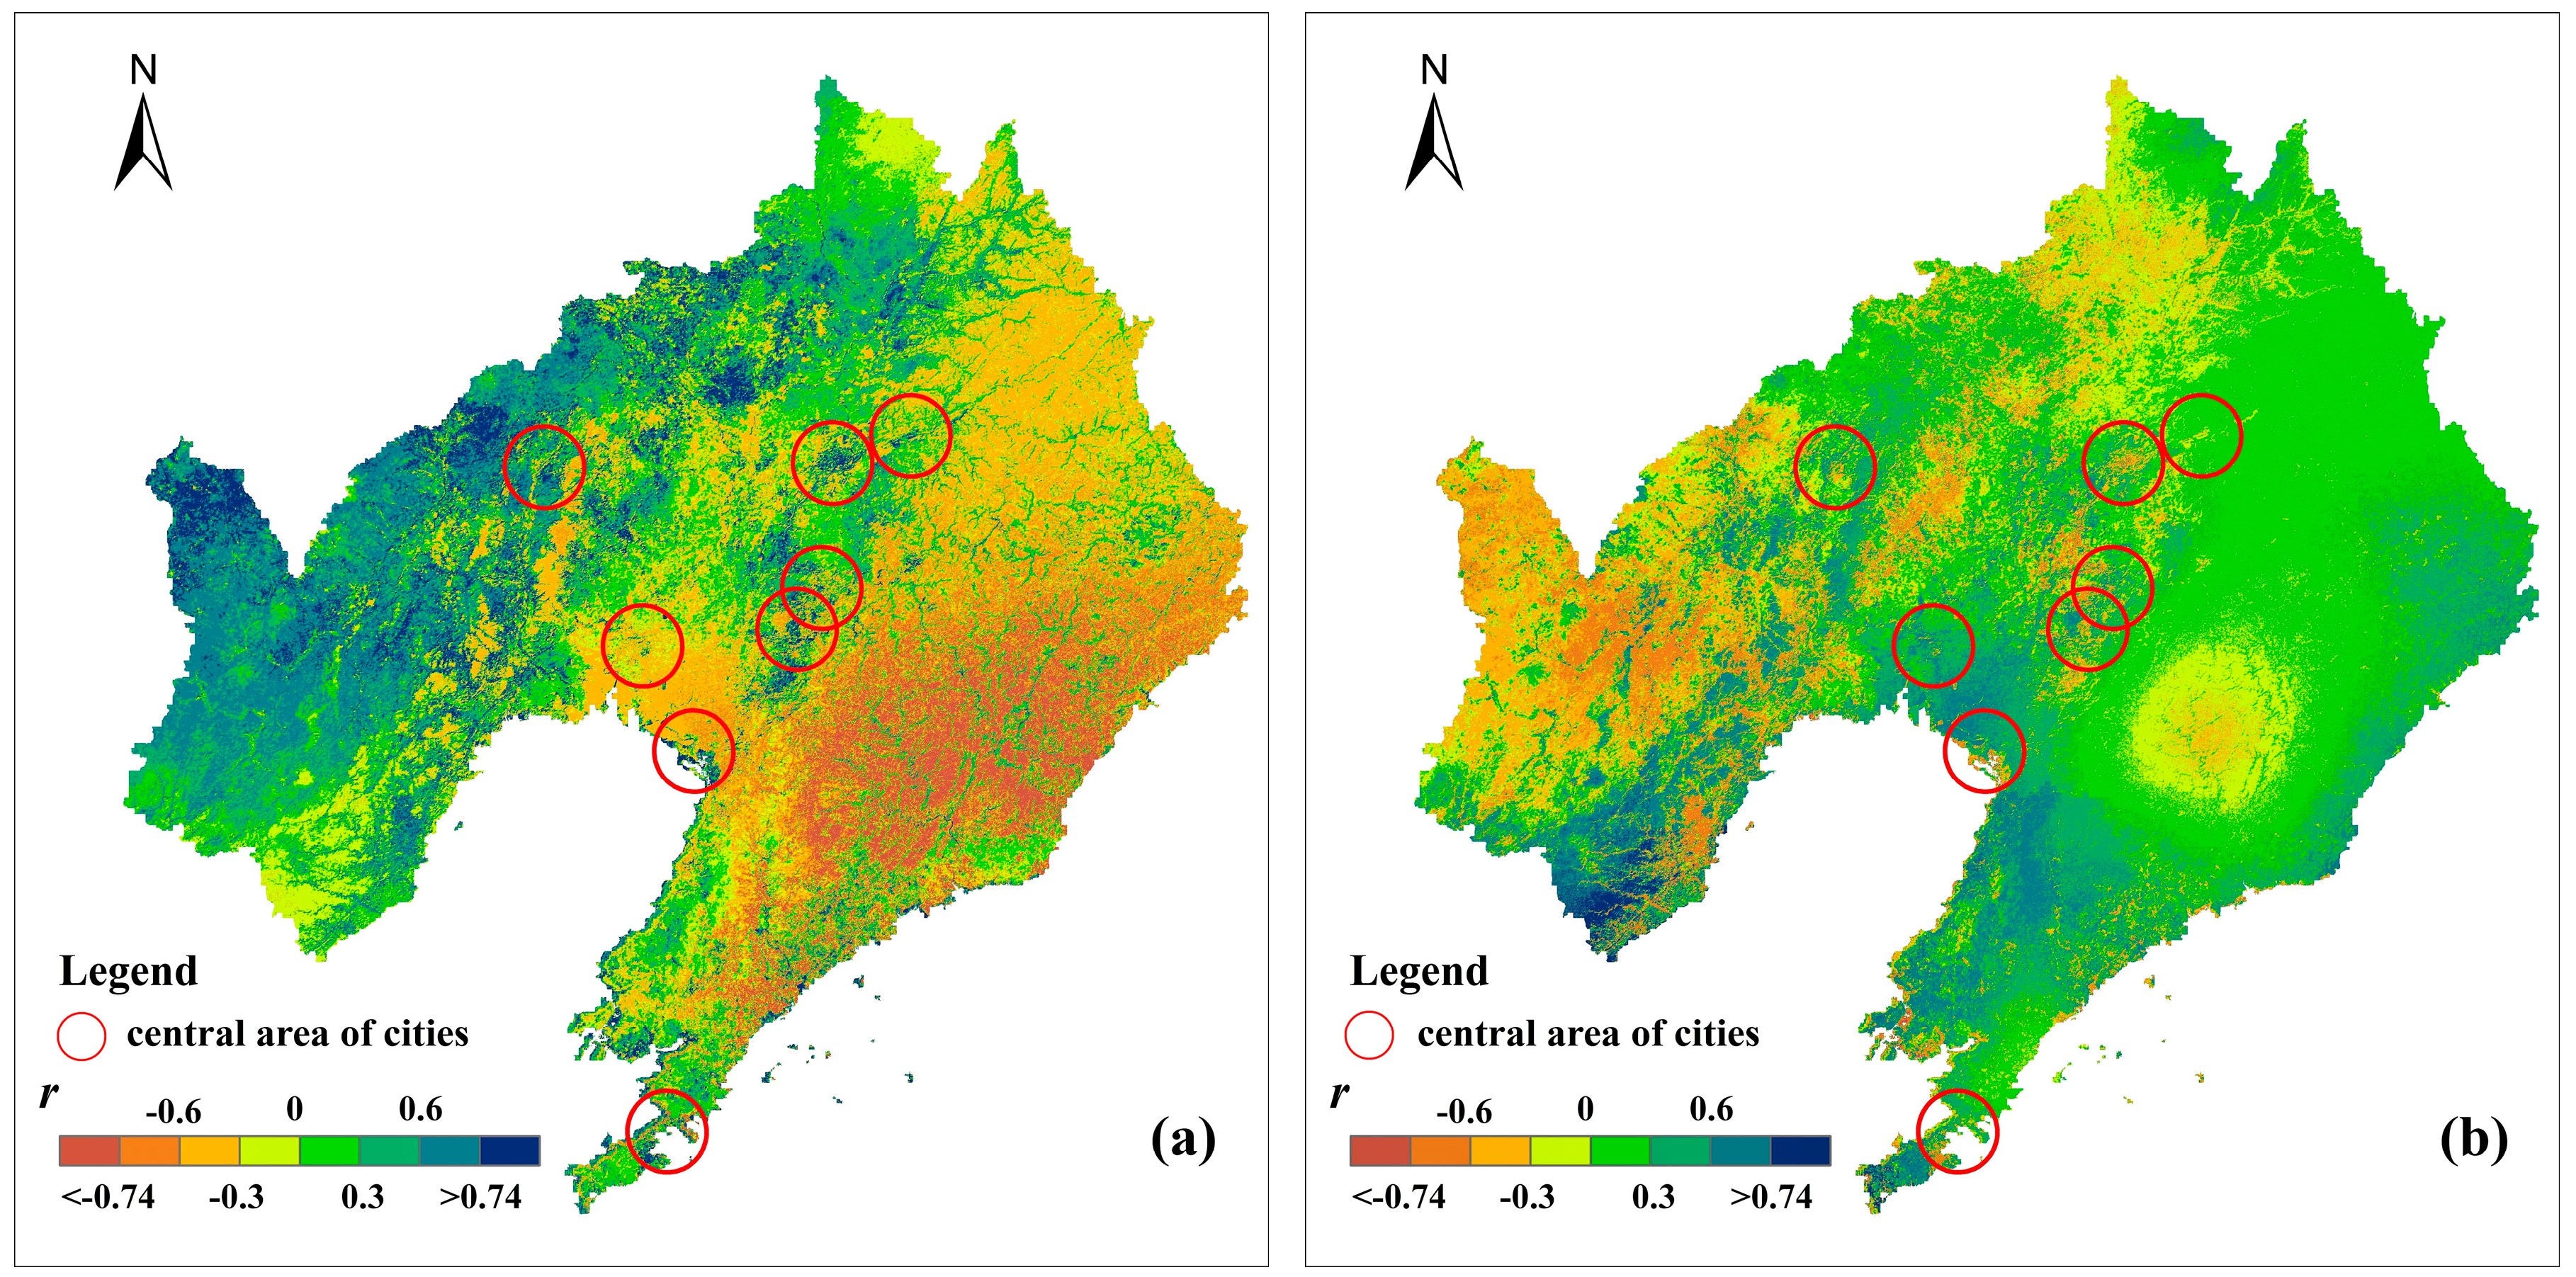
Annual cumulative precipitation is found to be the dominant climatic factor that controls variability in NPP throughout the Liaoning province.
(3)
NPP of arid area in the western Liaoning and woodland area in eastern Liaoning tended to be more influenced by meteorological factors. Land use change was the most important factor driving changes in NPP in central Liaoning urban agglomeration, with lesser impacts from changes in climate.
(4)
Consistent with land use change in the urbanization process, the NPP decreased form 2000–2010 in the central area of the eight representative cities.
Our analysis was limited by the spatial resolution of the data. Future work should aim to improve data resolution and delve further into the mechanisms coupling land use and the carbon cycle. Our analysis showed a significant decrease in carbon sequestration in Liaoning province, and work is needed to identify management practices and development strategies to halt and reverse this trend.

Acknowledgments

This work was supported by the Special Research Fund of the Ministry of Land and Resources for the Non-Profit Sector (Grant No. 201411014-03) and the National Key Technology Research & Development Program of China (Grant No. 2012BAH28B04).

Author Contributions

Tan Chen, Miao Liu and Manchun Li conceived and designed the study. Tan Chen analyzed the data, validated the model, and wrote the main part of the manuscript. Le’an Qu, Shulin Deng and Qiuhao Huang compiled numerical tables and graphs and completed the writing of this paper. Dong Chen collected part of the statistical data. All authors read and approved the manuscript.

Conflicts of Interest

The authors declare no conflict of interest.

References

  1. Vitousek, P.M.; Mooney, H.A.; Lubchenco, J.; Melillo, J.M. Human domination of Earth’s ecosystems. Science 1997, 277, 494–499. [Google Scholar] [CrossRef]
  2. Alberti, M. The effects of urban patterns on ecosystem function. Int. Reg. Sci. Rev. 2005, 28, 168–192. [Google Scholar] [CrossRef]
  3. Wackernagel, M.; Yount, J.D. The ecological footprint: An indicator of progress toward regional sustainability. Environ. Monit. Assess. 1998, 51, 511–529. [Google Scholar] [CrossRef]
  4. Pielke, R.A., Sr.; Walko, R.L.; Steyaert, L.T.; Vidale, P.L.; Liston, G.E.; Lyons, W.A.; Chase, T.N. The influence of anthropogenic landscape changes on weather in South Florida. Mon. Weather Rev. 1999, 127, 1663–1673. [Google Scholar] [CrossRef]
  5. Imhoff, M.L.; Tucker, C.J.; Lawrence, W.T.; Stutzer, D.C. The use of multisource satellite and geospatial data to study the effect of urbanization on primary productivity in the United States. IEEE Trans. Geosci. Remote Sens. 2000, 38, 2549–2556. [Google Scholar]
  6. Li, C.; Zhao, J. Spatiotemporal variations of vegetation NPP and related driving factors in Shiyang River basin of Northwest China in 2000–2010. Chin. J. Ecol. 2013, 32, 712–718. [Google Scholar]
  7. Wang, X.C.; Wang, S.D.; Zhang, H.B. Spatiotemporal pattern of vegetation net primary productivity in Henan Province of China based on MOD17A3. Chin. J. Ecol. 2013, 32, 2797–2805. [Google Scholar]
  8. Mohan, M.; Kandya, A. Impact of urbanization and land-use/land-cover change on diurnal temperature range: A case study of tropical urban airshed of India using remote sensing data. Sci. Total Environ. 2015, 506–507, 453–465. [Google Scholar] [CrossRef] [PubMed]
  9. Nelson, J.A.; Atzori, F.; Gastrich, K.R. Repeatability and phenotypic plasticity of fish swimming performance across a gradient of urbanization. Environ. Biol. Fish 2015, 98, 1431–1447. [Google Scholar] [CrossRef]
  10. Pan, J.; Liu, J.; Zhu, C. Budgeting carbon for urbanization in China. Wiley Interdiscip. Rev. Energy Environ. 2015, 4, 406–409. [Google Scholar] [CrossRef]
  11. Field, C.B.; Behrenfeld, M.J.; Randerson, J.T.; Falkowski, P. Primary production of the biosphere: Integrating terrestrial and oceanic components. Science 1998, 281, 237. [Google Scholar] [CrossRef] [PubMed]
  12. Long, P.S.; Fang, J.Y.; Chen, A.P. Seasonal dynamics of terrestrial net primary production in response to climate changes in China. Acta. Bot. Sin. 2003, 45, 269–275. [Google Scholar]
  13. Hemming, D.; Betts, R.; Collins, M. Sensitivity and uncertainty of modelled terrestrial net primary productivity to doubled CO2 and associated climate change for a relatively large perturbed physics ensemble. Agric. For. Meteorol. 2013, 170, 79–88. [Google Scholar]
  14. Peng, S.S.; Piao, S.L.; Shen, Z.H.; Ciais, P.; Sun, Z.Z.; Chen, S.P.; Chen, A.P. Precipitation amount, seasonality and frequency regulate carbon cycling of a semi-arid grassland ecosystem in Inner Mongolia, China: A modeling analysis. Agric. For. Meteorol. 2013, 178, 46–55. [Google Scholar] [CrossRef]
  15. Gough, C.M.; Flower, C.E.; Vogel, C.S.; Dragoni, D.; Curtis, P.S. Whole-ecosystem labile carbon production in a north temperate deciduous forest. Agric. For. Meteorol. 2009, 149, 1531–1540. [Google Scholar] [CrossRef]
  16. Wang, Y.P.; Houlton, B.Z. Nitrogen constraints on terrestrial carbon uptake: Implications for the global carbon-climate feedback. Geophys. Res. Lett. 2009, 36, 392–395. [Google Scholar] [CrossRef]
  17. Wu, S.; Zhou, S.; Chen, D.; Wei, Z.; Liang, D.; Li, X. Determining the contributions of urbanisation and climate change to NPP variations over the last decade in the Yangtze River Delta, China. Sci. Total Environ. 2014, 472, 397–406. [Google Scholar] [CrossRef] [PubMed]
  18. Liu, C.Y.; Dong, X.F.; Liu, Y.Y. Changes of NPP and their relationship to climate factors based on the transformation of different scales in Gansu, China. Catena 2015, 125, 190–199. [Google Scholar] [CrossRef]
  19. Imhoff, M.L.; Lawrence, W.T.; Elvidge, C.D.; Paul, T.; Levine, E.; Privalsky, M.V.; Brown, V. Using nighttime DMSP/OLS images of city lights to estimate the impact of urban land use on soil resources in the United States. Remote Sens. Environ. 1997, 59, 105–117. [Google Scholar] [CrossRef]
  20. Imhoff, M.L.; Bounoua, L.; Ricketts, T. Global patterns in human consumption of net primary production. Nature 2004, 429, 870–873. [Google Scholar] [CrossRef] [PubMed]
  21. Milesi, C.; Elvidge, C.D.; Nemani, R.R.; Running, S.W. Assessing the impact of urban land development on net primary productivity in the southeastern United States. Remote Sens. Environ. 2003, 86, 401–410. [Google Scholar] [CrossRef]
  22. Imhoff, M.L.; Bounoua, L.; DeFries, R.; Lawrence, W.T.; Stutzer, D.; Tucker, C.J.; Ricketts, T. The consequences of urban land transformation on net primary productivity in the United States. Remote Sens. Environ. 2004, 89, 434–443. [Google Scholar] [CrossRef]
  23. Lu, D.; Xu, X.; Tian, H.; Moran, E.; Zhao, M.; Running, S. The effects of urbanization on net primary productivity in Southeastern China. Environ. Manag. 2010, 46, 404–410. [Google Scholar] [CrossRef] [PubMed]
  24. Seto, K.C.; Burak, G.; Hutyra, L.R. Global forecasts of urban expansion to 2030 and direct impacts on biodiversity and carbon pools. PNAS 2012, 109, 16083–16088. [Google Scholar] [CrossRef] [PubMed]
  25. Tian, G.; Zhi, Q. Assessing the impact of the urbanization process on net primary productivity in China in 1989–2000. Environ. Pollut. 2013, 184C, 320–326. [Google Scholar] [CrossRef] [PubMed]
  26. Jiang, C.; Wu, Z.F.; Cheng, J.; Yu, Q.; Rao, X.Q. Impacts of urbanization on net primary productivity in the Pearl River Delta, China. Inter. J. Plant Prod. 2015, 9, 581–598. [Google Scholar]
  27. Yu, D.; Shao, H.; Shi, P.; Zhu, W.; Pan, Y. How does the conversion of land cover to urban use affect net primary productivity? A case study in Shenzhen city, China. Agric. For. Meteorol. 2009, 149, 2054–2060. [Google Scholar]
  28. Pei, F.; Li, X.; Liu, X.; Wang, S.; He, Z. Assessing the differences in net primary productivity between pre- and post-urban land development in China. Agric. For. Meteorol. 2013, 171–172, 174–186. [Google Scholar] [CrossRef]
  29. Zhang, F.; Pu, L.; Huang, Q. Quantitative Assessment of the Human Appropriation of Net Primary Production (HANPP) in the Coastal Areas of Jiangsu, China. Sustainability 2015, 7, 15857–15870. [Google Scholar] [CrossRef]
  30. Chen, A.; Li, R.; Wang, H. Quantitative assessment of human appropriation of aboveground net primary production in China. Ecol. Model. 2015, 312, 54–60. [Google Scholar] [CrossRef]
  31. Morgan, K.; Brebbia, C.A.; Spector, J.M. Human Appropriation of Net Primary Production (HANPP) in an Agriculturally-Dominated Watershed, Southeastern USA. Land 2015, 4, 513–540. [Google Scholar]
  32. Pan, Y.; Yu, C.; Zhang, X. A modified framework for the regional assessment of climate and human impacts on net primary productivity. Ecol. Indic. 2016, 60, 184–191. [Google Scholar] [CrossRef]
  33. Fathizad, H.; Rostami, N.; Faramarzi, M. Detection and prediction of land cover changes using Markov chain model in semi-arid rangeland in western Iran. Environ. Monit. Assess. 2015, 187. [Google Scholar] [CrossRef] [PubMed]
  34. Gong, W.F.; Yuan, L.; Fan, W.Y.; Stott, P. Analysis and simulation of land use spatial pattern in Harbin prefecture based on trajectories and cellular automata–Markov modelling. Int. J. Appl. Earth Obs. Geoinf. 2015, 34, 207–216. [Google Scholar] [CrossRef]
  35. Hao, C.; Zhang, J.H.; Li, H.Y.; Yao, F.M.; Huang, H.C.; Meng, W.Q. Integration of multinomial-logistic and Markov-Chain models to derive land-use change dynamics. J. Urban Plann. Dev. 2015, 141. [Google Scholar] [CrossRef]
  36. Potter, C.S.; Rerson, J.T.; Field, C.B.; Matson, P.A.; Vitousek, P.M.; Mooney, H.A.; Klooster, S.A. Terrestrial ecosystem production: A process model based on global satellite and surface data. Glob. Biogeochem. Cycles 1993, 7, 811–841. [Google Scholar] [CrossRef]
  37. Field, C.B.; Randerson, J.T.; Malmström, C.M. Global net primary production: Combining ecology and remote sensing. Remote Sens. Environ. 1995, 51, 74–88. [Google Scholar] [CrossRef]
  38. Zhu, W.Q.; Pan, Y.Z.; Zhang, J.S. Estimation of net primary productivity of Chinese terrestrial vegetation based on remote sensing. Chin. J. Plant Ecol. 2007, 31, 413–424. [Google Scholar]
  39. Peng, S.L.; Guo, Z.H.; Wang, B.S. Use of GIS and RS to estimate the light utilization efficiency of the vegetation in Guangdong, China. Acta Ecol. Sin. 2000, 20, 903–909. (In Chinese) [Google Scholar]
  40. Raymond, E.; Hunt, J.R. Relationship between woody biomass and PAR conversion efficiency for estimating net primary production from NDVI. Int. J. Remote Sens. 1994, 15, 1725–1730. [Google Scholar]
  41. Ruimy, A.; Saugier, B. Methodology for the estimation of terrestrial net primary production from remotely sensed data. J. Geophys. Res. 1994, 97, 18515–18521. [Google Scholar] [CrossRef]
  42. Goetz, S.J.; Prince, S.D. Remote sensing of net primary production boreal forest stands. Agric. For. Meteorol. 1996, 78, 149–179. [Google Scholar] [CrossRef]
  43. Paruelo, J.M.; Epstei, H.E.; Lauenroth, W.K. ANPP estimates from NDVI for the central grassland region of the United States. Ecology 1997, 78, 953–958. [Google Scholar] [CrossRef]
  44. McCrady, R.L.; Jokela, E.J. Canopy dynamics, light interception, and radiation use efficiency of selected loblolly pine families. For. Sci. 1998, 44, 64–72. [Google Scholar]
  45. Zhu, W.Q.; Pan, Y.Z.; He, T.; Yu, D.Y.; Hu, H.B. Simulation of maximum light use efficiency for some typical vegetation types in China. Chin. Sci. Bull. 2006, 51, 457–463. [Google Scholar] [CrossRef]
  46. Thornthwaite, C.W. An approach toward a rational classification of climate. Geogr. Rev. 1948, 38, 55–89. [Google Scholar] [CrossRef]
  47. Yi, K.P.; Zeng, Y.; Wu, B.F. Mapping and evaluation the process, pattern and potential of urban growth in china. Appl. Geogr. 2016, 71, 44–55. [Google Scholar] [CrossRef]
  48. Friendly, M. Corrgrams: Exploratory Displays for Correlation Matrices. Am. Stat. 2002, 56, 316–324. [Google Scholar] [CrossRef]
  49. Guo, Z.X.; Wang, Z.M.; Zhang, B.; Liu, D.W.; Yang, G.; Song, K.S.; Li, F. Analysis of temporal-spatial characteristics and factors influencing vegetation NPP in Northeast China from 2000 to 2006. Res. Sci. 2008, 30, 1226–1235. [Google Scholar]
  50. Zhao, G.S.; Wang, J.B.; Fan, W.Y.; Ying, T.Y. Vegetation net primary productivity in Northeast China in 2000–2008: Simulation and seasonal change. Chin. J. Appl. Ecol. 2011, 22, 621–630. [Google Scholar]
  51. Cheng, C.X.; Xu, Z.X.; Wang, Z.H.; Liu, C.M. Temporal-spatial change simulation and analysis of net primary productivity in northeast china from 2001 to 2010. Res. Sci. 2014, 36, 2401–2412. [Google Scholar]
  52. Gang, C.C.; Wang, Z.Q.; Zhou, W.; Chen, Y.Z.; Li, J.L.; Cheng, J.M.; Chen, C. Projecting the dynamics of terrestrial net primary productivity in response to future climate change under the RCP2.6 scenario. Environ. Earth Sci. 2015, 74, 5949–5959. [Google Scholar] [CrossRef]
  53. Grindean, R.; Feurdean, A.; Hurdu, B.; Farcas, S.; Tantau, I. Lateglacial/Holocene transition to mid-Holocene: Vegetation responses to climate changes in the Apuseni Mountains (NW Romania). Quatern. Int. 2015, 388, 76–86. [Google Scholar] [CrossRef]
  54. Li, S.S.; Lu, S.H.; Gao, Y.H.; Ao, Y.H. The change of climate and terrestrial carbon cycle over Tibetan Plateau in CMIP5 models. Int. J. Climatol. 2015, 35, 4359–4369. [Google Scholar] [CrossRef]
Figure 1. Location of study area and topography.
Sustainability 09 00162 g001
Figure 2. Land use in Liaoning province in 2000, 2005 and 2010.
Sustainability 09 00162 g002
Figure 3. Flowchart of the spatial analysis and modeling methods.
Sustainability 09 00162 g003
Figure 4. Map of urban expansion in Liaoning province from 2000–2010 (WO: Woodland; GR: Grassland; WE: Wetland; FR: Farmland; UA: Urban Area; BA: Bare Land).
Sustainability 09 00162 g004
Figure 5. Maps of NPP in 2000, 2005 and 2010.
Sustainability 09 00162 g005
Figure 6. Temporal variation of the climate variables: annual average temperature (a); annual cumulative precipitation (b).
Sustainability 09 00162 g006
Figure 7. Spatial distributions of the correlation coefficients (a) between annual NPP and annual cumulative precipitation from 2000 to 2010; and (b) between annual NPP and annual mean air temperature.
Sustainability 09 00162 g007
Figure 8. Relationships between mean annual NPP (left) and total NPP (right) of the land use types. Blue with rising lines denotes positive relationships, pink with falling lines denotes negative relationships.
Sustainability 09 00162 g008
Figure 9. Urbanization and NPP in eight cities for 2000, 2005, and 2010.
Sustainability 09 00162 g009
Figure 10. Correlation between estimated NPP values (CASA model, this study) and MOD17A3 NPP values.
Sustainability 09 00162 g010
Table 1. Land use transition metric in Liaoning province (km2).
YearLand Use TypeWoodlandGrasslandWetlandFarmlandUrban AreaBare LandTotal Change
2000–2005Woodland61,139.47 44.84 16.14 572.02 68.17 2.59 703.76
Grassland51.47 1754.25 1.58 30.55 2.82 0.32 86.74
Wetland22.52 1.16 4814.38 94.80 43.23 5.76 167.47
Farmland585.68 43.69 123.21 66,907.37 741.99 12.63 1507.20
Urban area40.34 2.59 10.48 186.67 8613.02 0.90 240.98
Bare land1.98 0.29 4.42 6.21 1.65 241.89 14.55
2720.70
2005–2010Woodland61,688.91 7.36 9.97 116.09 19.47 4.19 157.08
Grassland10.49 1830.74 0.25 5.00 0.58 0.07 16.39
Wetland4.33 2.61 4810.91 71.01 129.80 41.29 249.04
Farmland113.36 44.24 109.88 66,475.89 1002.48 55.84 1325.80
Urban area7.94 1.64 10.65 33.71 9425.32 2.84 56.78
Bare land0.43 3.03 2.61 1.97 3.97 265.28 12.01
1817.10
2000–2010Woodland60,991.43 52.04 25.42 675.52 92.07 6.85 851.90
Grassland61.50 1738.83 1.79 34.73 3.64 0.48 102.14
Wetland26.20 3.73 4576.38 159.70 171.55 45.28 406.46
Farmland692.04 87.28 225.97 65,616.09 1726.19 67.08 2798.56
Urban area47.54 4.13 20.28 206.52 8572.40 3.67 282.14
Bare land2.37 3.28 5.57 7.01 5.08 233.47 23.31
4464.51
Table 2. Summary of statistics of the percentages of pixels showing significant correlation between NPP and climate variables. r(Pre)* precipitation shows significant (p < 0.01) correlation with NPP (|r| > 0.74), r(Tem)* temperature shows significant (p < 0.01) correlation with NPP. PN is pixel numbers.
Cityr(Pre)*
PN
r(Tem)*
PN
Total
PN
PCT-Pre
Ratio
PCT-Tem
Ratio
Shenyang22816020,1001.130.80
Fushun201820,1000.100.09
Anshan43425120,1002.161.25
Yingkou18429915,2071.211.97
Fuxin30113320,1001.500.66
Panjin283720,1000.140.18
Dalian64111411,4345.611.00
Liaoyang25924520,1001.291.22
Table 3. Mean annual NPP and total NPP of the land use types in 2000, 2005 and 2010.
Land Use TypeMean NPP (g C/m2/y)Total NPP (Tg C/y)
200020052010200020052010
Woodland418.20 407.10 376.40 25.86 25.18 23.28
Grassland305.75 325.70 308.10 0.56 0.600.58
Wetland241.95 218.00 211.40 1.21 1.10 1.10
Farmland305.80 296.35 293.05 20.9220.09 19.55
Urban area252.45 244.25 227.75 2.23 2.32 2.42
Bare land226.05 221.80 200.30 0.06 0.06 0.13
Total area342.46 333.36 317.40 50.8549.3547.06
Table 4. Urban area and NPP change in eight cities from 2000 to 2010.
CityUrban Area (km2)%NPP (g C/m2/y)%
20002010△UA20002010△NPP
Shenyang477.07660.5538.46254.26218.66−14.00
Fushun178.69250.8240.36366.96316.10−13.86
Anshan354.17373.695.51344.97315.75−8.47
Yingkou201.87289.2843.30257.77180.80−29.86
Fuxin213.69225.315.44267.65273.632.23
Panjin228.08257.7112.99360.95276.38−23.43
Dalian362.30390.557.80228.71197.60−13.60
Liaoyang293.68347.1818.22333.45303.81−8.89
△UA is the proportion of urban area change, △NPP is the proportion of NPP change.
Table 5. Comparison of the mean annual NPP modeled in this paper with other research results (g C/m2). “——” indicates no data.
Land Use TypeThis StudyMOD17A3Cheng et al., 2014 [51]Zhu et al., 2007 [38]Guo et al., 2008 [49]Zhao et al., 2011 [50]
Woodland400.57 393.17 344.32 367–985370–470538 ± 173
Grassland313.18 332.01 256.86 226.20 312.45310.45
Wetland223.78 220.54 160.46 375.40 432.90——
Farmland298.40 337.62 282.18 426.50 378.21424.21
Urban area241.48 252.57 211.38 347.10 ————
Bare land216.05 210.96 170.22 80.90 ————

