Article

Progress towards Sustainable Production: Environmental, Economic, and Social Assessments of the Cellulose Nanofiber Production Process

National Institute of Advanced Industrial Science and Technology, 16-1 Onogawa, Tsukuba, Ibaraki 305-8569, Japan
*
Author to whom correspondence should be addressed.
Current address: Department of Chemical System Engineering, The University of Tokyo, 7-3-1 Hongo, Bunkyo-ku, Tokyo 113-8656, Japan.
Sustainability 2017, 9(12), 2368; https://doi.org/10.3390/su9122368
Submission received: 24 November 2017 / Revised: 14 December 2017 / Accepted: 14 December 2017 / Published: 18 December 2017
(This article belongs to the Section Sustainable Chemical Engineering and Technology)

Abstract

:
We assessed the environmental, economic, and social impacts of the process for producing cellulose nanofibers (CNFs), which are considered to be a valuable sustainable woody biomass feedstock. The greenhouse gas (GHG) emissions associated with CNF production are greater than the emissions associated with producing most plastic materials used in vehicle components because the grinding process during CNF production generates significant GHG emissions. The cost of CNF production is also higher than the cost of producing comparable plastics for automotive use because of the high cost of the pulverization process. The sensitivity analysis in this study suggested that GHG emissions and manufacturing costs could be reduced by 19.1–76.4% and 3.6–12.2%, respectively, by improving the energy efficiency of CNF production by two to five times. We compared the potential social risks associated with CNF production between Japan and Vietnam using a product social impact life cycle assessment database. It is desirable to reduce the social risk on the fair salary and child labor, and to improve the safe and healthy living conditions in the local communities that import wood chips harvested in Vietnam.

1. Introduction

The utilization of unused logging residues as a type of woody biomass in the forest sector can have environmental effects related to the improvement of energy efficiency and the slowing of global warming. Using logging residues also has economic effects, such as the revitalization of regional economies and industrial development. Many local governments in Japan have started to develop plans for the use of logging residues as woody biomass. Moreover, demand for the use of unused logging residues as a source of energy for generating electricity has increased drastically since a feed-in tariff (FIT) scheme was implemented in Japan in 2014. Under the FIT scheme, electricity produced from applicable renewable energy sources such as solar, wind, geothermal, hydrologic, and biomass must be purchased by power companies at a fixed price within a particular period [1]. In 2015, the local governments of Japan were certified or scheduled to start the test operation of 68 power plants, which will produce yearly 335 million kilowatts of electricity, using approximately 610 million tons of woody biomass [2]. Although the utilization of woody biomass as a new renewable energy source has become mainstream in Japan, woody biomass has also been proposed as a material feedstock to secure the diversity of methods to use the resources. The production of cellulose nanofibers (CNFs), a high-value-added product, is one way to expand the material use of woody biomass. CNFs obtained from woody biomass are fibrous materials consisting of nanosized cellulose with diameters ranging from 1 to 100 nm and aspect ratios (length/diameter) greater than 100 [3,4]. CNFs are light, with one-sixth to one-fifth the weight of steel, and possess bending strength equivalent to that of mild steel [5,6,7]. Due to these advantages, CNFs have been applied in a wide range of industries such as the paper, electronic parts and devices, pharmaceutical, medicine manufacturing, cosmetics, food, and automotive parts industries [8]. In the automotive parts industry, replacing the plastic resin currently used in vehicles with CNFs could reduce the total weight of the vehicle. The reduction in total vehicle weight resulting from the use of CNFs can be linked with economic and environmental benefits, including increased fuel economy and reduced greenhouse gas (GHG) emissions. Moon et al. studied the economic effects of producing CNFs from logging residues [9]. They determined that the process of CNF production can have net benefits and create jobs in various sectors of industry. Moon et al. also calculated the effect of using CNFs as substitutes for plastic resins on GHG emissions throughout the life cycle of the vehicle [10].
The above studies focused on how to maximize the economic and environmental efficiency of the CNF manufacturing process. To assess the feasibility for implementing a sustainable business, it is necessary to consider the social risks for a certain region in which the business is going to be operated.
In Japan, the use of local resources is a key aspect of basic plans for promoting the utilization of biomass. The use of local resources is expected to benefit rural regions, which are relatively deprived from the viewpoint of sustainable production compared to urban regions [11]. Thus, the benefits of using woody biomass include enhanced opportunities for local community members along with profit and reductions in GHG emissions. Therefore, assessing the economic, social, and environmental effects of CNF production is meaningful for stakeholders associated with all stages of CNF manufacturing and is the focus of this study. First, the environmental impact of CNF production in terms of GHG emissions was assessed, and the manufacturing cost for the entire process of CNF production was calculated using a life cycle assessment (LCA) approach. Second, to assess the effects of improvements in manufacturing technology, the GHG emissions and cost associated with CNF production in 2015 were comparing with those in 2012, the year that CNF manufacturing began. Third, the potential social risk to the community of producing CNF was estimated by applying product social impact life cycle assessment database (PSILCA) methodology as a tool for social LCA (SLCA).

2. Methodology

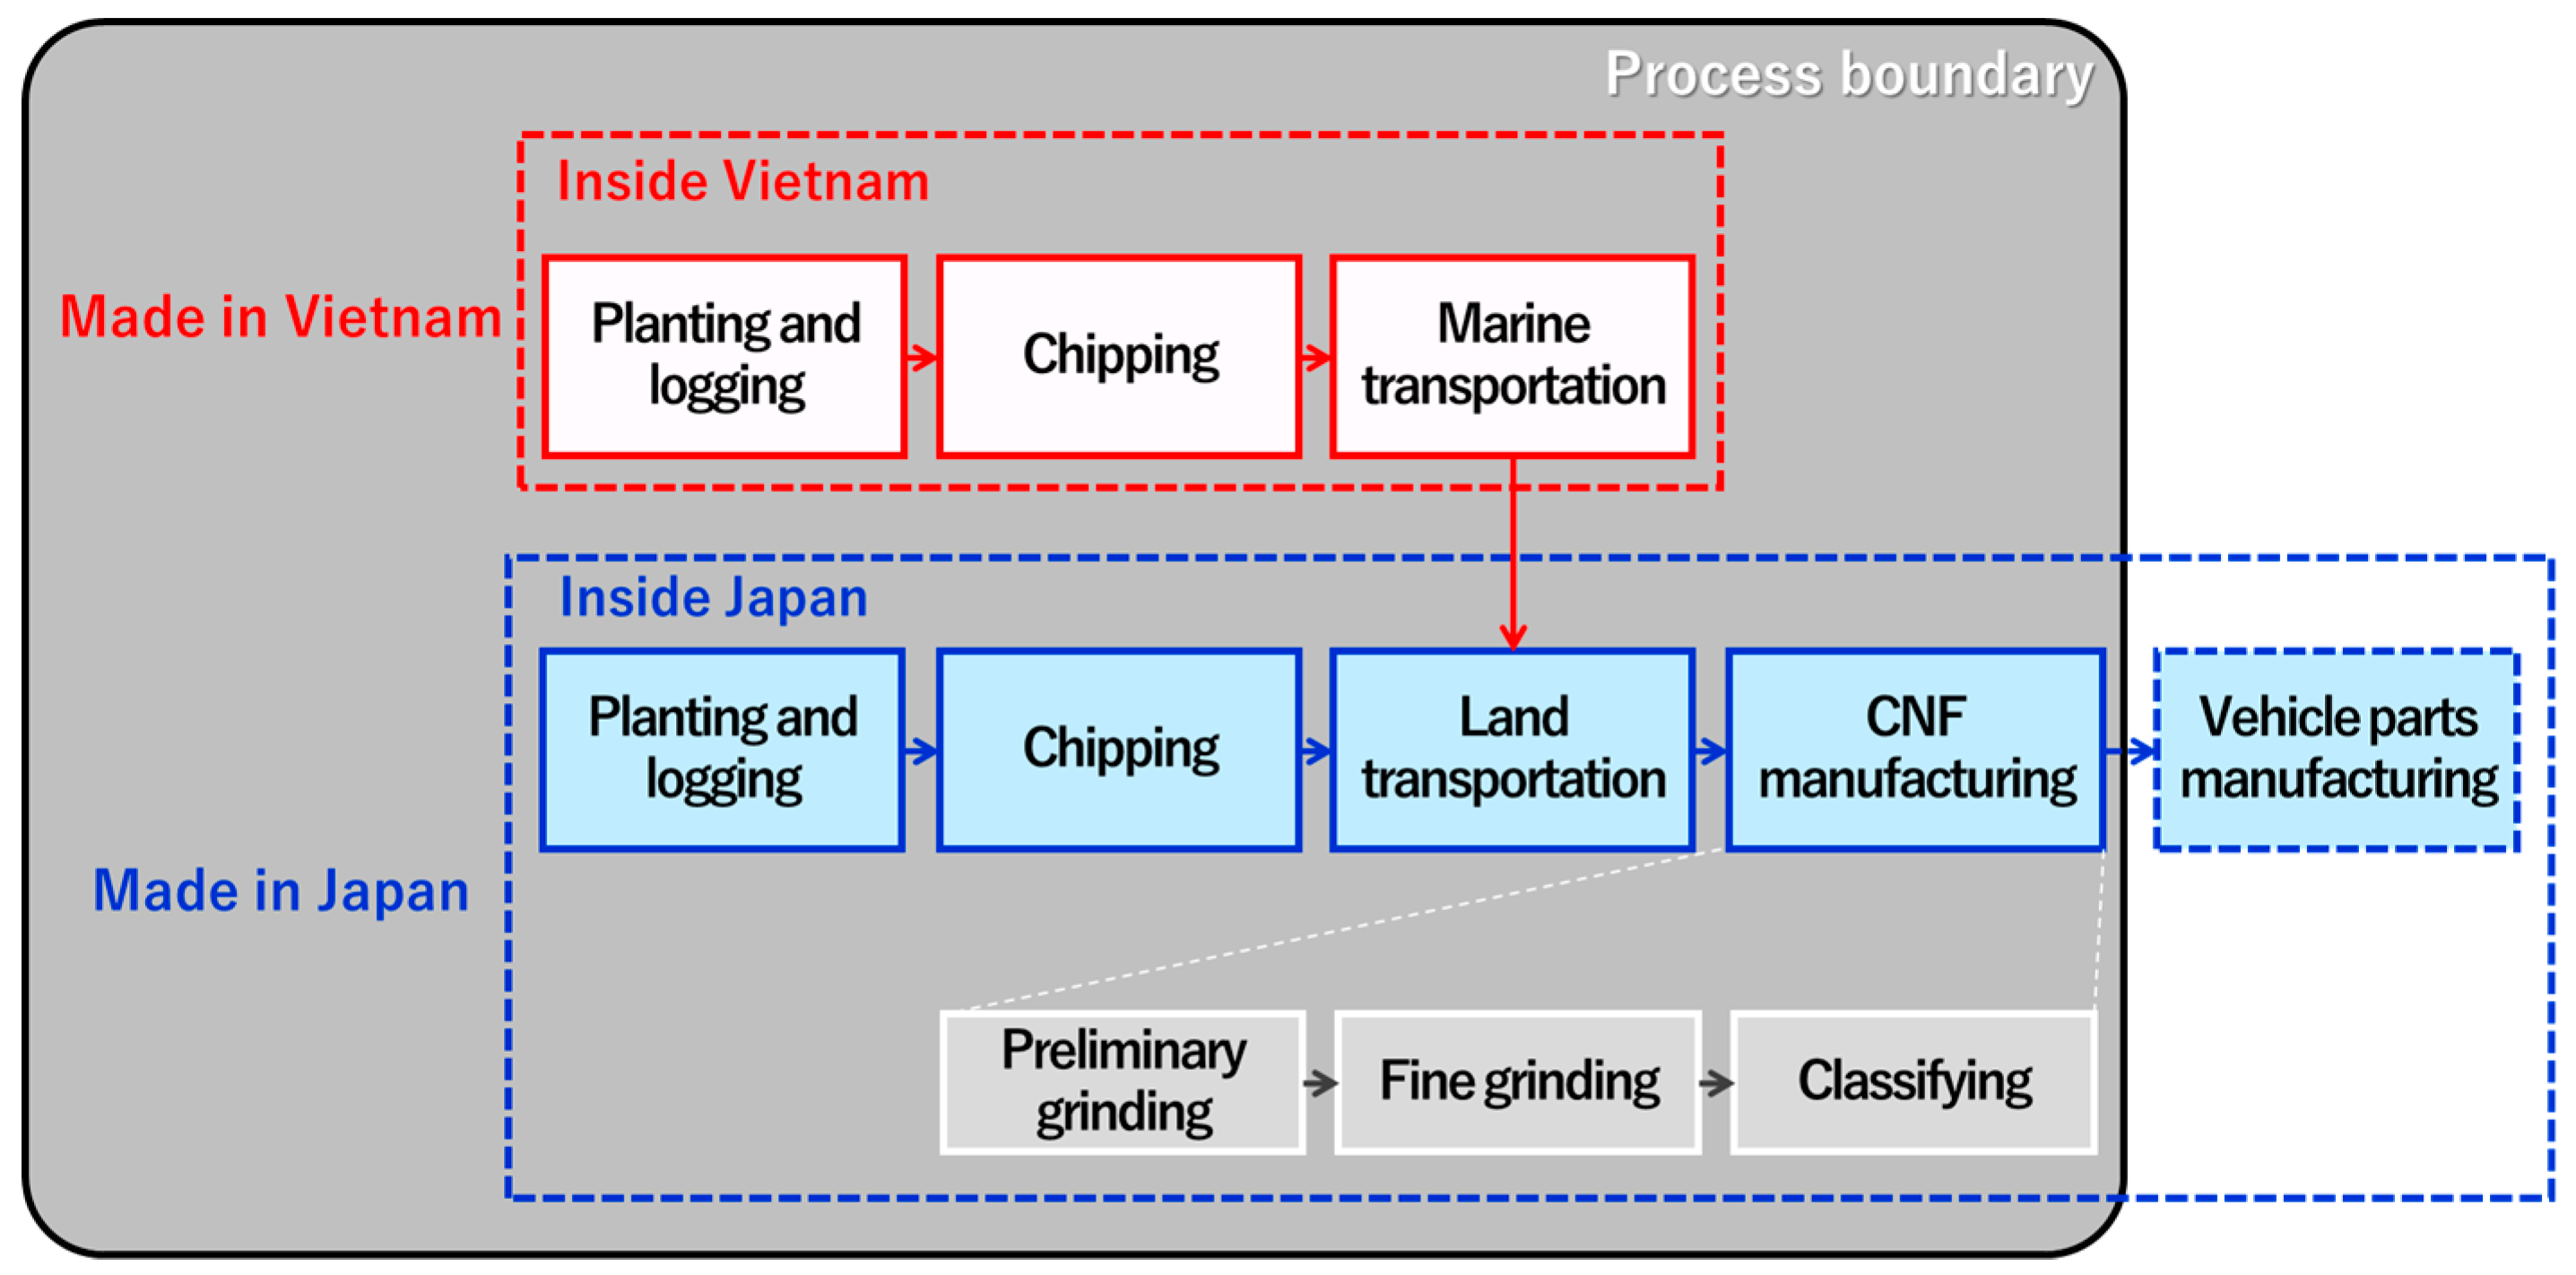
2.1. Process Boundaries

The process boundaries for the CNF life cycle were divided into four stages, as shown in Figure 1: (1) planting and logging; (2) chipping; (3) transportation; and (4) CNF manufacturing. The stage of CNF manufacturing using the mechanochemical method can be further divided in three sub-stages: (1) preliminary grinding; (2) fine grinding; and (3) classifying.
To estimate social risk, the marine transport stage required to import the raw material from Vietnam is added as an additional stage.

2.2. Preconditions

Table 1 shows the amount of logging residues needed for the manufacturing of 1 kg of dried CNF (1 dry kg) and the set as a basic unit for quantifying environmental, economic, and social impact in this study. Related information such as moisture content and yield rate was obtained from company executives and from Moon et al. [9]. To produce 1 kg of CNFs, approximately 2.9 wet ton of logging residue is needed as a feedstock. This amount was calculated considering the moisture content of the logging residue, yield rate of wood chips made from the logging residue, and yield rate of CNFs made from the wood chips. The calculations assumed that the plant producing the CNFs to have a production capacity of 40 tons.

2.3. Estimating GHG Emissions

LCA was used as to estimate the GHG emissions associated with the manufacturing of CNFs from logging residues. Total GHG emissions ( G h g _ T ), including the emissions during planting and logging ( G h g _ 1 ) , chipping ( G h g _ 2 ) , transportation ( G h g _ 3 ) , and CNF manufacturing ( G h g _ 4 ) , was calculated as:
G h g _ T = s = 1 n G h g _ S   ( S = 1 ,   2 ,   3 ,   4 )
where G h g _ T is the total GHG emissions per kg of CNF production (kg CO2eq/kg CNF); G h g _ S is the amount of GHG emissions per kg of CNF production during stage S of CNF production ( S = 1 ,   2 ,   3 ,   and   4 are the planting and logging, chipping, transport, and CNF manufacturing stages, respectively).
The amount of GHG emissions in the planting and logging stage ( G h g _ 1 ) was calculated by multiplying the quantity of logging residues use ( Q r e s i d u e s ) by the unit energy consumption in the planting and logging stage ( E C l o g g i n g ) and the GHG emissions efficient for diesel, which is the main energy source in the planting and logging stage ( c _ g h g d i e s e l ):
G h g _ 1 = Q r e s i d u e s × ( E C l o g g i n g 1000 ) × c _ g h g d i e s e l
where G h g _ 1 is the amount of GHG emissions per kg of CNF production in the planting and logging stage (kg CO2eq/kg CNF); Q r e s i d u e s is the quantity of logging residues used to generate 1 kg of CNFs (wet kg/kg CNF); E C l o g g i n g is the unit energy consumption in the planting and logging stage (L/kg); c _ g h g d i e s e l is the GHG emissions coefficient of diesel (kg CO2eq/L) based on the Japan Environmental Management Association for Industry (JEMAI) [12].
The amount of GHG emissions in the chipping stage ( G h g _ 2 ) was calculated as shown in Equation (3):
G h g _ 2 = Q r e s i d u e s × ( E C c h i p p i n g 1000 ) × c _ g h g d i e s e l
where G h g _ 2 is the amount of GHG emissions per a kg of CNF production in the chipping stage, and E C c h i p p i n g is the unit energy consumption in the chipping stage. The main source of energy during chipping is diesel, as for planting and logging.
The amount of GHG emissions in the transportation stage ( G h g _ 3 ) was calculated using Equation (4):
G h g _ 3 = Q w e t c h i p × T D f t f × ( E C t r a n s p o r t a t i o n 1000 ) × c _ g h g d i e s e l
where G h g _ 3 is the amount of GHG emissions per kg of CNF production in the transportation stage; Q w e t c h i p is the quantity of wood chips required for the production of 1 kg of CNF production (wet kg/kg CNF); T D f t f is the transportation distance from forest to factory (km); and E C t r a n s p o r t a t i o n is the unit energy consumption of CNF production during the transportation stage (0.059 L/ton CNF km [13]). Ghg_3 was evaluated using the TON-KM method suggested by the Japanese government (METI and MLTI, 2006). The TON-KM method is a standard way to estimating CO2 emissions caused by truck transport. T D f t f was based on a NEDO research report [14]. E C t r a n s p o r t a t i o n was determined assuming an eight-ton dump truck at 60% loading rate [13].
The amount of GHG emissions in the CNF manufacturing stage was calculated by summing the GHG emissions of the three stages of CNF manufacturing (preliminary grinding, fine grinding, and the classifying), as shown in Equation (5):
G h g _ 4 =   l = 1 n G h g 4 l   ( l = 1 ,   2 ,   3 ) ,
where G h g _ 4 is the amount of GHG emissions per kg of CNF production during CNF manufacturing (kg CO2eq/kg CNF); G h g 4 l is the amount of GHG emissions per kg of CNF production at stage l of the CNF manufacturing stage (l = 1, 2 and 3 correspond to preliminary grinding, fine grinding, and classifying, respectively). G h g 4 1 , G h g 4 2 , and G h g 4 3 were calculated by multiplying the quantity of wood chips used by the unit energy consumption of each manufacturing level ( E C C N F _ m a n u f a c t u r i n g p r e l i m i n a r y ,   E C C N F _ m a n u f a c t u r i n g f i n e   g r i n d i n g ,   and   E C C N F _ m a n u f a c t u r i n g c l a s s i f y i n g ) and the GHG emissions coefficient for electricity ( c _ g h g e l e c t r i c i t y ):
G h g 4 1 = Q d r y c h i p × ( E C C N F m a n u f a c t u r i n g p r e l i m i n a r y 1000 ) × c g h g e l e c t r i c i t y
G h g 4 2 = Q d r y c h i p × ( E C C N F m a n u f a c t u r i n g f i n e   g r i n d i n g 1000 ) × c g h g e l e c t r i c i t y
G h g 4 3 = Q d r y C N F × ( E C C N F m a n u f a c t u r i n g c l a s s i f y i n g 1000 ) × c g h g e l e c t r i c i t y
where Q d r y c h i p is the quantity of wood chips used to generate 1 kg of CNFs (dry kg/kg CNF), and Q d r y C N F is the quantity of CNFs produced (kg).
The values of unit energy consumption and the GHG emissions coefficient used in all calculations are shown in Table 2. Data related to the energy consumption coefficient for the CNF manufacturing stage were obtained from the executives of companies that produce CNFs. The GHG emissions produced by light diesel oil and electricity were obtained from the Inventory Database for Environmental Analysis (IDEA). IDEA is a total database of GHG emissions from different raw materials and was developed by the National Institute of Advanced Industrial Science and Technology in coordination with JEMAI [12]. In IDEA, the six primary Kyoto GHGs, carbon dioxide (CO2), methane (CH4), nitrous oxide (N2O), sulfur hexafluoride (SF6), hydrofluorocarbons (HFCs), and perfluorocarbons (PFCs), are translated into CO2equivalents (CO2eq) using global warming potential values provided by the Intergovernmental Panel on Climate Change in 1995.

2.4. Calculating Manufacturing Cost

The total manufacturing costs associated with planting and logging ( C o s t _ 1 ) , chipping ( C o s t _ 2 ) , transportation ( C o s t _ 3 ) , and CNF manufacturing ( C o s t _ 4 ) were calculated as in Equation (9):
C o s t _ T = s = 1 n C o s t _ S   ( S = 1 ,   2 ,   3 ,   4 )
where C o s t _ T is the total cost in Japan Yen (JPY) per kg of CNF production (JYP/kg CNF), and C o s t _ S is the cost in stage S of CNF production.
The manufacturing costs in the planting and logging stage ( C o s t _ 1 ), chipping stage ( C o s t _ 2 ), and transportation stage ( C o s t _ 3 ; JPY/kg CNF) were computed by multiplying the quantity of logging residue needed to produce one kg of CNFs by the unit cost for each stage ( U C l o g g i n g , U C c h i p p i n g , and U C t r a n s p o r t a t i o n , respectively; JPY/kg), as shown Equations (10)–(12):
C o s t _ 1 = Q r e s i d u e s × U C l o g g i n g
C o s t _ 2 = Q r e s i d u e s × U C c h i p p i n g
C o s t _ 3 = Q w e t c h i p × U C t r a n s p o r t a t i o n
where Q r e s i d u e s is the quantity of logging residue used to generate 1 kg of CNF production (wet kg/kg CNF), and Q w e t c h i p is the quantity of wet wood chips used to generate 1 kg of CNFs (wet kg/kg CNF).
In the CNF manufacturing stage, the manufacturing cost ( C o s t _ 4 ; JPY/kg CNF) was calculated by summing the manufacturing costs of the above three stages, as shown in Equation (13):
C o s t _ T = l = 1 n C h g 4 l   ( l = 1 ,   2 ,   3 )
where G H G 4 l is the amount of GHG emissions per kg of CNF production during level l of CNF manufacturing (l = 1, 2, and 3 correspond to preliminary grinding, fine grinding, and classifying, respectively).
The manufacturing costs for each process of CNF manufacturing ( C o s t 4 1 , C o s t 4 2 , and C o s t 4 3 ) were calculated by dividing the expense for each level of stage 4 ( E 4 1 ,   E 4 1 ,   and   E 4 3 ; JPY/kg CNF) by the total quantity of CNFs produced, as shown in Equations (14)–(16):
C o s t 4 1 = E 4 1 / P Q C N F / 1000
C o s t 4 2 = E 4 2 / P Q C N F / 1000
C o s t 4 3 = E 4 3 / P Q C N F / 1000
where P Q C N F is the total quantity of CNFs produced (ton). The expense for each level of stage 4 was determined by summing eight individual expenditures: the cost of raw materials, cost of fuel (e.g., light diesel oil and electricity), depreciation, personnel expenses, maintenance costs, cost of debt redemption, annual fixed asset costs, and general management costs. These costs were obtained from the executives of companies that produce CNFs. The calculations assumed that CNF manufacturing hours were eight hours a day for 250 days a year.
The fixed expenses (depreciation, personnel expenses, maintenance costs, cost of debt redemption, annual fixed asset costs, and general management costs) account for approximately 82% of total expenditures. The fixed expenses were not divided into each level of the CNF production stage as were the variable costs (the cost of raw materials and cost of fuel expenses). The fixed expenses for each level was determined by dividing the total fixed expense by the number of level of stage. Table 3 shows the cost for each stage used to calculate the expenditures.

2.5. Assessing Potential Social Impact

SLCA is a social impact or potential impact assessment technique that evaluates the social and socio-economic aspects of products and their potential positive and negative effects along the product’s life cycle, including the extraction and processing of raw materials [16]. However, the assessment ability of SLCA is limited because of the lack of information to organize, measure, and quantify the various social phenomena. Despite these difficulties, assessing the social impacts of products can be a valuable tool to understand the effect of a product on society.
The United Nations Environment Programme (UNEP) and Society of Environmental Toxicology and Chemistry (SETAC) produced guidelines for SLCA assessment (SLCA guidelines). The SLCA guidelines propose a methodology for assessing the social and socio-economic impacts of a product, process, or activity throughout its life cycle, from the extraction of raw materials to processing, transport, use, and disposal. In the SLCA guidelines, stakeholders and its impact categories are set as socio-economic subcategories of inventory indicators to support further the identification of stakeholders [16]. Particularly, stakeholder categories, i.e., the parent category that includes the child category, are divided into the following five categories: worker, consumer, local community, society, and value chain actors that do not include consumers (value chain actors). The impact categories, i.e., the child category belonging to stakeholder category of the parent category, is divided into 31 subcategories.
Based on the SLCA guidelines, the social hotspots database (SHDB) and PSILCA were developed as comprehensive databases for evaluating the social impacts of products throughout their life cycles [17,18]. To provide insights into the global supply chain related to a product’s life cycle, SHDB and PSILCA are commonly used as global input–output (IO) databases that are linked to information on all countries of the world’s economy. Through the IO database, it is possible to trace the worker hours and social risks associated with global industrial activities. In addition, potential social impacts related to industrial activities can be deduced based on information from various world agencies, international statistics, and other documents. Although the methodologies used to analyze SHDB and PSILCA are similar, the social indicators and the evaluation criteria for assessing potential social impacts differ slightly. For the SHDB developed by New Earth, 22 social theme tables by country and economic sector, along with 134 social indicators have been established for determining potential social impacts based on over 200 reputable sources of statistical (e.g., the World Health Organization and International Labor Organization) [17]. Potential social impacts can be graded on a five-tier scale: undefined risk level (URL), low risk (LR), medium risk (MR), high risk (HR), and very high risk (VHR). PSILCA, produced by Green Delta, with four affected stakeholder groups, 17 subcategories for social topics, and 55 qualitative and quantitative indicators has been composed as social indicators for potential social impacts used from the raw data like as the UN’s system of national accounts and COMTRADE databases, Eurostate, IDE/JETRO, and numerous national agencies [18]. Here, potential social impact is categorized into two large divisions: (1) potential risk, which is divided into six risk levels (no risk, very low risk, low risk, medium risk, high risk, and very high risk); and (2) potential opportunity, which is classified into three opportunity levels (high opportunity, medium opportunity, and low opportunity).
The social impact categories used in SHDB and PSILCA are compared with the social indicators in the SLCA guidelines of UNEP/SETAC in Table 4. The social indicators categorized in SHDB emphasize the living conditions for human beings, particularly workers. Thus, the contents are related to all aspects of society, including labor rights, human rights for the weak in society, health and safety, transparency of the administrative procedure and the legal system, and community infrastructure. In PSILCA, the social indicators are mainly based on the SLCA guidelines and focus on social issues affecting stakeholders such as workers, value chain actors, the local community, and society. Social indicators related to the local community include the socio-economic contributions to the local community in terms of the use of local resources and local employment.
This study aims to assess the impacts of CNFs along their entire life cycle on local communities in which a woody biomass material, such as logging residue, can be harvested. Therefore, PSILCA was used to assess the social impacts to the local community.

3. Results and Discussion

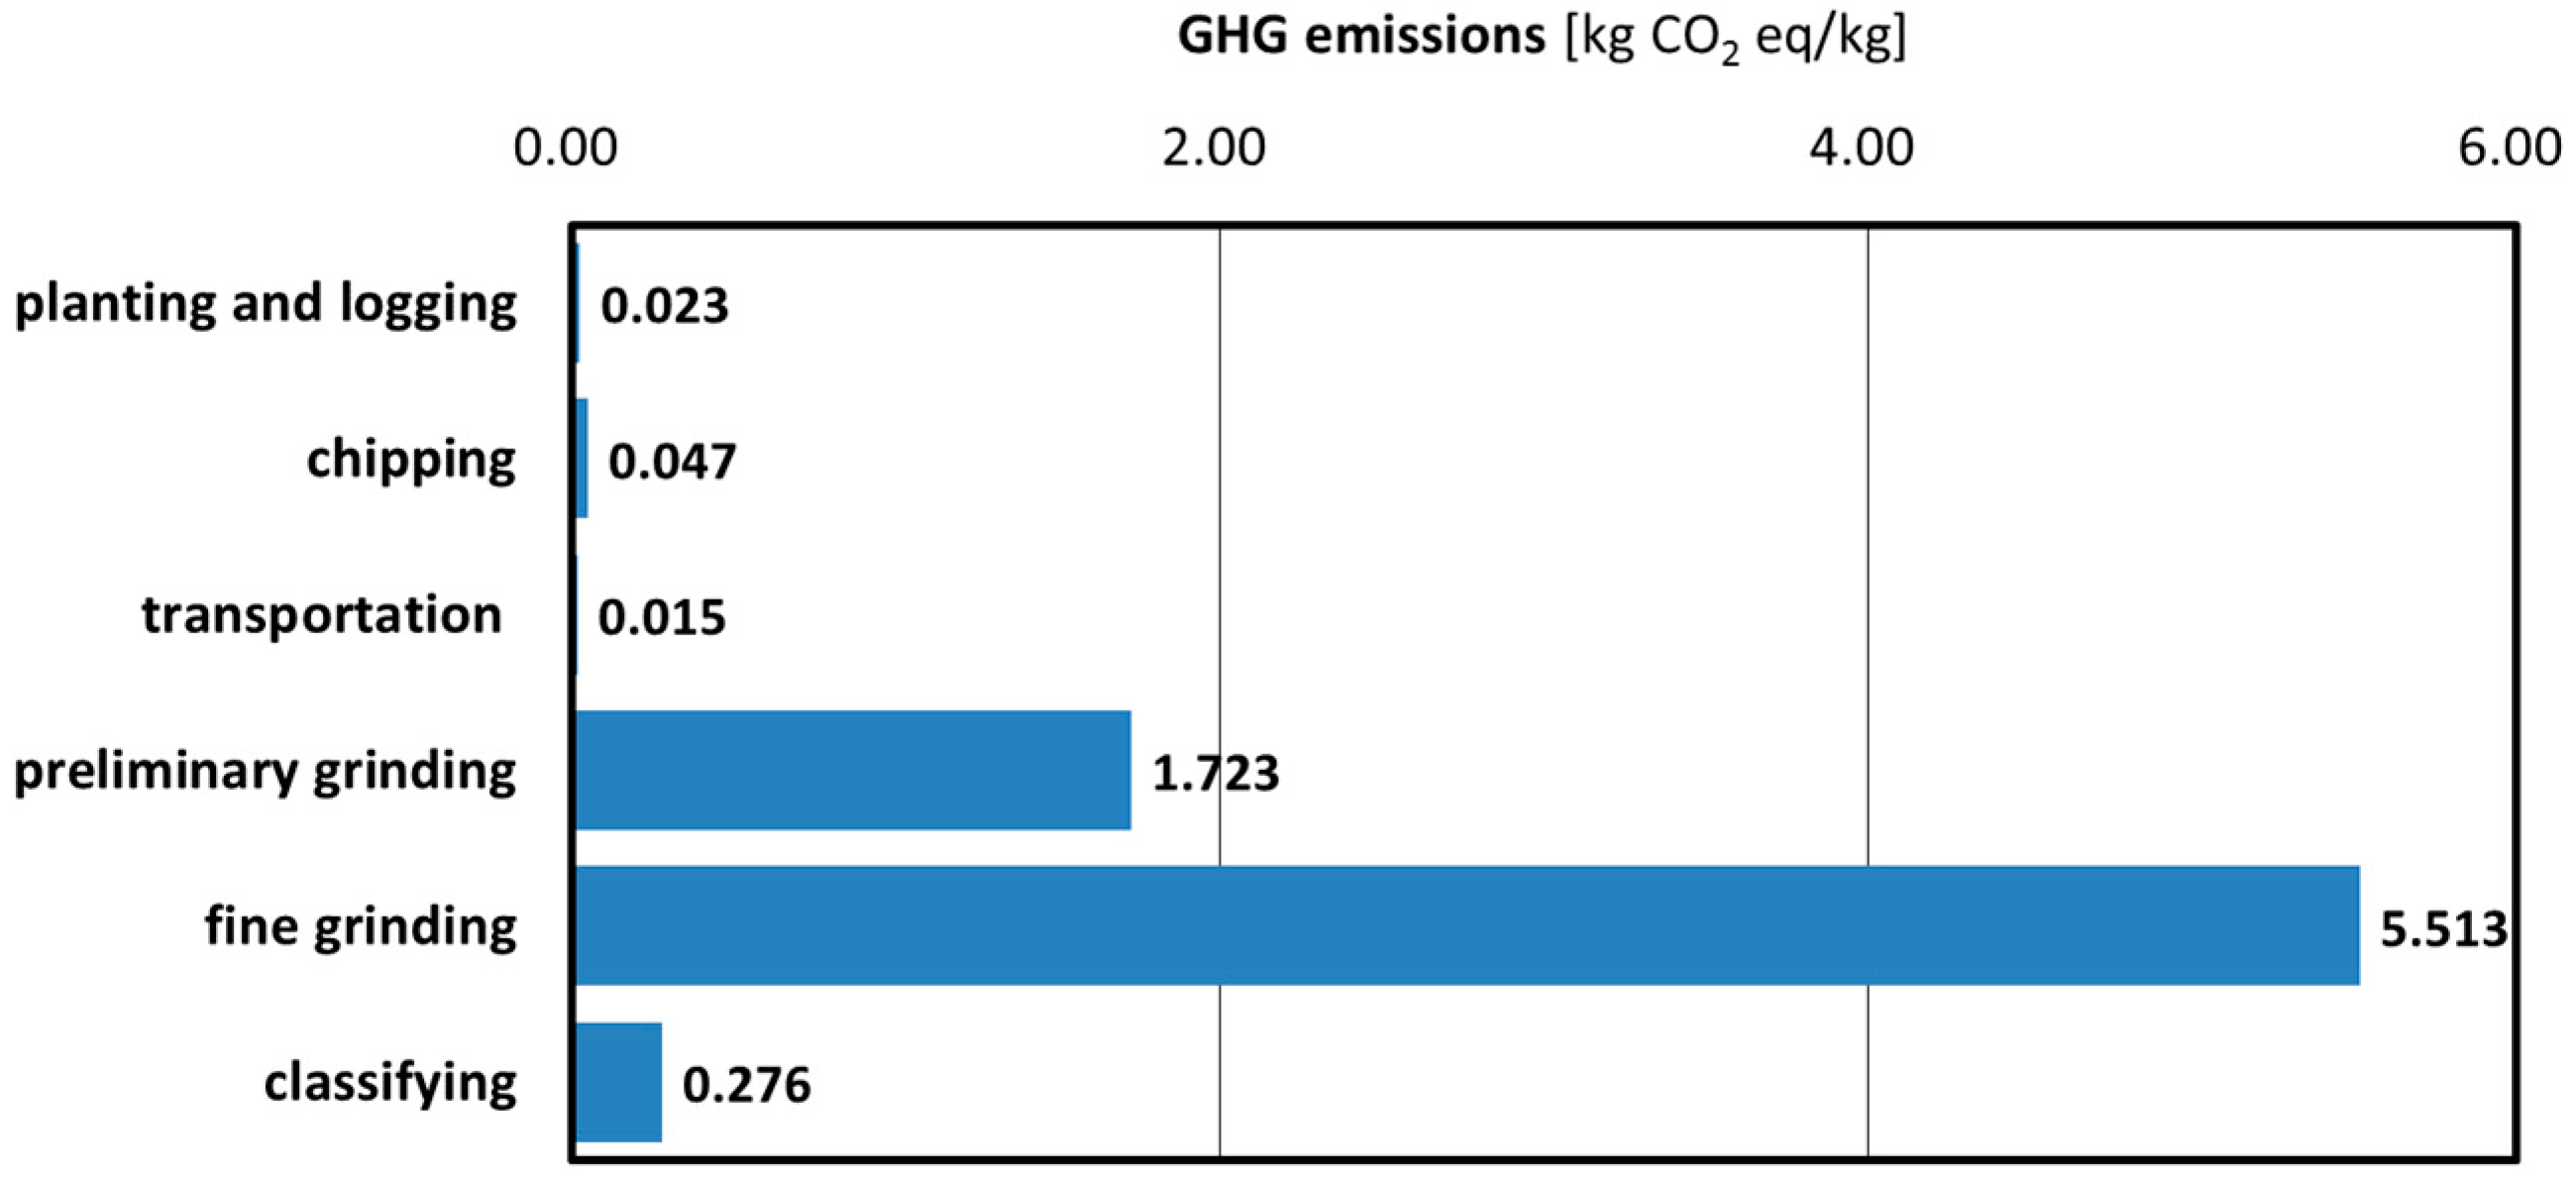
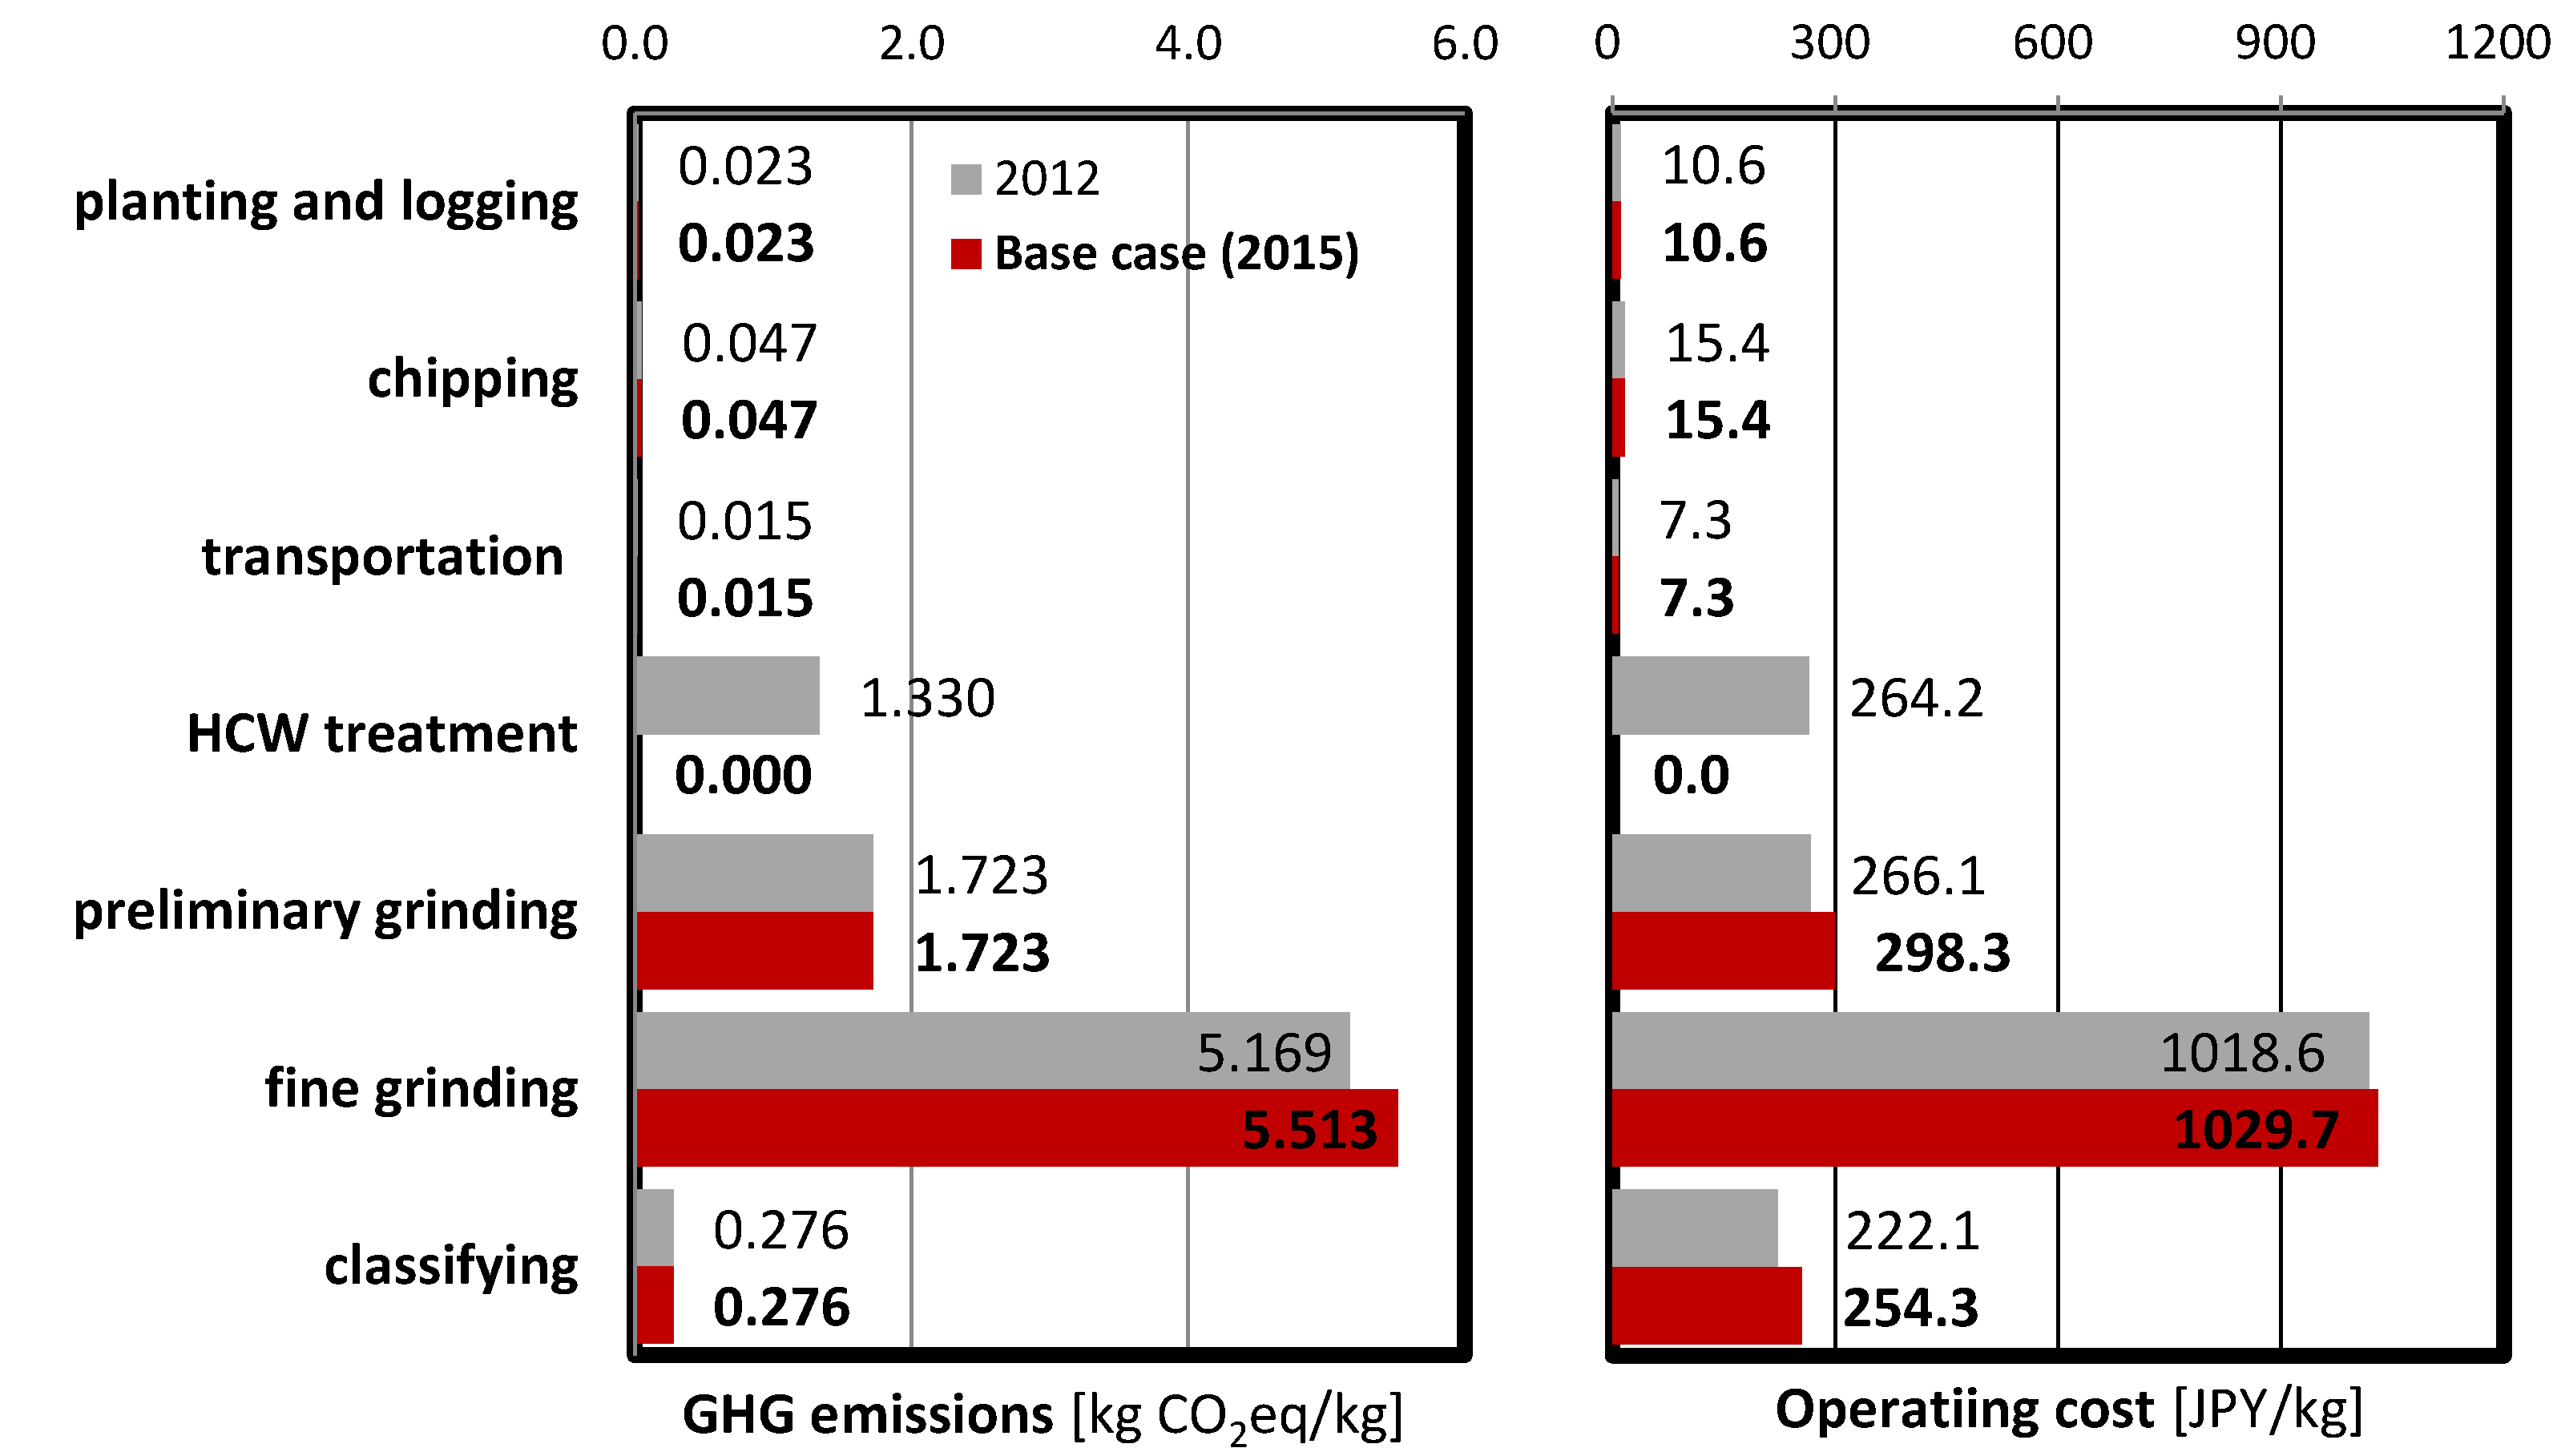
3.1. Environmental Impact: GHG Emissions

The amount of GHG emissions in each stage of CNF production is shown in Figure 2. The GHG emissions for the planting and logging stage, chipping stage, and transportation stage were 0.023, 0.047, and 0.015 kg CO2eq/kg, respectively. The emissions for the three sub-stages of the CNF manufacturing stage (preliminary grinding, fine grinding, and classifying) were 1.723, 5.513, and 0.276 kg CO2eq/kg, respectively. This study assessed GHG emissions for CNFs produced by the mechanochemical methods; in this production methodology, the greatest GHG emissions are associated with preliminary grinding, fine grinding, and electricity consumption.
The total amount of GHG emissions for the entire manufacturing process of 1 kg of CNFs was approximately 7.597 kg CO2eq/kg, as shown in Figure 3. The total amount of GHG could be 5.76 kg CO2eq/CNF kg, by excluding the approximate value of 1.83 kg CO2eq/kg, which are examined under the assumption that the carbon content is 50% from the total weight of CNF (Figure 3) [6,19].
Figure 3 compares the GHG emissions from CNFs and five plastic resins, polypropylene (PP), acrylonitrile butadiene styrene (ABS), polycarbonate (PC), polyvinyl chloride (PVC), and polybutylene terephthalate (PBT), which are the most commonly used in plastic parts in automobiles [20]. The consumption rates of PP, ABS, PC, PVC, and PBT in automobiles are 42.7%, 7.3%, 4.5%, 3.1%, and 2.9%, respectively [20].
The GHG emissions from PP, ABS, PC, PVC, and PBT were 1.782, 3.277, 8.207, 3.389, and 8.207 kg CO2eq/kg, respectively [12]. The GHG emissions of CNFs were higher than those of the plastic resins except PC, even though C-fixation is considered as one of the factors for determining the GHG emissions of CNFs.
However, because CNFs are used to reinforce plastic resins, the total amount of plastic components can be decreased by adding CNFs instead of a certain amount of plastic resins [20]. Moreover, the reduction in the total amount of plastic component is linked to a reduction in the total volume of the vehicle; thus, a decrease in GHG emissions resulting from an increase in fuel economy can be expected [10].

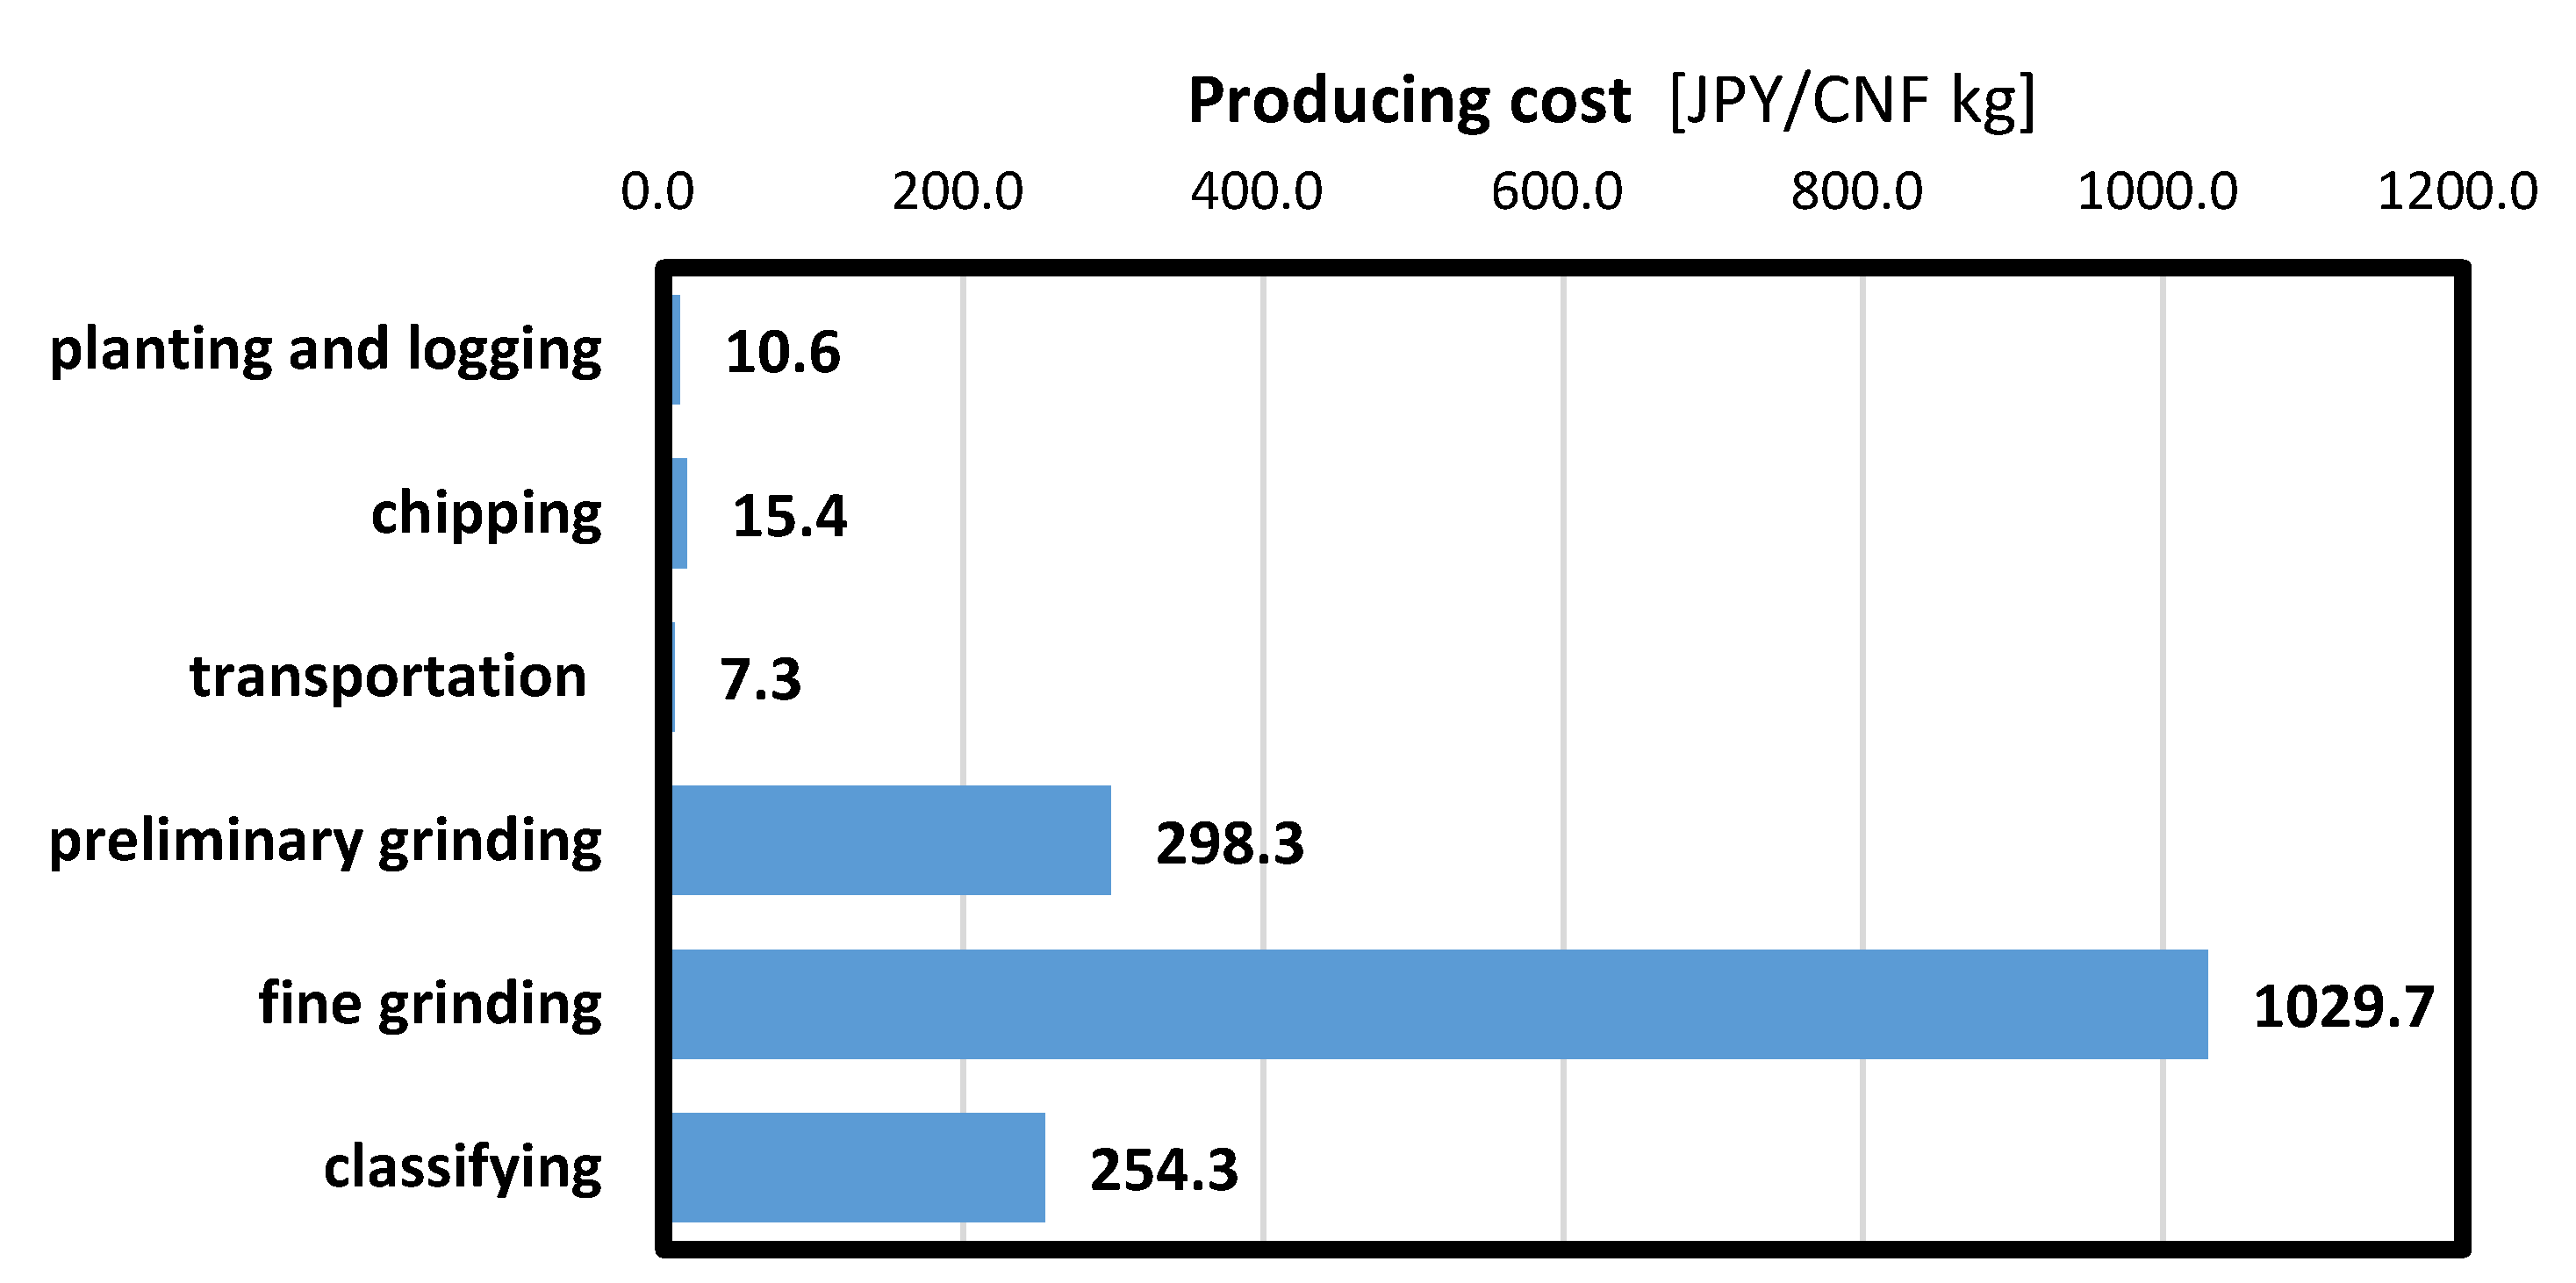
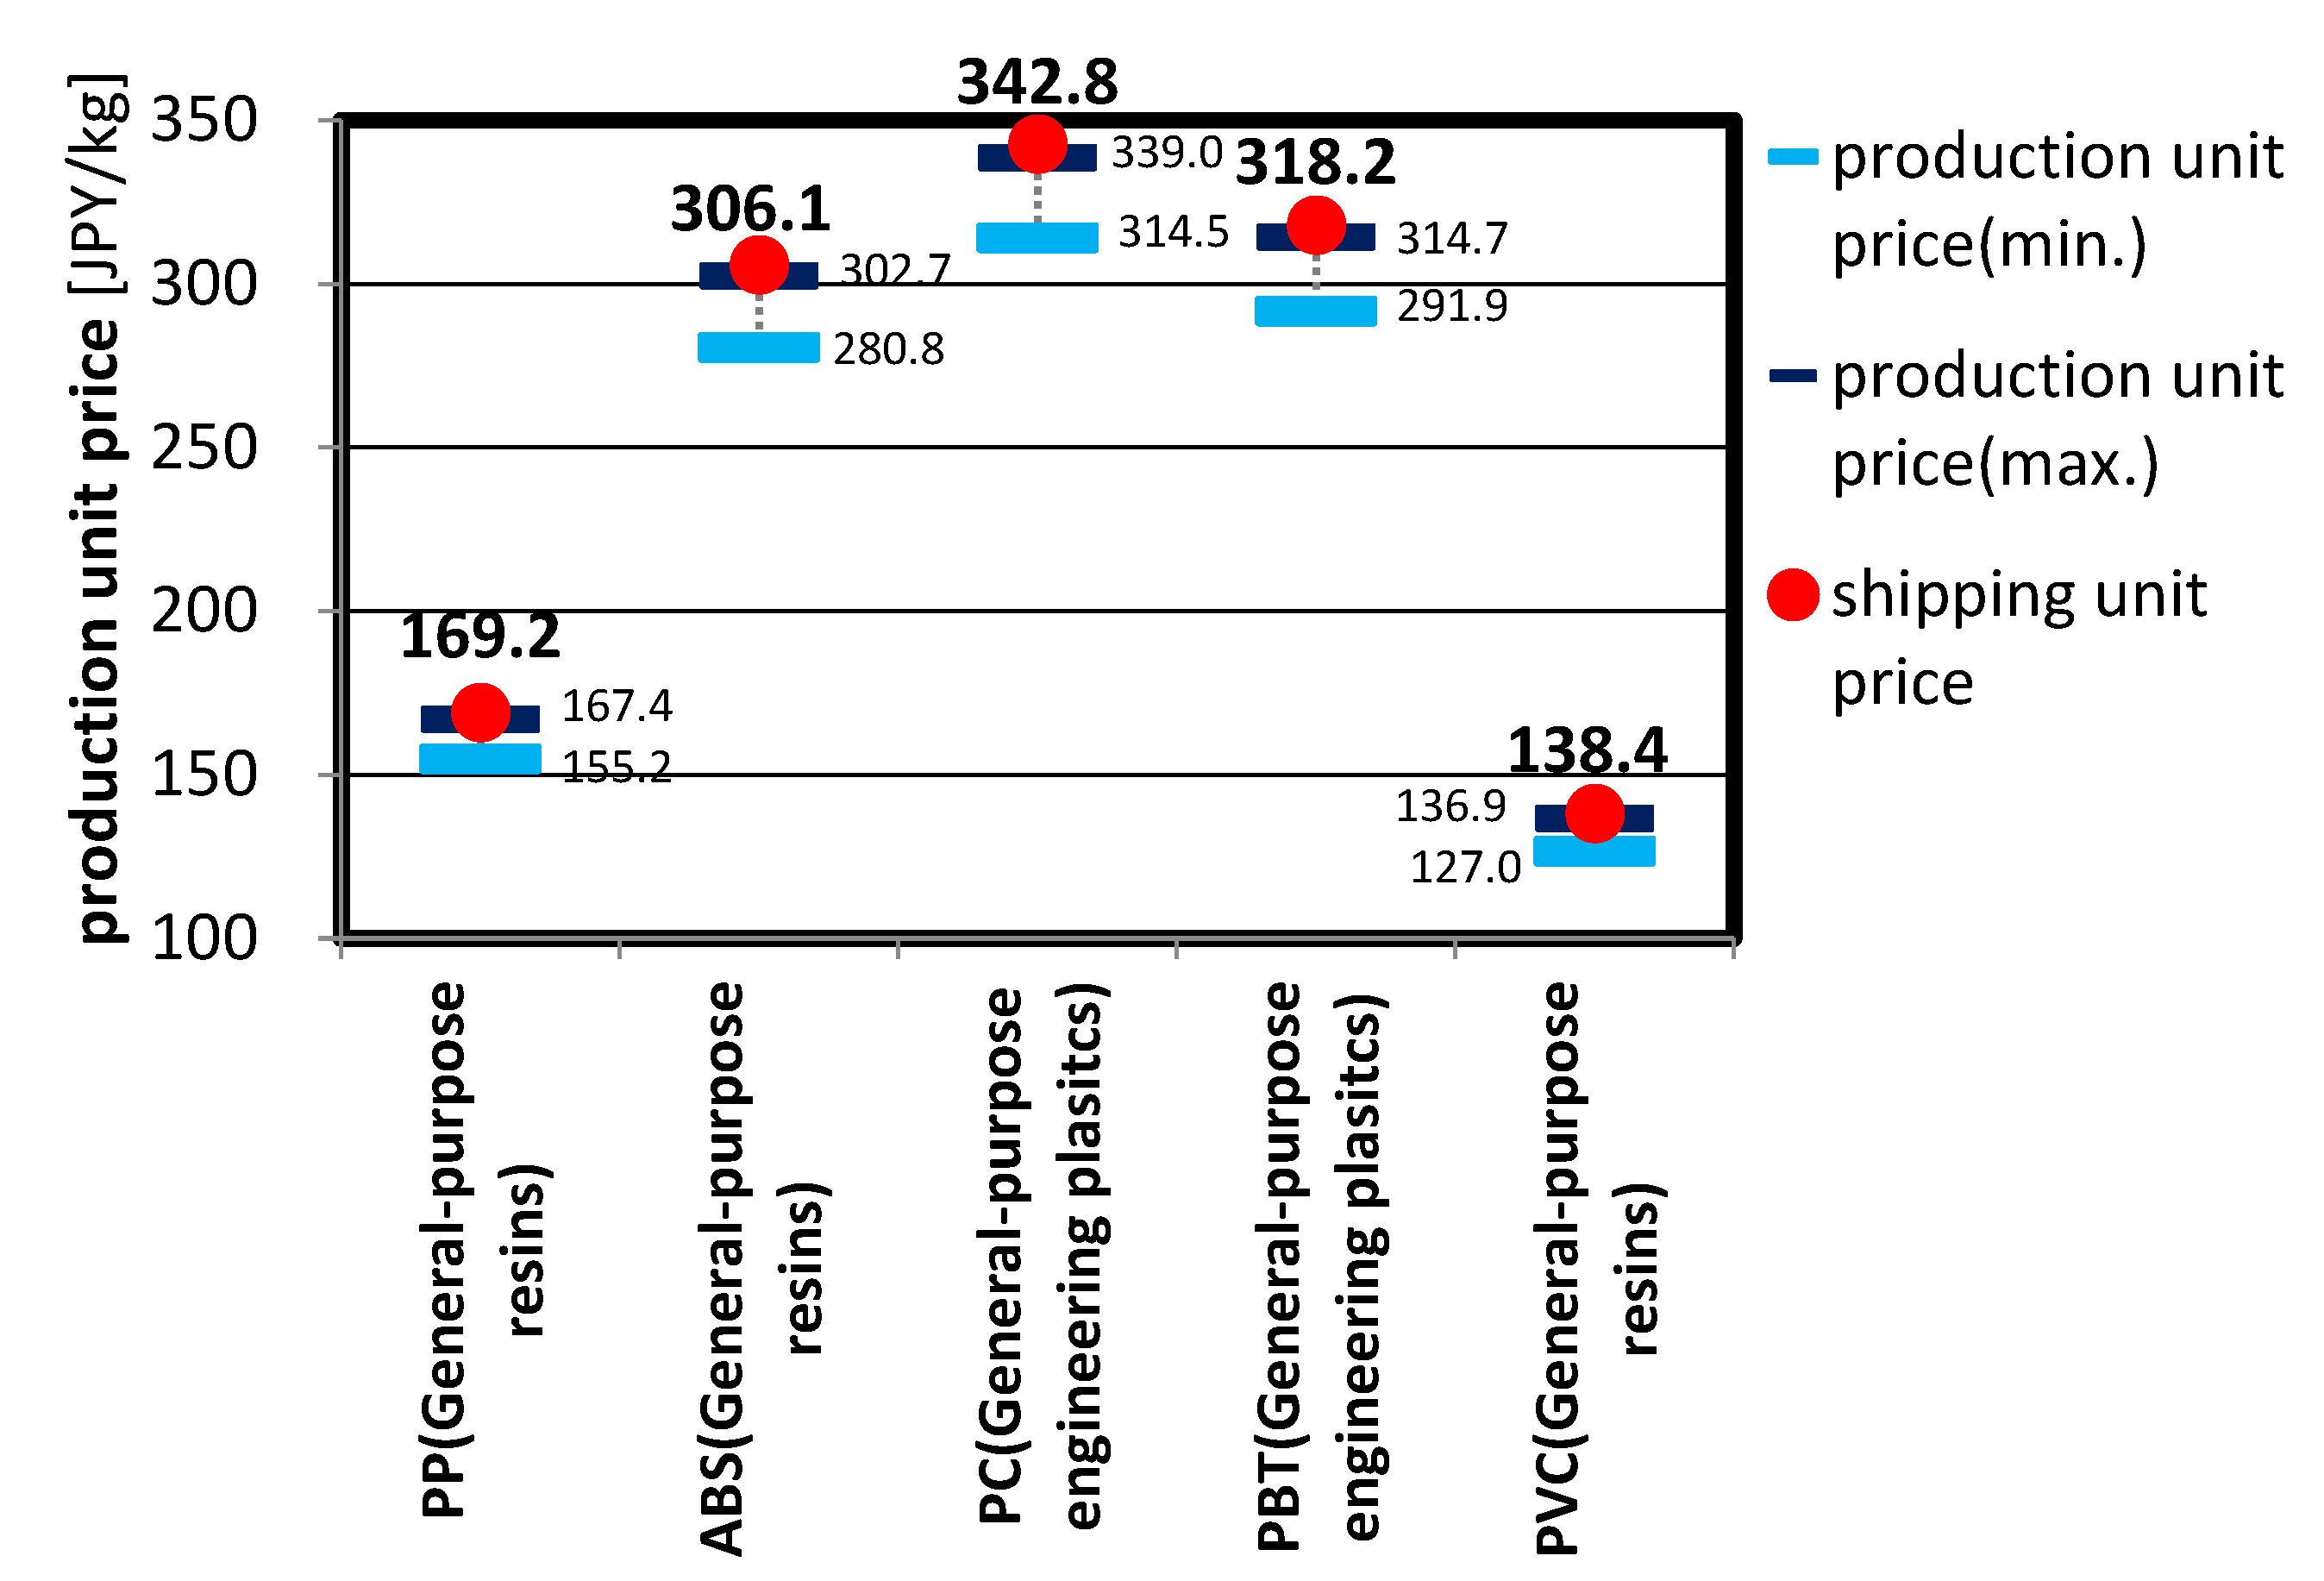
3.2. Economic Impact: Manufacturing Cost

The manufacturing cost of each stage of CNF production is shown in Figure 4. The total manufacturing cost was 1615.6 JPY/CNF kg. The costs for the planting and logging stage, chipping stage, and transportation stage were 10.6, 15.4, and 7.3 JPY/CNF kg, respectively. The costs of the three sub-stages of CNF manufacturing (preliminary grinding, fine grinding, and classifying) were 298.3, 1029.7, and 254.3 JPY/CNF kg, respectively. As for the environmental impacts in Section 3.1, the manufacturing costs were the highest in the preliminary grinding and fine grinding stages.
The production unit prices and shipping unit prices for PP, ABS, PC, PVC, and PBT based on 2015 METI statistics [21] are shown in Figure 5. The shipping unit prices ranged from 138.42 to 342.79 JPY/CNF kg, and the range of production unit prices was 126.98 to 339.01 JPY/CNF kg, accounting for approximately 8.6–21.2% of the total production price for CNF, which is not as stable as the specific markets that are established.

3.3. Sensitivity Analysis: Potential Improvements in Environmental and Economic Efficiency

The changes in GHG emissions and manufacturing cost between 2012, the year when CNF manufacturing began, and 2015 are shown in Figure 6. The GHG emissions and manufacturing cost decreased by approximately 13.0% and 1.7%, respectively, from 2012 to 2015 as a result of eliminating the hot-compressed water treatment stage from the CNF production process.
The efficiency of GHG emissions and manufacturing cost also can be improved by 0.2% and 0.4%, respectively, compared to the base year of 2015, by increasing the yield rate from 0.8 to 1.0. Moreover, greater reductions in GHG emissions and manufacturing cost can be expected by improving the energy consumption efficiency in the preliminary and fine grinding stages by two to five times, as shown in Figure 7.
By increasing the energy consumption efficiency from two to five times in the two stages, the GHG emissions can be decreased by between 19.1% and 76.4% compared to 2012 levels, in which the maximum emission level was similar to that of PP (1.8 kg CO2eq/CNF kg). At the same time, the manufacturing cost can be expected to be reduced between 3.6% and 12.2% from 1419.1 JPY/CNF kg in 2015 by enhancing the energy consumption efficiency by two to five times. Since fixed costs account for ca. 80% of the total manufacturing cost, it is difficult to achieve large reductions in manufacturing costs without large-scale CNF production.

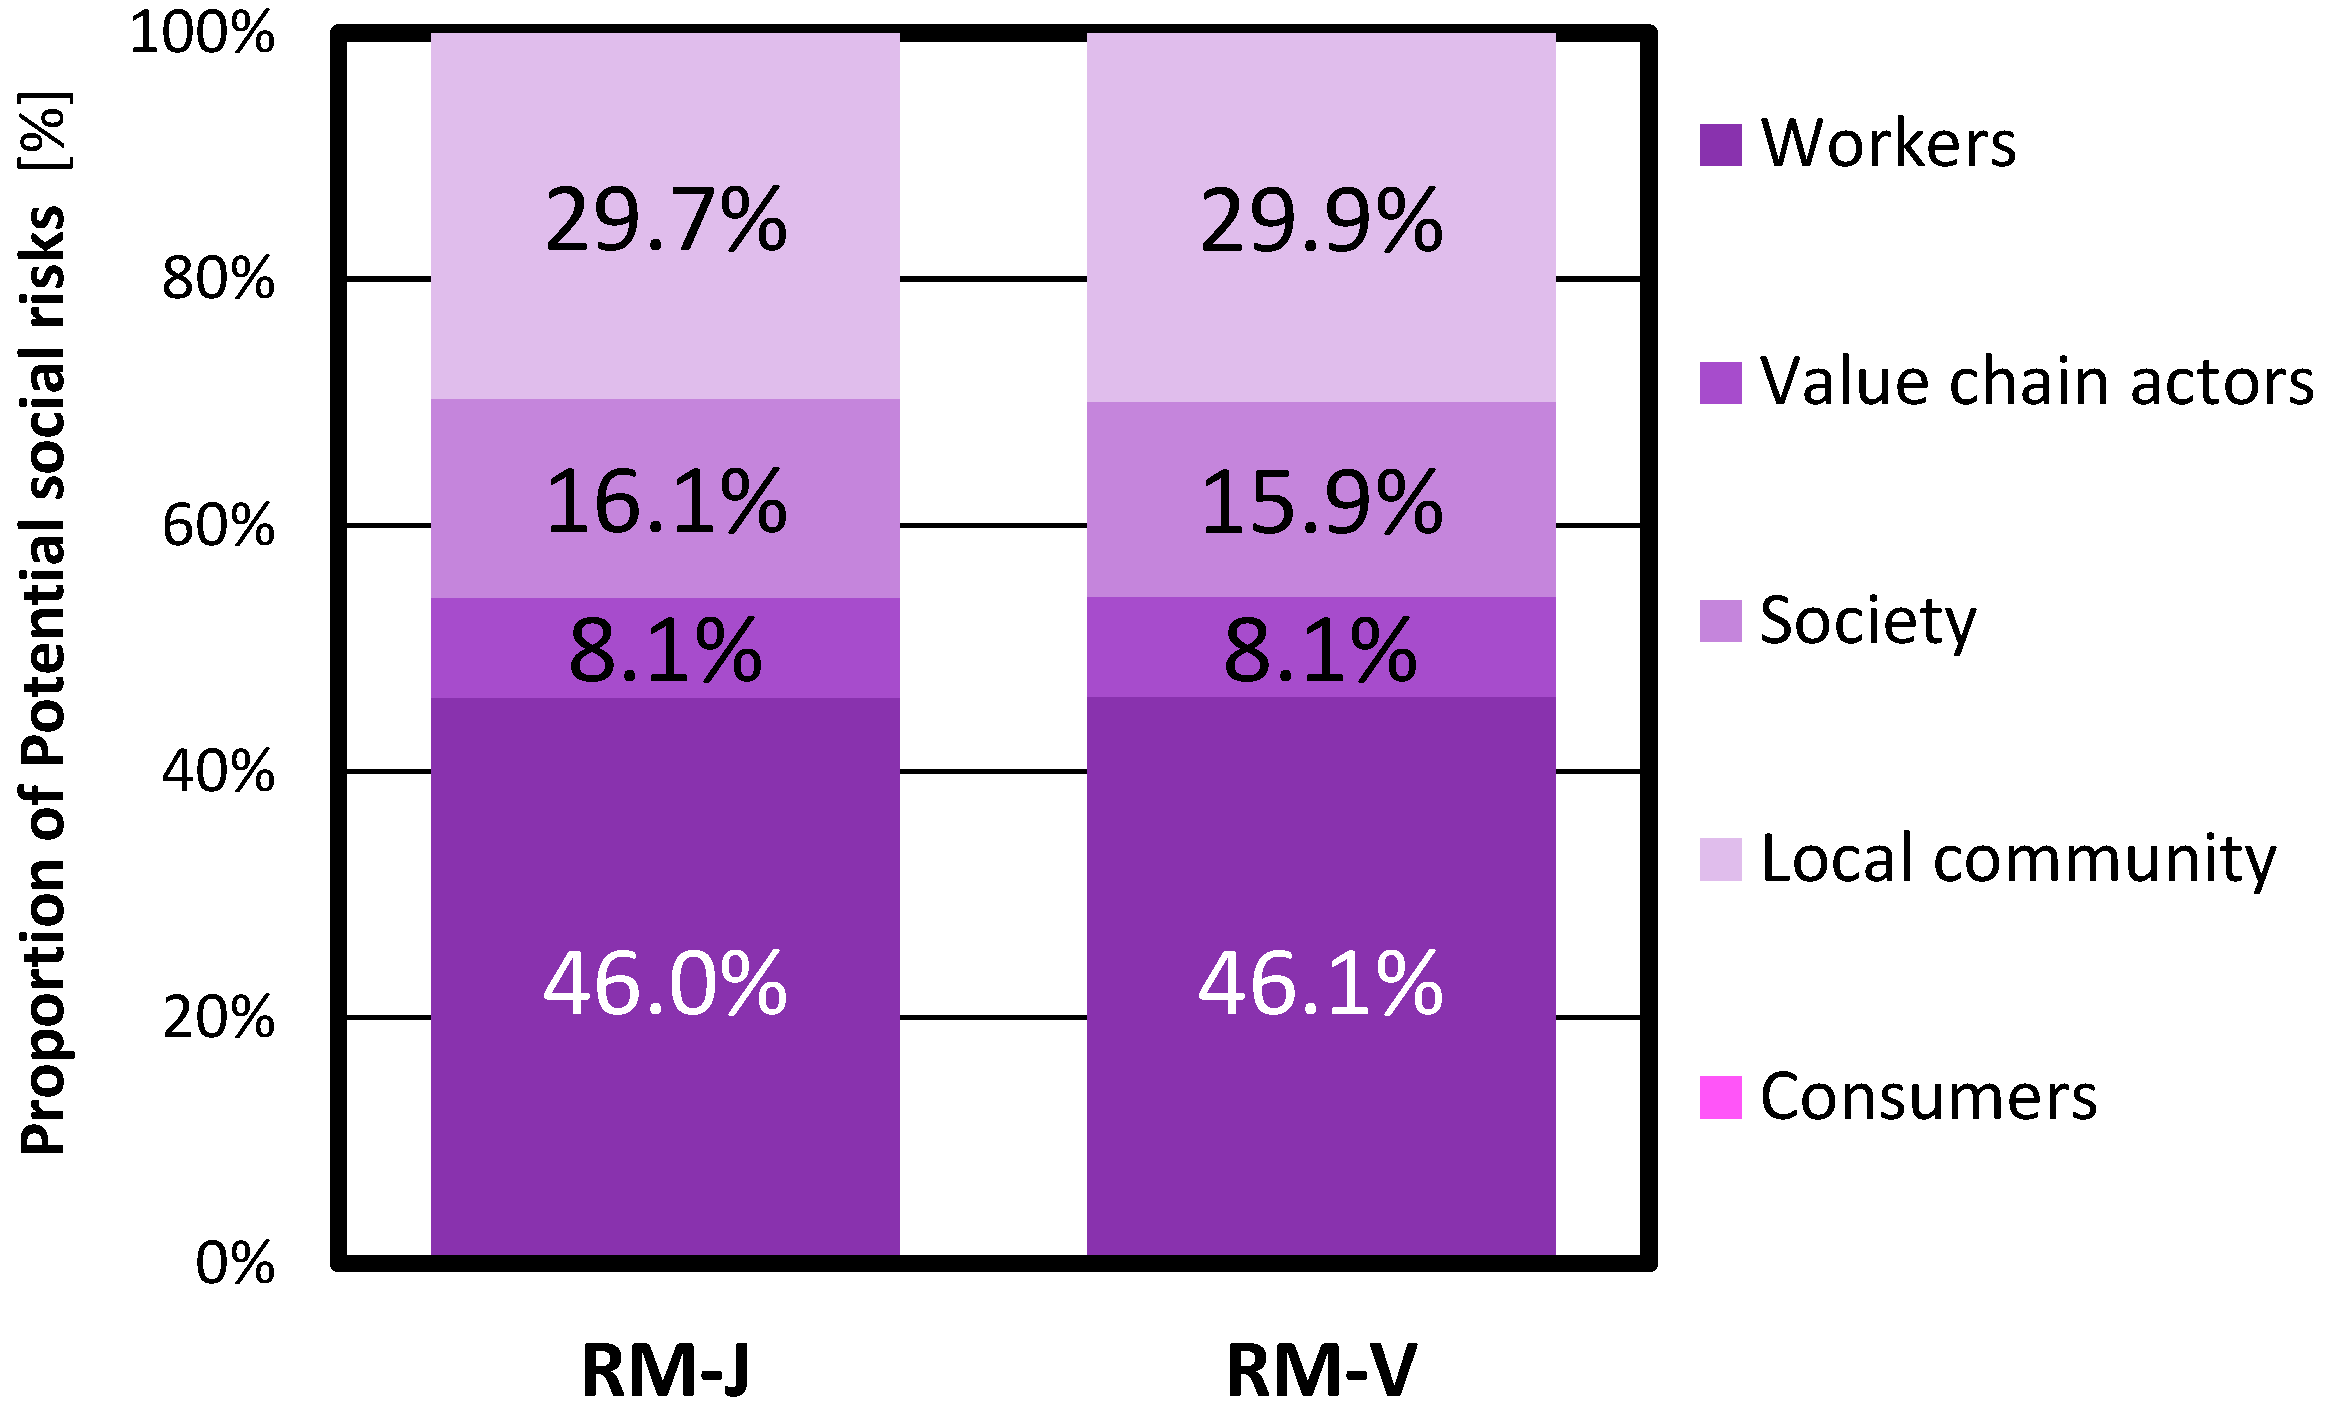
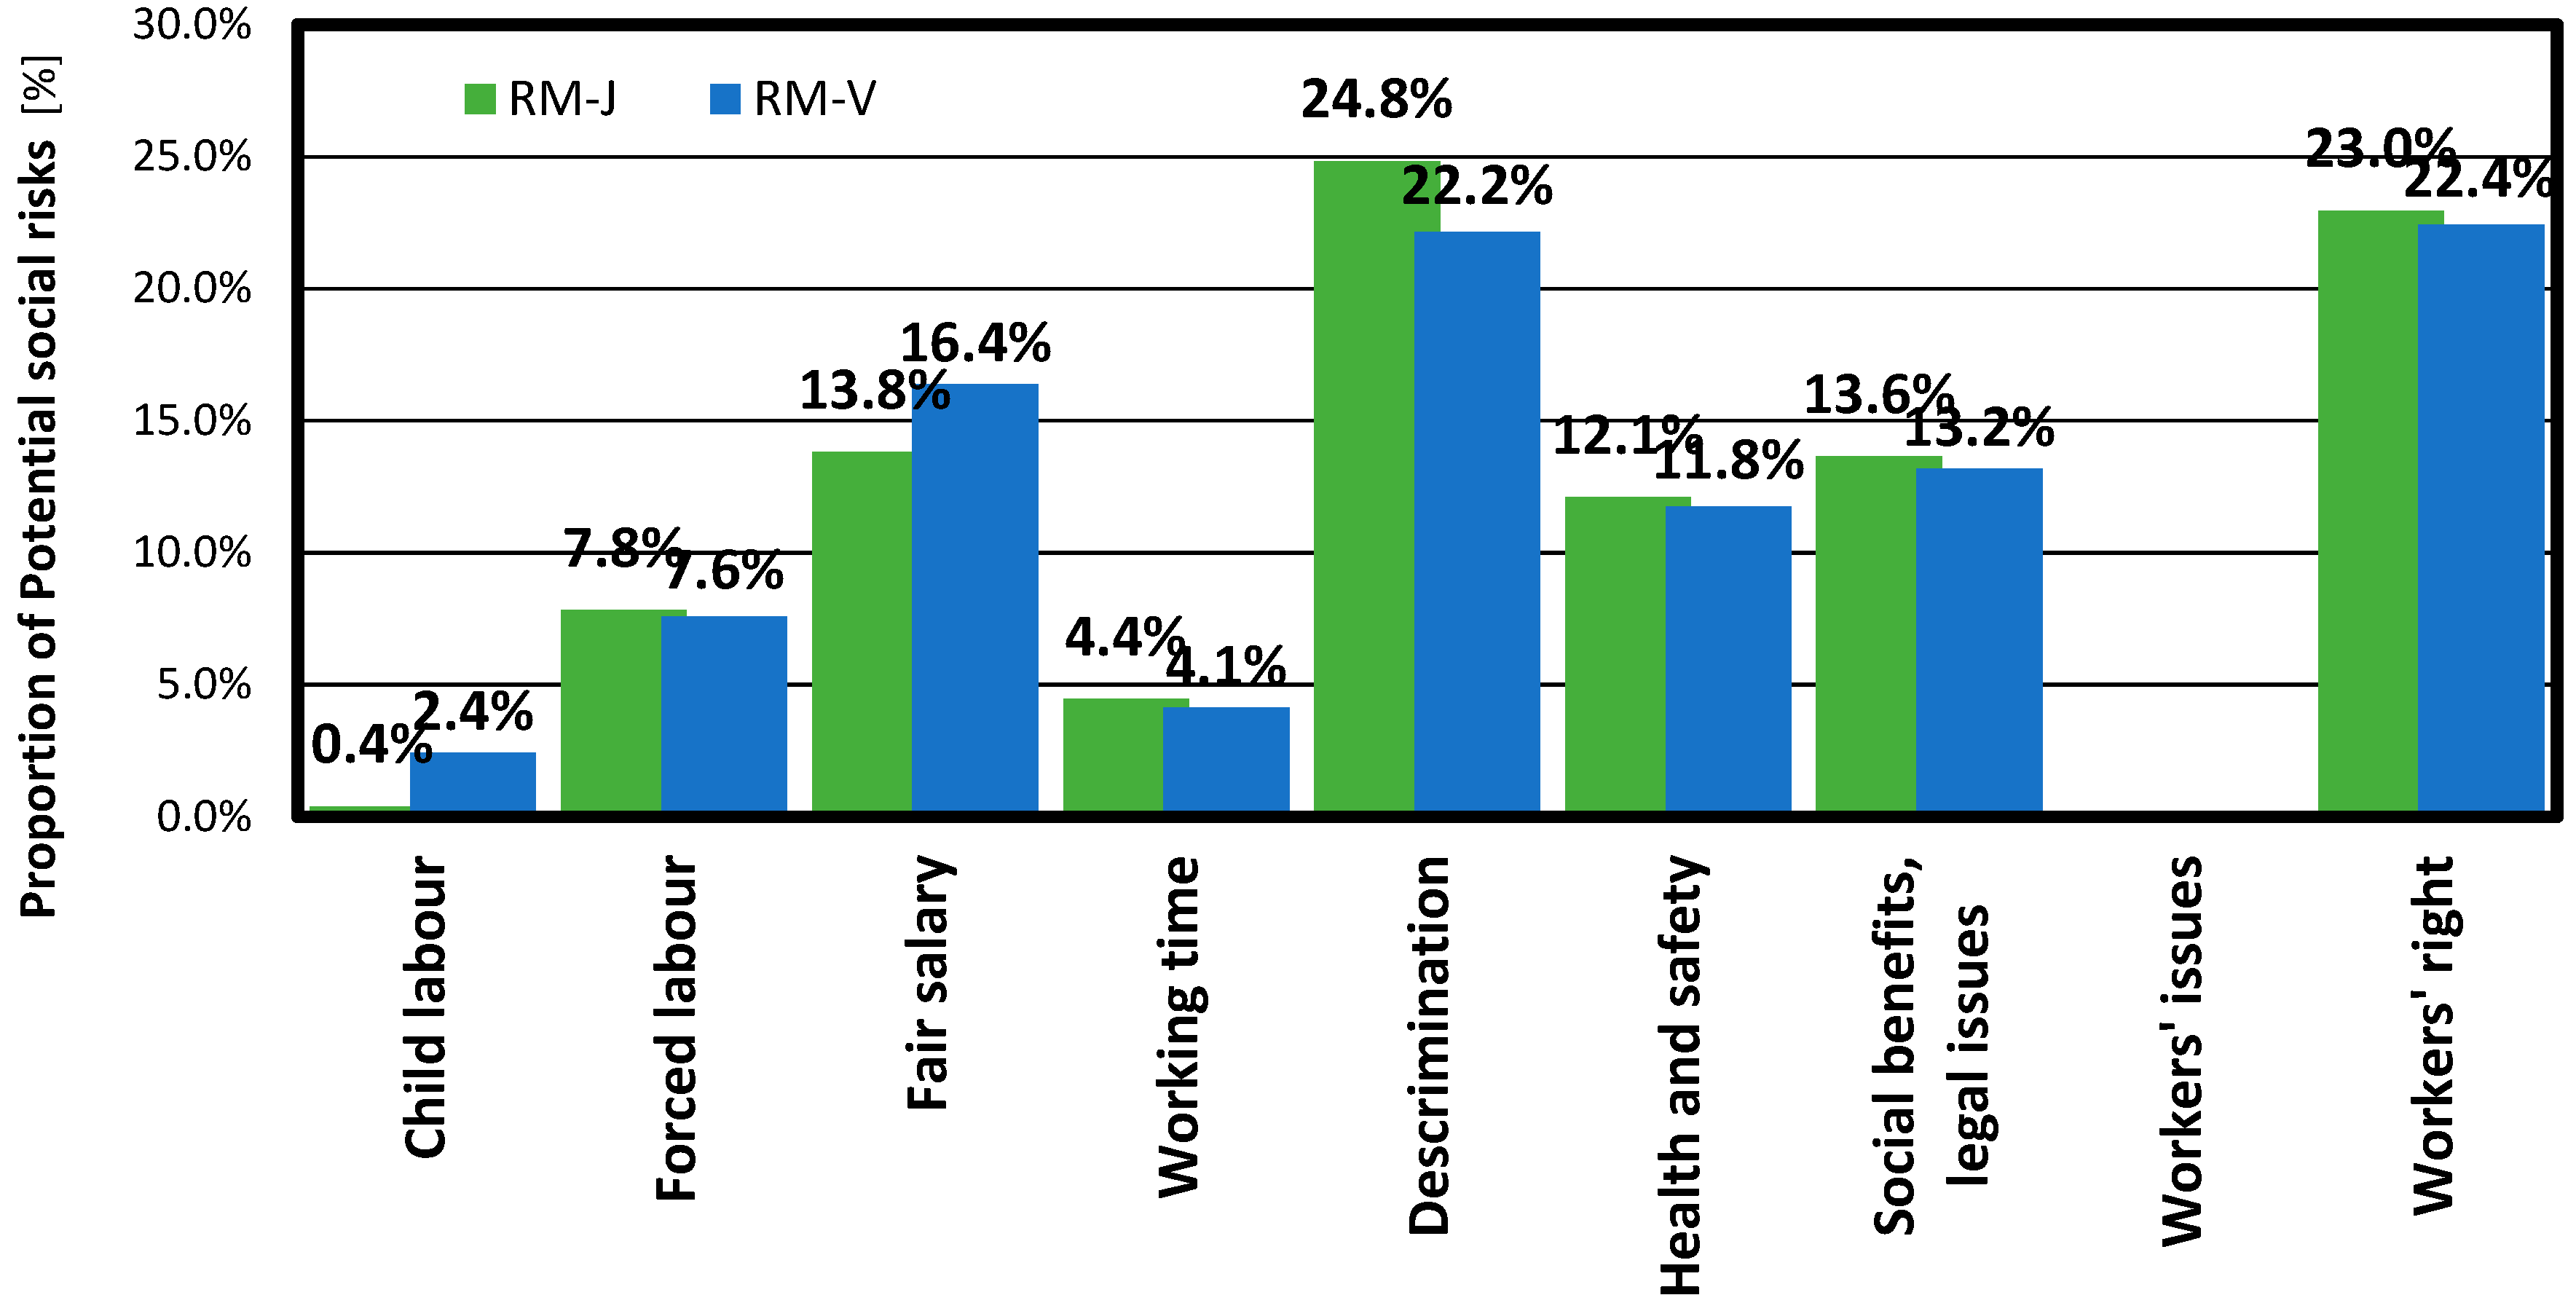
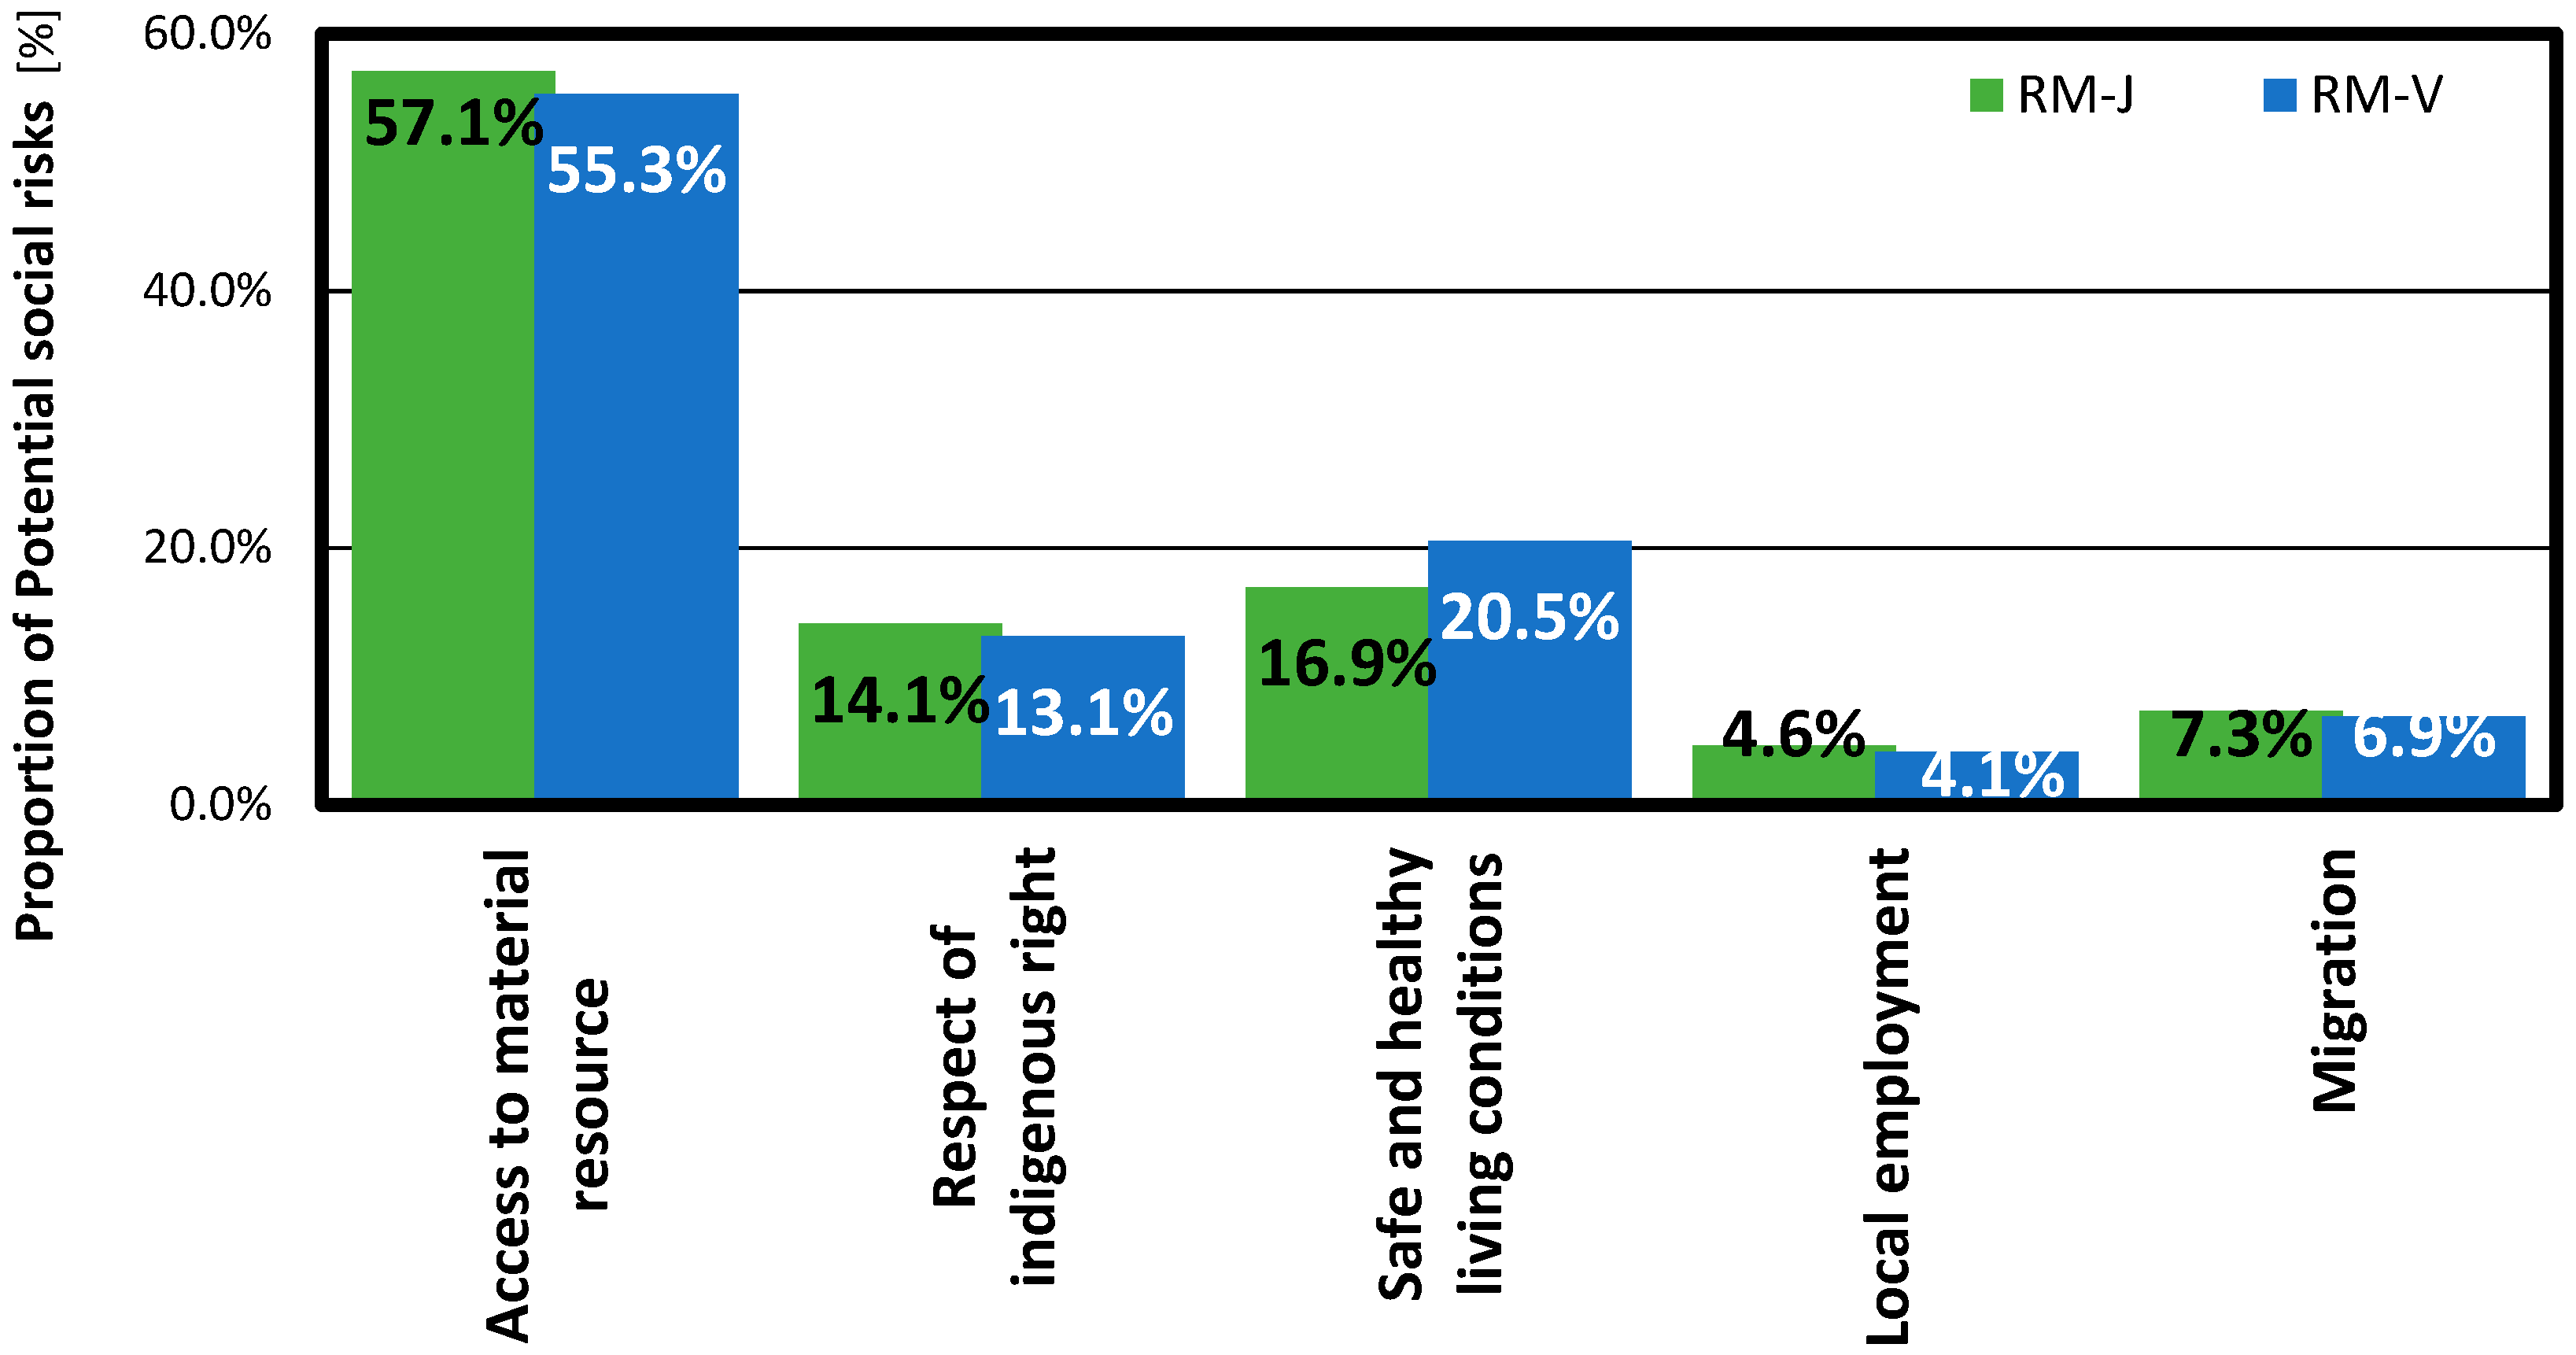
3.4. Social Impact: Potential Social Risk

The above results show that environmental and economic efficiency can be improved by technological advances in the process of CNF production. In an attempt to increase the profit from the business for CNF manufacturing, budget reduction with lower raw material costs by looking for other sources of wood chip instead of their own local resources can be considered. However, an effort to improve the environmental and economic efficiency can lead to other social consequences.
In this chapter, the potential social risk of implementing CNF manufacturing was estimated by PSILCA. The various potential social risks related with the terms of employment, working conditions, and human rights within a certain region where people work can be assumed through this tool. To better understanding the social risks in Japan, the following two scenarios were evaluated: RM-J and RM-V. The RM-J scenario corresponds to the entire process of CNF production as it is implemented in Japan. In contrast, the RM-V scenario assumes that the wood chips in Vietnam are used for CNF production (Figure 1) because the price of wood chips is relatively cheap than that of those found in Japan. Thus, the social risk for labor activities of the planting and logging, and the chipping stage for collecting raw material of CNF production between two countries could be evaluated. To estimate potential social risks, the detailed costs for manufacturing CNF that are used for evaluating economic impacts were reorganized by industrial sectors for use as social parameter values in PSILCA (the calculation results for potential social risks are expressed in the unit of worker hours and social impacts for the manufacturing CNF process of global industrial activities) as shown in Table 5.
As shown in Figure 8, the relative social risk distribution by the input costs in both scenarios have similar results because only the wood chip harvesting-related process from the total process is different between the two scenarios. In the RM-J scenario, the highest potential social risk caused by CNF manufacturing was in the worker sector, which accounted for approximately 46.0% of total risk in the five stakeholder categories, which ratio is similar to the RM-V scenario. The local community, society, and value chain actor sectors had the next highest levels of risk, accounting for approximately 29.7%, 16.1%, and 8.1% of total risk, respectively. In the consumer sector, no potential social risk was found. In the RM-V scenario, the distribution of potential social risk among the stakeholder categories was similar to in the RM-J scenario. Instead, there was a noticeable discrepancy between the scenarios in the ratio of the subcategories in each category, as shown in Figure 9, Figure 10, Figure 11 and Figure 12.
In the worker category, discrimination and worker’s rights were common potential social risks in both scenarios. In the RM-J scenario, discrimination and worker’s rights accounted for 24.8% and 23.0% of social risks in this category, approximately 2.7% and 0.5% higher than in the RM-V scenario (22.2% and 22.4%, respectively). The potential social risks of fair salary and child labor also tended to be higher in the RM-V scenario than in the RM-J scenario (16.4% and 2.4% compared to 13.8% and 0.4%, respectively; Figure 9). In the local community category, the potential social risks of access to material resources and respect of indigenous rights were roughly 1.8% and 1.0% in the RM-J scenario than in the RM-V scenario, while the risk of safe and healthy living conditions was approximately 3.6% lower in the RM-J scenario (Figure 10).
In the society and value chain actors categories, the differences in the distributions of potential social risks between the two scenarios were minor. In the society category, the contribution of economic development to risk in the RM-J scenario was 73.0%, 1.4% higher than in the RM-V scenario; the contribution of the risk to health and safety in the RM-J scenario was 1.4% lower than in the RM-V scenario (Figure 11). In the value chain actors category, the contribution of the potential risk of corruption in the RM-J scenario (85.3%) was slightly smaller than in the RM-J scenario (86.1%). Meanwhile, the contribution of fair competition in the RM-J scenario was 14.7%, approximately 0.9% higher than in the RM-V scenario (Figure 12).

4. Conclusions and Next Steps

This study was proposed to estimate the social, the environmental and the economic impact associated with CNF manufacturing, which is considered a valuable material in many industries, to clarify the significance of woody biomass as a feedstock from the three dimensions of sustainable development.
The results show that the GHG emissions and manufacturing cost in 2015 were roughly 13.0% and 1.7% lower, respectively, compared to in 2012, the year when CNF manufacturing began. Moreover, the GHG emissions and manufacturing cost can be reduced by up to 76.4% and 12.2%, respectively, by enhancing the efficiency of energy consumption between two and five times. However, this does not necessarily mean that the improvement of the environmental and economic efficiency can be effective in improving social performance. To better understand the social impacts of CNF production in Japan, the potential social risk of CNF manufacturing in Japan and Vietnam were also estimated and compared using PSILCA. Here the proportion of total potential social risk was regarded as a valuable criterion for evaluating social risks of the two countries because of the difficulties of absolute evaluation of the working conditions of employees in the two countries. The importing of wood chips to Vietnam from Japan can cause risks of fair salary and child labor (in the worker category) along with the risk of safe and healthy living conditions (in the value chain actors category) to be high compared to when the wood chips are harvested locally in Japan and used for CNF manufacturing without import. Instead, the potential risk of discrimination and the worker’s rights in the worker category, and the access to material resources and the respect of indigenous rights in the local community category can be threatened by the self-sufficiency of raw materials in Japan.
This study examined the environmental, economic, and social impacts associated with the utilization of woody biomass for manufacturing CNFs, which are considered high-value-added products. Opportunities for reducing GHG emissions and manufacturing cost were also suggested via sensitivity analysis. However, empirical analyses to support the results of the theoretical analysis were lacking in this study. The calculation of GHG emissions only focused on CNF manufactured via mechanochemical treatment although there are many types of treatment processes that extract CNF from natural sources [8], which can influence the amount of GHG emitted. Moreover, it is not sufficient to assess sustainability for the relationships between the environmental, economic, and social impacts in the process of manufacturing CNF. A feasible approach for assessing sustainability with effective tools for estimating potential social impacts is needed for future studies.

Acknowledgments

This work was funded by the Network of Centers of Carbon Dioxide Resource Studies in Plants (NC-CARP) project and the Demonstration of SMART Plant Model, Symbiosis of Forest and People project.

Author Contributions

Dami Moon, Masayuki Sagisaka, Kiyotaka Tahara, and Kenichiro Tsukahara conceived and designed the framework of evaluation; Dami Moon and Kenichiro Tsukahara analyzed the data; and Dami Moon and Kenichiro Tsukahara wrote the paper.

Conflicts of Interest

The authors declare no conflict of interest.

References

  1. Agency for Natural Resources and Energy. FIT for Renewable Energy Is Going to Change from the Date of 1 April 2017. Available online: http://www.enecho.meti.go.jp/category/saving_and_new/saiene/kaitori/dl/fit_2017/2017_fit.pdf (accessed on 29 October 2016).
  2. MAFF (Ministry of Agriculture, Forestry and Fisheries). The List for the New Power Generation Facilities for Energy Utilization by Woody Biomass. 2016. Available online: http://www.rinya.maff.go.jp/chubu/nagoya/mokuzai/pdf/homupejimokusitubaiomasu270108kiji3.pdf#search=′2015+%E6%9C%A8%E8%B3%AA%E3%83%90%E3%82%A4%E3%82%AA%E3%83%9E%E3%82%B9+%E7%99%BA%E9%9B%BB%E6%89%80 (accessed on 21 September 2017).
  3. Isogai, A.; Saito, T.; Fukuzumi, H. TEMPO-oxidized cellulose nanofibers. Nanoscale 2011, 3, 71–85. [Google Scholar] [CrossRef] [PubMed]
  4. Kondo, T. New aspects of cellulose nanofibers. Jpn. Wood Res. Soc. 2008, 54, 107–115. (In Japanese) [Google Scholar] [CrossRef]
  5. Moon, D.; Genchi, Y. Regional impact by business creation of high value-added products from woody biomass with case study in Maniwa, Japan. J. Environ. Inf. Sci. 2015, 43, 73–80. [Google Scholar]
  6. Sun, X.Z.; Moon, D.; Yagishita, T.; Minowa, T. Evaluation of energy consumption and greenhouse gas emissions in preparation of cellulose nanofibers from woody biomass. Am. Soc. Agric. Biol. Eng. (ASABE) 2013, 56, 1061–1067. [Google Scholar]
  7. Yano, H.; Nakahara, S. High-Strength Material Using Cellulose Microfibrils. U.S. Patent No. 7378149, 2008. [Google Scholar]
  8. Mitsubishi Chemical Techno-Research Corporation. A Study on the Research Development, the Use-Development, the Commercialization, and the Patent Application of Cellulose Nanofiber: Support Research for the Small and Medium Enterprise in 2012; Mitsubishi Chemical Techno-Research Corporation: Tokyo, Japan, 2013. (In Japanese) [Google Scholar]
  9. Moon, D.; Kitagawa, N.; Sagisaka, M.; Genchi, Y. Economic impact of utilizing woody biomass to manufacture high value-added material products: A study of cellulose nanofiber and high standard chip-dust production in Maniwa, Japan. J. Jpn. Inst. Energy 2015, 94, 582–587. [Google Scholar] [CrossRef]
  10. Moon, D.; Tsukahara, K.; Sagisaka, M.; Tahara, K. Effect of cellulose nanofibers composites in automotive components on Greenhouse Gas emissions. J. Jpn. Inst. Energy 2016, 95, 648–652. [Google Scholar] [CrossRef]
  11. MAFF (Ministry of Agriculture, Forestry and Fisheries). National Basic Plan for the Promotion of Biomass Utilization 2010. Available online: http://www.maff.go.jp/j/shokusan/biomass/attach/pdf/index-7.pdf (accessed on 29 October 2016). (In Japanese)
  12. JEMAI (The Japan Environmental Management Association for Industry). Multiple Interface Life Cycle Assessment (MILCA). 2010. Available online: http://www.milca-milca.net/english/index.php (accessed on 29 September 2014). (In Japanese).
  13. METI (Ministry of Economy, Trade, and Industry) and MLIT (Ministry of Land, Infrastructure, Transport, and Tourism). Guideline for Calculating the Amount of CO2 Emissions in Transportation and Logistics Field. 2006. Available online: http://www.greenpartnership.jp/pdf/co2/co2brochure.pdf (accessed on 21 September 2016). (In Japanese)
  14. NEDO (New Energy and Industrial Technology Development Organization). 2005–2009 NEDO Progress Report: Experimental Project for Regional Energy Circulation System Using by Woody Biomass in Maniwa City; NEDO: Kanagawa, Japan, 2010; pp. 5–33. (In Japanese)
  15. EFTC (Home Electric Appliances Fair Trade Conference). The List of Unit Price for Electric Light and a Price for Model Demand of 2014.5. 2014. Available online: https://www.eftc.or.jp/qa/qa_pdf.pdf (accessed on 29 October 2016). (In Japanese).
  16. UNEP (United Nations Environment Programme). Guidelines for Social Life Cycle Assessment of Products. 2009. Available online: http://www.unep.fr/shared/publications/pdf/DTIx1164xPA-guidelines_sLCA.pdf (accessed on 21 September 2016).
  17. Norris, C.B.; Norris, G.A.; Aulisio, D. Efficient assessment of social hotspots in the supply chains of 1—Products categories using the social hotspots database. Sustainability 2014, 6, 6973–6984. [Google Scholar] [CrossRef]
  18. Greendelta. A New, Comprehensive Database for Social LCA: PSILCA. 2015. Available online: http://www.greendelta.com/Databases.119.0.html?&L=1 (accessed on 29 October 2016).
  19. Unwin, G.L.; Kriedemann, P.E. Principles and Processes of Carbon Sequestration by Trees; Research and Development Division: State Forests of New South Wales, Australia, 2000. [Google Scholar]
  20. Fuji-Keizai. Current Status and Future Prospects of Plastic Market for EV, HEV in 2012; Fuji-Keizai: Tokyo, Japan, 2012. [Google Scholar]
  21. METI (Ministry of Economy, Trade, and Industry). METI Dynamic Statistics of Production in 2015. 2015. Available online: http://www.meti.go.jp/statistics/tyo/seidou/result/ichiran/08_seidou.html (accessed on 21 September 2016).
Figure 1. Process boundaries for the life cycle of CNF production.
Sustainability 09 02368 g001
Figure 2. GHG emissions for each stage of CNF production.
Sustainability 09 02368 g002
Figure 3. GHG emissions from CNF production (base case) in comparison with plastic materials used in vehicle components.
Sustainability 09 02368 g003
Figure 4. The manufacturing cost of each stage of CNF production.
Sustainability 09 02368 g004
Figure 5. Production unit prices and shipping unit prices for five plastic resins.
Sustainability 09 02368 g005
Figure 6. GHG emissions and manufacturing costs for CNFs in 2012 and 2015.
Sustainability 09 02368 g006
Figure 7. Operating cost and GHG emissions by sensitivity analysis of the yield rate and the energy consumption efficiency.
Sustainability 09 02368 g007
Figure 8. Potential social risks of CNF production determined using PSILCA.
Sustainability 09 02368 g008
Figure 9. Detailed breakdown of potential social risks in the worker category.
Sustainability 09 02368 g009
Figure 10. Detailed breakdown of potential social risks in the local community category.
Sustainability 09 02368 g010
Figure 11. Detailed breakdown of potential social risk in the society category.
Sustainability 09 02368 g011
Figure 12. Detailed ratio of potential social risk in the value chain actors category.
Sustainability 09 02368 g012
Table 1. Amount of logging residue required for manufacturing 1 kg of CNFs.
ItemsAmountRequired Condition
FigureUnitSubstanceFigureSource
CNF Q d r y C N F 1 *dry kg
Chip (dry) Q d r y c h i p 1.3 *dry kgYield rate80-
Chip (wet) Q w e t c h i p 2.6 *wet kgMoisture content52%Moon et el. [9]
Logging Residues Q r e s i d u e s 2.9 *wet kgYield rate89%Moon et al. [9]
* Figures used in the table above rounded off to the nearest hundredth (or where appropriate).
Table 2. Values of unit energy consumption and GHG emission coefficient for each stage.
Items G h g _ 1 G h g _ 2 G h g _ 3 G h g _ 4
G h g 4 1 G h g 4 2 G h g 4 3
EnergyLight diesel oilElectricity
The unit energy consumption2.550.05920006400400
UnitL/wet tonL diesel/ton kmkWh/dry ton
SourcesNEDO (2010)METI and MLIT (2006)Measured value (2015)
The GHG efficient3.210.69
Unitkg CO2eq/Lkg CO2eq/kWh
SourcesIDEA
Table 3. Unit cost for each CNF production stage.
Categories and ItemsFigureUnitSource
C o s t _ 1 Unit cost of production3625JPY/tonNEDO Research report [14]
C o s t _ 2 Unit cost of production5263JPY/ton
C o s t _ 3 Unit cost for delivery (in the case of 30km)2815JPY/tonThe average by 14 delivery companies
C o s t _ 4 Purchase unit cost20,000JPY/tonMeasured data in 2015
Unit cost of electric power22JPY/kWhUnit price offered by EFTC [15]
Personnel expenses20,000JPY/dayMeasured data in 2015
Table 4. Social impact categories according to SHDB and PSILCA in comparison to the SLCA guidelines of UNEP/SETAC.
Stakeholder Categories and Subcategories (UNEP, 2009)SHDBPSILCA
Stakeholder CategoriesImpact Categories
WorkerFreedom of association and collective bargaining
Child labour
Fair salary
Working hours
Forced labour
Equal opportunities/Discrimination
Healthy and safety
Social benefits/Social security
ConsumerHealth & safety
Feedback mechanism
Consumer privacy
Transparency
End of life responsibility
Local communityAccess to material resources
Access to immaterial resources
Delocalization and migration
Cultural heritage
Safe & healthy living conditions
Respect of indigenous rights
Community engagement
Local employment
Secure living conditions
SocietyPublic commitments to sustainability issues
Contribution to economic development
Prevention & mitigation of armed conflicts
Technology development
Corruption
Value chain actors not including consumersFair competition
Promoting social responsibility
Supplier relationships
Respect of intellectual property rights
The definition of classifying the social impact categories are slightly differences between SHDB, and PSILCA.
Table 5. Detailed cost for the social parameter value in PSILCA (Unit: USD/CNF 1 USD).
Industrial SectorScenario
RM-JRM-V
Wooden chips JP0.01057-
Forestry VN-0.00531
Transport VN-0.00421
Travel agency and other services relating to transport JP0.002980.00298
Real estate rental service JP0.033860.03390
Water supply JP0.011700.01171
Other business services JP0.020180.02020
Electric power for enterprise use JP0.262210.26249
Manufacture of other products of wood JP0.658510.65921
Total1.000001.00000

