1. Introduction
The density of the built environment has become a key variable in assessing the sustainability of neighborhoods and cities. Densification, or increases in density, is commonly proposed as a key urban planning policy tool to help reduce carbon emissions. However, can the vast low-density suburban areas that surround most North American metropolitan areas be densified fast enough to meet climate change reduction goals? This paper considers the velocity of residential density increases in Toronto, Canada, as a case study to examine the issue.
Cities have increasingly been positioned as key facilitators in attaining a more sustainable future. A large body of evidence shows that the higher density of the built environment in cities facilitates economies of scale in the delivery of mass transit, contributes to a reduction in automobile use, and results in a reduction in per capita carbon emissions [
1,
2]. Sustainability in this context is defined, somewhat narrowly, as reduced car reliance and decrease in per capita land consumption to combat environmental ills associated with emissions—for instance, local air pollution and climate change [
3]. Lee and Lee [
4] find, for instance, that “doubling population-weighted density is associated with a reduction in CO
2 emissions from household travel and residential energy consumption by 48% and 35%, respectively” (p. 534). They conclude that higher density levels ought to be an important climate change mitigation policy goal. Indeed, planning documents in major cities across North America do already include some reference to densification, although implementation is much more varied [
5].
This “sustainability-as-density” policy is partly a response to almost five decades of largely automobile-oriented planning that produced vast areas of low-density, homogeneous, and dispersed land uses [
6] (p. 1055). The dispersed urban form became increasingly untenable as it put strains on municipal budgets due to ever-expanding suburban infrastructure networks, and concerns over the livability and environmental sustainability of low-density neighborhoods became more prevalent [
3]. The justifications for planning for higher densities are also commonly based on the works of the famous urbanist Jane Jacobs, who in her book
The Death and Life of Great American Cities outlines a series of characteristics of what she deems successful neighborhoods [
7]. Density and a mix of uses rank high among her recommendations due to the ways these traits of cities facilitate social interaction and contribute to efficient use of resources. However, it is important to remember that in Jacobs’ work density is only one among several elements of cities that contribute to achieving a range of social and economic goals.
It has been argued that “sustainability-as-density” is now a unifying theme for the planning profession, and that interventions in the built form through density as a means to reduce car dependence are positioned as essential strategies to reduce carbon emissions and combat climate change [
6,
8]. While the merits of densification are evident in the context of sustainability, there are concerns about density having become almost dogmatic in that some planners (and plans) position it as the only plausible sustainable future, potentially overlooking the limits of density as a policy, for instance its implications for housing affordability in the context of constrained outward expansion [
9]. Although it should be noted that planners are not simply advocating for higher density land uses but that these densities provide a basis for delivering mass transit and a greater mix of housing types and uses; density is usually couched as one part of a larger set of planning interventions such as streetscape improvements, pedestrian-friendly urban design, and provision of other urban amenities [
3]. Ewing and Cervero [
10], for instance, outline how density is important but not sufficient in reducing automobile-dependence. They talk about the need to consider the five “D variables”: “density, diversity… design… destination accessibility and distance to transit” (p. 267).
Nonetheless, if a key justification for density as an urban planning policy is its potential to reduce carbon emissions, it is critical that the policy be assessed in terms of its ability to help achieve that goal. Most of the density gains in large North American metropolitan areas have been in central cities [
5]; and there is no shortage of studies that have demonstrated the positive association between higher density and a reduced carbon footprint [
10]. However, none have explicitly analyzed the time it takes to reach a level of density where one might expect a reduction in auto-dependence, and associated greenhouse gas emissions in existing low-density areas.
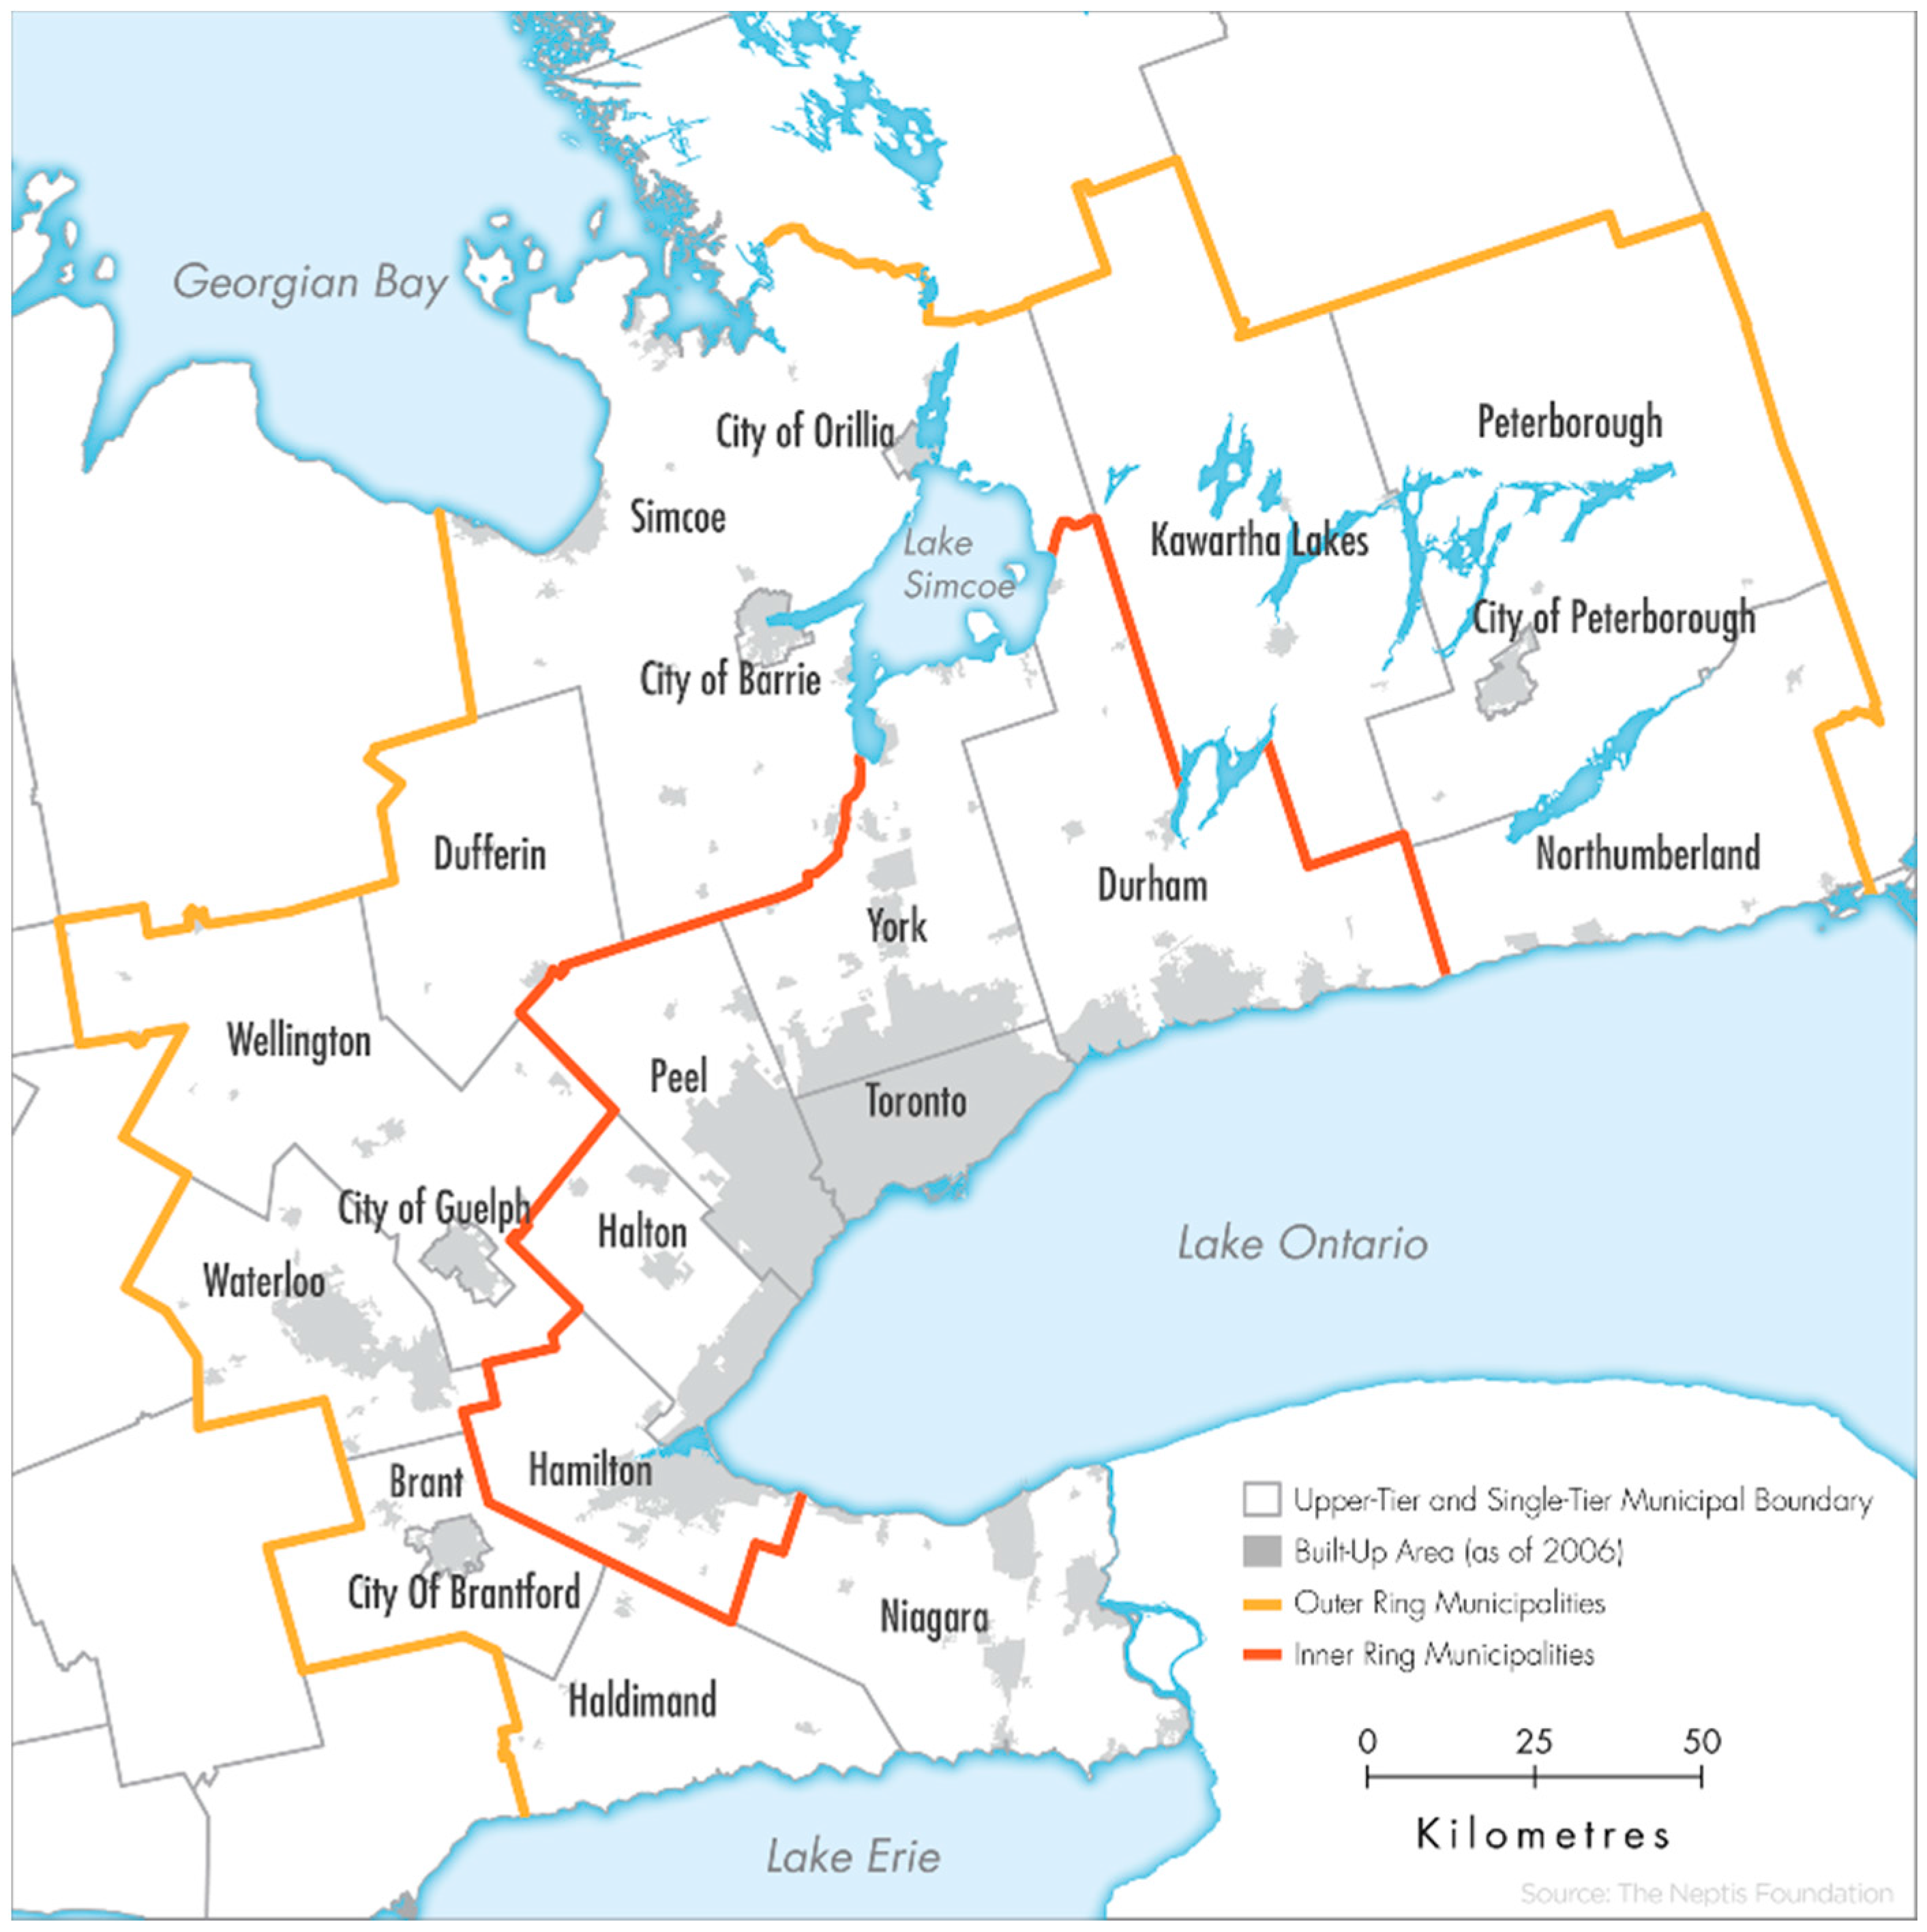
The analysis in this paper examines unit density levels in the Greater-Toronto–Hamilton–Niagara area (GTHA). The GTHA comprises the City of Toronto and the ‘inner ring’ municipalities in the Greater Golden Horseshoe, the large area surrounding the City of Toronto. The GTHA covers an area of about 0.8 million hectares (
Figure 1). The area has an approximate population of 7 million and 2.5 million dwellings occupied by usual residents, based on 2016 Statistics Canada Census data.
In 2006, the Province of Ontario introduced a growth plan for the GGH that identified focal areas for growth and infrastructure investments [
11,
12]. The plan is supported by other legislation to protect a greenbelt surrounding the inner ring municipalities and other environmentally sensitive lands in the region. Municipalities are required to make their plans consistent with provincial legislation, and are required to adhere to growth targets. Assessments of the success of the legislation in directing growth are somewhat mixed, with continuing concerns over low-density development in outer areas. In terms of transportation patterns, the GTHA remains largely auto-centric. In 2011, 71% of morning peak time commutes (6:00 a.m.–9:00 a.m.) were made by car (as driver or passenger), which is actually a 6% increase since 1986 [
13].
There are clear limitations to relying only on density as an assessment of urban sustainability strategies. It is well understood that density is necessary but not likely sufficient to achieve larger goals of reducing sprawl and automobile-dependence, which requires a more comprehensive consideration of a larger diversity of built form, environmental, and socio-economic characteristics [
2]. However, density is usually one component of sustainability strategies in planning, and it is the policy that is arguably most often adopted, as illustrated for instance in the Ontario Growth Plan. Also, without density, other dimensions of urban sustainability are arguably much more difficult to implement, such as transit provision or walkable urban design.
Therefore, the analysis in this paper approaches the question of sustainability in cities from a perspective of plausibility. It asks how many units would be required to bring existing areas in the GTHA within minimum densities generally perceived to be transit supportive, and how long it would take to achieve this goal given current growth trends. The analysis also studies housing types by density levels to provide recommendations on what kind of housing could help attain minimum transit supportive densities. Political and other planning issues that arise in densification efforts are discussed.
2. Methods
The analysis aims to answer four questions: (1) What share of the GTHA population lives in DAs with transit supportive densities? (2) Where are the transit supportive DAs located among the GTHA municipalities? (3) How many additional dwelling units are required to bring existing areas to transit supportive density levels? And (4) How long would it take to achieve minimum transit supportive densities (i.e., what is the velocity of density) in the GTHA?
The nature of the analysis raises four methodological issues. First, consistent data must be obtained across the various municipalities in the GTHA. The analysis thus uses Statistics Canada Census data from 2016 at the dissemination area level (DA). DAs are the smallest geographic scale at which all census data can be obtained publicly. DAs include between 400 and 700 people. DA data is used for the six upper-tier and single-tier municipalities in the GTHA (
Figure 1). By population size from largest to smallest, the GTHA municipalities are Toronto, Peel, York, Durham, Halton, and Hamilton (
Table 1).
The Statistics Canada Census data is based on an actual count of dwellings and the population. The Census is a comprehensive enumeration exercise that attempts to capture all residents on a given day (Census day). Various strategies are used by Statistics Canada to track non-compliance, and conduct follow-up visits. However, as Statistics Canada acknowledges, the census would miss those who do not reside in a dwelling on Census day (e.g., homeless populations), and may also double count those who reside in multiple places (e.g., post-secondary students). Statistics Canada treats Census data as population data and reports every person and dwelling counted. The analysis in this paper follows the Statistics Canada convention; it reports actual Census counts since these figures are most readily available at the scale required for analysis (e.g.,
Table 1). Estimates are rounded to the nearest thousand to avoid providing a false sense of accuracy of what is admittedly a broad analysis (e.g.,
Table 2).
Second, minimum transit supportive densities must be determined. For this analysis, the Ontario Growth Plan minimum density of 50 jobs and residents per hectare in dedicated growth centers, or 22 units per hectare, is used [
12]. Growth centers are specifically designated in the Plan as “focal areas for investment” to “accommodate and support major transit infrastructure”, to “serve as high density major employment centres”, and to “accommodate a significant share of population and employment growth” [
12] (p. 16).
The Ontario Ministry of Transport estimates the following minimum densities for different types of transit service levels [
14]:
Basic service (20–30 min intervals): 22 units per hectare
Frequent service (10–15 min intervals): 37 units per hectare
Very frequent service (5 min intervals): 45 units per hectare
Rapid transit (e.g., light-rail transit or rapid bus system): 72 units per hectare
Subway: 90 units per hectare
Combined employment and residential densities are not easily obtained for all areas of a metropolitan region. Thus, the minimum unit density for basic transit service is used here. A limitation of this approach is that unit sizes vary, and especially given the growth of smaller units in areas experiencing intensification, population densities may not be as high as expected based on unit densities alone. Another limitation of using only densities to measure transit supportiveness is that it does not account for characteristics of the streetscape, road network, and urban design that influence walkability and thus transit service. However, the analysis here is primarily concerned with obtaining a rough estimate of the number of dwelling units needed to attain minimum transit supportive densities, and exact density figures are not required as they would be in transit planning, for instance. The unit densities can be interpreted as a bare minimum characteristic of the built form that would help facilitate higher transit usage.
Third, based on data availability, gross densities will be used. Gross densities are calculated at the DA scale, meaning the measure includes all land (and uses) at what roughly equates to the neighborhood level. Contrary, net densities are calculated at the site level, and would exclude land not dedicated to residential uses. Hess et al. summarize the different types of densities used in planning analysis [
15]. They note, citing Hitchcock [
16], the utility of gross densities in giving “a bigger picture of land use as they express the amount of space a population consumes for all residential and non-residential uses” (p. 7). The limitation of using gross density is that it could underestimate in some cases the ability of a neighborhood to support transit service—residential uses could be compact, surrounded by large amounts of land dedicated to other uses. Hess et al. also speak to the limitations of using DA data to calculate densities, for instance the inaccuracies of DA boundaries that at times underestimate the land area of small DAs (e.g., when a DA only includes one or two apartment buildings). Although the choice of denominator is critical in density studies, the reliance on Census data in this study limits it to the area of DAs, as opposed to more refined area estimates. However, the intent here is broad brush and not intended to convey ‘exact’ density figures.
Fourth, an estimate is required of how fast development occurs to calculate how quickly density could be added to existing areas. Between 2006 and 2016, the GTHA has grown rapidly, adding 372,563 units occupied by usual residents in total as per Census counts, or about 37,000 units per year [
17]. This is likely an upper end of the growth rate given current conditions. The speed at which we could expect existing areas to densify based on the GTHA growth figure should therefore be interpreted as a maximum. For the City of Toronto, dwelling units grew by 133,599 from 2006 to 2016, based on Statistics Canada Census counts, or about 13,000 additional units added per year [
17]. The growth number for the City of Toronto, which is more built up than outer municipalities in the GTHA, perhaps provides a more realistic pace at which units could be added in built up areas across the GTHA. Although it should be noted that a large share of these additional units are being added in the form of high-rise apartment towers in the center, while existing single-family dwelling neighborhoods have seen much less change. Therefore, even the roughly 13,000 additional units added per year may be overly optimistic for current low-density areas across the GTHA.
4. Discussion
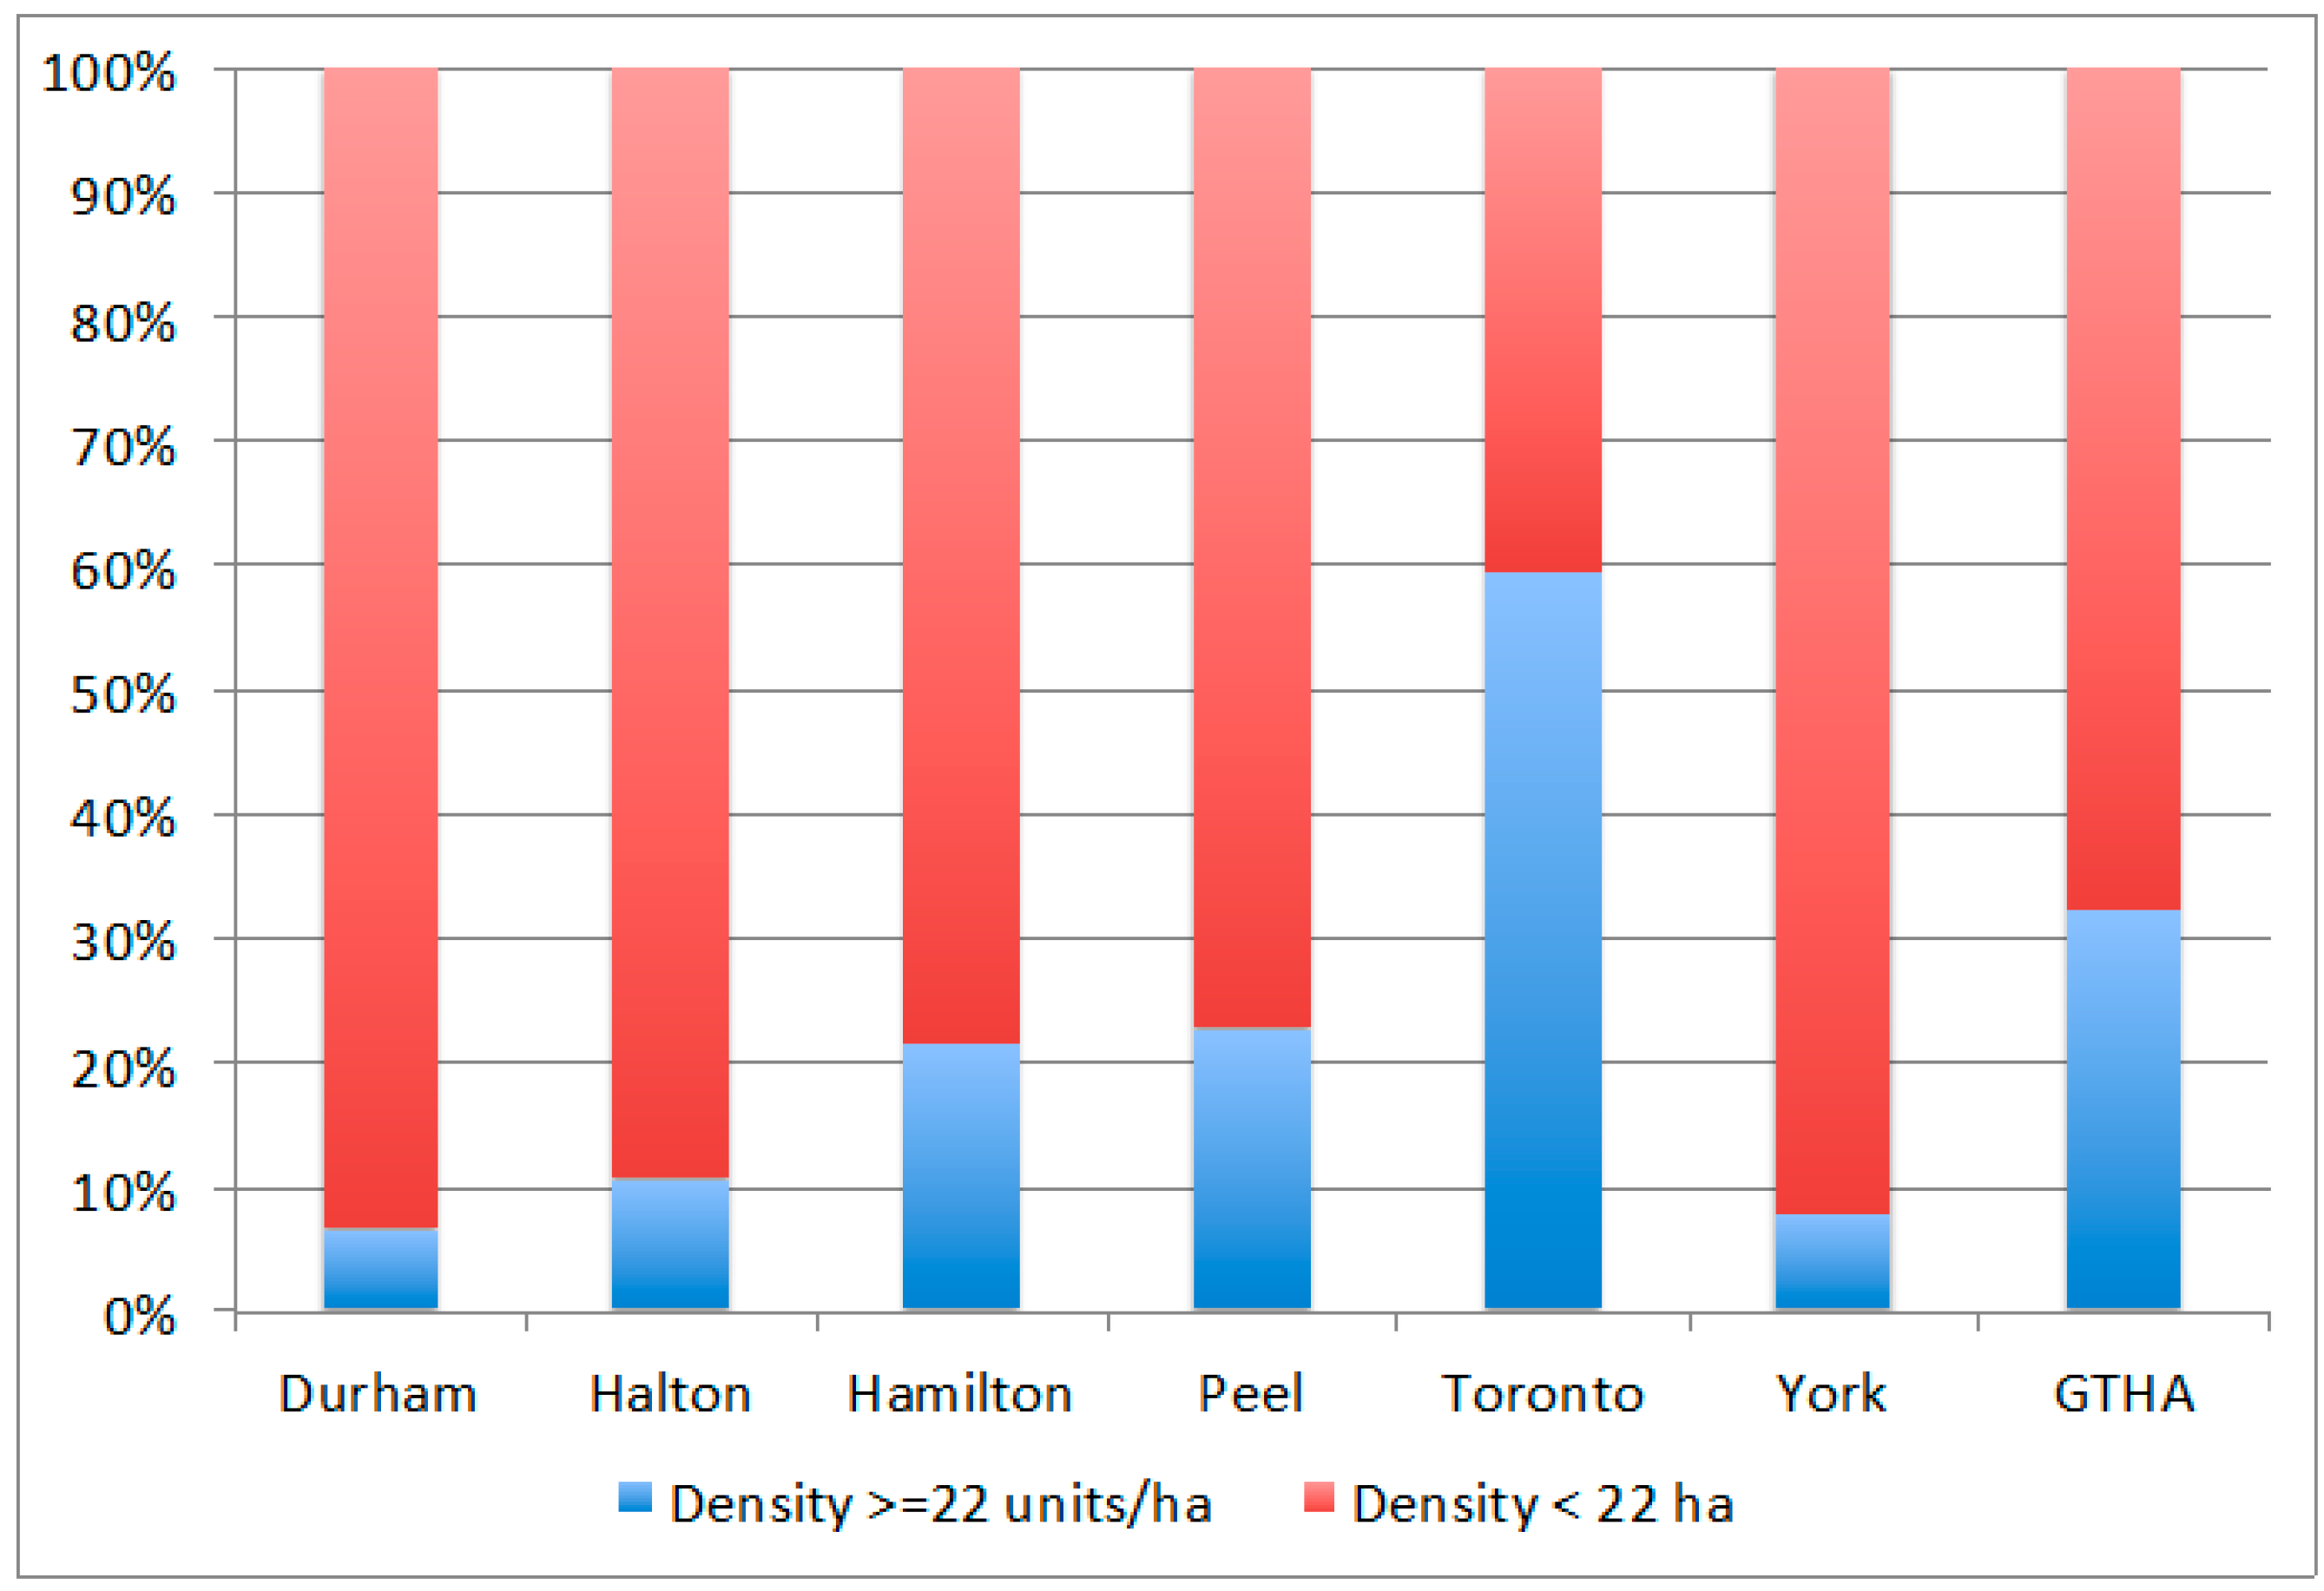
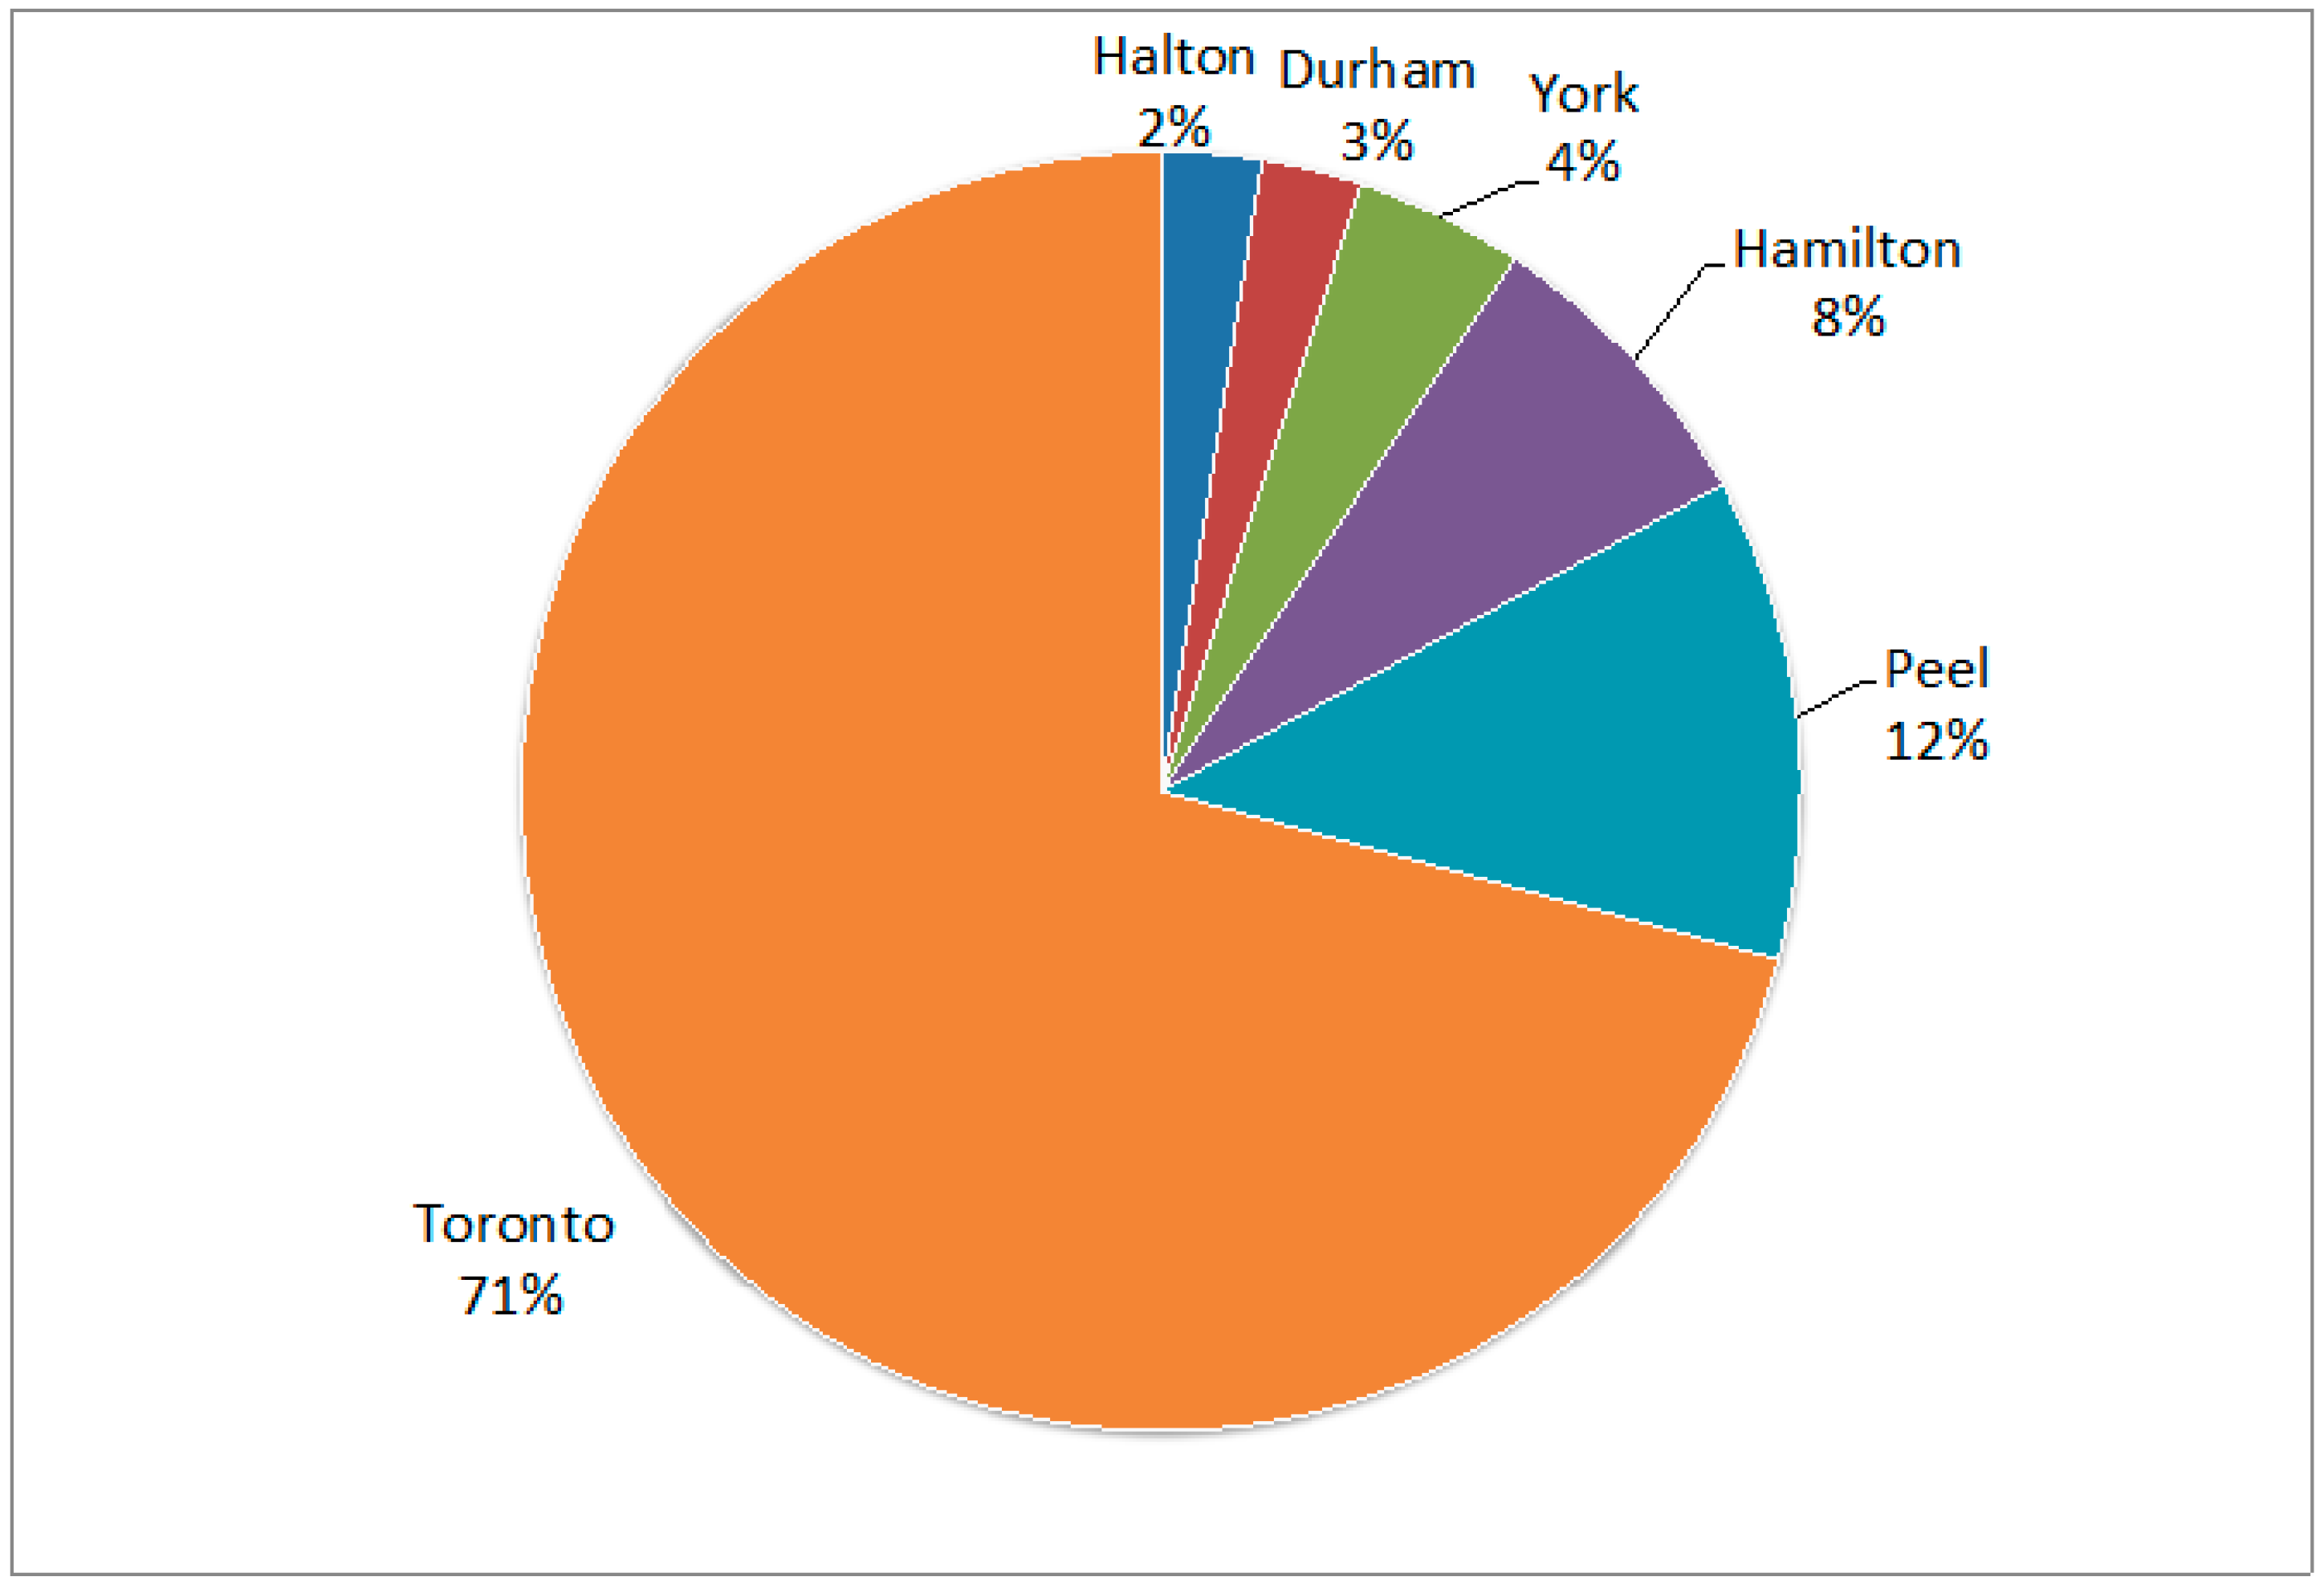
The calculation of the velocity of density is an important empirical exercise in evaluating the implementation potential of sustainability policy. If most of the emphasis in sustainability planning is placed on densification to reduce car dependence, it raises questions about whether cities can develop their densities fast enough to achieve aggregate reductions in car use that would help attain sustainability goals. The analysis of the GTHA as a case study reveals that currently just over 30% of the region’s population lives in areas with minimum transit supportive densities. Most of these areas are in the City of Toronto, the central, most dense municipality in the GTHA. The analysis estimates that about 3.8 million additional residents could be residing in transit supportive environments if about 1.2 million units were added to DAs with current unit densities between 5 and 20 units per hectare. Given historic growth rates, these units could be built within 34 to 95 years depending on whether GTHA or City of Toronto average growth rates are used in the calculation. It must be remembered that this estimate is based on the rather stringent assumption that all new growth would be concentrated in existing areas, without any expansion at the urban periphery. This is unlikely to be the case given past trends, ongoing challenges put on the growth boundary, and existing zoning that protects large areas of single-detached dwelling neighborhoods [
18]. However, the assumption is used to illustrate the great challenge of bringing existing neighborhoods in line with minimum transit supportive densities even if infill and additional density could be easily implemented.
On the one hand, these findings can be interpreted quite optimistically. The levels of densification required to achieve minimum transit supportive densities, assuming maximum growth rates, are almost within reach of the Ontario Growth Plan time horizon of 2041. Also a positive finding for planners is that minimum transit supportive densities can be achieved while still building ground-oriented housing types and even maintaining a sizeable share of single-detached houses. Only a small share of new housing built would have to be in the form of high-rise developments that are often more difficult to implement as infill in existing neighborhoods. Of course, in practice it would make the most sense to focus some high-rise developments in core areas and consider what is often called more ‘gentle’ forms of density (such as row-housing and walk-up apartments) in existing single-detached neighborhoods, which the Ontario Growth Plan does propose to some extent [
3,
12,
14,
18,
19].
On the other hand, the findings do cast doubt on “density-as-sustainability” policy because of the time it takes to implement. The growth rates used here are based on 10-year historic rates where the GTHA experienced dramatic growth. There is no guarantee that this level of development will continue. Also, the analysis here used minimum densities required. The timeframe would increase substantially if the goal were to bring most existing areas in line with the higher minimum rapid transit densities. This is in fact a major shortcoming of “density-as-sustainability”; it relies on growth to bring existing built up areas in line with what are deemed more transit supportive environments. It is not only about directing growth as is often claimed. In fact, the policy places its bet squarely on the economy to continue to produce housing at high rates to create more sustainable (defined often by levels of density) urban forms. If growth is not attained, existing auto-dependent transportation patterns could be expected to continue.
There are also several additional barriers to implementation of higher densities. First, simply adding higher densities would on its own not increase transit use, or other active modes of transport. The need for greater connectivity, walkability, and improved streetscape and urban design to help reduce car dependence is well known, as discussed earlier; and of course, transit would also need to be provided in the large swaths of low-density areas not currently serviced. Thus, the high level of densification required to even just meet a minimum level of transit supportiveness would have to be implemented in conjunction with significant investments by the government, at various scales, to transform existing neighborhood design and transportation infrastructure. At present, there is little evidence in the GTHA that the magnitude of government intervention is sufficient to achieve these goals [
18]. This is partly because transit investments are focused largely on existing transit routes, and higher density developments are being implemented in new developments, and much less so in existing low-density subdivisions.
Overall, density as a solution to the problem of auto-dependence in low-density developments is a plausible one. In theory, the speed at which density can be implemented is fast enough that growth targets could be achieved in just over 30 years, and a large share of the population could live in more transit supportive environments (even if it is just basic service levels). The problem is therefore not one of plausibility but rather one of political will, resident support, and government investment in infrastructure and neighborhood redesign. In order to achieve levels of density high enough to simply support basic service transit levels, almost all growth would have to be directed to existing neighborhoods. This would require strict enforcement of growth boundaries and targeting of most if not all new development as infill. In Toronto, attempts to increase densities in existing areas appear to be hampered by existing zoning legislation, and local resident opposition to increases in densities in existing single-detached dominated neighborhoods. As elsewhere, “[r]esistance to density is widespread” [
19] (p. 11). What is more plausible, and politically palatable, is that density policies focus their attention on major arterial roads and growth centers, and in central areas of the City of Toronto, where potential for densification is highest and most easily implementable. In fact, this is the approach taken by the Ontario Growth Plan, and the City of Toronto.
It is important to state that the findings here do not provide a case against “density-as-sustainability”. Rather, they point to the challenges of implementing density fast enough to facilitate reductions in car use among the almost 70% of the population residing in areas with densities below the minimum transit supportive density threshold. This suggests that it is important for planners to consider alternative sustainability solutions, and that density not be relied upon as the one policy to reduce greenhouse gas emissions. For instance, planners and commentators in the press who, rightly, argue that ‘clean’ cars still contribute to congestion are however commonly discounting alternative fuels as an interim solution to reduce emissions in low-density areas. Also, attempts to increase the share of telework, e-bikes, reducing trip distance and increase trip chaining, carpooling, and where feasible cycling infrastructure could receive more attention as sustainability solutions in low-density areas. While these are not likely successful strategies on their own, more attention may need to be paid to such policies, particularly in the short term, if reductions in emissions to mitigate climate change need to occur faster than what we can attain through densification to provide transit and walkability.


