Article

Multi-Objective Land-Use Allocation Considering Landslide Risk under Climate Change: Case Study in Pyeongchang-gun, Korea

1
Interdisciplinary Program in Landscape Architecture, Seoul National University, Seoul 08826, Korea
2
Department of Landscape Architecture and Rural System Engineering, Seoul National University, Seoul 08826, Korea
3
Incheon Development Institute, Incheon 22711, Korea
*
Author to whom correspondence should be addressed.
Sustainability 2017, 9(12), 2306; https://doi.org/10.3390/su9122306
Submission received: 17 October 2017 / Revised: 6 December 2017 / Accepted: 8 December 2017 / Published: 12 December 2017

Abstract

:
Extreme landslides triggered by rainfall in hilly regions frequently lead to serious damage, including casualties and property loss. The frequency of landslide occurrences may increase under climate change, due to the increasing variability of precipitation. Developing urban areas outside landslide risk zones is the most effective method of reducing or preventing damage; however, planning in real life is a complex and nonlinear problem. For such multi-objective problems, genetic algorithms may be the most appropriate optimization tools. Therefore, in this study, we suggest a comprehensive land-use allocation plan using the Non-dominated Sorting Genetic Algorithm II to overcome multi-objective problems, including the minimization of landslide risk, minimization of change, and maximization of compactness. Our study area is Pyeongchang-gun, the host city of the 2018 Winter Olympics in Korea, where high development pressure has resulted in urban sprawl into the hazard zone where a large-scale landslide occurred in 2006. We obtain 100 Pareto plans that are better than the actual land use data for at least one objective, with five plans that explain the trade-offs between meeting the first and second objectives. The results can be used by decision makers for better urban planning and for climate change-related spatial adaptation.

1. Introduction

In recent years, the increasing variability in precipitation patterns has triggered frequent extreme landslides [1,2]. Landslides are one of the critical natural phenomena that lead to serious problems in hilly regions on a global scale [3]. In the case of Gangwon-do, a typical mountainous region in Korea, 44 casualties (including 19 missing persons) resulting from flooding and landslides were reported in 2006. The Baduella District of Sri Lanka, El Cambray Dos of Guatemala, Maharashtra of India, and the Sindhupachok District of Nepal have also experienced severe damage, with more than 100 casualties in the last three years. These cities are still at risk for potential landslide damage because the frequency and scale of landslides may further increase in the near future due to climate change. Therefore, we are concerned with where the landslides may occur and how we should respond to the risk of landslides in these cities.
Over the past two decades, numerous researchers have assessed landslide hazard under the present and future conditions influenced by climate change to estimate potential probabilities [4,5,6,7,8,9]. In those studies, the amount of overlapping urban and hazardous areas represents the regional risk level because landslide damage, such as property loss and casualties, is concentrated in urban areas. Even though the reduction of risk in advance is extremely important for mitigating large-scale disasters, only a few studies have addressed how to respond to potential landslide damage, i.e., landslide risk. For urban planning purposes, landslide risk can be reduced by placing urban areas in safe zones that have lower landslide hazard grades [10,11].
Land-use composition is driven by social, economic, and environmental factors and cannot be allocated based on the mitigation of landslide risk alone. In reality, numerous objectives, constraints, and stakeholders are involved in planning, which can be conflicting [12]. Researchers have called this a “nonlinear problem,” which cannot be solved with qualitative knowledge or traditional linear modeling. In many cases, land-use planning systems have failed to balance different values, such as economic benefits, protection of natural resources, and social safety [13]. Therefore, we require scientific and quantitative tools that can incorporate numerous factors and help us create comprehensive plans.
Genetic algorithms (GA) are the most popular optimization tools to address multi-objective problems in land-use planning [14,15,16,17,18]. Unlike other heuristic approaches, the GA approach is a general-purpose search method, combining elements of directed and stochastic searches, which can create a superior balance between the exploitation and exploration of a search space [
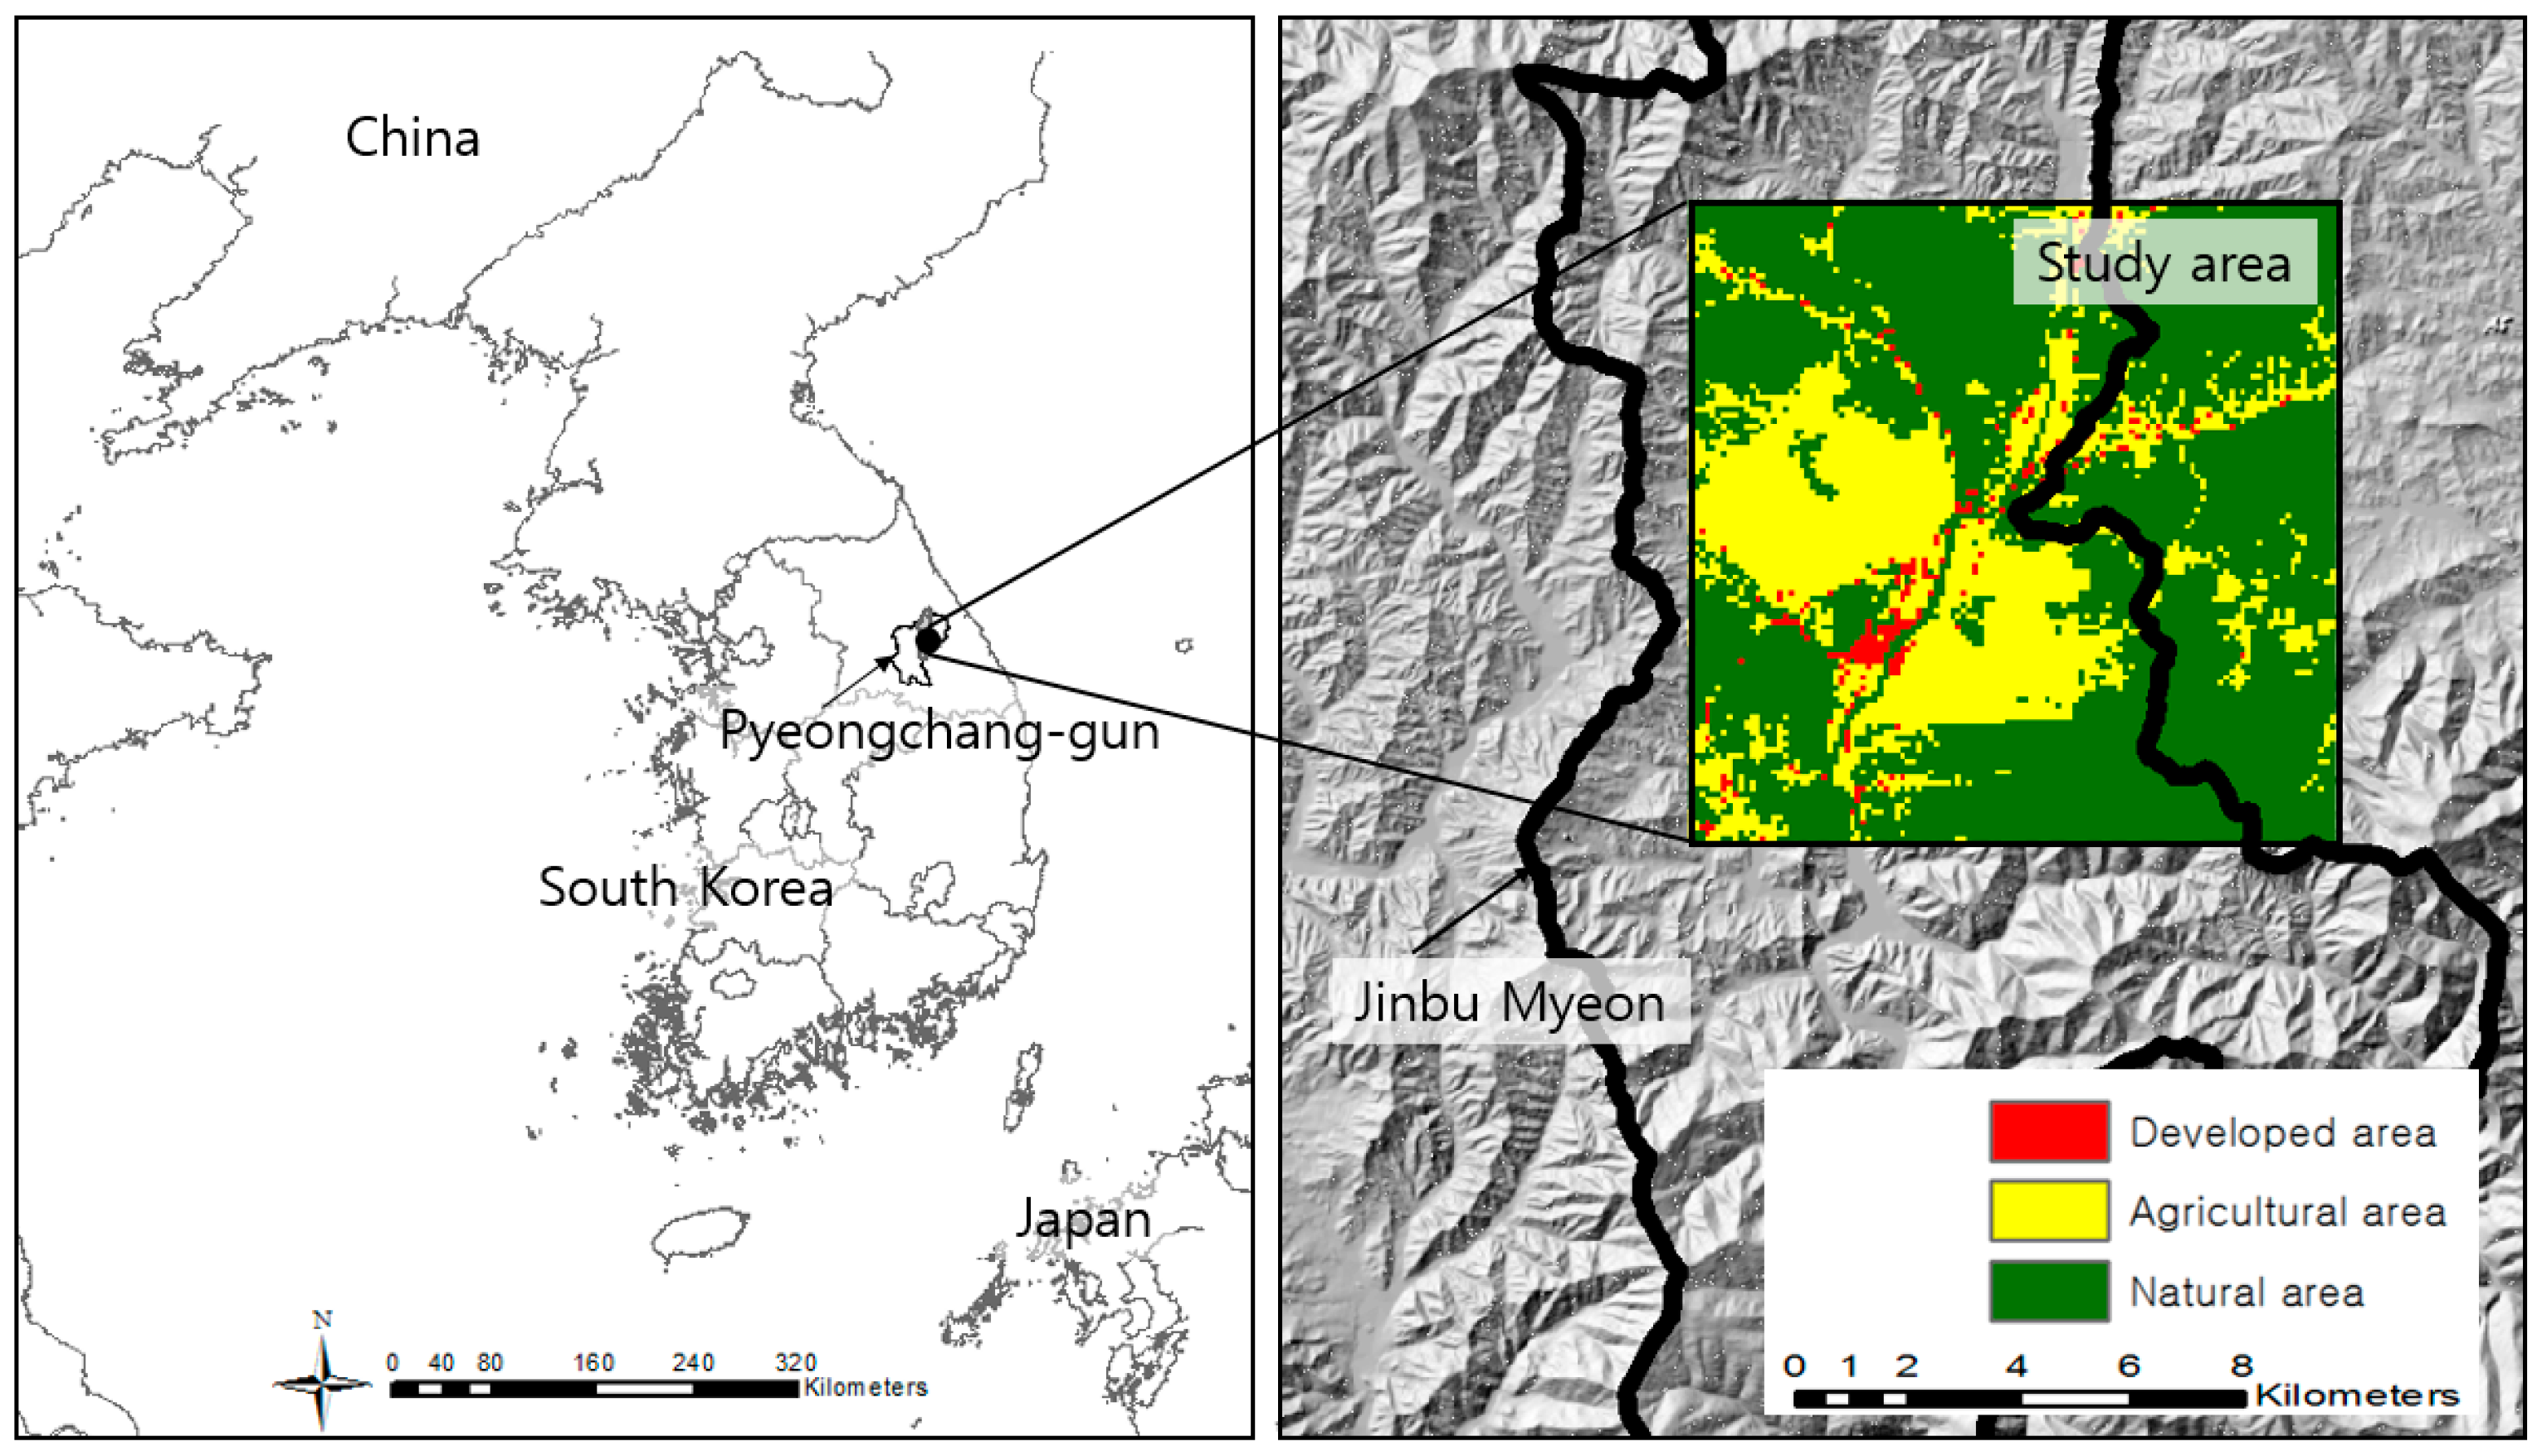
19]. Additionally, the application of a GA allows for immediate feedback to stakeholders because it can run a number of experiments with different parameter values. Therefore, we suggest a quantitative tool, the Multi-Objective Genetic Algorithm (MOGA), which can generate a comprehensive land-use allocation plan that considers landslides under climate change, and apply it to the Pyeongchang-gun area of Korea. Pyeongchang-gun, a typical mountainous city, is the fastest changing region in Korea due to its development for the 2018 Winter Olympics. Urban sprawl into natural areas in this city has caused an increase in potential disaster risk, especially with regard to landslides. We also considered the “minimization of land-use change” and the “maximization of compactness” as optimization objectives. Land-use change is associated with a certain amount of economic cost and compactness is an important factor for land management. The optimized land-use plans that we created can be used as guidelines or as basic data by regional stakeholders. They can also contribute to the spatial adaptation plans against climate change impacts. We are careful to note that the optimization results are not the only good alternatives; rather, they are meant to support further detailed design or analysis by stakeholders [14,20].
In Section 2, we introduce the study areas and describe the datasets, the method of landslide hazard analysis, and optimization. The optimization objectives and constraints are also described in this section. In Section 3, we present the changes in landslide hazards with climate change and related optimal land use patterns. In Section 4, we present the implications and limitations of the optimization results and directions for future research.

2. Materials and Methods

2.1. Study Area

Our study area is Jinbu-myeon, located in Pyeongchang-gun, in the mountainous Gangwon-do region of Korea (Figure 1). The Gangwon-do region has high landslide probability, owing to its high elevation, a dynamic topography, and large elevation differences [4]. In 2006, a large-scale shallow landslide was caused by Typhoon Ewiniar. Furthermore, we expect that the landslide probability could increase in the future according to the Representative Concentration Pathways (RCPs) climate change scenarios. However, most regional policies on landslides focus on management after the event, such as debris barrier installations, and cannot address potential landslide damage not yet incurred.
Jinbu-myeon in Pyeongchang-gun has a higher landslide risk than the other cities in Gangwon-do, because urban zones are sprawling into mountainous areas; 69% of Pyeongchang-gun is at altitudes greater than 500 m above sea level. The 2018 Winter Olympics increased the pressure for development/expansion and the migration rate into the city. Jinbu-myeon is the second-most populous city in Pyeongchang-gun and has good accessibility supported by highways and a new railway that is under construction. According to the city master plan, the potential developed area in Jinbu-myeon may increase by 69.4% by 2020 to accommodate the increasing population and the facilities for the Olympics [21]. Therefore, we must determine the direction of land-use change in Jinbu-myeon, while considering the potential for landslide damage.

2.2. Dataset

We used input variables describing climate factors, topographic factors, ground material, and vegetation factors to analyze landslide hazard and conduct optimized land-use planning (Table 1). With respect to climate factors, we focused on calculating the extreme rainfall variables during 2006 using Automatic Weather System (AWS) data. In 2006, the Gangwon-do region, including the study area, experienced a large-scale shallow landslide and flood damage from Typhoon Ewiniar, primarily in urban and farmland zones, which resulted in 25 casualties and 19 missing persons. Because the detailed investigation for the landslide was conducted in 2006 and there has been no further investigation since then, the study period was limited to 2006. We then used the 8.5 RCPs scenario to estimate the climatic conditions in the 2050s, referred to as “mid-term future” in climate change research. The scenario predictions for 2041–2070 were averaged to reduce the uncertainty caused by using model data rather than observational data. In this regard, climate change was directly reflected as a variable in hazard analysis, while it was reflected indirectly through hazard analysis in land-use optimization. We also used a digital elevation model (DEM), a soil map, and a map of forest types to define the topography, ground material, and vegetation factors, respectively.
The land cover map shows 22 land-use types that were re-categorized into three groups: urban, agricultural, and natural areas. Our purpose is to generate land-use allocation maps that are not final land-use plans, but rather alternatives to support the stakeholder’s decision or detailed design because simplified land-use types are more easily incorporated into planning as they provide only the approximate spatial extent of each land-use. Dataset resolution varied from 30 m to 1 km (Table 1); thus, it was necessary to unify them at an appropriate resolution. Finally, the entire dataset was converted to 100-m resolution raster data composed of 116 rows and 114 columns. The difficulties of objectively determining the resolution of the final data are described in Section 4.

2.3. Landslide Hazard Analysis

Landslide hazard was simulated using a maximum entropy model (MaxEnt) based on the variables in Table 1. MaxEnt, developed by AT&T Labs, has been applied to various fields, including statistical physics, optimization, and image construction [22]. Recently, MaxEnt has been applied to landslide assessment and has shown better performance regarding the area under curve (AUC) values than other models: multiple adaptive regression splines, logistic regression, and classification and regression trees [22]. Since the local government of the Gangwon-do Province possesses the only occurrence data of landslides, configuring MaxEnt to use the occurrence data is appropriate for this study area. We classified the potential landslide hazard for the future into ten grades, using the standard deviation values of the future landslide hazard and the threshold value in the present hazard model. The 10th grade represents the most dangerous areas for landslides, while the first grade represents the safest areas with respect to landslides. If the landslide hazard were classified into fewer than ten grades, the optimization of moving the hazardous urban areas to safe areas could not proceed well because the majority of safe areas would be located in high altitude areas that restrict urban development.

2.4. Land-Use Optimization

2.4.1. Objectives and Constraints

We defined three objectives for land-use allocation: the minimization of landslide risk, the minimization of change, and the maximization of compactness. The risk is a very useful concept when addressing the potential damage of future disasters under climate change [23]. Risk can be measured as the combination of the probability and consequences of an adverse event [24] (Equation (1)). We divided the probability into ten categories equal to the grades of landslide hazard because we assumed that the higher the hazard grade, the higher the probability of occurrence. We divided the consequences into three grades by land-use type: catastrophic, major-moderate, and minor-insignificant. Exposure to landslides differs by the intensity of development, namely, the land use [11]. We categorized urban areas as the highest consequence grade, “catastrophic”, while agricultural areas and forest areas were categorized as “major-moderate grade” and “minor-insignificant grade”, respectively. The spatial distribution of the consequences is altered by the optimized land-use plans. We calculated relative risk scores by comparing the average monetary value of real properties, movable assets, and services contained in each land-use type in Pyeongchang-gun. We assumed that all those monetary values were under the threat of landslides if allocated to the 10th probability grade. The risk scores decrease in proportion to the decrease in landslide probability (Table 2).
Risk = Probability ( hazard ) × Consequence ( land use   type )
Land-use change is associated with a certain amount of economic cost; thus, it is important to maintain the current land-use pattern as much as possible while also reducing the landslide risk. We used cost factors for converting land-use i to land-use j (Table 3). To reduce the error caused by using real cost, we applied dimensionless costs indicating the relative relationship of different types of land-use changes [25].
In our study region, some of the urban and agricultural areas are spatially scattered within the natural areas. It is very costly to manage and allocate resources in these areas, which may generate larger negative edge effects of urban and agricultural areas [26,27]. Therefore, we employed the third objective: maximization of compactness. The compactness of each cell can be measured by the number of neighboring cells that have the same land-use type as the focused cell. The neighboring cells of the focused cell i(r, c) form a single rectangle from (r − 1, c − 1) to (r + 1, c + 1), consisting of eight cells. If a cell i is allocated to land-use k and there are no neighboring cells allocated to k, the compactness of cell i is at a minimum, whereas, if cell i has eight neighboring cells allocated to k, the compactness is at a maximum.
We considered the increase in urban areas to accommodate the future population to be a constraint. In accordance with the 2020 master plan of Pyeongchang-gun, we assumed that urban areas would increase by 70% by the 2050s. The relative risk score for the first objective (minimization of landslide risk) decreases in the order of urban, agricultural, and natural areas, even though these areas possess the same landslide probability. If we optimize the area of each land-use type, it is highly likely that the optimization of the first objective will be achieved by reductions in urban or agriculture areas. We also excluded the areas with altitudes above 800 m from this optimization because these areas are difficult to develop in practice (Table 4).

2.4.2. Model Formulation

The objectives for the optimization can be expressed using the following formulations. There are K different land-use types and the model is divided into a regular grid with N rows and M columns. According to the Formulas (2)–(4), only one land-use k is assigned to each cell (i, j), because the binary variable x i j k equals to 1 or 0. The value a i j k associates the costs or benefits with the allocation of any particular land use to the specific cell. In the first and second objectives, each cell is assigned an a i j k value based on the score matrices defined in Section 2.4.1 (Table 2 and Table 3). The sum of all a i j k values across the study area is considered to be the optimization level for each objective. The value of b i j k is the number of neighboring cells that have the same land-use type as the focused cell (i, j) and the sum of all b i j k values is the optimization level of the third objective. The sum of the areas of all land-use types is equal to the area of the whole study area, S k (Equations (5) and (6)).
Minimize:
k = 1 K i = 1 N j = 1 M a i j k x i j k
Maximize:
i = 1 N j = 1 M b i j k x i j k
Subject to:
k = 1 K x i j k = 1 k = 1 , , K ; i = 1 , , N ; j = 1 , , M x i j k { 0 , 1 }
where:
i = 1 N j = 1 M x i j k = S k   k = 1 , , K ; i = 1 , , N ; j = 1 , , M
k = 1 K S k = N · M

2.4.3. Non-Dominated Sorting Genetic Algorithm II

We found that GA was more successful in guaranteeing the optimal solution than other heuristic approaches, such as simulated annealing, greedy growing algorithms, and tabu search [19]. Therefore, land-use allocation in this study was optimized using a Non-dominated Sorting Genetic Algorithm II (NSGAII) [28] and a specially designed crossover operator. The NSGAII generally shows good performance for optimizing three objectives and it can efficiently produce a high-quality diverse Pareto set using a non-domination rank and crowding distance. Non-domination rank can reduce the computational time, while the crowding distance can guide the selection process toward uniformly spread-out Pareto optimal [28]. If all the fitness values of solution j are less than solution i, solution j dominates solution i and has a better rank. If solutions i and j have the same rank, the solution located in less crowded regions is a better solution for the selection [28] (Figure 2). In our study, we used NSGAII to generate solutions that are diverse but appropriate for the three objectives: minimization of landslide risk, minimization of change, and maximization of compactness.
We used a fixed-length chromosome representation method, which consists of grids of genes. Each gene represents a unit and the land-use type of the unit is determined by the fitness value. The iteration process of the GA applied to our study consists of several steps, including initialization, crossover, and selection. The main loop was repeated until the convergence was achieved for all objectives (Figure 3). Population size, iteration size, and crossover rate were determined empirically.
  • Initialization: Initial populations were randomly generated to prevent convergence to the local optimum.
  • Crossover: Two focused cells, A and B, were selected randomly within one parent and then exchanged if the number of boundary cells of A and B had the same genes as B and A (Figure 4). Previous researchers developed a crossover operator similar to this method to dramatically improve the compactness [26].
  • Selection: First, we produced a solution pool composed of both the previous generation and new solutions generated by the crossover to ensure elitism. Then, solutions for the next generation were selected based on the non-domination rank and crowding distance. First, non-dominated solutions (number-one ranking) were selected and then the solutions of the next rank (dominated more than once) were selected. If the selected solutions by rank were greater than the population size, the solutions of the lowest rank would be re-sorted by the crowding distance and selected until they satisfied the population size.

3. Results

3.1. Landslide Hazard

Figure 5 shows the urban and agricultural areas that are exposed to potential landslide damage with ten grades of landslide hazards. Lower hazard grades are distributed on the peak of a mountain where development is generally restricted. Outside of this peak, the higher hazard grades (greater than 6) account for 49.3% of the study area (less than half), but 65.2% of urban areas and 70.0% of agricultural areas overlap with these grades (Table 5, Figure 5). In particular, the ninth and tenth grades are present in the lowest proportions but are distributed around the center of urban areas in the southwestern study area. The sixth to eighth grades overlap with much of the steep agricultural area around the plain.

3.2. Optimization

The optimization model was simulated over 350 iterations with a population size of 100 and a crossover rate of 0.05, which were determined empirically. Non-dominated solutions in the final iteration were greatly moved to the inner fitness space. This indicates that solutions are optimized to a better status for all objectives during the simulation (Figure 6a). The fitness value of each objective decreases steadily and then converges at the point of certainty (Figure 6b–d). However, if we consider all non-dominated solutions, the coefficients of variation in the final generation would be different for each objective. The coefficient of variation of the third objective is lower than that of the first and second objectives. This indicates that all non-dominated solutions satisfy the third objective to some extent, but tradeoffs between the first and second objectives are relatively strong (Table 6).
We organized six of the non-dominated solutions, A, B, C, D, E and F, along the two dimensions that explain the tradeoffs between the first and second objectives (Figure 7). Certain points that appear to be “dominated solutions” on two dimensions correspond to non-dominated solutions on three dimensions (including the third objective, maximization of compactness). For example, plan D shows a more compact land-use pattern than the other plans that are located near and inside of plan D. If we consider the actual land as a reference point, plans A, B, C and D, which are located on the left side, can reduce the potential landslide risk by one-third compared to the actual land use. In contrast, plans E and F can increase the potential landslide risk despite conversion because conversion contributes to the improvement of compactness (Table 7, Figure 7). Additionally, all plans are better than the actual land use for the third objective-maximization of compactness (Table 7).

4. Discussion

We generated a range of optimized plans for the multi-objective problems without the relative weighting factors. From the perspective of reducing the landslide risk, land-use plans optimized on one objective could be better than the other plans optimized on multi-objectives, but this can result in unacceptable plans for stakeholders with different interests. In multi-objective problems, however, defining the relative importance of each objective is very difficult. Additionally, the determined weights have difficulty in handling the changing environment; the most important objective under current conditions may not be the most important one in the future. The non-dominated land-use plans we suggested using NSGAII include all possible combinations of weighting factors [29]. The planners or decision makers can choose one plan, depending on their knowledge or problem-related factors [30] and use it to conduct detailed planning.
All the optimized plans are better than the actual land use for at least one objective: minimization of landslide risk or maximization of compactness. All plans showed a dramatic improvement—especially in compactness—by at least 60%. However, in case landslides become a major issue, plans E and F are difficult to select (Figure 7) because of the landslide risk increase from the current level. Land conversion in these plans occurs only to improve compactness. Compactness is one of the most important objectives considered in most related studies [17,26,27,31,32,33,34,35,36,37], but landslide risk also needs to be reduced to some extent, because land use conversion is very costly. We have obtained 100 non-dominated plans of various weight combinations, but the range of plans that can actually be selected is narrow. If the Pareto front line is moved inward (southwestward), we can obtain more plans distributed on the left side of the red line (Figure 7). We expect this can be done in future studies by incorporating the actual land use in the initial population or by establishing strict constraints such as the conversion ratio [37,38] and maximum cost [39]. In this study, we employed some climate variables from the RCP scenario to reflect the long-term future of the study area in land-use planning. The spatial resolution of the RCP scenario can create some problems in generating land-use plans. The scenario data are produced at the resolution of 1 km by KMA and the resolution of other variables is 30 m. We considered a resolution of 100 m because further downscaling could decrease the reliability of the scenario data. However, the resolution of 100 m is too large to express linear land-use patterns such as rivers, railroads, and highways and subtle changes in soil and topography. In fact, the linear land-use types tend to disappear in all optimized plans. Therefore, we expect that the resolution problem of climate scenarios will be solved in future studies on land-use planning.
Our optimized results can also be considered spatial adaptation options or solutions for the potential landslide problem under climate change. Climate change research has so far focused on the assessment of the impacts of climate change on disasters, ecology, and industry. We now need to discuss spatial adaptation: how to change the actual space in response to climate change impacts because climate change is already happening [23]. Adaptations to disasters such as landslides are a priority, as these events can lead to the loss of life and property. There are two ways to simulate land-use changes for adaptation: land-use predictions based on scenarios and land-use optimization to generate scenarios. Land-use prediction simulates land-use changes by a transition rule set based on the past trends and agent behavior. If we want to solve problems using land-use predictions, we have to establish related strategies first, then change the transition rule set, and finally simulate future land-use changes. It is not guaranteed, however, that simulated land-use change is appropriate for the problem at hand. Using the second approach, the land-use optimization, we can simulate appropriate land-use changes for the initial problem and then establish strategies to facilitate land-use optimization. GA is considered one of the most effective optimization tools. In some studies, these two approaches were applied in the coupled form to complement each other [40,41], but the optimization model was better than the prediction model in terms of problem-solving performance [42].
To obtain more reasonable adaptation options, we plan to conduct future research that considers the positive possibilities together with the negative impacts of climate change [43]. This study focused only on reducing the negative impacts of climate change by avoiding planning in urban areas where landslides are most likely to occur. However, by considering positive possibilities such as the expansion of suitable cultivation areas or habitats together, we can link the optimized results to sustainability in future climate change research, which will consider the balance among the social, environmental, and economic aspects.

5. Conclusions

In this study, we suggested tools to identify comprehensive land-use alternatives that could contribute to the reduction of the potential landslide risk in Pyeongchang-gun. This approach can provide guidance to municipal governments when allocating urban, agricultural, and natural areas and when establishing spatial adaptation plans that consider extreme meteorological disasters under climate change. The model developed based on GA is generally flexible and thus, can easily be applied to other similar problems. We only need to modify some part of the fitness function and dataset according to the objectives or adjust model parameters that suit the problem. For example, to consider the landslide hazard under different climate change scenarios, we could generate new optimized plans for that problem by replacing landslide hazard maps derived from new scenarios. Our model could also be used to generate land-use allocation plans for other cities suffering from landslides. A risk matrix for the land-use priority, objectives, and constraints, however, should be identified for any new cases.

Acknowledgments

This study was supported by the BK 21 Plus Project in 2017 (Seoul National University Interdisciplinary Program in Landscape Architecture, Global Leadership Program toward innovative green infrastructure) and the Korea Environmental Industry and Technology Institute (KEITI) through Public Technology Program based on Environmental Policy Program, funded by Korea Ministry of Environment (MOE) (Grant No. 2016000210004).

Author Contributions

E.J. Yoon conceived the entire paper, analyzed optimal land use allocation. D.K. Lee and H.G. Kim discussed the composition of the thesis. H.G. Kim analyzed the hazard of landslides. H.R. Kim, E.A. Jung and H.Y. Yoon analyzed monetary values of land-use types for risk matrix. The draft was substantially revised after discussion about the structure and result of this paper by all authors.

Conflicts of Interest

The authors declare no conflict of interest.

References

  1. Guzzetti, F.; Peruccacci, S.; Rossi, M.; Stark, C.P. Rainfall thresholds for the initiation of landslides in central and southern Europe. Meteorol. Atmos. Phys. 2007, 98, 239–267. [Google Scholar] [CrossRef]
  2. Kim, K.H.; Jung, H.R.; Park, J.H.; Ma, H.S. Analysis on Rainfall and Geographical Characteristics of Landslides in Gyeongnam Province. J. Korean Environ. Restor. Technol. 2011, 14, 33–45. [Google Scholar]
  3. Rahaman, S.A.; Aruchamy, S.; Jegankumar, R. Geospatial approach on landslide hazard zonation mapping using multicriteria decision analysis: A study on Coonoor and Ooty, part of Kallar watershed, the Nilgiris, Tamil Nadu. Int. Arch. Photogramm. Remote Sens. Spat. Inf. Sci. 2014, 40, 1417–1422. [Google Scholar] [CrossRef]
  4. Kim, H.G.; Lee, D.K.; Park, C.; Kil, S.; Son, Y.; Park, J.H. Evaluating landslide hazards using RCP 4.5 and 8.5 scenarios. Environ. Earth Sci. 2015, 73, 1385–1400. [Google Scholar] [CrossRef]
  5. Ayalew, L.; Yamagishi, H. The application of GIS-based logistic regression for landslide susceptibility mapping in the Kakuda-Yahiko Mountains, Central Japan. Geomorphology 2005, 65, 15–31. [Google Scholar] [CrossRef]
  6. Yesilnacar, E.; Topal, T. Landslide susceptibility mapping: A comparison of logistic regression and neural networks methods in a medium scale study, Hendek region (Turkey). Eng. Geol. 2005, 79, 251–266. [Google Scholar] [CrossRef]
  7. Lee, S.; Sambath, T. Landslide susceptibility mapping in the Damrei Romel area, Cambodia using frequency ratio and logistic regression models. Environ. Geol. 2006, 50, 847–855. [Google Scholar] [CrossRef]
  8. Yilmaz, I. Landslide susceptibility mapping using frequency ratio, logistic regression, artificial neural networks and their comparison: A case study from Kat landslides (Tokat-Turkey). Comput. Geosci. 2009, 35, 1125–1138. [Google Scholar] [CrossRef]
  9. Rozos, D.; Skilodimou, H.D.; Loupasakis, C.; Bathrellos, G.D. Application of the revised universal soil loss equation model on landslide prevention. An example from N. Euboea (Evia) Island, Greece. Environ. Earth Sci. 2013, 70, 3255–3266. [Google Scholar]
  10. Messeri, A.; Morabito, M.; Messeri, G.; Brandani, G.; Petralli, M.; Natali, F.; Grifoni, D.; Crisci, A.; Gensini, G.; Orlandini, S. Weather-Related Flood and Landslide Damage: A Risk Index for Italian Regions. PLoS ONE 2015, 10, e0144468. [Google Scholar] [CrossRef] [PubMed]
  11. Sudmeier-Rieux, K.; Fra.Paleo, U.; Garschagen, M.; Estrella, M.; Renaud, F.G.; Jaboyedoff, M. Opportunities, incentives and challenges to risk sensitive land use planning: Lessons from Nepal, Spain and Vietnam. Int. J. Disaster Risk Reduct. 2015, 14, 205–224. [Google Scholar] [CrossRef]
  12. Neema, M.N.; Ohgai, A. Multi-objective location modeling of urban parks and open spaces: Continuous optimization. Comput. Environ. Urban Syst. 2010, 34, 359–376. [Google Scholar] [CrossRef]
  13. Chen, W.; Carsjens, G.; Zhao, L.; Li, H. A Spatial Optimization Model for Sustainable Land Use at Regional Level in China: A Case Study for Poyang Lake Region. Sustainability 2014, 7, 35–55. [Google Scholar] [CrossRef]
  14. Stewart, T.J.; Janssen, R.; Van Herwijnen, M. A genetic algorithm approach to multiobjective land use planning. Comput. Oper. Res. 2004, 31, 2293–2313. [Google Scholar] [CrossRef]
  15. Porta, J.; Parapar, J.; Doallo, R.; Rivera, F.F.; Santé, I.; Crecente, R. High performance genetic algorithm for land use planning. Comput. Environ. Urban Syst. 2013, 37, 45–58. [Google Scholar] [CrossRef]
  16. Matthews, K.B.; Craw, S.; Elder, S.; Sibbald, A.R.; MacKenzie, I. Applying Genetic Algorithms to Multi-Objective Land Use Planning. In Proceedings of the Genetic Evolutionary Computation Conference (GECCO 2000), Las Vegas, NV, USA, 8–12 July 2000; pp. 613–620. [Google Scholar]
  17. Cao, K.; Batty, M.; Huang, B.; Liu, Y.; Yu, L.; Chen, J. Spatial multi-objective land use optimization: Extensions to the non-dominated sorting genetic algorithm-II. Int. J. Geogr. Inf. Sci. 2011, 25, 1949–1969. [Google Scholar] [CrossRef]
  18. Zhang, W.; Huang, B. Soil erosion evaluation in a rapidly urbanizing city (Shenzhen, China) and implementation of spatial land-use optimization. Environ. Sci. Pollut. Res. 2015, 22, 4475–4490. [Google Scholar] [CrossRef] [PubMed]
  19. Datta, D.; Deb, K.; Fonseca, C.M.; Lobo, F.G.; Condado, P.A.; Seixas, J. Multi-Objective Evolutionary Algorithm for Land-Use Management Problem. Int. J. Comput. Intell. Res. 2007, 3, 371–384. [Google Scholar]
  20. Ligmann-Zielinska, A.; Church, R.; Jankowski, P. Spatial optimization as a generative technique for sustainable multiobjective land-use allocation. Int. J. Geogr. Inf. Sci. 2008, 22, 601–622. [Google Scholar] [CrossRef]
  21. Pyeongchang County. 2020 Master Plan of Pyeongchang City. Unpublished work. 2014. [Google Scholar]
  22. Phillips, S.; Anderson, R.; Schapire, R. Maximum entropy modeling of species geographic distributions. Ecol. Model. 2006, 190, 231–259. [Google Scholar] [CrossRef]
  23. IPCC. Climate Change 2014 Synthesis Report; Contribution of Working Groups I, II, and III to the Fifth Assessment Report of the Intergovernmental Panel on Climate Change; Core Writing Team, Pachauri, R.K., Meyer, L.A., Eds.; IPCC: Geneva, Switzerland, 2014. [Google Scholar]
  24. Renn, O. Three decades of risk research: Accomplishments and new challenges. J. Risk Res. 1998, 1, 49–71. [Google Scholar] [CrossRef]
  25. Zhang, W.; Huang, B. Land Use Optimization for a Rapidly Urbanizing City with Regard to Local Climate Change: Shenzhen as a Case Study. J. Urban Plan. Dev. 2014, 141, 5014007. [Google Scholar] [CrossRef]
  26. Cao, K.; Huang, B.; Wang, S.; Lin, H. Sustainable land use optimization using Boundary-based Fast Genetic Algorithm. Comput. Environ. Urban Syst. 2012, 36, 257–269. [Google Scholar] [CrossRef]
  27. Li, X.; Parrott, L. An improved Genetic Algorithm for spatial optimization of multi-objective and multi-site land use allocation. Comput. Environ. Urban Syst. 2016, 59, 184–194. [Google Scholar] [CrossRef]
  28. Deb, K.; Pratab, S.; Agarwal, S.; Meyarivan, T. A Fast and Elitist Multiobjective Genetic Algorithm: NGSA-II. IEEE Trans. Evolut. Comput. 2002, 6, 182–197. [Google Scholar] [CrossRef]
  29. Balling, R.J.; Taber, J.T.; Brown, M.R.; Day, K. Multiobjective Urban Planning Using Genetic Algorithm. J. Urban Plan. Dev. 1999, 125, 86–99. [Google Scholar] [CrossRef]
  30. Srinivas, N.; Deb, K. Muiltiobj ective Optimization Using Nondominated Sorting in Genetic Algorithms. Evolut. Comput. 1995, 2, 221–248. [Google Scholar] [CrossRef]
  31. Eikelboom, T.; Janssen, R.; Stewart, T.J. A spatial optimization algorithm for geodesign. Landsc. Urban Plan. 2015, 144, 10–21. [Google Scholar] [CrossRef]
  32. Eldrandaly, K. GEP-based spatial decision support system for multisite land use allocation. Appl. Soft Comput. 2010, 10, 694–702. [Google Scholar] [CrossRef]
  33. Karakostas, S.M. Bridging the gap between multi-objective optimization and spatial planning: A new post-processing methodology capturing the optimum allocation of land uses against established transportation infrastructure. Transp. Plan. Technol. 2017, 40, 305–326. [Google Scholar] [CrossRef]
  34. Liu, Y.; Yuan, M.; He, J.; Liu, Y. Regional land-use allocation with a spatially explicit genetic algorithm. Landsc. Ecol. Eng. 2014, 11, 209–219. [Google Scholar] [CrossRef]
  35. Mohammadi, M.; Nastaran, M.; Sahebgharani, A. Development, application, and comparison of hybrid meta-heuristics for urban land-use allocation optimization: Tabu search, Genetic Algorithm, GRASP, and simulated annealing algorithms. Comput. Environ. Urban Syst. 2016, 60, 23–36. [Google Scholar] [CrossRef]
  36. Shaygan, M.; Alimohammadi, A.; Mansourian, A.; Gobara, Z.S.; Kalami, S.M. Spatial multi-objective optimization approach for land use allocation using NSGA-II. IEEE J. Sel. Top. Appl. Earth Obs. Remote Sens. 2014, 7, 873–883. [Google Scholar] [CrossRef]
  37. Yuan, M.; Liu, Y.; He, J.; Liu, D. Regional land-use allocation using a coupled MAS and GA model: From local simulation to global optimization: A case study in Caidian District, Wuhan, China. Cartogr. Geogr. Inf. Sci. 2014, 41, 363–378. [Google Scholar] [CrossRef]
  38. Zhang, W.; Cao, K.; Liu, S.; Huang, B. A multi-objective optimization approach for health-care facility location-allocation problems in highly developed cities such as Hong Kong. Comput. Environ. Urban Syst. 2016, 59, 220–230. [Google Scholar] [CrossRef]
  39. Yim, K.K.M.; Wong, S.C.; Chen, A.; Wong, C.K.; Lam, W.H.K. A reliability-based land use and transportation optimization model. Transp. Res. Part C Emerg. Technol. 2011, 19, 351–362. [Google Scholar] [CrossRef]
  40. Li, X.; Lao, C.; Liu, X.; Chen, Y. Coupling urban cellular automata with ant colony optimization for zoning protected natural areas under a changing landscape. Int. J. Geogr. Inf. Sci. 2011, 25, 575–593. [Google Scholar] [CrossRef]
  41. Huang, B.; Zhang, W. Sustainable land-use planning for a downtown lake area in central china: Multiobjective optimization approach aided by urban growth modeling. J. Urban Plan. Dev. 2014, 140, 1–12. [Google Scholar] [CrossRef]
  42. Zhang, W.; Wnag, H.; Han, F.; Gao, J.; Nguyen, T.; Chen, Y.; Huang, B.; Zhan, F.B.; Zhou, L.; Hong, S. Modeling urban growth by the use of a multiobjective optimization approach: Environment and economic issues for the Yangtz watershed, China. Environ. Sci. Pollut. Res. 2014, 21, 13027–13042. [Google Scholar] [CrossRef] [PubMed]
  43. Klein, T.; Holzkämper, A.; Calanca, P.; Seppelt, R.; Fuhrer, J. Adapting agricultural land management to climate change: A regional multi-objective optimization approach. Landsc. Ecol. 2013, 28, 2029–2047. [Google Scholar] [CrossRef]
Figure 1. Study area: Jinbu-myeon, Pyeongchang-gun.
Sustainability 09 02306 g001
Figure 2. Crowding distance & non dominated solutions.
Sustainability 09 02306 g002
Figure 3. Process of the genetic algorithm (GA).
Sustainability 09 02306 g003
Figure 4. The crossover operator.
Sustainability 09 02306 g004
Figure 5. Current land use (a) and grades of landslide hazard (b).
Sustainability 09 02306 g005
Figure 6. Change in the non-dominated solutions.
Sustainability 09 02306 g006
Figure 7. Final optimized plans considering tradeoffs. Red line indicates the level of landslide risk in actual land use; Plan A and F are the most effective alternatives for the first and second objective respectively. Plan B, C and D (plans between A and F) are alternatives by various combination of weights.
Sustainability 09 02306 g007
Table 1. Dataset and variables for the study.
SectionData Source and TypeReferenceData Format
Landslide hazardAWS (Automatic Weather System) a
-
Daily maximum rainfall (mm)
-
5 d of maximum precipitation (mm)
-
Number of days with over 120 mm of rainfall
KMA c, 2006Point
2041–2070 8.5 RCPs scenario bKMA, 2011Raster, 1 km
DEM (Digital Elevation Model)
-
Slope
-
Elevation
KME d, 2008Raster, 30 m
Soil map
-
Soil depth/soil drainage/soil type
WAMIS e, 2006Raster, 30 m
Map of forest type
-
Coniferous/Deciduous/Mixed forest
-
Natural forest, Artificial forest
KME, 2005Raster, 30 m
Land-use allocation2020 Master planPyeongchang-gun, 2014Tables
Land cover map
-
Urban/agricultural/natural data
KME, 2006Raster, 30 m
DEM
-
Elevation
KME, 2008Raster, 30 m
Regional statistics
-
Crop yield
-
Industrial/commercial production
-
Forest production
Pyeongchang-gun, 2005–2015Tables
a AWS data originally provided in hourly format was modified into daily format to be consistent with the climate change scenario. b Korea Meteorological Administration (KMA) downscaled the global model (HadGEM2-AO, 135 km unit) to the regional model (HadGEM3-RA, 12.5 km unit) using a dynamic technique. Additionally, the KMA revised the regional model to 1-km units using PRISM based downscaling estimation model. c Korea Metrological Administration. d Korea Ministry of Environment. e Water Resources Management Information System.
Table 2. Risk matrix for the landslides (unit: ratio of monetary values).
Probability Consequence12345678910
Urban0014102033485965
Agricultural00013310141719
Natural0000011122
Table 3. Cost factors for land-use change (unit: relative weights 0–1).
Land-Use TypeChange to (Land-Use j)
Developed AreaAgricultural AreaNatural Area
Change from (land-use i)Developed area011
Agricultural area0.600.2
Natural area0.70.40
Table 4. Areas of actual land-use types and constraints (unit: 10,000 m2).
TotalUrbanAgriculturalNatural (9132)
Above 800 m (Fixed)Below 800 m (Non-Fixed)
13,224264382839755157
Table 5. Areas and proportions for the grades of landslide hazard (10,000 m2, %).
GradeTotal AreaUrban AreaAgricultural AreaNatural Area
6th2475(18.7)37(14.0)960(25.1)1478(16.2)
7th1175(8.9)39(14.8)460(12.0)676(7.4)
8th1260(9.5)50(18.9)561(14.7)649(7.1)
9th1100(8.3)32(12.1)535(14.0)533(5.8)
10th507(3.8)14(5.3)165(4.3)328(3.6)
Total6517(49.3)172(65.2)2681(70.0)3664(40.1)
Table 6. Statistics of the final Pareto plans.
ObjectivesAverageMinimumMaximumStandard DeviationCoefficient of Variation
First objective36,36228,00945,981528114.52
Second objective14181150175617312.20
Third objective6420531675586249.72
Table 7. Fitness values of the optimized plans.
Plan APlan BPlan CPlan DPlan EPlan FCurrent
First objective24,08928,40830,98236,36341,22446,23941,100
Second objective1747151614071503123211610
Third objective60676684628858145778581417,870

