Article

Classification of the Relationship between Household Welfare and Ecosystem Reliance in the Miyun Reservoir Watershed, China

1
State Key Laboratory of Urban and Regional Ecology, Research Center for Eco-Environmental Sciences, Chinese Academy of Sciences, Beijing 100085, China
2
College of Resources and Environment, University of Chinese Academy of Sciences, Beijing 100049, China
3
Beijing Water Science and Technology Institute, Beijing 100048, China
4
School of Economics and Finance, Xi’an Jiaotong University, Xi’an 710061, China
*
Author to whom correspondence should be addressed.
Sustainability 2017, 9(12), 2290; https://doi.org/10.3390/su9122290
Submission received: 25 September 2017 / Revised: 21 November 2017 / Accepted: 5 December 2017 / Published: 9 December 2017

Abstract

:
Household welfare is inseparable from the environment because of its dependence on ecosystems and their services. However, linking household welfare and ecosystems in order to inform differentiated household livelihood development in spatially heterogeneous regions is still a great challenge. Based on a field survey of 1754 households, we grouped the relationships between household welfare (defined by total income) and ecosystem reliance (expressed by an index of dependence on ecosystem services) in the Watershed of Miyun Reservoir, the only source of surface water for domestic use in Beijing, China. The relationships can be grouped into four types: high welfare and high dependency; low welfare and low dependency; high welfare and low dependence; and low welfare and high dependency. Family structure, households’ education and skill level, and the proximity to Beijing have significant impacts on household welfare, while the quantity of natural capital and eco-compensation fund significantly contribute to the ecosystem dependence. Maintaining suitable family size and age structure, improving education and skill levels, and strengthening payment for ecosystem services within low welfare households would be effective approaches to their welfare improvement. The above classification can help design tailored policy and management options to promote sustainable livelihoods based on different household subgroups.

1. Introduction

The Millennium Ecosystem Assessment has tried to evaluate the relationship between ecosystems and human well-being [1]. The focus of policy makers is to guarantee the sustainable supply of ecosystem services and develop effective human–nature relationships [2,3,4,5,6,7,8,9]. For developing countries, reducing poverty and improving environmental quality are important goals of sustainable development. Improving the welfare of farmers and protecting the ecosystem have become common concerns of researchers, especially in rural areas [10,11]. The process of a household’s efforts to improve its own welfare reflects “livelihood”, which involves “ability, capital (material and social resources) and activities to survive” [12]. Achieving a sustainable livelihood will increase a household’s ability to manage stress, as well as maintain and enhance a household’s capabilities and capital without destroying natural resources [12]. The different forms of livelihood capital include natural capital (e.g., land), physical capital (e.g., durable goods), human capital (e.g., household size), financial capital (e.g., deposit), and social capital (communication cost), which are widely used in previous research [13,14]. The sustainable livelihood analysis framework developed by the UK’s International Development Agency endeavors to establish the logical relationship and interaction mechanism among livelihood capital, livelihood activities, and livelihood consequences [15]. Households in different natural environments and social systems have different livelihood strategies that depend on their own livelihood capital. These households deal with risks and their impacts by combining different capitals, and maintain their livelihood security by converting flexibly between various livelihood strategies, in order to achieve a sustainable livelihood [16].
As an economic entity that makes investment, production, and consumption decisions, households have the functions of production, consumption, accumulation, and social development [17]. The basic characteristics (such as capital, technology, and labor allocation) of households determine the production and consumption behaviors, which have direct relations with natural capital and ecosystems [18]. In agricultural households, farmers’ livelihood strategies and activities are influenced by many factors, such as the natural environment (natural resources, geographical location, etc.), economic and social factors (infrastructure, education level, institutional policies), and other factors. For example, with the urbanization of rural areas, farmers no longer rely on traditional agriculture only, but transform to a variety of livelihood strategies, such as employment in the commercial and service industries, and migration [19,20]. At the same time, households’ choice of particular livelihood strategies with different levels of natural resources utilization will lead to a direct or indirect relationship with the land, forests, water resources, and other environmental factors in an ecological system. This may damage ecological functions and produce a series of environmental problems, ultimately endangering the welfare of the households themselves [5]. Previous research on the livelihood capital, livelihood activities and strategies, and livelihood consequences of households domestically and internationally provide a new perspective to clarify the relationship between ecosystem services and human welfare [21]. However, it is still a challenge to inform household livelihood development by classifying the relationships between household welfare and ecosystem reliance, especially in spatially heterogeneous watershed with different requirements of management and policy measures [22].
In this study, we chose the Miyun Reservoir watershed as the research area, which is an important ecological protection zone, and analyzed the dependency of human on ecosystem services, the support an ecosystem provides, and the types of relationships that develop. Our objectives were to determine the factors affecting the relationships, to undertake a comprehensive study, and to establish a formidable database that helps policy makers determine policy priorities for improving human welfare and coordinating them with the ecosystems. Hence, we established the study framework of the relationship between ecosystems and household welfare, and then applied the framework to group the relationships into four types. Finally, the impact factors of four relationships were identified. By classifying the relationships, we hope our findings will help design tailored policy and management options to promote sustainable livelihoods based on different household subgroups.

2. Study Area and Methods
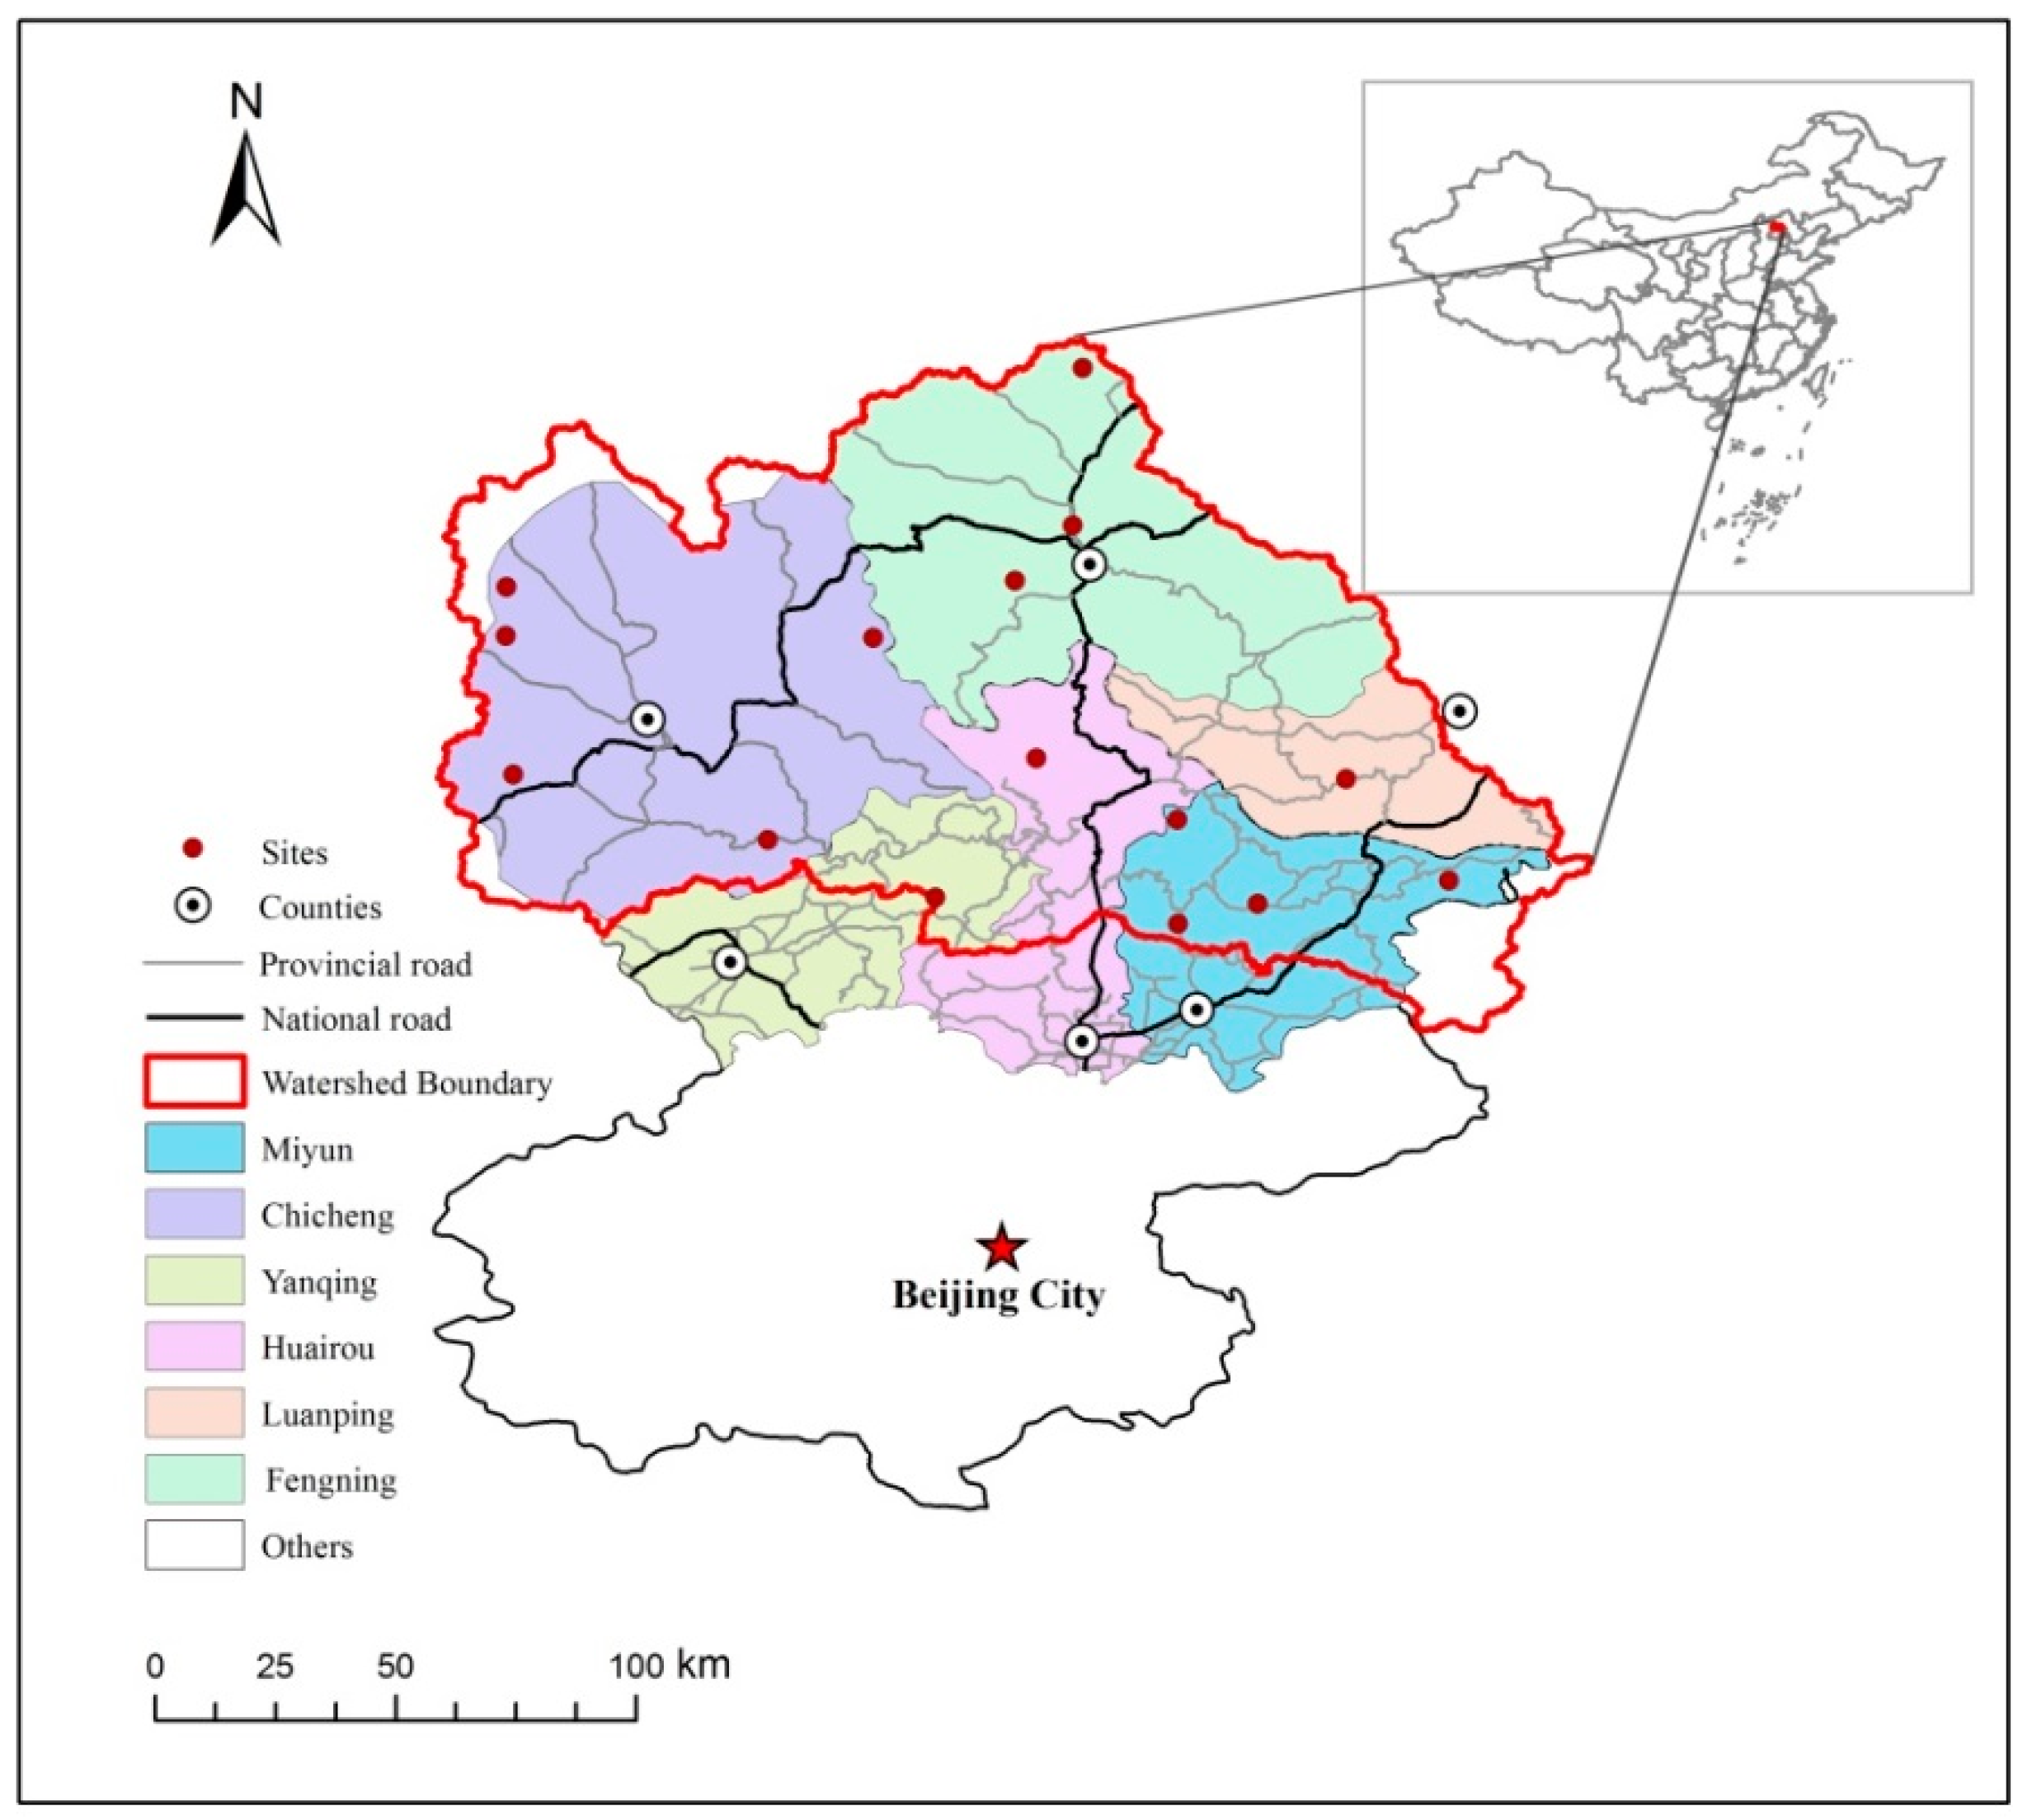
2.1. Study Area

The Miyun Reservoir is located approximately 100 km north of Beijing, China (Figure 1), and is the major surface water source for Beijing. The Miyun Reservoir watershed encompasses two administrative regions and 65 townships in six counties, including Miyun, Huairou, and Yanqing in Beijing, and Luanping, Fengning, and Chicheng in Hebei. The total area of the watershed is approximately 1.52 km2, approximately 80% of which is located in Hebei Province and the remainder in the municipality of Beijing (Figure 1). The ecosystems in the watershed provide important ecosystem services (e.g., food production, soil erosion control, water purification), not only for local people, but also for Beijing. However, there exist significantly different relationships between ecosystems and household welfare in different areas of Miyun Reservoir watershed due to different resource endowment and requirements of ecosystem conservation.

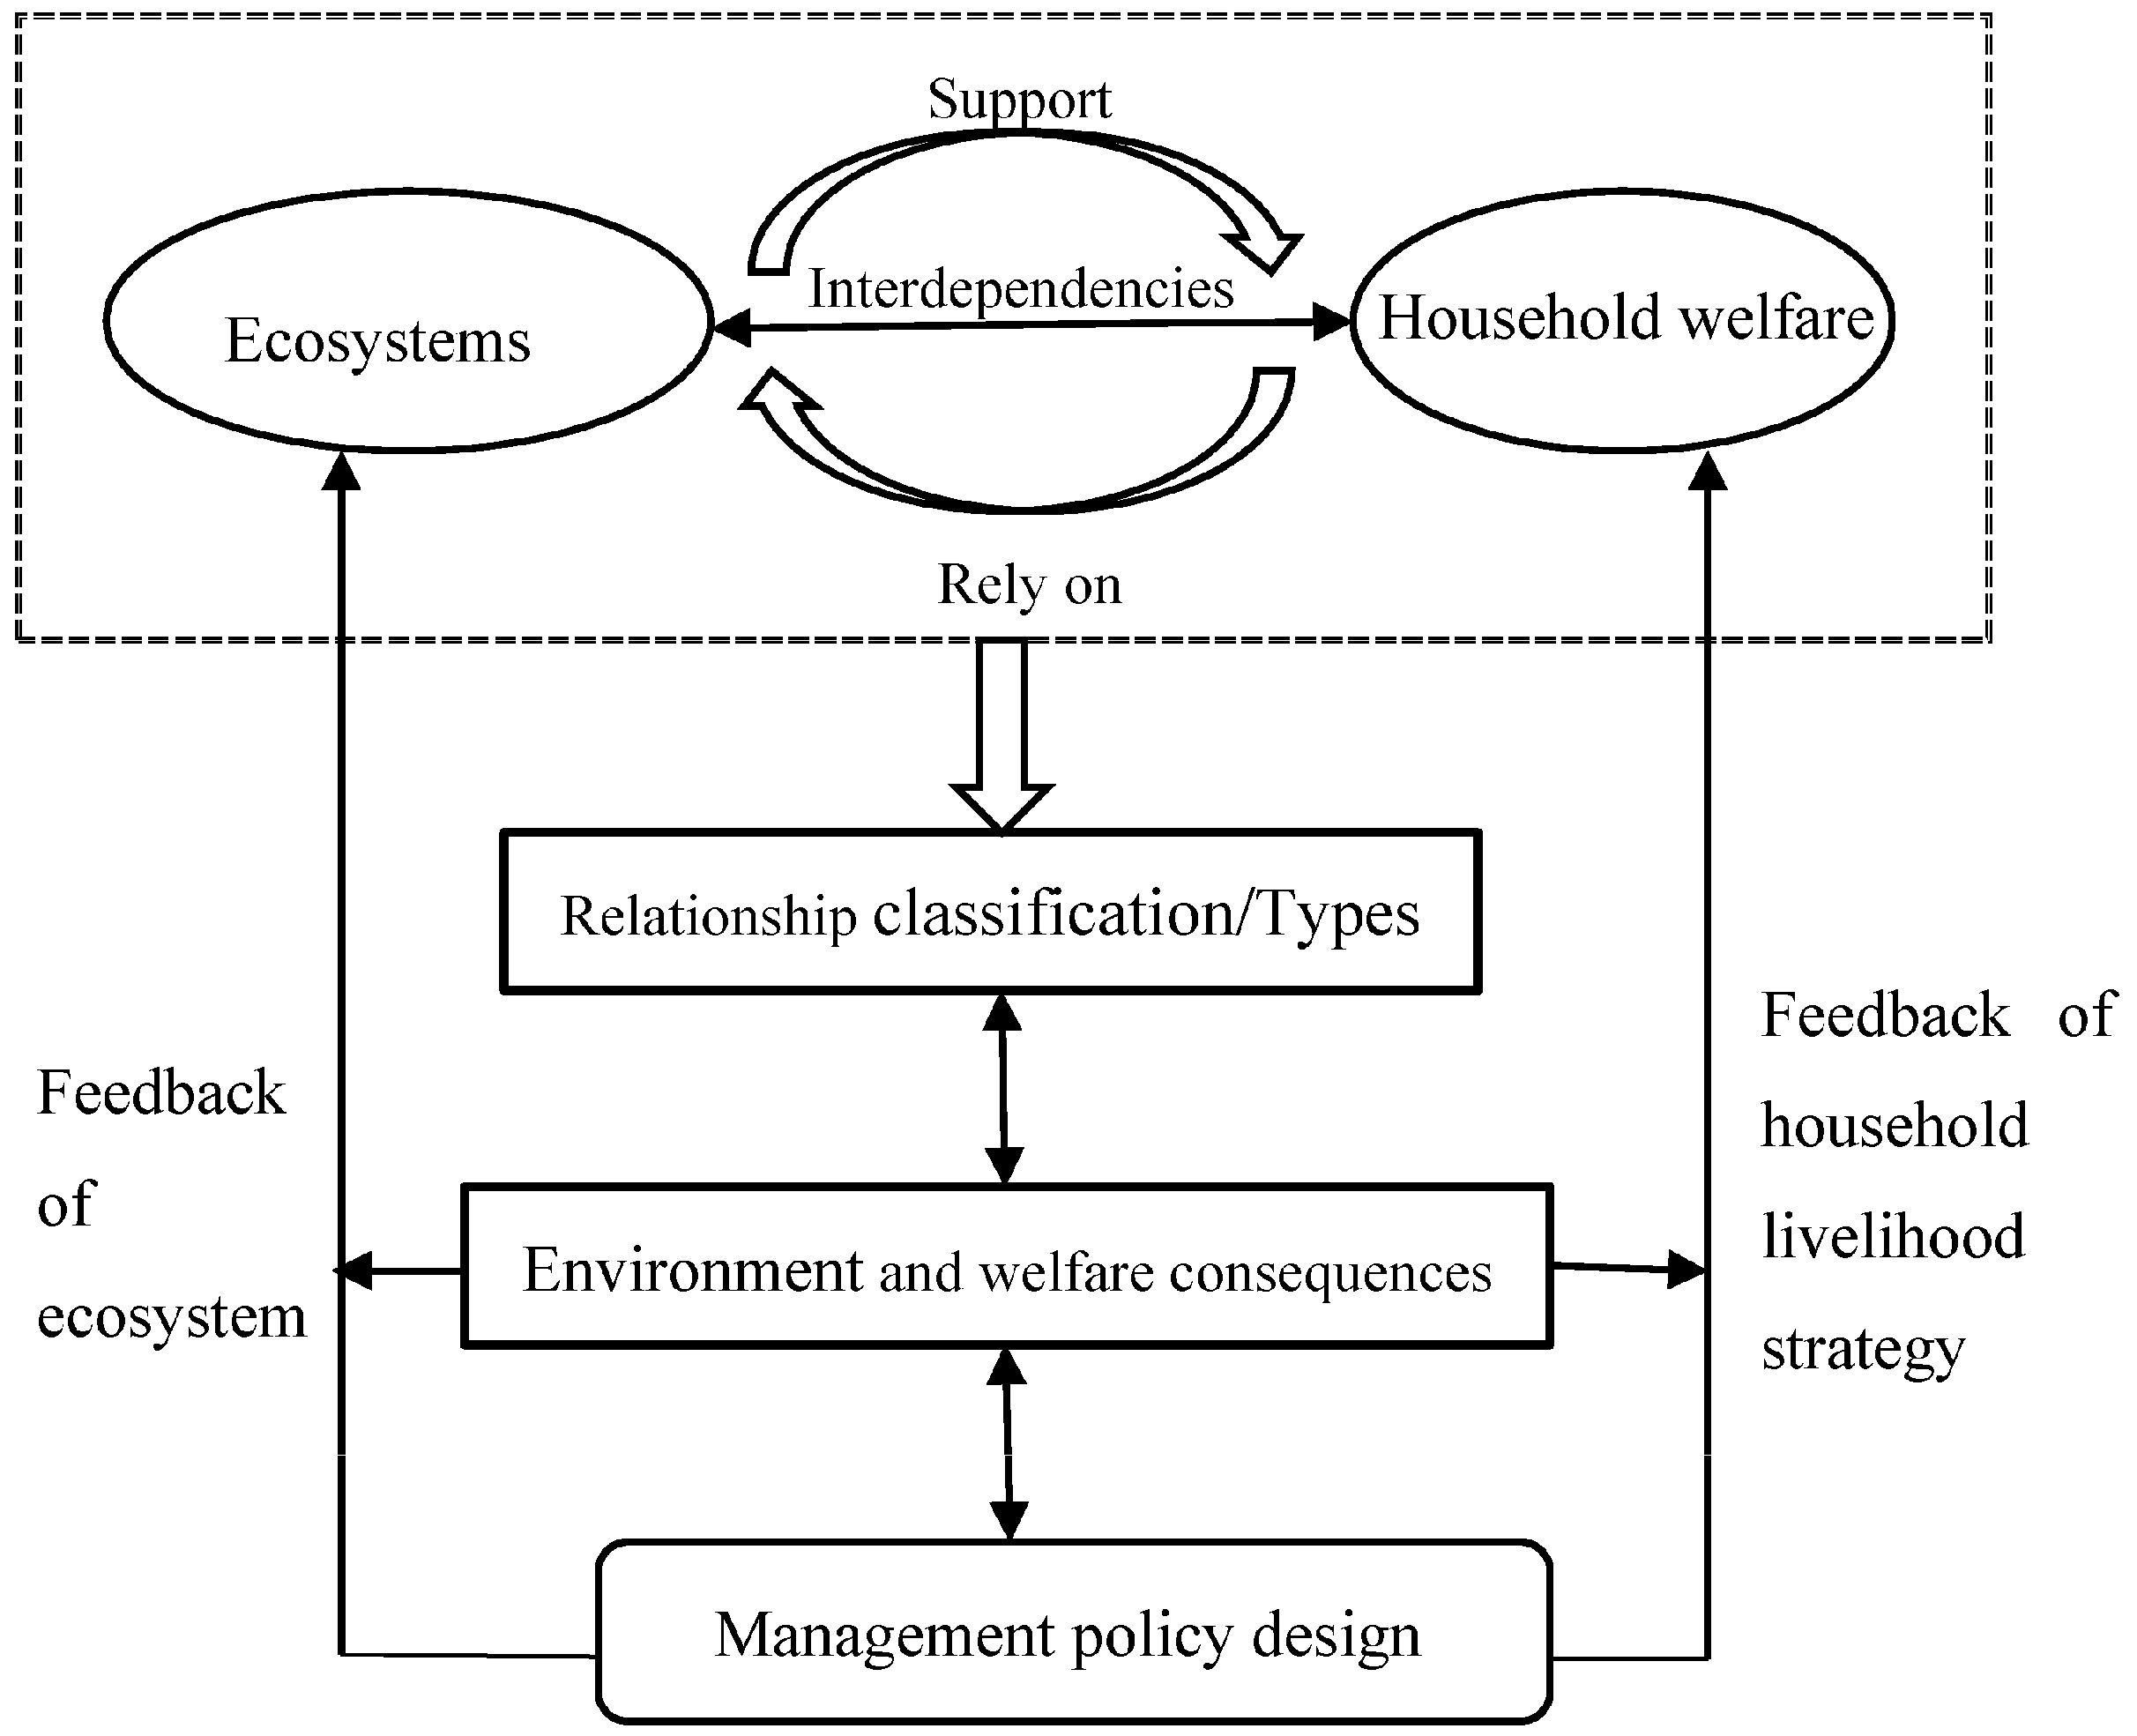
2.2. Study Framework

An ecosystem provides a variety of services, such as products and a living environment for humans, and it is the consumption of ecosystems’ services that satisfies and improves human welfare. However, when humans improve their own welfare with different livelihood strategies, not only does this affect ecosystem services, but also the welfare of households through feedback of different livelihood strategies (Figure 2).
Based on the relationship between ecosystem services and household welfare, ecological consequences and influencing factors were studied to develop a corresponding policy to regulate livelihood strategies. Through this policy, households can get better guidance for using their different forms of capital and capacities, strengthening the positive factors of livelihood activities and reducing the negative impacts. Therefore, this study can help households choose their own sustainable livelihoods and will benefit the coordination between humans and nature.

2.3. Household Surveys

Household surveys were conducted in August 2014 and July 2015 in the Miyun Reservoir watershed using a participatory rural appraisal method and multistage stratified random cluster sampling method [18,23]. At first, we identified the living standard of each county through statistical yearbooks. In each county, we selected 2–3 townships that represented the average standard of living of the county, and in each township, we selected 1–2 villages that represented the average standard of living of the township. Ultimately, we selected 15 sites in the six counties as our survey samples (Figure 1). With the help of ten graduate students to interview participants, 1754 valid questionnaires were obtained in total. The questionnaire survey mainly focused on information about household members and their livelihood activities, agricultural investments and outputs, household incomes and expenditures, and energy consumption and related activities. We normally selected household heads as interviewees, as they were usually the household decision makers and knew key information about their family.

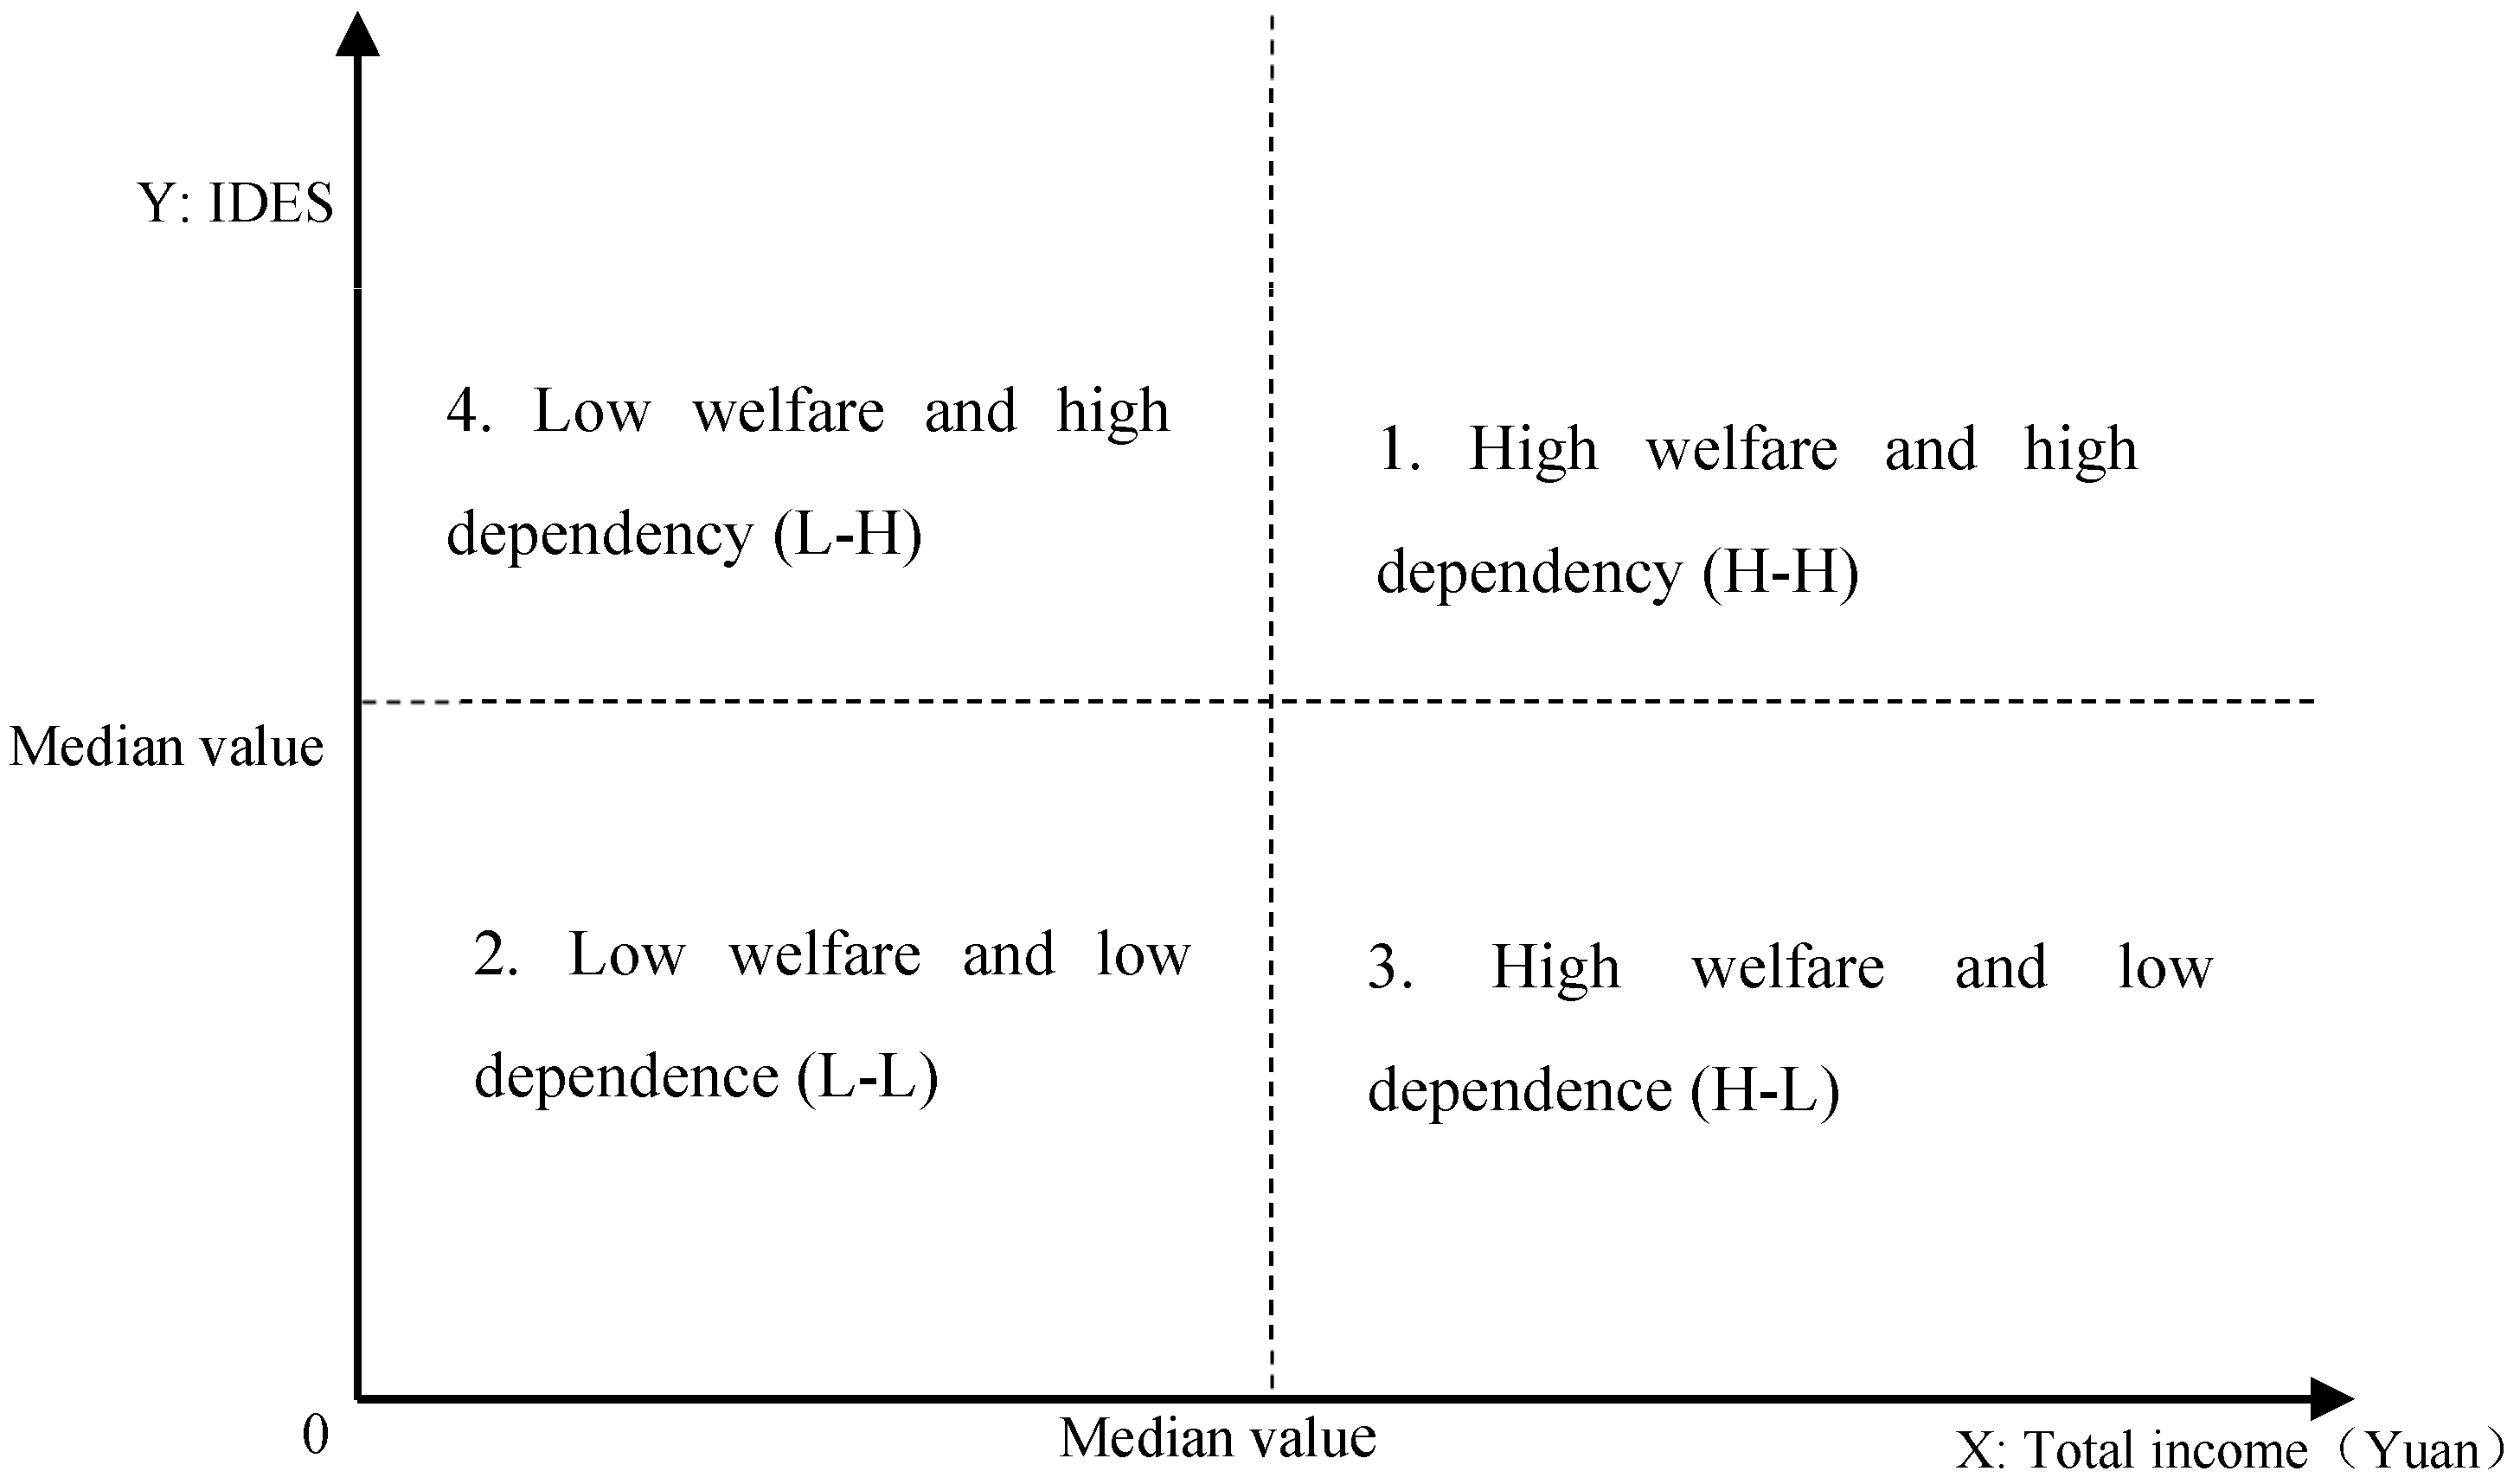
2.4. Classification of Relationships Between Household Income and Ecosystem Dependency

Although using income is not the best approach for livelihood classification, household income could still be used as an indicator of welfare (household wealth) due to data accessibility [24,25]. There are some methods representing the dependence of humans on ecosystem services [26,27,28]. In our study, in order to avoid to misleading decision making due to different development costs and increase the comparability of different households, the dependence of household welfare on the ecosystem was expressed by the index of dependence on ecosystem services (IDES) [29]. The IDES was defined as the ratio of net benefit obtained from the ecosystem to the absolute value of the total net benefit that was derived from the ecosystem and other socioeconomic activities [29]. The higher value of the index represents the higher dependence on the ecosystems. These quantitative indicators and models matched the MA framework and were easy to understand the linkages between ecosystems and human well-being [4,5].
The net benefit obtained from the ecosystem included three income sources: (1) Agricultural income was the income that farmers obtained by farming, operating orchards and breeding livestock, as well as from producing Chinese herbal medicine and wild mushrooms; (2) Nongjiale (rural tourism) income was the income that family members obtained from ecotourism, hospitality, and entertainment; (3) Ecological compensation income was the income received to participate in ecological compensation projects such as the Grain-to-Green Program, Natural Forest Conservation Program, and the Paddy Land-to-Dry Land Program. However, our research mainly focused on ecosystem services flowing to the households. We did not consider all ecosystem services provided by a watershed to the society, for example water provision or sediment prevention services [22].
Besides the income derived from the ecosystem, socioeconomic activities provided income that included remittance income (income sent home by migrant workers), non-farm income (income from commercial activities, service industries, and other sources), and government subsidies.
This four-quadrant classification was used to classify the relationships between household income and ecosystem dependency [30,31]. To eliminate the influence of extreme values, median values were used as the reference origin [32,33]. The relationships could be divided into four types: high welfare and high dependency (H-H), low welfare and low dependence (L-L), high welfare and low dependence (H-L), and low welfare and high dependency (L-H) (Figure 3).

2.5. Factors Influencing the Relationships Between the Ecosystem and Household Welfare

We used a multinomial logistic model to analyze determinants of the relationships between household welfare and the ecosystems. The model was an easier method to explain the influencing factors of the categorical dependent variables. The probability calculation of the types was:
Prob ( Y i = j ) = E X P ( x i j B i j ) 1 + k = 0 m E X P ( x i j B i j ) = F j ( X i , B ) j = 0 , 1 , 2 , , m ;   i = 1 , 2 , 3 , , N   a n d   B 0 = 0
where Prob ( Y i = j ) represents the probability of household i as type j out of m types, x i j represents the factors that influence household types, and B i j represents the corresponding parameters of the model to be estimated.
The dependence of household welfare on the ecosystem is mainly affected by its geographical location [34], the level of natural capital [35], number of family members [24,36], the labor quality, and ecological policies [37,38,39]. We selected eight independent variables from these five aspects, which were: distance from Beijing, cultivated area, household size, the average age of household laborers, the average education level of laborers, skills, training, and the amount paid from ecological compensation funds. Statistically significant differences were analyzed using one-way ANOVA with the software SPSS v.19.

3. Results

3.1. Income Resources of the Household Types

The relationships between household welfare and ecosystem dependency could be divided into four types. The first of these were H–H households (n = 289), represented by points in the first quadrant of Figure 3, which had a total income > 19,791.25 yuan (1 yuan= 0.1506 USD) and an IDES > 0.301. Nongjiale income was significantly higher in H-H households than in the other household types. Agricultural income was significantly higher than in the L-L and H-L households, but lower than in the L-H households. On the contrary, the remittance income was significantly lower than in the L-L and H-L households, but higher than in the L-H households. The second type of relationship was characterized by L-L households (n = 289), identified in the third quadrant of Figure 3 and having a total income < 19,791.25 yuan and an IDES < 0.301. The government subsidies accounted for the highest proportion of income, while remittance income was significantly lower than for the H-L households but higher than the other two types of households. The third relationship was represented by H-L households (n = 588), which are shown in the fourth quadrant of Figure 3 and which had a total income > 19,791.25 yuan and IDES < 0.301. There were more H-L households than H-H and L-L types. The income from migrant workers and other non-farm activities was significantly higher than for the other three types of households. The L-H type of household (n = 588) represented the final relationship category, and is shown in the second quadrant of Figure 3. With a total income < 19,791.25 yuan and IDES > 0.301, the income of L-H households was mainly derived from agriculture. In addition, remittance and other non-farm income was significantly lower than in the other three types of household (Table 1).

3.2. The Livelihood Capitals of the Different Household Types

The livelihood capitals had significantly different characteristics in the different types of households (Table 2). Overall, compared with the low dependency farmers, the highly dependent farmers had significantly higher levels of natural and physical capital. Compared with the low welfare farmers, the high welfare farmers had significantly higher levels of human, social, and physical capital.
H-H households had the highest level of natural capital, significantly higher than the low dependency households, and their level of human capital was inferior only to those of the H-L type. Compared with those of the other three types of households, the number of durable goods, deposits, and ecological compensation funds were significantly higher in H-H households.
L-L households had the lowest level of natural capital, significantly lower than the high dependency households. Compared with those of the other three types of households, the number of durable goods, deposits, and ecological compensation funds were significantly lower in the L-L households, just the opposite of the situation in H-H households. They also had significantly lower household size and laborers than for the other three types.
H-L households’ level of natural capital was significantly lower than those in the high dependency households, and their level of household size and labor education was significantly higher than in the other three types of households. The H-L households also had significantly higher levels of social and financial capital than the low welfare households.
In L-H households, natural capital was significantly higher than that in the low dependency households, and human capital and social capital were lower than those of the high welfare households.

3.3. Environmental Consequences of the Different Household Types

The households’ livelihood consequences differed for different relationship types (Table 3). Overall, H-L households had the highest economic incomes followed by those of H-H households. High dependency households had significantly higher intensity of land utilization, which was reflected in crop yield and the expenditure for fertilizer, pesticides, and farm manure. In terms of energy consumption, compared to other households, high welfare households used significantly higher total amounts of energy, made up of fossil energy and electricity, while high dependency households had significantly higher firewood consumption.
H-H households had significantly higher intensity of land utilization and firewood consumption than other households, resulting in a high impact on the ecosystem. At the same time, H-H households used significantly higher amounts of fossil energy and electricity than the other three types of households.
H-L households had significantly higher income per capita than other households, and used less fertilizer, pesticides, and firewood. The consumption of coal, LPG, and electricity by H-L households was significantly higher than that by low welfare households.
L-L households had significantly lower intensity of land utilization and firewood consumption than other household types. In addition, the income per capita and total energy usage of L-L households was significantly lower than in the high welfare households.
L-H households had the lowest income per capita of all household types, while the expense of fertilizer and pesticides, and consumption of firewood, were next only to H-H households. Therefore, L-H households had also a high impact on the ecological environment.

3.4. Factors Causing the Different Household Types

The geographical location of households, the natural capital level, the household structure, the labor quality, and ecological policy were found to be the main factors affecting the relationship between human welfare and ecosystem dependency (Table 4). Compared with L-H households, smaller distances from Beijing, more natural capital, larger household size, and availability of younger and higher quality household laborers, were the main factors that produced H-H relationships. On the contrary, if the household had less natural capital, smaller size, and fewer compensation funds, they tended to establish an L-L type of relationship with the ecosystem. In other words, households that were located relatively nearer to Beijing had a bigger household size, younger and more highly educated household laborers, but had less natural capital; they might belong to the H-L type.

4. Discussion

4.1. The Relationship between Household Welfare and Ecosystem Dependency

Almost all elements of a households’ welfare were provided by the ecosystem [40,41]. Especially in the deprived areas of economic and social development, the food and energy needs of farmers were largely dependent on ecosystem supplies [42]. Due to low economic level in our study area, we used the household income as an indicator of welfare, which also means wealth. Hence, poor groups had a more urgent demand for economic welfare than relatively more prosperous groups [43,44]. In this study, considering that the level of economic and social development was not balanced throughout the study watershed, and most of the regions were in the low and medium income levels [45], we chose household economic income as the proxy index for their welfare [46,47]. Meanwhile, according to the ecosystem services division of Millennium Ecosystem Assessment [1], we took the ratio of the income obtained from ecosystem services (including providing services, regulating services, and cultural services) to the total income as the dependence index on the ecosystem [29]. Based on this ratio, the relationships between households and the ecosystem were divided into four types: high welfare and high dependency (H-H), low welfare and low dependence (L-L), high welfare and low dependence (H-L), and low welfare and high dependency (L-H) (Table 1 and Figure 3). The results fully demonstrated the diversity of the relationships between humans and nature. This was confirmed by some researches on rural livelihood [22,48,49].

4.2. The Classification of Household Welfare–Ecosystem Dependency Relationships

The livelihood capitals had significantly different characteristics in different types of households (Table 2). The L-H households had high cultivated land areas per capita and depended mainly on the ecosystem (Table 1), and had a lower economic level than other household types. The finding was widely noted in the literature that poorer households rely more on the ecosystem [22,29,50,51,52]. The H-L households had significantly higher remittance income and non-farm income than other household types (Table 1). Although their natural capitals were lower, they had bigger household size, and younger and better educated laborers that had a better chance to get well-paid jobs than older or less educated workers [51]. Besides the above two types of households, there was a considerable proportion (16.5% each) of L-L and H-H households in the Miyun Reservoir watershed. The L-L households had the lowest level of natural capital, and significantly smaller household sizes, fewer household laborers, less ecological compensation funds, and lower borrowing capacity. The L-L households depended on government subsidies to maintain basic living needs [6,53]. In contrast, H-H households had not only the largest cultivated land areas, but also significantly more ecological compensation funds and household durable goods than the other household types. Furthermore, H-H households had more deposits and the ability to increase their human and social capital. So besides farming and nongjiale livelihood incomes, H-H households had migrant and non-farm income (Table 1). These results were similar to the characteristics of the mixed livelihood strategies that some researchers had examined [51]. Research on the relationship between households and ecosystem dependency in South Africa showed that low welfare farmers were not necessarily dependent on the ecosystem, but the highly dependent farmers were almost exclusively in the low level of welfare [6]. However, these findings are not in complete accord with the characteristics of relationships in the Miyun Reservoir watershed.

4.3. The Environmental Consequences of Different Types of Household Livelihood

Households in different types of relationships with ecosystems chose different livelihood strategies and activities, resulting in different livelihoods outcomes and different potential impacts on the ecological environment [54,55]. The annual per capita income of the H-L households in this study was the highest of all household types, followed by that of the H-H households (Table 3); this income level was 3–4 times that of the other two types of households. Notably, H-L and H-H households affected the ecosystem quite differently as high income groups. The H-L households had significantly lower intensity of land utilization and characterized both a poverty-elimination and an ecological environment-friendly type of relationship [55,56,57,58]; in contrast, the H-H households invested significantly more in fertilizer, pesticides, and farm manure to support their high intensity of land utilization. At the same time, because of their high economic level, H-H households could afford to use more fossil fuels such as coal and liquefied petroleum gas, and consequently had the highest total energy consumption (Table 3). Thus, the H-H type of household–ecosystem relationship was the most unsustainable mode of natural resources usage [20,51]. These results gave some evidence that the Environmental Kuznets Curve existed in the Miyun Reservoir Basin [51,59]; this relationship showed that the higher the household income, the greater the impact on the ecological environment until a critical point was reached, after which, the higher the household per capita income, the smaller the influence on the environment. The L-H households that were highly dependent on land resources and overuse the local land resources and firewood wolud be affected by declining soil quality, soil erosion, water environment deterioration, and other environmental problems [40,60]. In contrast, L-L households had the lowest exploitation and utilization of natural resources (Table 3), but were poorer than the other household types. This result further confirmed that it was not the poor who were to be blamed for environmental degradation [22,61,62]. The L-H farmers were mainly depend on the ecosystem, but exert much less pressure on resources than H-H households because they had the least economic income [51].

4.4. Impact Factors of Household Welfare–Ecosystem Dependency Relationships

Several key factors (including geographical location, the natural environment, household structure, labor quality, and ecological policies) could affect a household’s livelihood capital, livelihood risk, and vulnerability, and thus constantly influenced the relationship between households and their dependency on the ecosystem [34,35,36,37,38,39,42] (Table 4). Among the four types of households, the formation of an H-H household was characterized first by a large area of land suitable for cultivation (Table 2) and a strong reliance on food crops or economic crops as the main livelihood [51,63]. Second, the size of an H-H household was relatively large, and the household laborers were able to master more production technology or receive more agricultural training than laborers in other households [64,65] (Table 4), which helped them continuously improve crop yields. Third, the short distance from Beijing made selling vegetables, chestnuts, and other economic crops convenient, and with the aid of the Miyun Reservoir natural conditions, H-H households engaged in tourism to improve their level of welfare [57,65] (Table 3). In contrast, the L-L households had less cultivated land than other household types, so they mainly grew food crops (Table 1), and hadless chance to participate in ecological compensation programs (Table 2). The smaller reliance on the ecosystem and fewer household laborers tended to make L-L households poor (Table 3), even if they were engaged in non-agricultural work or migrate to work [39,60,66] (Table 1). The geographical location of households played an essential role in the choice of livelihood activities [67,68], and some scholars even thought of geographical location as the sixth kind of livelihood capital [34]. Therefore, the formation of H-L households was primarily due to their close proximity to an urban city, and to roads and other infrastructures that increased the opportunities to obtain off-farm employment and improved household welfare [6,19,34]. On the other hand, H-L households had a large family size, and a young and well-educated labor force (Table 4) that could find well-paid jobs resulting in a higher level of household welfare [19,22,64,65] (Table 3).

4.5. Policy Implications

The classification of household–ecosystem relationships could provide a scientific basis for improving the well-being of households, reducing their environmental impact and promoting the sustainability of household livelihoods. Our research supported the following recommendations.
For H-H households, we suggested further improvements in the technical level of agricultural production [64,65], and development of efficient modern agricultural production practices. Migrant workers and non-farm industries should be encouraged to continue to improve the welfare of households. However, the most important recommendation for H-H households was to reduce their impact on the ecological environment by developing ecotourism, promoting water conservation service functions, improving environmental awareness, restoring riparian zones, and implementing other environment measures [45,51,69,70].
For L-L households, additional ecological compensation or larger subsidies needed to be considered [67]. But primarily, the government needed to increase its employment guidance and non-farm employment skills training, in order to enhance the competitiveness of human capital and improve sustainable livelihoods [65,66,70].
We encouraged efforts to develop more H-L type households, not only to alleviate poverty, but also to lessen the overall impact of households on the ecological environment [20,51,71,72]. However, we also recommended that H-L households continued to update their technical knowledge and use of information so as to improve labor quality. At the same time, we suggested encouraging H-L households to shift their abandoned land to other cultivation techniques and planting categories in order to increase economic benefits.
For L-H households, local governments should enhance support policies on technical training, technology promotion, and financial support [65,66], so that they had the capacity to develop ecological agriculture and enhance household welfare. The energy structure needed to be transformed simultaneously, encouraging the use of biogas, solar, and other new energy sources, thereby reducing the environment problems caused by deforestation and fossil energy consumption [73,74].

5. Conclusions

Linking household welfare and ecosystems to inform differentiated household livelihood development in spatially heterogeneous regions was a great challenge. By using the participatory rural appraisal method and multistage stratified random cluster sampling method, we grouped the relationships between household welfare and ecosystem reliance in the Watershed of Miyun Reservoir, the only source of surface water for domestic use in Beijing, China.
The relationships could be grouped into four types: high welfare and high dependency, low welfare and low dependency, high welfare and low dependence, and low welfare and high dependency. Family structure, households’ education and skill level, and the proximity to Beijing had significantly impacts on household welfare, while the quantity of natural capital and eco-compensation funds contributed significantly to ecosystem dependence.
Our results showed that maintaining suitable family size and age structure, improving education and skill levels, and strengthening payment for ecosystem services within low welfare households would be effective approaches to their welfare improvement. In the future, tailored policy and management options should be designed to promote sustainable livelihoods based on different household subgroups.

Acknowledgments

We are grateful to the local communities of Miyun Reservoir watershed for their hospitality and assistance during the survey, and Dr. Brian E. Robinson for his constructive comments for the design of household survey and data analysis. This work was supported by the National Natural Science Foundation of China (41371538, 71673219); the National Key Research and Development Program of China (No. 2016YFC0503401); and the Canadian Social Science and Humanities Research Council (No. 430-2014-00861).

Author Contributions

Hua Zheng, Fengchun Wang conceived and designed this study, Wenjia Peng, Hua Zheng, Fengchun Wang, and Dongchun Ma participated in the field survey; Fengchun Wang and Wenjia Peng analyzed the data and wrote the manuscript, Hua Zheng, Xiaoke Wang and Cong Li revised the manuscript. All authors read and approved the manuscript.

Conflicts of Interest

The authors declare no conflict of interest.

References

  1. Millennium Ecosystem Assessment. Ecosystems and Human Well-Being: Synthesis; Island Press: Washington, DC, USA, 2005. [Google Scholar]
  2. Buckley, R.C. The economics of ecosystems and biodiversity: Ecological and Economic Foundations. Austral Ecol. 2011, 36, e34–e35. [Google Scholar] [CrossRef]
  3. Costanza, R.; D’Arge, R.; de Groot, R.; Farber, S.; Grasso, M.; Hannon, B.; Limburg, K.; Naeem, S.; O’Neill, R.V.; Paruelo, J.; et al. The value of the world’s ecosystem services and natural capital. Nature 1997, 387, 253–260. [Google Scholar] [CrossRef]
  4. Daily, G.C.; Ouyang, Z.Y.; Zheng, H.; Li, S.Z.; Wang, Y.K.; Feldman, M.; Kareiva, P.; Polasky, S.; Ruckelshaus, M. Securing natural capital and human well-being: Innovation and impact in China. Acta Ecol. Sin. 2013, 33, 669–676. [Google Scholar] [CrossRef]
  5. Daily, G.C.; Polasky, S.; Goldstein, J.; Kareiva, P.M.; Mooney, H.A.; Pejchar, L.; Ricketts, T.H.; Salzman, J.; Shallenberge, R. Ecosystem services in decision making: Time to deliver. Front. Ecol. Environ. 2009, 7, 21–28. [Google Scholar] [CrossRef]
  6. Hamann, M.; Biggs, R.; Reyers, B. An exploration of human well-being bundles as identifiers of ecosystem service use patterns. PLoS ONE 2016, 11, e0163476. [Google Scholar] [CrossRef] [PubMed]
  7. Jordan, S.J.; Hayes, S.E.; Yoskowitz, D.; Smith, L.M.; Summers, J.K.; Russell, M.; Benson, W.H. Accounting for natural resources and environmental sustainability: Linking ecosystem services to human well-being. Environ. Sci. Technol. 2010, 44, 1530–1536. [Google Scholar] [CrossRef] [PubMed]
  8. Tallis, H.; Kareiva, P.; Marvier, M.; Chang, A. An ecosystem services framework to support both practical conservation and economic development. PNAS 2008, 105, 9457–9464. [Google Scholar] [CrossRef] [PubMed]
  9. Vemuri, A.W.; Costanza, R. The role of human, social, built, and natural capital in explaining life satisfaction at the country level: Toward a National Well-Being Index (NWI). Ecol. Econ. 2006, 58, 119–133. [Google Scholar] [CrossRef]
  10. Cao, S.X.; Zhong, B.L.; Yue, H.; Zeng, H.S.; Zeng, J.H. Development and testing of a sustainable environmental restoration policy on eradicating the poverty trap in China’s Changting County. PNAS 2009, 106, 10712–10716. [Google Scholar] [CrossRef] [PubMed]
  11. Scoones, I.; Borras, S.M. Livelihoods perspectives and rural development. J. Peasant Stud. 2009, 1, 297–303. [Google Scholar] [CrossRef]
  12. Chambers, R.; Conway, G.R. Sustainable Rural Livelihoods: Practical Concepts for The 21st Century; Institute of Development Studies: Brighton, UK, 1992. [Google Scholar]
  13. Ellis, F. Rural Livelihoods and Diversity in Developing Countries; Oxford University Press: New York, NY, USA, 2000. [Google Scholar]
  14. Nguyen, T.T.; Nguyen, D.L.; Lippe, R.S.; Grote, U. Determinants of farmers’ land use decision-making: Comparative evidence from Thailand and Vietnam. World Dev. 2017, 89, 189–213. [Google Scholar] [CrossRef]
  15. Department for International Development. Sustainable Livelihoods Guidance Sheets; Department for International Development: London, UK, 1999.
  16. Koczberski, G.; Curry, G.N. Making a living: Land pressures and changing livelihood strategies among oil palm settlers in Papua New Guinea. Agric. Syst. 2005, 85, 324–339. [Google Scholar] [CrossRef]
  17. Li, J.; Mario, G.; Gianni, P.; Cai, L.W.; Luo, H.E. Trends of technical changes in rice based farming system in southern China: Case study of Qianjiang municipality. Crit. Rev. Plant Sci. 1999, 18, 283–297. [Google Scholar] [CrossRef]
  18. Lian, G.; Guo, X.D.; Fu, B.J. Farmer’s percept ion and response towards grain-for-green program and eco-environment based on participatory rural appraisal. Acta Ecol. Sin. 2005, 25, 1741–1747. [Google Scholar]
  19. Thulstrup, A.W. Livelihood resilience and adaptive capacity: Tracing changes in household access to capital in Central Vietnam. World Dev. 2015, 74, 352–362. [Google Scholar] [CrossRef]
  20. Wang, C.C.; Yang, Y.S.; Zhang, Y.Q. Rural household livelihood change, fuelwood substitution, and hilly ecosystem restoration: Evidence from China. Renew. Sustain. Energy Rev. 2012, 16, 2475–2482. [Google Scholar] [CrossRef]
  21. Uchida, E.; Rozelle, S.; Xu, J.T. Conservation payments, liquidity constraints and off-farm labor: Impact of the Grain for Green program on rural households in China. Am. J. Agric. Econ. 2009, 91, 70–86. [Google Scholar] [CrossRef]
  22. Nguyen, T.T.; Pham, V.D.; Tenhunen, J. Linking regional land use and payments for forest hydrological services: A case study of Hoa Binh Reservoir in Vietnam. Land Use Policy 2013, 33, 130–140. [Google Scholar] [CrossRef]
  23. Li, R.; Mi, W.B. Economic analysis of de-farming and reforestation project based on PRA. J. Arid Land Resour. Environ. 2007, 21, 14–20. [Google Scholar]
  24. Daw, T.; Brown, K.; Rosendo, S.; Pomeroy, R. Applying the ecosystem services concept to poverty alleviation: The need to disaggregate human well-being. Environ. Conserv. 2011, 38, 370–379. [Google Scholar] [CrossRef]
  25. Nguyen, T.T.; Do, T.L.; Bühler, D.; Hartij, R.; Grote, U. Rural livelihoods and environmental resource dependence in Cambodia. Ecol. Econ. 2015, 120, 282–295. [Google Scholar] [CrossRef]
  26. Akwetaireho, E.; Getzner, M. Livelihood dependence on ecosystem services of local residents: A case study from Mabamba Bay wetlands (Lake Victoria, Uganda). Int. J. Biodivers. Sci. Ecosyst. Serv. Manag. 2010, 6, 75–87. [Google Scholar] [CrossRef]
  27. Orchard, S.E.; Stringer, L.C.; Quinn, C.H. Mangrove system dynamics in Southeast Asia: Linking livelihoods and ecosystem services in Vietnam. Reg. Environ. Chang. 2016, 16, 865–879. [Google Scholar] [CrossRef]
  28. Reed, M.S.; Stringer, L.C.; Dougill, A.J.; Perkins, J.S.; Atlhopheng, J.R.; Mulale, K.; Favretto, N. Reorienting land degradation towards sustainable land management: Linking sustainable livelihood with ecosystem services in rangeland systems. J. Environ. Manag. 2015, 151, 472–485. [Google Scholar] [CrossRef] [PubMed]
  29. Yang, W.; Dietz, T.; Liu, W.; Luo, J.Y.; Liu, J.G. Going beyond the Millennium Ecosystem Assessment: An index system of human dependence on ecosystem services. PLoS ONE 2013, 8, e64581. [Google Scholar] [CrossRef] [PubMed]
  30. Chen, X.Q. Categorization of Tourism Area in China Based on Tourist Statistics. Bus. Econ. Adm. 2006, 173, 74–79. [Google Scholar]
  31. Yang, Y.J. Research on Procurement Management of CD Hydropower Company; Huazhong University of Science and Technology: Wuhan, China, 2011. [Google Scholar]
  32. Bridge, P.D.; McKenzie, S.A. Airway resistance measured by the interrupter technique: Expiration or inspiration, mean or median? Eur. Respir. J. 2001, 17, 495–498. [Google Scholar] [CrossRef] [PubMed]
  33. Leys, C.; Ley, C.; Klein, O.; Bemard, P.; Licata, L. Detecting outliers: Do not use standard deviation around the mean, use absolute deviation around the median. J.Exp. Soc. Psychol. 2013, 49, 764–766. [Google Scholar] [CrossRef]
  34. Jansen, H.G.P.; Pender, J.; Damon, A.; Wielemaker, W.; Schipper, R. Policies for sustainable development in the hillside areas of Honduras: A quantitative livelihoods approach. Agric. Econ. 2006, 34, 141–153. [Google Scholar] [CrossRef]
  35. Moran, E.F.; Brondizio, E.S.; VanWey, L.K. Population and environment in Amazônia: Landscape and household dynamics. In Population, Land Use, and Environment; NCBI Bookshelf; National Academies Press: Washington, DC, USA, 2005. [Google Scholar]
  36. Peng, W.J.; Zheng, H.; Robinson, B.E.; Li, C.; Wang, F.C. Household livelihood strategy choices, impact factors, and environmental consequences in Miyun reservoir watershed, China. Sustainability 2017, 9, 175. [Google Scholar] [CrossRef]
  37. Huang, J.; Wu, Y.; Rozelle, S. Moving off the farm and intensifying agricultural production in Shandong: A case study of rural labor market linkages in China. Agric. Econ. 2009, 40, 203–218. [Google Scholar] [CrossRef]
  38. Li, S.Z.; Liang, Y.C.; Feldman, M.W.; Daily, G.C. The impact of grain for green program on rural livelihoods in China: Sustainable livelihoods Analysis in a Perspective of Household Composition. J. Public Manag. 2010, 7, 1–10. [Google Scholar]
  39. Zheng, H.; Robinson, B.E.; Liang, Y.C.; Polasky, S.; Ma, D.C.; Wang, F.C.; Ruckelshaus, M.; Ouyang, Z.Y.; Daily, G.C. Benefits, costs, and livelihood implications of a regional payment for ecosystem service program. PNAS 2013, 110, 16681–16686. [Google Scholar] [CrossRef] [PubMed]
  40. Feng, W.L.; Li, S.Z.; Li, C. Overview and frame work for ecosystem services and human well-being. Resour. Sci. 2013, 35, 1482–1489. [Google Scholar]
  41. Smith, L.M.; Case, J.L.; Smith, H.M.; Harwell, L.C.; Summers, J.K. Relating ecosystem services to domains of human well-being: Foundation for a U.S. index. Ecol. Indic. 2012, 28, 79–90. [Google Scholar] [CrossRef]
  42. Yang, L.; Zhen, L.; Pan, Y.; Cao, X.C.; Long, X. Ecosystem services supply and consumption—A case in Yellow River watershed, China. J. Arid Land Resour. Environ. 2012, 26, 131–138. [Google Scholar]
  43. Constanza, R.; Fisher, B.; Ali, S.; Beer, C.; Bond, L.; Boumans, R.; Danigelis, N.L.; Dickinson, J.; Elliott, C.; Farley, J.; et al. Quality of life: An approach integrating opportunities, human needs, and subjective well-being. Ecol. Econ. 2007, 61, 267–276. [Google Scholar] [CrossRef]
  44. Dai, G.S.; Na, R.S.; Dong, X.B.; Yu, B.H. The dynamic change of herdsmen well-being and ecosystem services in grassland of Inner Mongolia: Take Xilinguole League as example. Acta Ecol. Sin. 2014, 34, 2422–2430. [Google Scholar] [CrossRef]
  45. Wang, D.S.; Li, Y.F.; Zheng, H.; Ouyang, Z.Y. Ecosystem services’ spatial characteristics and their relationships with residents’ well-being in Miyun Reservoir watershed. Acta Ecol. Sin. 2014, 34, 70–81. [Google Scholar] [CrossRef]
  46. Babulo, B.; Muys, B.; Nega, F.; Tollens, E.; Nyssen, J.; Deckers, J.; Mathijs, E. Household livelihood strategies and forest dependence in the highlands of Tigray, Northern Ethiopia. Agric. Syst. 2008, 98, 147–155. [Google Scholar] [CrossRef]
  47. Birch-Thomsen, T.; Frederiksen, P.; Sano, H.O. A livelihood perspective on the natural resource management and environmental change in Semi-Arid Tanzania. Econ. Geogr. 2001, 77, 41–66. [Google Scholar] [CrossRef] [PubMed]
  48. Nielsen, J.; Rayamajhi, S.; Uberhuaga, P.; Meilby, H.; Smith-Hall, C. Quantifying rural livelihood strategies in developing countries using an activity choice approach. Agric. Econ. 2013, 44, 57–71. [Google Scholar] [CrossRef]
  49. Angelsen, A.; Jagger, P.; Babigumira, R.; Belcher, B.; Hogarth, N.J.; Bauch, S.; Börner, J.; Smith-Hall, C.; Wunder, S. Environmental income and rural livelihoods: A global-comparative analysis. World Dev. 2014, 64, 12–28. [Google Scholar] [CrossRef] [Green Version]
  50. Hamann, M.; Biggs, R.; Reyers, B. Mapping social-ecological systems: Identifying ‘reen-loop’ and ‘red-loop’ dynamics based on characteristic bundles of ecosystem service use. Glob. Environ. Chang. 2015, 34, 218–226. [Google Scholar] [CrossRef]
  51. Soltani, A.; Angelsen, A.; Eid, T.; Naieni, M.S.N.; Shamekhi, T. Poverty, sustainability, and household livelihood strategies in Zagros, Iran. Ecol. Econ. 2012, 79, 60–70. [Google Scholar] [CrossRef]
  52. Vedeld, P.; Angelsen, A.; Bojö, J.; Sjaastad, E.; Berg, G.K. Forest environmental incomes and the rural poor. For. Policy Econ. 2007, 9, 869–879. [Google Scholar] [CrossRef]
  53. Leibbrandt, M.; Finn, A.; Woolard, I.; Argent, J. Trends in South African Income Distribution and Poverty since the Fall of Apartheid; OECD Social, Employment and Migration Working Papers, No. 101; OECD Publishing: Paris, France, 2010. [Google Scholar]
  54. Tittonell, P.; Muriuki, A.; Shepherd, K.D.; Mugendi, D.; Kaizzi, K.C.; Okeyo, J. The diversity of rural livelihoods and their influence on soil fertility in agricultural systems of East Africa—A typology of smallholder farms. Agric. Syst. 2010, 103, 83–97. [Google Scholar] [CrossRef]
  55. Wang, C.C.; Yang, Y.S. Review of research on mountains ecological restoration based on farmer household livelihood evolution. J. Nat. Resour. 2011, 26, 344–352. [Google Scholar] [CrossRef]
  56. Chase, J. The place of pluriactivity in Brazil’s agrarian reform institutions. J. Rural Stud. 2010, 26, 85–93. [Google Scholar] [CrossRef]
  57. Démurger, S.; Fournier, M.; Yang, W.Y. Rural households’ decisions towards income diversification: Evidence from a township in northern China. China Econ. Rev. 2010, 21, S32–S44. [Google Scholar] [CrossRef]
  58. Fang, Y.P.; Fan, J.; Shen, M.Y.; Song, M.Q. Sensitivity of livelihood strategy to livelihood capital in mountain areas: Empirical analysis based on different settlements in the upper reaches of the Minjiang River, China. Ecol. Indic. 2014, 38, 225–235. [Google Scholar] [CrossRef]
  59. Al-Mulalia, U.; Ozturkb, I.; Solarin, S.A. Investigating the environmental Kuznets curve hypothesis in seven regions: The role of renewable energy. Ecol. Indic. 2016, 67, 267–282. [Google Scholar] [CrossRef]
  60. Li, Y.F.; Luo, Y.C.; Liu, G.; Ouyang, Z.Y.; Zheng, H. Effects of Land Use change on ecosystem services, a case study in Miyun reservoir watershed. Acta Ecol. Sin. 2013, 33, 726–736. [Google Scholar] [CrossRef]
  61. Heubach, K.; Wittig, R.; Nuppenau, E.A.; Hahn, K. The economic importance of nontimber forest products (NTFPs) for livelihood maintenance of rural West African communities: A case study from Northern Benin. Ecol. Econ. 2011, 70, 1991–2001. [Google Scholar] [CrossRef]
  62. Kamanga, P.; Vedeld, P.; Sjaastad, E. Forest incomes and rural livelihoods in Chiradzulu District, Malawi. Ecol. Econ. 2009, 68, 613–624. [Google Scholar] [CrossRef]
  63. Panahi, F.; Malakmohammadian, I.; Chizari, M.; Samani, M.V. The role of optimizing agricultural water resource management to livelihood poverty abolition in rural Iran. Aust. J. Basic Appl. Sci. 2009, 3, 3841–3850. [Google Scholar]
  64. Aref, A. Education for rural development in Iran. J. Am. Sci. 2011, 7, 36–40. [Google Scholar]
  65. Huber, F.K.; Morlok, M.; Weckerle, C.S.; Seeland, K. Livelihood Strategies in Shaxi, Southwest China: Conceptualizing Mountain-Valley Interactions as a Human-Environment System. Sustainability 2015, 7, 3204–3229. [Google Scholar] [CrossRef] [Green Version]
  66. Liang, Y.C.; Liu, G.; Ma, D.C.; Wang, F.C.; Zheng, H. Regional cooperation mechanism and sustainable livelihoods: A case study on paddy land conversion program (PLCP). Acta Ecol. Sin. 2013, 33, 693–701. [Google Scholar] [CrossRef]
  67. Adhikari, B.; Falco, S.D.; Lovett, J.C. Household characteristics and forest dependency: Evidence from common property forest management in Nepal. Ecol. Econ. 2004, 48, 245–257. [Google Scholar] [CrossRef]
  68. Tao, T.C.H.; Wall, G. Tourism as a sustainable livelihood strategy. Tour. Manag. 2009, 30, 90–98. [Google Scholar] [CrossRef]
  69. Zheng, H.; Li, Y.F.; Robinson, B.E.; Liu, G.; Ma, D.C.; Wang, F.C.; Lu, F.; Ouyang, Z.Y.; Daily, G.C. Using ecosystem service trade-offs to inform water conservation policies and management practices. Front. Ecol. Environ. 2016, 14, 527–532. [Google Scholar] [CrossRef]
  70. Mariana, S.; Thompson, E. Gender and policy roles in farm household diversification in Zambia. World Dev. 2016, 89, 152–169. [Google Scholar] [CrossRef]
  71. Berg, M.M.V.D. Household income strategies and natural disasters: Dynamic livelihoods in rural Nicaragua. Ecol. Econ. 2009, 69, 592–602. [Google Scholar] [CrossRef]
  72. Bhandari, B.S.; Grant, M. Analysis of livelihood security: A case study in the Kali-Khola watershed of Nepal. J. Environ. Manag. 2007, 85, 17–26. [Google Scholar] [CrossRef] [PubMed]
  73. Sun, W.; Han, X.X.; Sheng, K.R.; Fan, J. Geographical differences and influencing factors of rural energy consumption in Southwest mountain areas in China: A case study of Zhaotong City. J. Mt. Sci. 2012, 9, 842–852. [Google Scholar] [CrossRef]
  74. Zhou, Z.R.; Wu, W.L.; Wang, X.H.; Chen, Q.; Wang, O. Analysis of changes in the structure of rural household energy consumption in northern China: A case study. Renew. Sustain. Energy Rev. 2009, 13, 187–193. [Google Scholar] [CrossRef]
Figure 1. Distribution of household survey samples and county boundaries of the study area in the Miyun Reservoir Watershed.
Sustainability 09 02290 g001
Figure 2. Study framework of the relationship between ecosystems and household welfare.
Sustainability 09 02290 g002
Figure 3. Classification of relationships between household income and ecosystem dependency.
Sustainability 09 02290 g003
Table 1. Income composition for the different household types.
Income Composition1. H-H2. L-L3. H-L4. L-H
289 (16.5%)289 (16.5%)588 (33.5%)588 (33.5%)
MeanSDMeanSDMeanSDMeanSD
Agricultural income (%)46.10 (2,3,4)30.273.24 (1,4)9.208.43 (1,4)7.7266.98 (1,2,3)29.82
Nongjiale income (%)11.91 (2,3,4)26.550.00 (1)00.33 (1)0.110.49 (1)0.26
Ecological compensation income (%)3.95 (2,3)7.92.09 (1,4)4.91.02 (1,4)2.94.65 (2,3)15.6
Remittance income (%)6.87 (2,3,4)15.813.56 (1,3,4)25.919.13 (1,2,4)28.93.21 (1,2,3)10.7
Government subsidies income (%)7.79 (2,4)12.861.30 (1,3,4)154.45.56 (2,4)11.719.01 (1,2,3)20.5
Other non-farm income (%)23.37 (3,4)23.319.81 (3,4)32.965.54 (1,2,4)30.95.66 (1,2,3)14.9
The superscript letters in brackets indicate categories that are significantly different at the 5% level from other livelihood types, using the Scheffe’s test. H-H means the household type of high welfare and high dependency; L-L means the type of low welfare and low dependence; H-L stands for the type of the high welfare and low dependence; and L-H is the type of low welfare and high dependency. 1” means a deposit or loan exists and “2” means no deposit or loan exists. For the deposit (or loan), the bigger is the value, the greater is the deposit (or loan). Households hope for larger deposits and smaller loans
Table 2. Livelihood capitals of different types of households.
Livelihood Capital Variables1. H-H
(n = 289)
2. L-L
(n = 289)
3. H-L
(n = 588)
4. L-H
(n = 588)
Average
(n = 1754)
Natural capital
Cultivated land area per capita (mu)5.84 (2,3)1.94 (1,4)2.11 (1,4)5.15 (2,3)3.72
Human capital
Household size3.44 (2,3,4)2.20 (1,3,4)3.77 (1,2,4)2.64 (1,2,3)3.08
Numbers of household laborers2.26 (2,4)1.29 (1,3,4)2.13 (2,4)1.92 (1,2,3)1.94
Average age of household laborers (year)48.83 (2,3,4)56.72 (1,3)46.44 (1,2,4)55.67 (1,3)51.62
Education level of household laborers (year)2.63 (2,3,4)2.28 (1,3)2.80 (1,2,4)2.18 (1,3)2.48
Physical capital
House value (ten thousand yuan)17.079.3714.2016.7314.73
Numbers of household durable12.46 (2,3,4)6.56 (1,3,4)10.71 (1,2,4)7.46 (1,2,3)9.2085
Social capital
Numbers of cadre in household and relatives0.27 (4)0.180.25 (4)0.16 (1,3)0.21
Communication cost (yuan)132.84 (2,4)52.58 (1,3)123.29 (2,4)58.25 (1,3)91.41
Expense of cash and gifts (yuan)4138.06 (2,4)1623.01 (1,3)3743.20 (2,4)1612.62 (1,3)2744.68
Financial capital
Deposit 1.62 (2,3,4)1.85 (1,3)1.69 (1,2,4)1.87 (1,3)1.76
Loan 1.70 (2)1.82 (1,3,4)1.66 (2,4)1.72 (2,3)1.71
Ecological compensation funds (yuan)1205.16 (2,3,4)184.55 (1,3,4)417.28 (1,2)504.61 (1,2)538.03
The superscript letters in brackets indicate categories that are significantly different at the 5% level from other livelihood types, using the Scheffe’s test. H-H means the household type of high welfare and high dependency; L-L means the type of low welfare and low dependence; H-L stands for the type of the high welfare and low dependence; and L-H is the type of low welfare and high dependency. In terms of deposits and loans, “1” means a deposit or loan exists and “2” means no deposit or loan exists. For the deposit (or loan), the bigger is the value, the greater is the deposit (or loan). Households hope for larger deposits and smaller loans.
Table 3. The environmental consequences of the different household types.
Variable1. H-H
(n = 289)
2. L-L
(n = 289)
3. H-L
(n = 588)
4. L-H
(n = 588)
Average
(n = 1754)
Economic income
Income per capita (yuan)14,710.53 (2,3,4)4939.75 (1,3)16,588.88 (1,2,4)4114.63 (1,3)10,178.22
Land resource development and investment
Crop yield per mu (kg)670.59 (2,3)315.67 (1,3,4)436.39 (1,2,4)641.39 (2,3)523.74
Expense of pesticide (yuan)223.76 (2,3,4)60.37 (1,3,4)108.44 (1,2,4)151.05 (1,2,3)133.80
Expense of fertilizer (yuan)1112.27 (2,3,4)245.06 (1,3,4)495.37 (1,2,4)801.72 (1,2,3)658.47
Consumption of farm manure (jin)1655.94 (2,3,4)158.36 (1,4)606.62 (1)949.88 (1, 2)820.73
Firewood consumption
Consumption of firewood (kg)3032.35 (2,3,4)1333.74 (1,3,4)1844.59 (1,2,4)2321.79 (1,2,3)2116.09
Fossil energy consumption
Consumption of coal (kg)1382.18 (2,4)981.15 (1,3)1564.55 (2,4)975.09 (1, 3)1240.77
Consumption of LPG (kg)57.41 (2,3,4)40.23 (1,4)45.92 (1,4)21.78 (1,2,3)38.78
Power consumption
Consumption of electricity (kwh)1867.53 (2,3,4)992.25 (1,3)1341.98 (1,2,4)926.27 (1,3)1231.59
Total energy consumption (tce)1315.23 (2,4)891.74 (1,3)1361.21 (2,4)847.67 (1,3)1104.13
The superscript letters in brackets indicate categories that are significantly different at the 5% level from other livelihood types, using the Scheffe’s test. H-H means the household type of high welfare and high dependency; L-L means the type of low welfare and low dependence; H-L stands for the type of the high welfare and low dependence; and L-H is the type of low welfare and high dependency. tce = ton of standard coal equivalent. 1” means a deposit or loan exists and “2” means no deposit or loan exists. For the deposit (or loan), the bigger is the value, the greater is the deposit (or loan). Households hope for larger deposits and smaller loans
Table 4. The influential factors of the different household types.
Explanatory VariablesH-HL-LH-L
CoefficientSECoefficientSECoefficientSE
Geographical location
Distance from Beijing city (km)−0.01034 ***0.002−0.000920.002−0.01047 ***0.002
Natural capital
Cultivated land areas (mu)0.01589 ***0.004−0.16466 ***0.019−0.00997 *0.006
Household structure
Household size0.27586 ***0.066−0.20708 ***0.0790.43569 ***0.056
Average age of household laborers (year)−0.03358 ***0.0090.006630.008−0.04016 ***0.008
Household labor quality
Education level of household laborers (year)0.109210.1080.112370.1110.31698 ***0.092
Number of household member skilled0.23950 **0.112−0.094090.1400.18147 *0.099
Number of household member trained0.44339 ***0.136−0.082720.1890.173580.129
Ecological policies
Ecological compensation funds (yuan)0.00020 ***0.000−0.00039 ***0.000−0.000050.000
Intercept1.218880.8190.445550.7910.9660.730
Pseudo R2 values: McFadden = 0.179; Nagelkerke = 0.406; Cox and Snell = 0.377. H-H means the household type of high welfare and high dependency; L-L means the type of low welfare and low dependence; H-L stands for the type of the high welfare and low dependence; and L-H is the type of low welfare and high dependency. Reference category is L-H households. ***, **, * indicate statistical significance at the 1%, 5%, and 10% levels, respectively.

