Study of Quassessment Model for Campus Pedestrian Ways, Case Study: Sidewalk of the University of Lampung


1
Graduate School of Environmental Engineering, The University of Kitakyushu, Kitakyushu 808-0135, Japan
2
Architecture Study Program, Engineering Faculty, Bandar Lampung University, Lampung 35142, Indonesia
3
Department of Architecture, the University of Kitakyushu, Kitakyushu 808-0135, Japan
*
Author to whom correspondence should be addressed.
Sustainability 2017, 9(12), 2285; https://doi.org/10.3390/su9122285
Submission received: 12 October 2017
/
Revised: 23 November 2017
/
Accepted: 28 November 2017
/
Published: 8 December 2017
Abstract
:The condition of pedestrian ways on campuses in Indonesia has become a serious problem because of the gap between regulations on pedestrian ways and reality. This condition affects students’ satisfaction as they move around. This research attempts to develop an evaluation model and test it on the sidewalks of the University of Lampung campus. The method used in this study is a qualitative-quantitative method (mix methods), collecting data through literature questionnaires and observations. For data analysis, quantitative content analysis and statistical analysis were used to determine the correlation between predominant variables and students’ overall satisfaction. This study found five dimensions of an evaluation model introduced by quassessment: quality, design, safety, sensory, amenities. It also found that the dominant factors that cause student dissatisfaction are concerns with durability of path material, aesthetics, and continuity of path without significant elevation differences. The dominant factors that potentially bring more satisfaction to students are durability of path material, aesthetics, and availability of shelter. On the other hand, observation, absence of obstruction, continuity of path without significant elevation differences, and durability of path material are the most common factors. Also, it has been found that overall satisfaction has a correlation with five dominant factors, which are durability of path material factor (0.62), absence of obstruction (0.60), continuity of path without significant elevation differences (0.69), aesthetics (0.59), and availability of shelter (0.53).
1. Introduction
A campus is a place where many student activities are held during their college journey. It usually features various buildings, such as a university office, faculty building, student activity center, and other supporting facilities. It can be regarded as a small city that requires various levels of completeness and complexity for large activities [1]. One of the most important factor of campus completeness is an acceptable pedestrian environment.
Pedestrian ways are the primary facilities for mobility [2] for students in a campus environment. They are very useful as connecting lanes from the parking lot or bus stop to the lecture hall, library, office, and so on. Student activities in a campus environment involve large crowds and a lot of mobility [3]. Therefore, ideal pedestrian ways are needed on campus to achieve sustainability [4]. Ideal pedestrian ways should follow government regulations.
However, pedestrian ways in most campuses in Indonesia require serious attention, as evidenced by the gap between regulations and reality. Real conditions reveal path conditions that are not in accordance with regulations, such as structural damage, obstacles, accident hazards, broken pavement, and so on. This gap can definitely affect the convenience of students as they participate in academic and social activities [5].
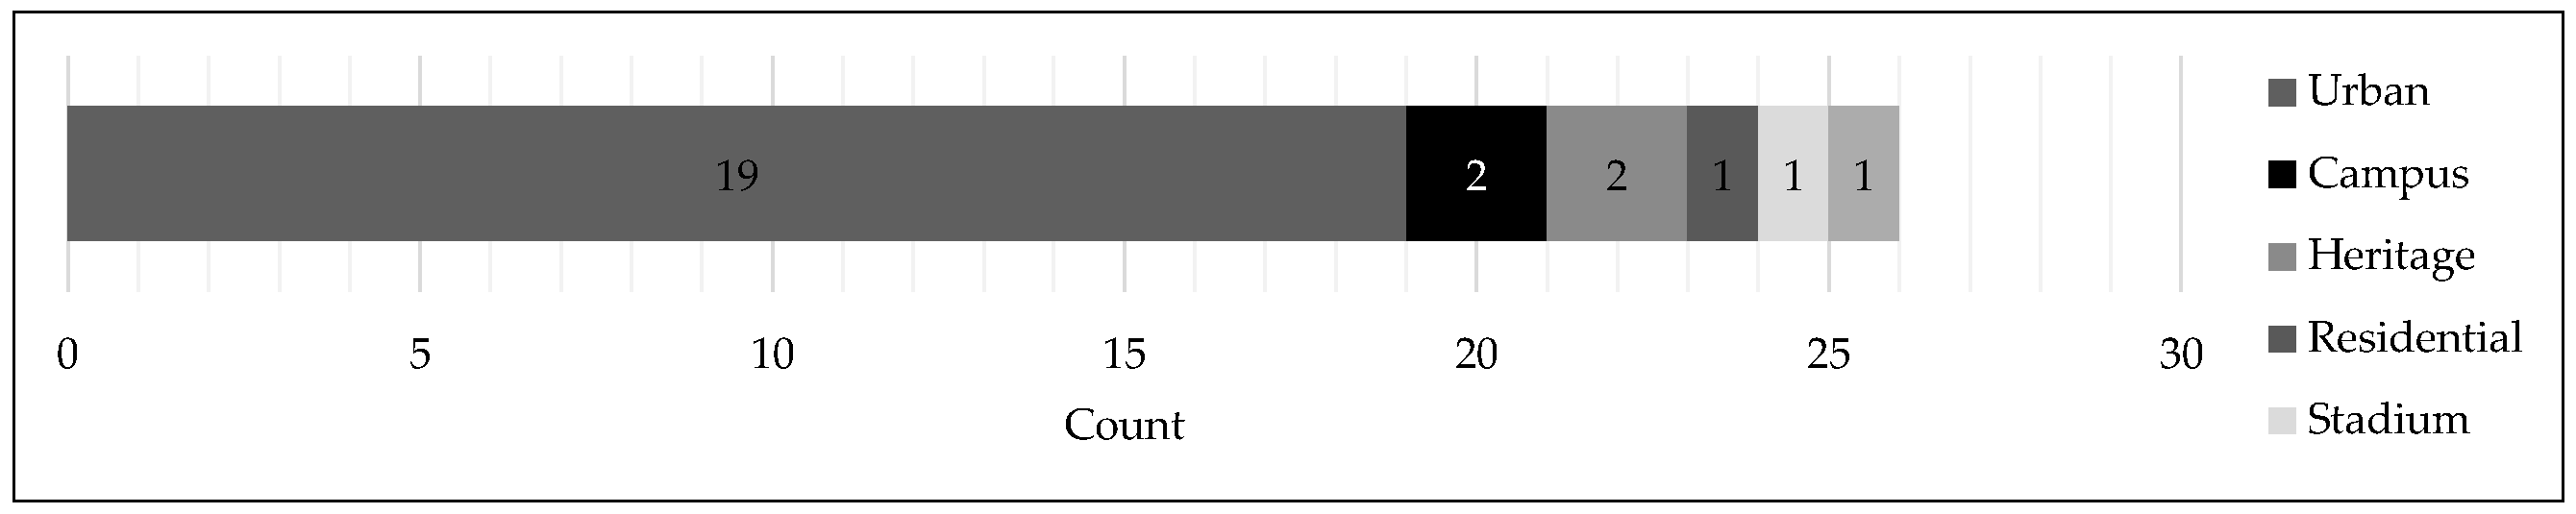
Studies on the evaluation of pedestrian environments have been widespread. Figure 1 shows the distribution of research studies on evaluation of pedestrian ways. However, most of these studies focus solely on environments in urban centers. Meanwhile, research studies on campus environments are very rare. This study is, therefore, very important to enrich scientific references on the topic of campus pedestrian ways. The results of this study are expected to contribute to strategies for improving the quality of pedestrian environments and the convenience of walking, especially in Indonesian campuses.
The evaluation techniques used in previous studies include satisfaction evaluation, pedestrian level of service (PLOS), assessment, measurement, pedestrian index, focus group, and examination research (Table 1). The satisfaction evaluation technique is the one most often used because it has several advantages. First, it involves getting feedback from users. Second, data collection is easier because respondents find it easy to understand questions about their satisfaction of a pedestrian environment. Third, measuring results is easier using a statistical software package. Thus, the strategy of improving the quality of pedestrian environments is easier to implement using this technique.
The elements that were commonly evaluated in previous research are pedestrian, walkability, and pedestrian environment [16]. The elements of pedestrian and walkability are the most dominant ones used in various studies because research in this field is more prevalent in cities in developed countries that have an acceptable quality of pedestrian environments. On the other hand, in cities in developing countries, especially Indonesia, pedestrian environments generally do not have sufficient quality. Thus, studies on the elements of pedestrian environments such as sidewalks are still indispensable.
Previous evaluation research discussed several important topics, namely, place scale, pedestrian tendency, safety, mobility, and transport connection. Place scale is the most frequently discussed among the topics. Place scale is divided into three categories: big place scale, medium place scale, and small place scale. Big scale covers the environment [10,27] and global urban centers [16,17]. Medium scale includes residential areas [6], stadiums [29], and campuses [3,4]. Small scale includes street festivals [13], street corridors [18], and green streets [7]. This research falls under the category of medium place scale because it involves campuses, and it is most suitably conducted in cities in developing countries that generally do not have satisfactory pedestrian environments. If the quality of a pedestrian campus environment is good, then cities can duplicate it in other environments.
Based on the aforementioned background information, the research questions are these: (1) What is the model for pedestrian ways on campus, especially in Indonesia? (2) What are the dominant factors with which students are not satisfied? (3) Is there a correlation between the dominant factors and students’ overall satisfaction? Considering the aforementioned research questions, the purpose of this study is to create a basic model for evaluating a pedestrian environment, determine the dominant factors perceived by students, and determine the relationship between the dominant factors and the overall satisfaction of students. Thus, the contribution of this research is primarily the model, which can be used as a reference for improving the quality of pedestrian environments.
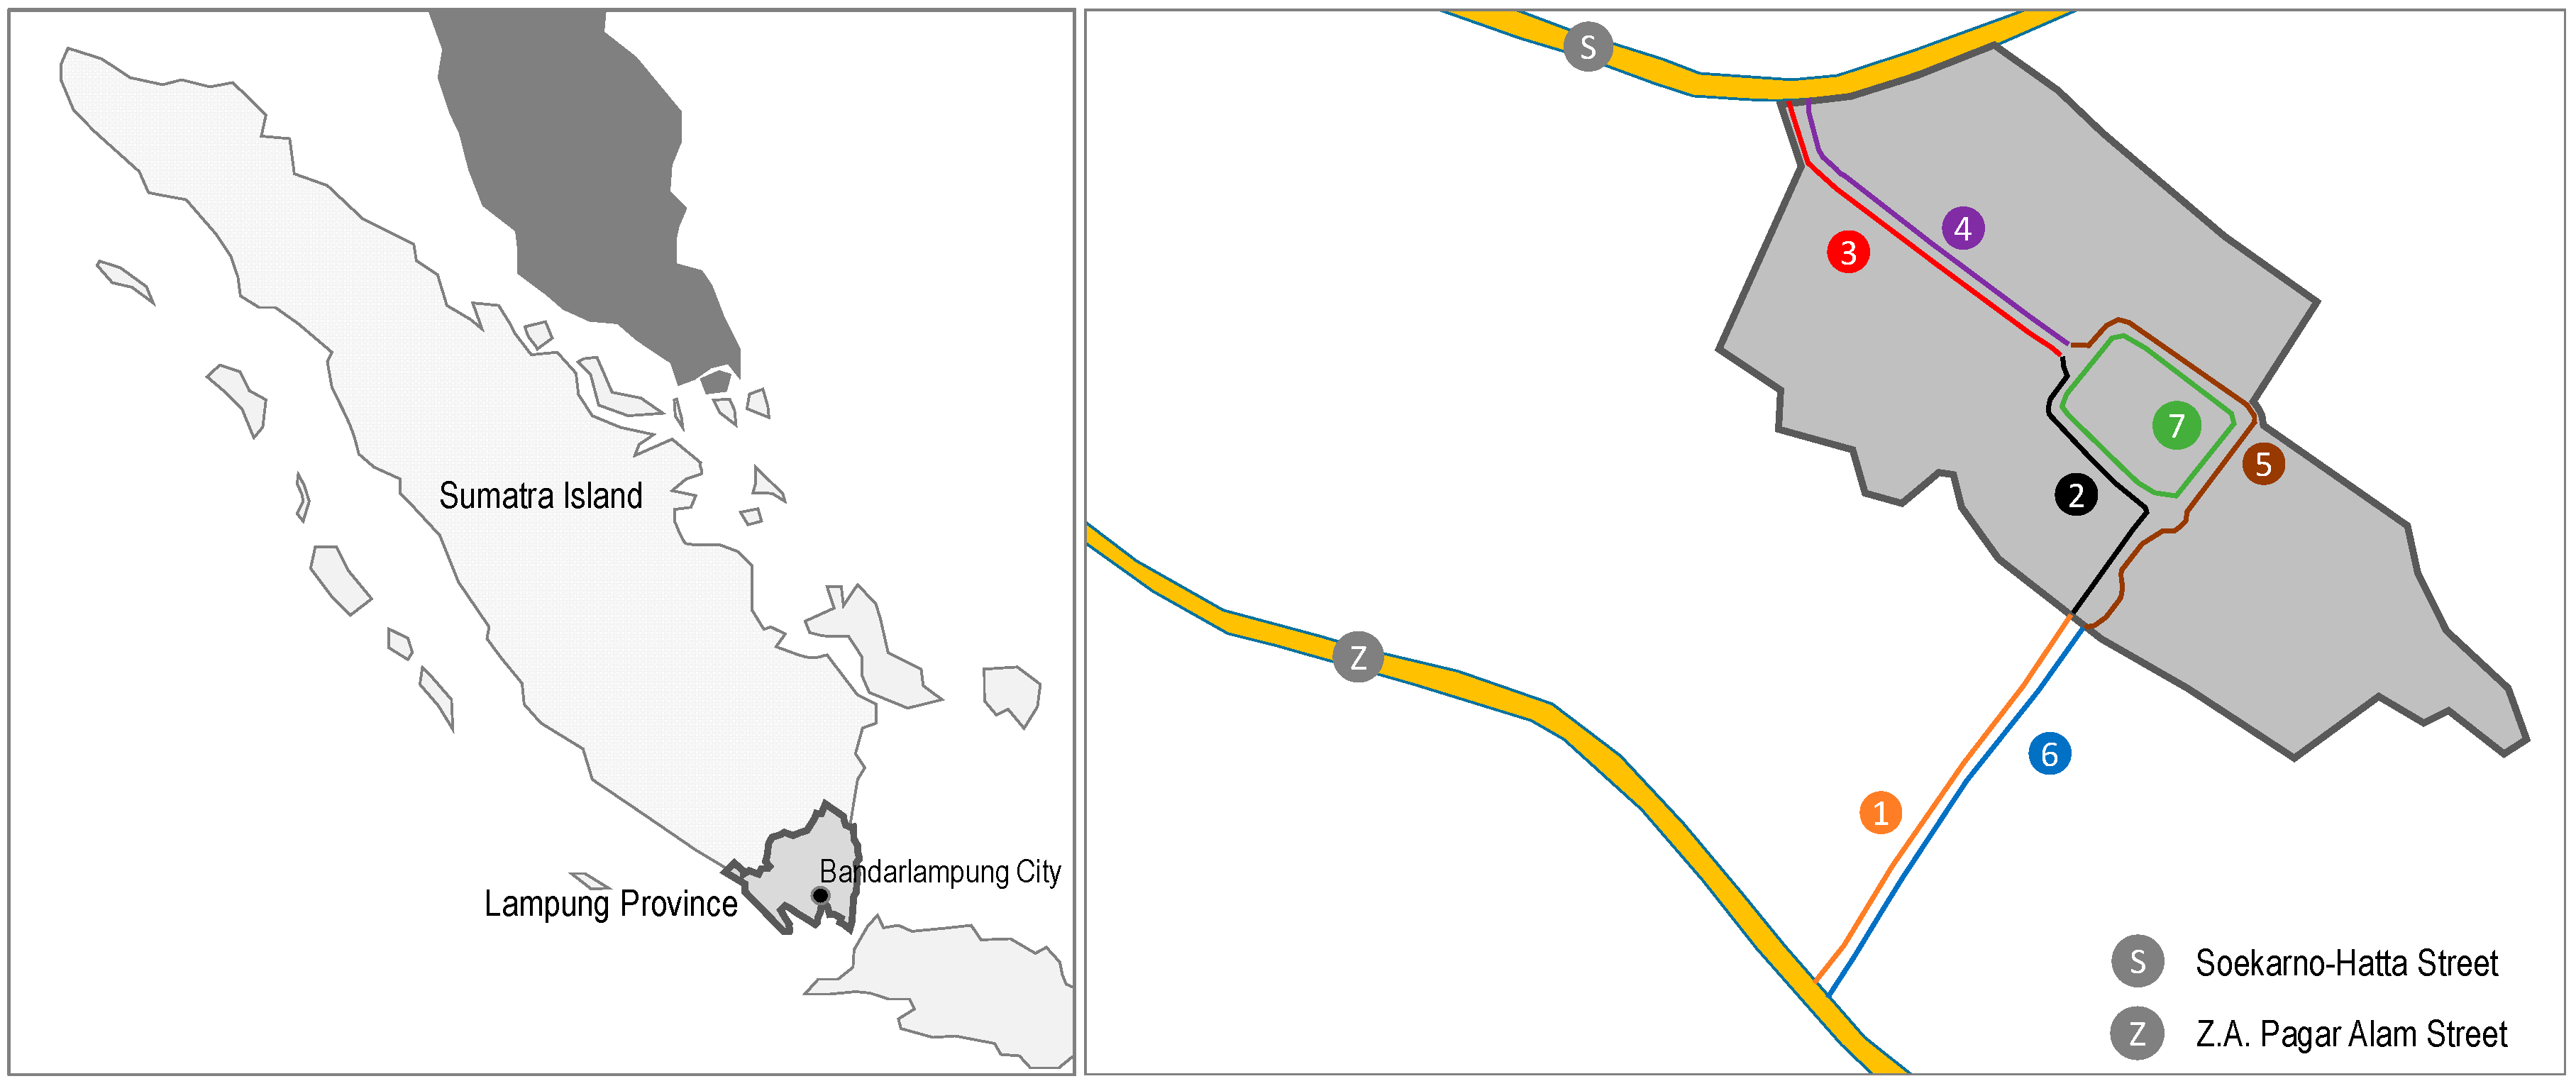
In this research, we propose an evaluation model and test it in a pedestrian environment. The chosen environment is a sidewalk on Soemantri Brodjonegoro Street at the University of Lampung in Indonesia (Figure 2). This road has two main entrances, through Z. A. Pagar Alam (ZP) and Soekarno-Hatta (SH) Streets. The campus was chosen for this study because it is the largest campus in Lampung Province, Sumatra Island. The university has diverse students because they come not only from Sumatra Island but also from Java Island.
2. Literature Review
2.1. Campus Pedestrian Ways
Pedestrian ways (sidewalks) are facilities that have become the main modes of mobility. The common problems that are seen in these facilities (especially in developing countries) are narrow roads [3,6,7,8], obstacles [9,10], damaged pneumatic materials [11], absence of shade [12], and aesthetic elements [8]. These problems are also observed in campus environments, especially in Indonesia, because of the lack of attention given to these facilities.
2.2. Methods of Evaluation Research
The methods used in this research are qualitative and quantitative. Quantitative methods are more predominantly used in research involving evaluation of pedestrian ways. However, each method is used for a different purpose. Qualitative methods are more suitable for exploration [6,7]. Qualitative data collection methods include observation, review, and documentation [2]. On the other hand, the quantitative method is more appropriate for measurement research [2,6] using statistical software packages, pedometers, Geographic Information Systems (GIS), and the like.
3. Methods
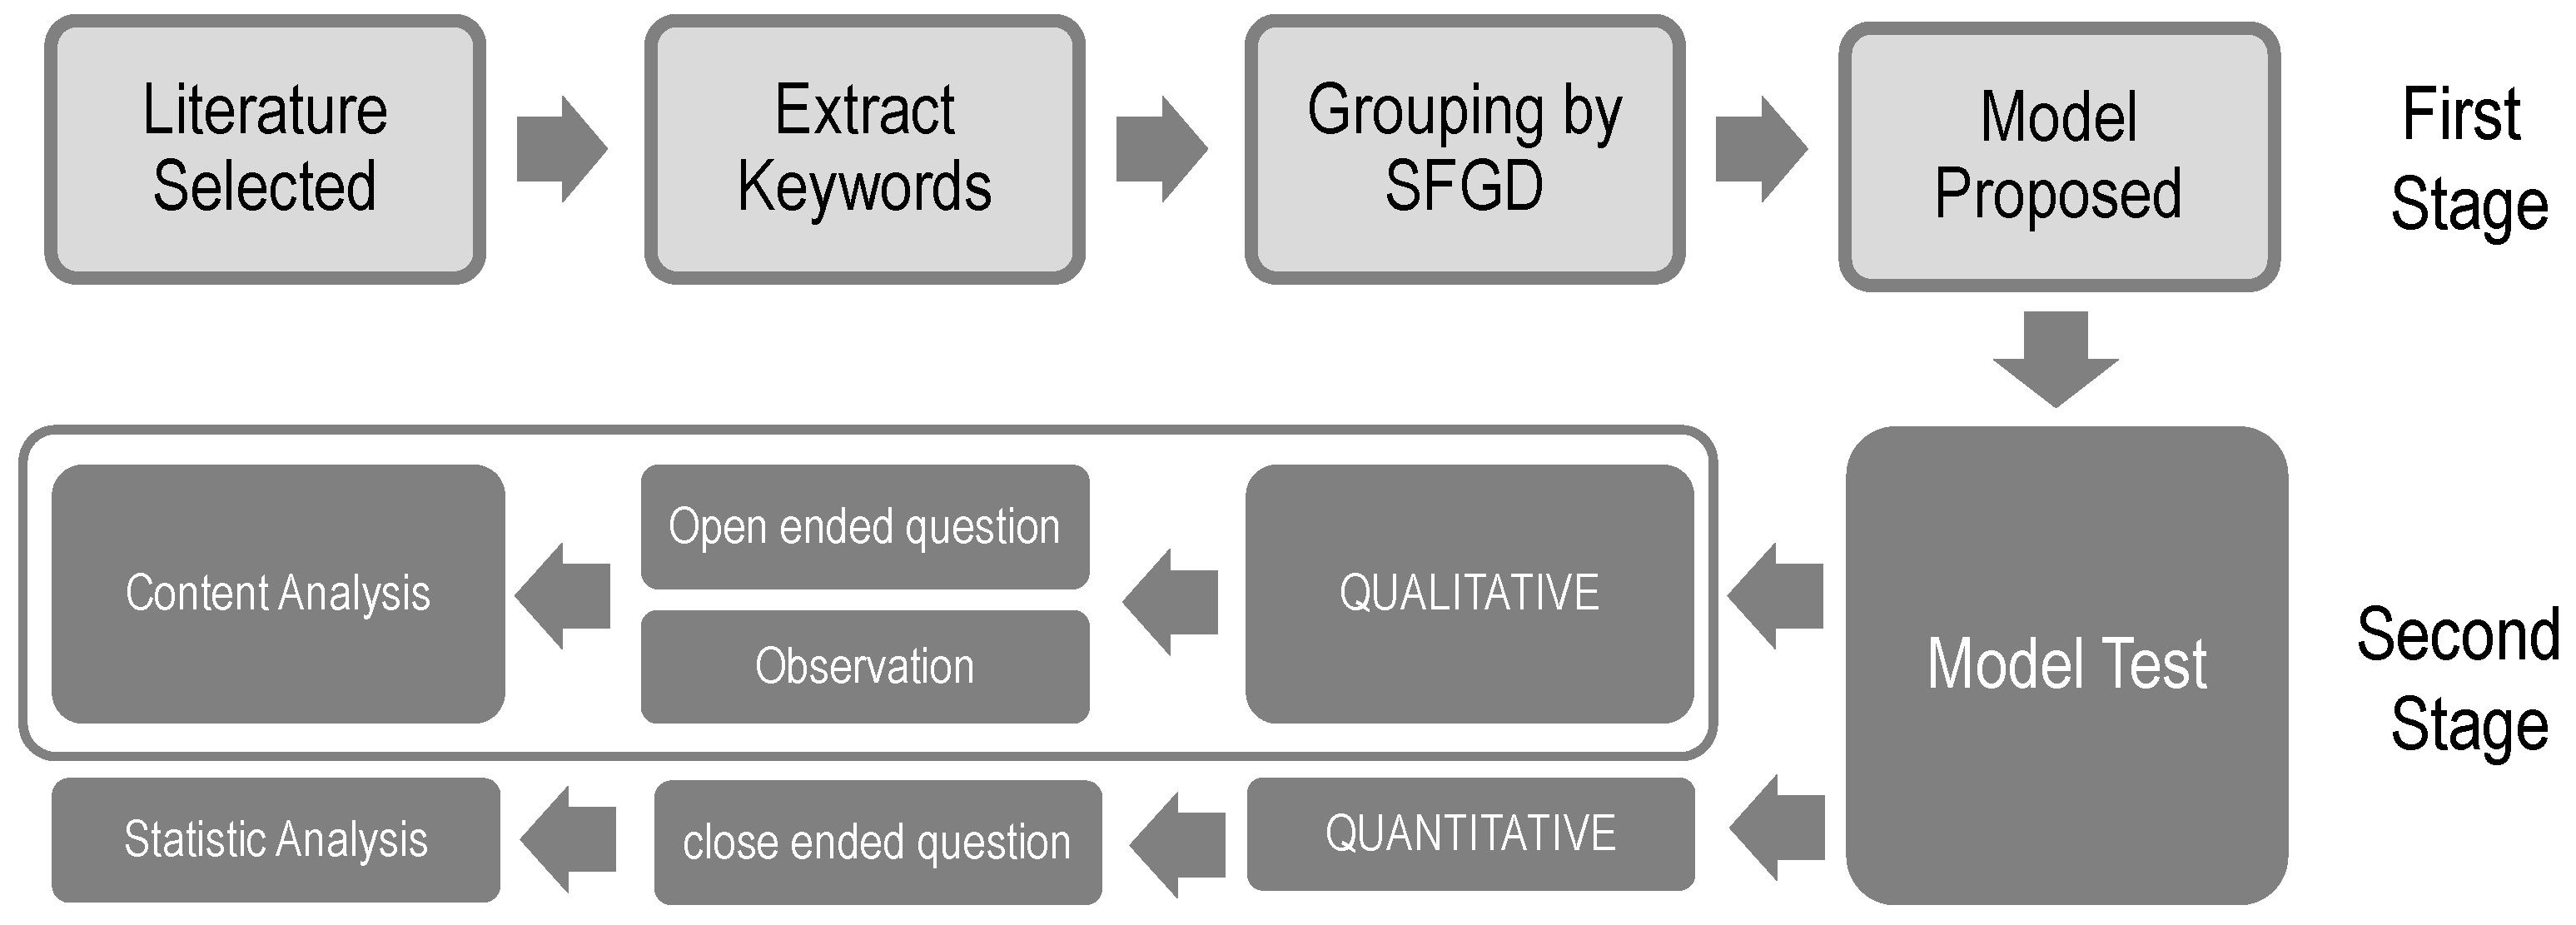
This research used a combination of qualitative and quantitative methods (concurrent triangulation strategy; mixed methods) [30]. This method was used in collecting data. Furthermore, each result underwent comparison to verify all data. The stages in this study involved an assessment model (literature selected, extracted keyword, groupings), which was tested using qualitative and quantitative methods (Figure 3).
The first stage involved exploring the keywords (variable) at each stage. Keyword exploration was done using a content analysis method. Content analysis was performed by tabulation to calculate the number of affected keywords in each data unit, such as literature, respondents, and photos. The keywords in each data unit were represented by the number one (1), whereas absence of a keyword was represented by zero (0). The analysis was performed on the recapitulation table to determine the dominant variable. The criteria used in a detailed discussion were based on the three dominant variables on each graph.
The second phase was the qualitative and quantitative phase. Qualitative data collection was done through open-ended questions and observation. Meanwhile, quantitative data collection was done through closed-ended questions. Open and closed questions were sequentially distributed in the classroom. A media filling questionnaire was used as an online questionnaire. Qualitative data underwent content analysis, whereas quantitative data were subjected to statistical analysis.
3.1. Model Arrangement of Pedestrian Way Variables
This evaluation model was obtained from the literature. Literature data collection was done by selecting previous studies based on certain criteria. The selected research criteria were (a) research from an international journal or conference; (b) research titles based on the keywords evaluation (measuring, quality, assessment, examining, statistical, quantifying, quantitative, qualitative, etc.), perception (satisfaction, comfort, etc.), and pedestrian ways (walkways, sidewalk, pathways, etc.); and (c) year of publication, which must have been within the last five years (2013–2017). In the end, 26 related papers were selected.
A total of 26 extracted keywords were selected at the initial stage. Keywords derived from the authors’ explanations were considered to be involved in the model design (Table 2). On the other hand, keywords derived from component tables, diagrams, pictures, and other descriptions were not included in the content analysis as they were considered secondary data. This keyword choice was adjusted to the context of the pedestrian ways on campus, where the stage can unfold effectively. Thus, keyword findings that did not fit the campus context were ignored.
3.2. Testing Model by Open-Ended Questionnaire
The questionnaire stage of data collection aims to determine students’ response to the conditions of pedestrian paths. Open-ended questions sent to students allow them to freely explore their responses about pedestrian paths. This exploration aims to extract keywords from their responses about pedestrian paths. In addition, it aims to complement keywords that have not been found in the literature.
The questionnaire was distributed to students from the Architecture Department, Faculty of Engineering. The respondent population was chosen because of the layout of the Architecture Department building, which is at the center of the campus. In addition, architecture students are the most appropriate subjects for the exploration of satisfaction of pedestrians because they have basic knowledge of space and activity. The Architecture Department had 60 students from two batches. The questions given to the students were the following: (1) Are you satisfied with the condition of the pedestrian paths on campus? (2) Give your reasons for your answer to the first question. (3) What are the things that you expect to have to be more satisfied with the pedestrian ways on campus?
The first question in the questionnaire aimed to determine the percentage of students who answered satisfied and dissatisfied. The predominant percentage will be discussed in detail in the next section. The second question aimed to determine the keywords related to the reasons for being satisfied or not satisfied. The keywords were obtained through content analysis of respondents’ answers. The keywords were then categorized based on the proposed model. Meanwhile, the third question aimed to determine the expectations of students as regards pedestrian paths with the aim of adding keywords.
Distribution analysis was performed to determine the frequency of respondents’ satisfaction response (the second question). The three biggest frequencies will be the focus of further discussion. The same was done for the third question. It aimed to determine students’ expectation that could be more satisfied with the pedestrian paths.
3.3. Testing Model by Observation
Observations were conducted to obtain accurate and thorough data. Observations were made through direct observation and documentation of existing pedestrian pathways. Direct observations were done to identify existing pedestrian pathways in general. These observations aimed to document the physical conditions of the paths, spatial considerations, and completeness. The observations were done on the sidewalk of Soemantri Brodjonegoro Street, which is divided into seven zones based on the criteria of boundaries and road nodes (Figure 1).
Documentation was done by capturing photographs every 10–15 m along the track or at every condition considered important. In addition, some conditions were documented in detail to facilitate analysis of those conditions. A total of 744 photographs were obtained. The photographs were selected based on quality and content so that differences did not lead to bias during analysis. The results were obtained by selecting 459 photographs spread across multiple zones (Table 3).
Content analysis of the photographs at each zone produced a variable arrangement on the table. Distribution analysis was performed to find the most dominant variable. This analysis was also done to identify the differences of the dominant variables at each zone.
3.4. Testing Model by Close-Ended Questionnaire
The JMP Software (JMP is a dynamic software created by John Sall, pronounced “jump,” its name suggests a leap in interactivity, a move in a new direction) was used in the processing of quantitative data (Likert scale). The research questions were answered through multivariate correlation analysis and bivariate correlation analysis. The result of the correlation test was obtained by considering the following: correlation value, positive and negative value, and significant value. The correlation value was between zero (0) and one (1). The number zero (0) means no correlation at all, whereas the number one (1) means very strong correlation. This correlation value was subdivided into five levels: very low correlation (0–0.20), low correlation (0.21–0.40), moderate correlation (0.41–0.60), high correlation (0.61–0.80), and very strong correlation (0.81–1.00). Only correlation coefficients that had significant values of less than 5% were taken into account.
4. Results and Discussion
4.1. Model Proposed
A total of 34 keyword findings (variables) were grouped based on their similarities to determine the phenomenon that occurs in pedestrian paths. Three small focus group discussion (SFGD) were also conducted to get other opinions to assist authors in the modelling process. The result of the grouping was derived through comparative analysis to find the best evaluation model. It was obtained through five dimensions containing the same variables. The 34 variables are scattered in the appropriate corresponding five dimensions (Table 4). These dimensions include quality, design, security, sensory, and facility. These five dimensions (hereinafter quassessment) formed an evaluation model for pedestrian path environments on campus.
4.2. The Dominant Factor of Student Satisfaction
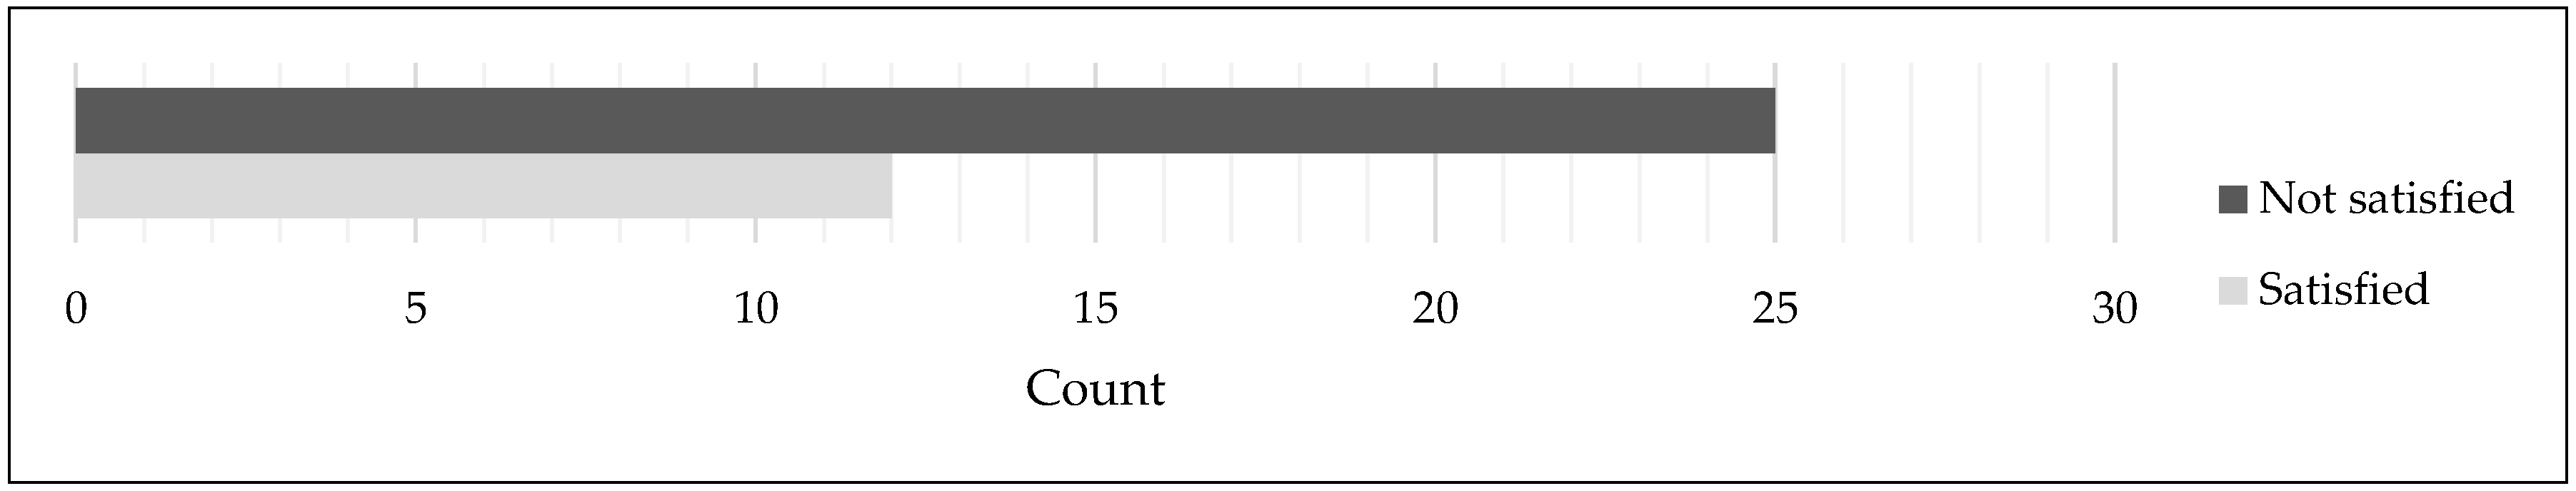
Figure 4 shows that 25 students (68%) expressed discontent with pedestrian paths, which means that the majority of the students use pedestrian paths and they have become a dominant factor of dissatisfaction. These paths are the main lines on campus. The main lines include the paths by the campus gates and terminal campus from students’ favorite place on campus or from the students’ residential center.
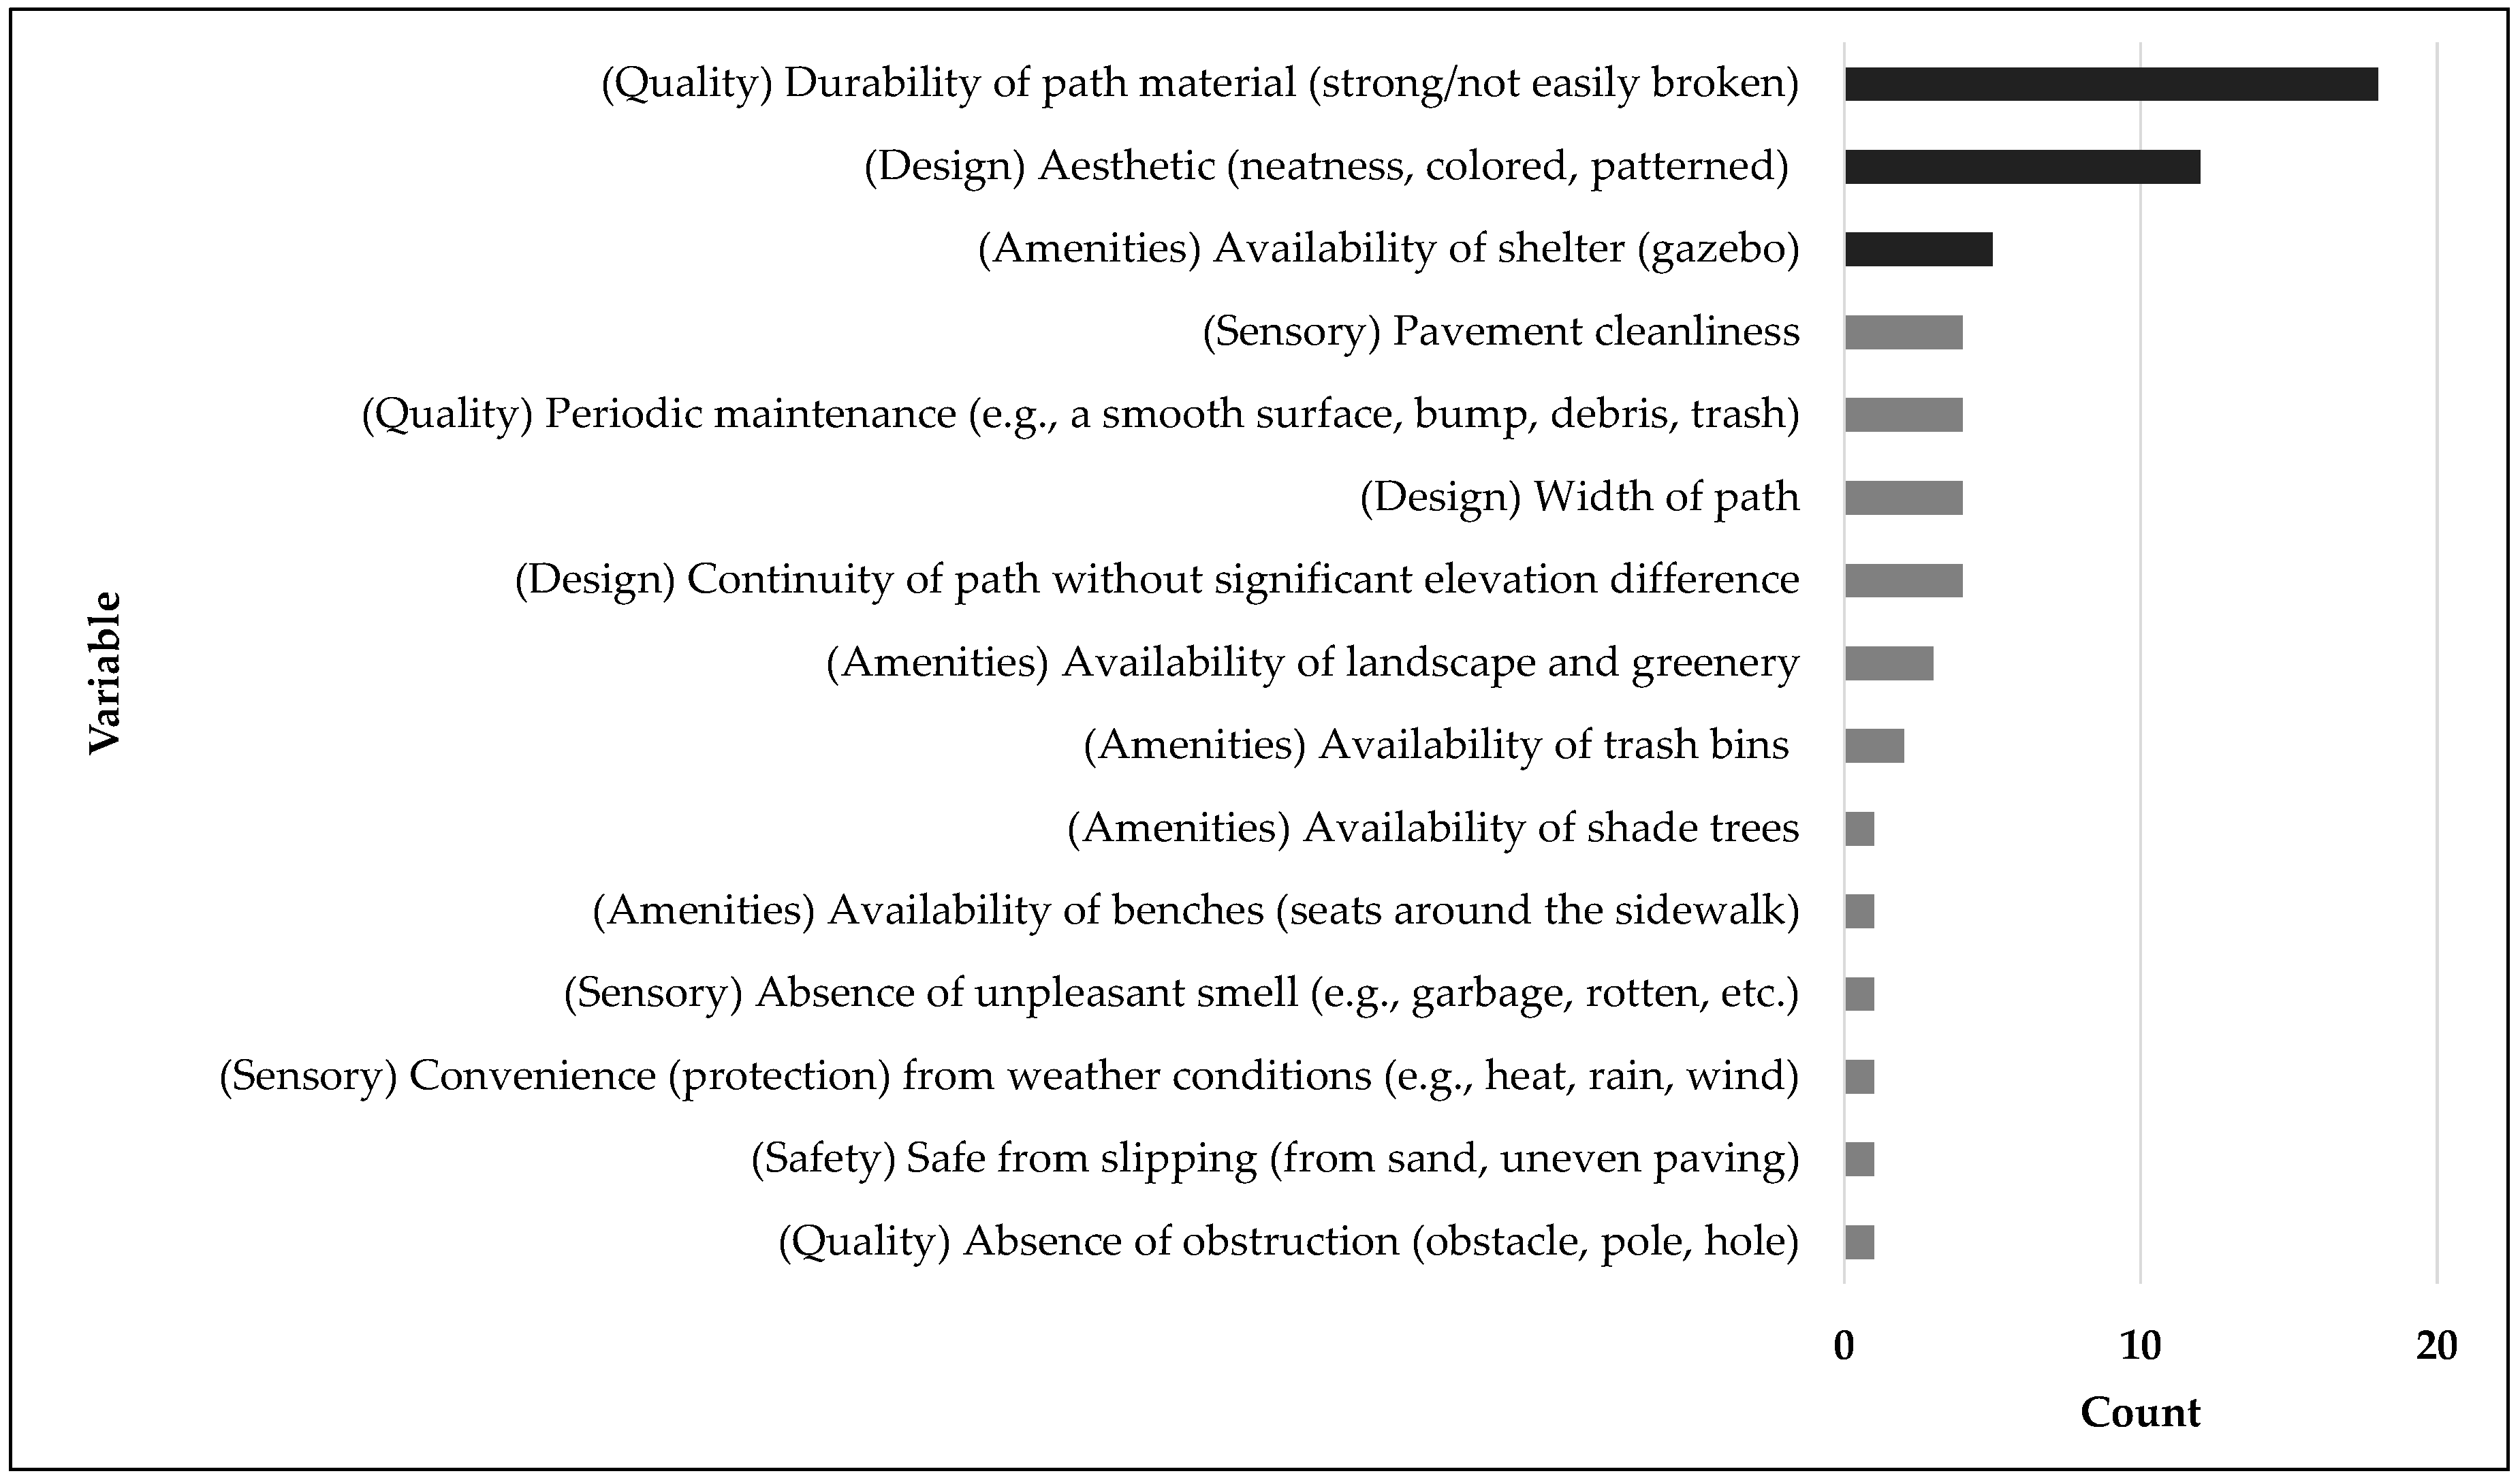
Figure 5 shows the distribution of pedestrian satisfaction. Students’ responses will be discussed in detail as expressions of their dissatisfaction with pedestrian paths, which is the most dominant response. Student dissatisfaction was manifested through 14 keywords expressing the reasons why they were currently dissatisfied. The keywords were grouped into several categories based on the model. Furthermore, distribution analysis was used to determine the dominant factors that caused student dissatisfaction.
The diagram shows that the three biggest factors that are considered dissatisfying by the students are durability of path material (Figure 6a), aesthetics (Figure 6b), and continuity of path without significant elevation differences (Figure 6c). Student dissatisfaction with the durability of path material (16; 43%) was caused by the respondents’ frequent encounters with damaged paths. This could mean that the damage was seen on the main lane or on access to their favorite places.
Student dissatisfaction with aesthetics (4; 10%) is caused by the fact that the students have seen more aesthetic sidewalks, or they have a good sense of aesthetics. In addition, there was dissatisfaction with continuous paths without significant elevation differences (4; 10%) due to the many different levels of elevation. This causes pedestrians to be more tired and affects their comfort. The differences between the dominant factors of dissatisfaction and other factors seems quite significant, which means that the dominant factors are the most important factors that need attention so that the majority of the users would be satisfied with pedestrian ways.
The distribution analysis diagram in Figure 7 shows that the three biggest factors of students’ expectations are durability of path material (Quality), aesthetics (Design), and availability of shelter (Amenities). Durability of path material (Quality) was the most frequently mentioned as being satisfactory (18; 49%), which means that students expect an overall improvement of the conditions of the damaged pavement. Better durability is considered the most important (priority) factor in increasing student satisfaction.
Aesthetics is also a dominant factor for improving student satisfaction. Improved aesthetics could be a good solution through paving, neatness, color, and pattern. The third biggest expectation shows that gazebos are a factor that could increase student satisfaction, considering that Indonesia is a tropical country with two seasons: drought and rain. Therefore, shelters (gazebos) greatly help students find relief from hot or rainy conditions.
The dimension of quality has become very important because students have high expectations about it. Neglect of this dimension will greatly affect the pedestrian satisfaction directly. In the design dimension, pedestrian satisfaction seems to be affected when the quality factor is met. This dimension of aesthetic demand will improve if the quality of the existing dimension achieves considerable satisfaction. Thus, these dimensions seem to be linearly proportional. Meanwhile, the amenities dimension is a dimension of the fulfillment of pedestrians’ desire to run their activities. Satisfaction of this dimension depends only on the fulfillment of the facility for each track. So student satisfaction will increase if there are additional amenities on the pedestrian path.
4.3. The Dominant Factor of Observation
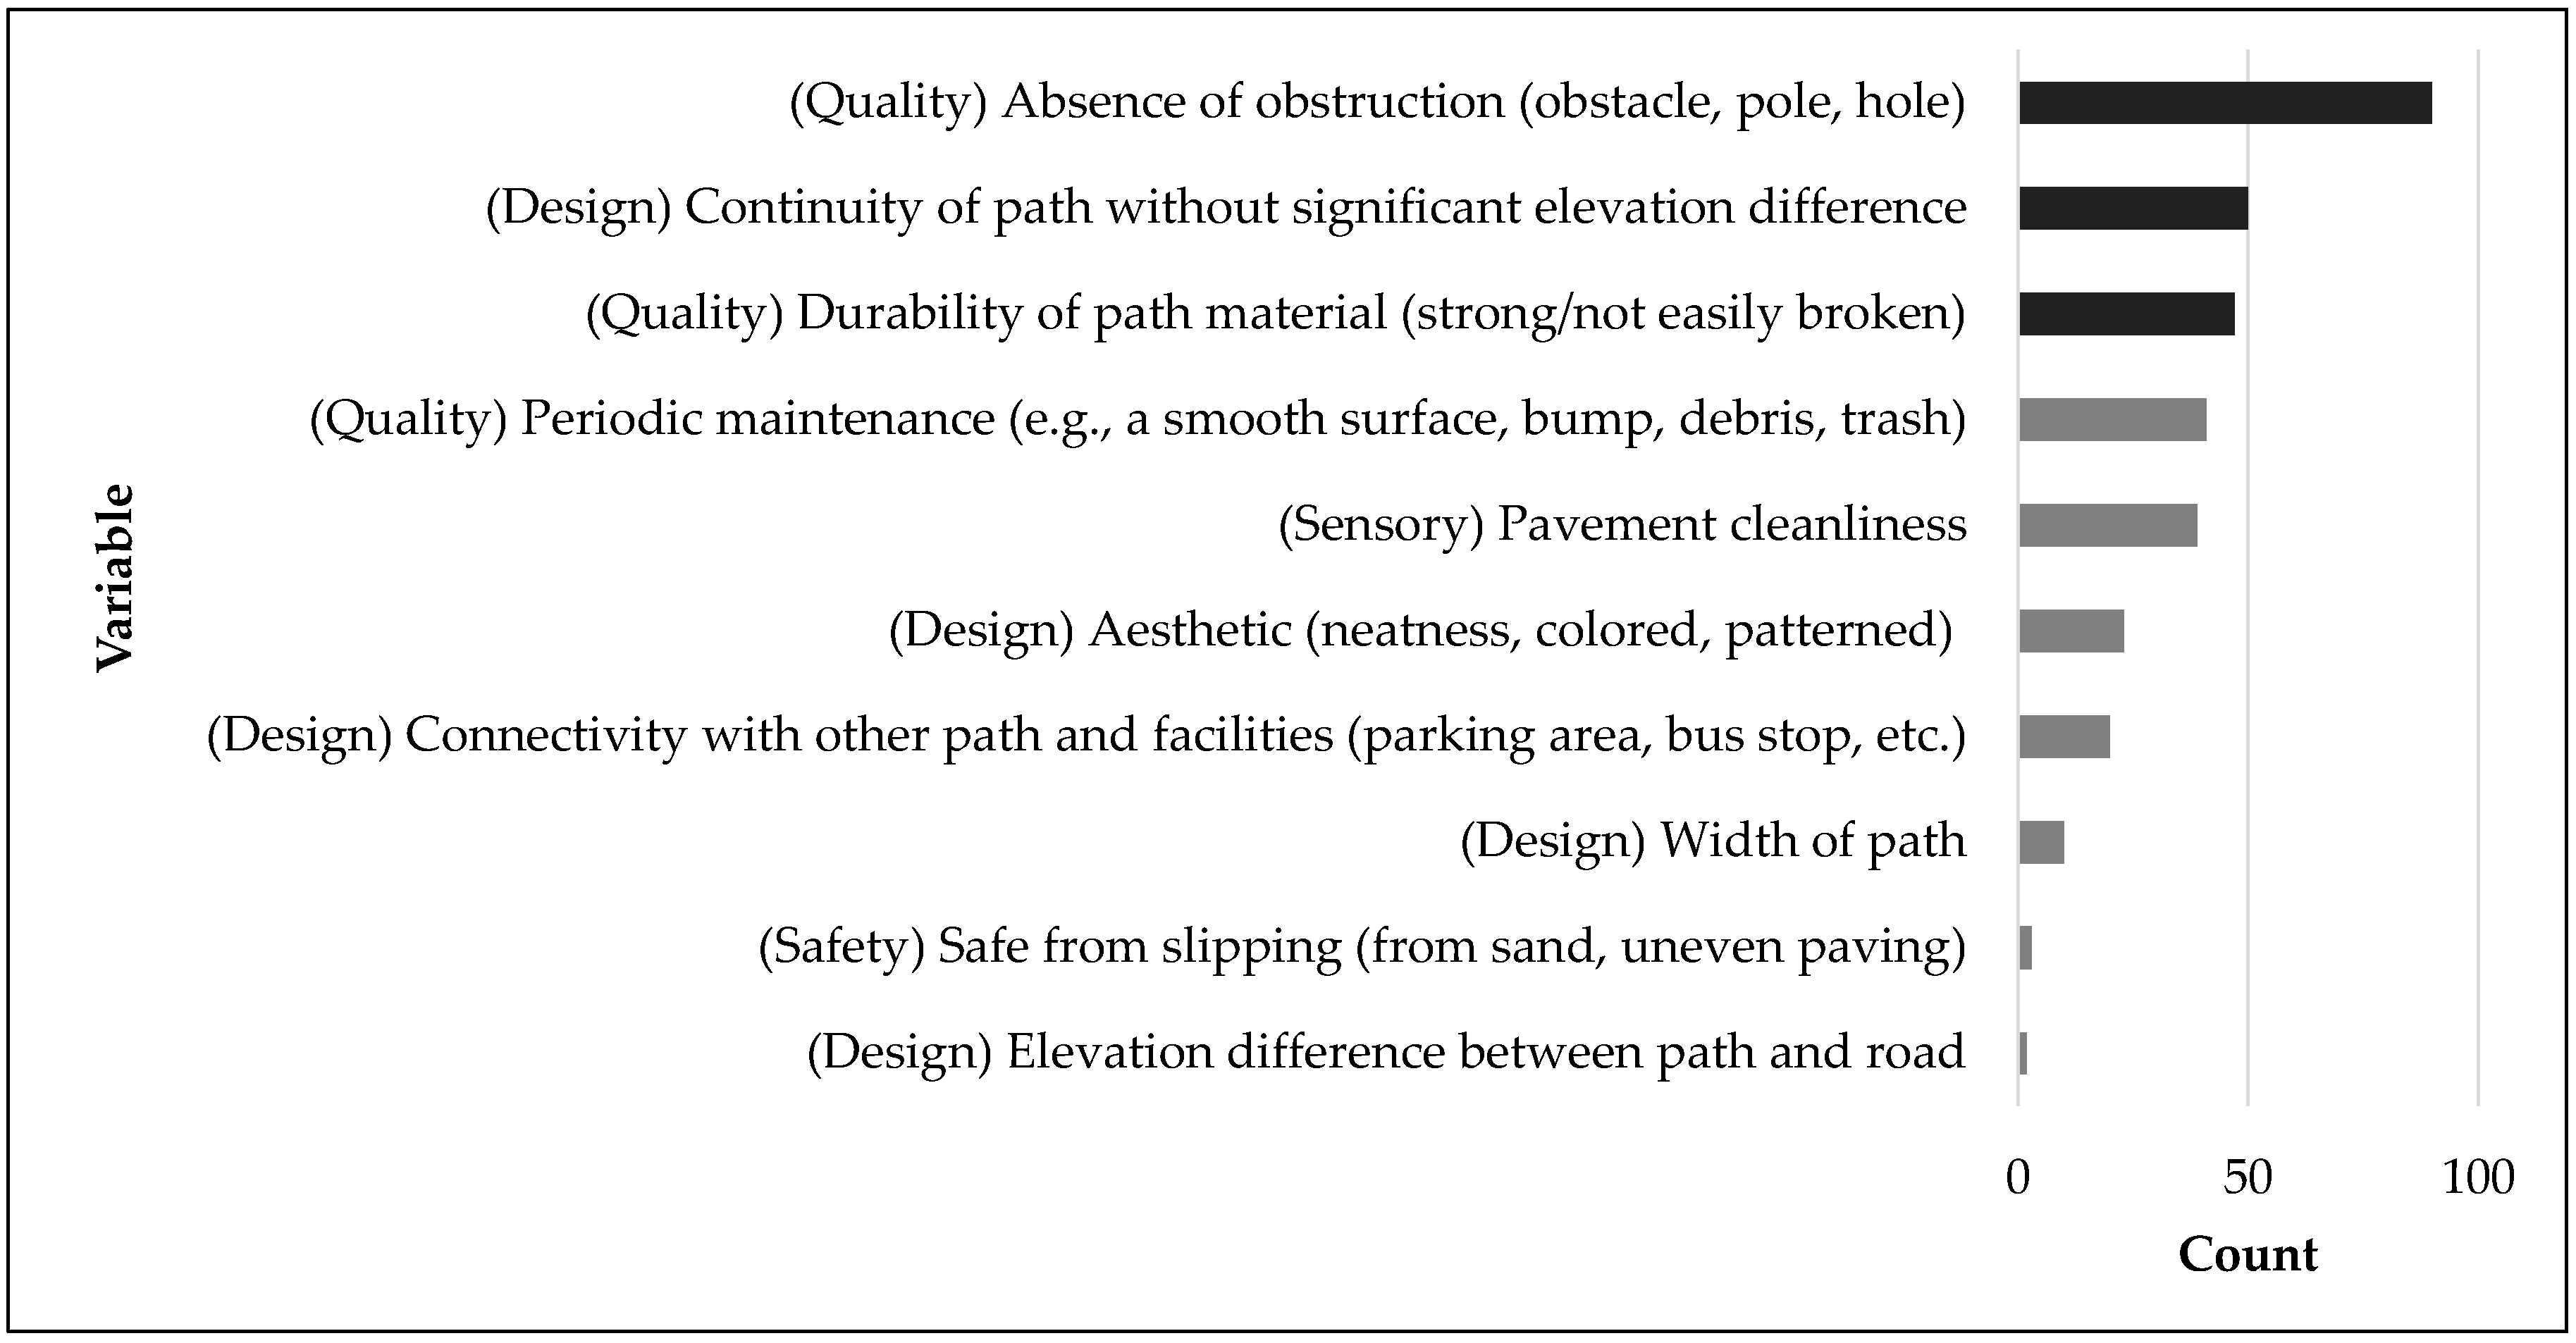
This analysis yields ten variables derived from the documentation photos. Results of the distribution analysis (Figure 8) found the factors that are not achieved on campus sidewalks, namely, absence of obstructions (90), continuity of path without significant elevation differences (50), and durability of path material (47).
The most unsuitable dominant factor was unobstructed path due to many obstructions found along the sidewalk. These include permanent and impermanent obstructions. A permanent obstruction is difficult to remove because it is embedded in the floor pavement. Also, an obstruction belongs to a particular structure. Permanent obstructions include shaped signposts, concrete, and trees. Meanwhile, impermanent obstructions, such as street vendors, advertisements, stones, and parked vehicles, are easy to clear (Figure 9).
Figure 10 shows the distribution of obstructions at each zone. The following graph shows that permanent obstructions (black bars) are more predominant than impermanent ones (gray bars); that is, a pedestrian will find permanent obstructions while walking in any area. The most predominant permanent obstructions are in Z7 since Z7 has many signposts and concrete. These conditions have narrowed the track so that running on the pathway is disrupted.
Meanwhile, impermanent obstructions are likely fewer than permanent obstructions. In certain zones (Z5, Z6, and Z7), no impermanent obstructions existed because the line in the zone is a path to the exit of the campus. On the other hand, the most common impermanent obstructions were in Z1. The most frequent impermanent obstructions were street vendors (SV) and billboards since Z1 is the main access to the campus area. Thus, this area is considered strategic for traders. Unfortunately, the track conditions have been affected by this obstruction.
Permanent and impermanent obstructions require different removal methods because of the nature of the obstructions. Impermanent obstacles are more easily removed because they are not bound to the structure of the pavement. Meanwhile, removal of major permanent obstructions is more difficult.
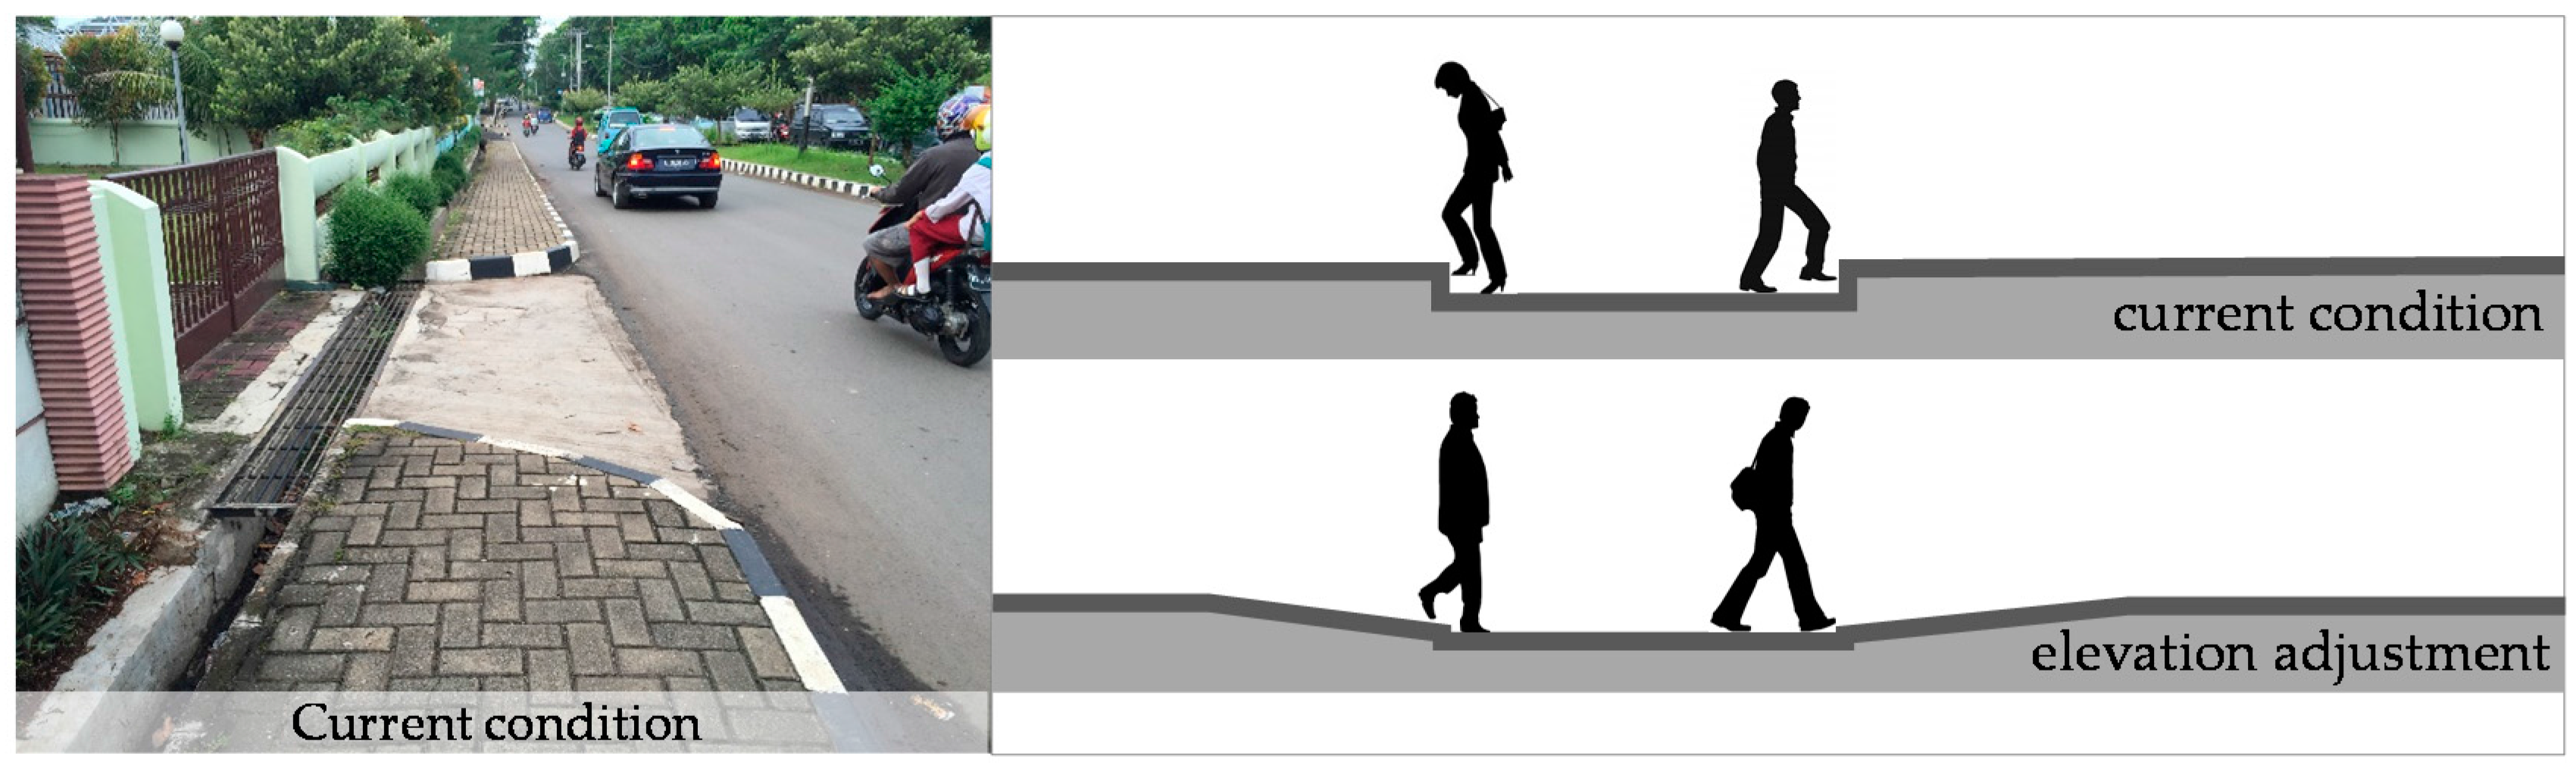
The second unsuitable dominant factor was continuous path without significant elevation differences due to many factors that affect pedestrian comfort. Pedestrian comfort is affected because pedestrians have to keep adjusting to the elevation differences on the path. These recurring elevation adjustments result in fatigue. So, we found some pedestrians who were walking on motor roads, which is definitely dangerous.
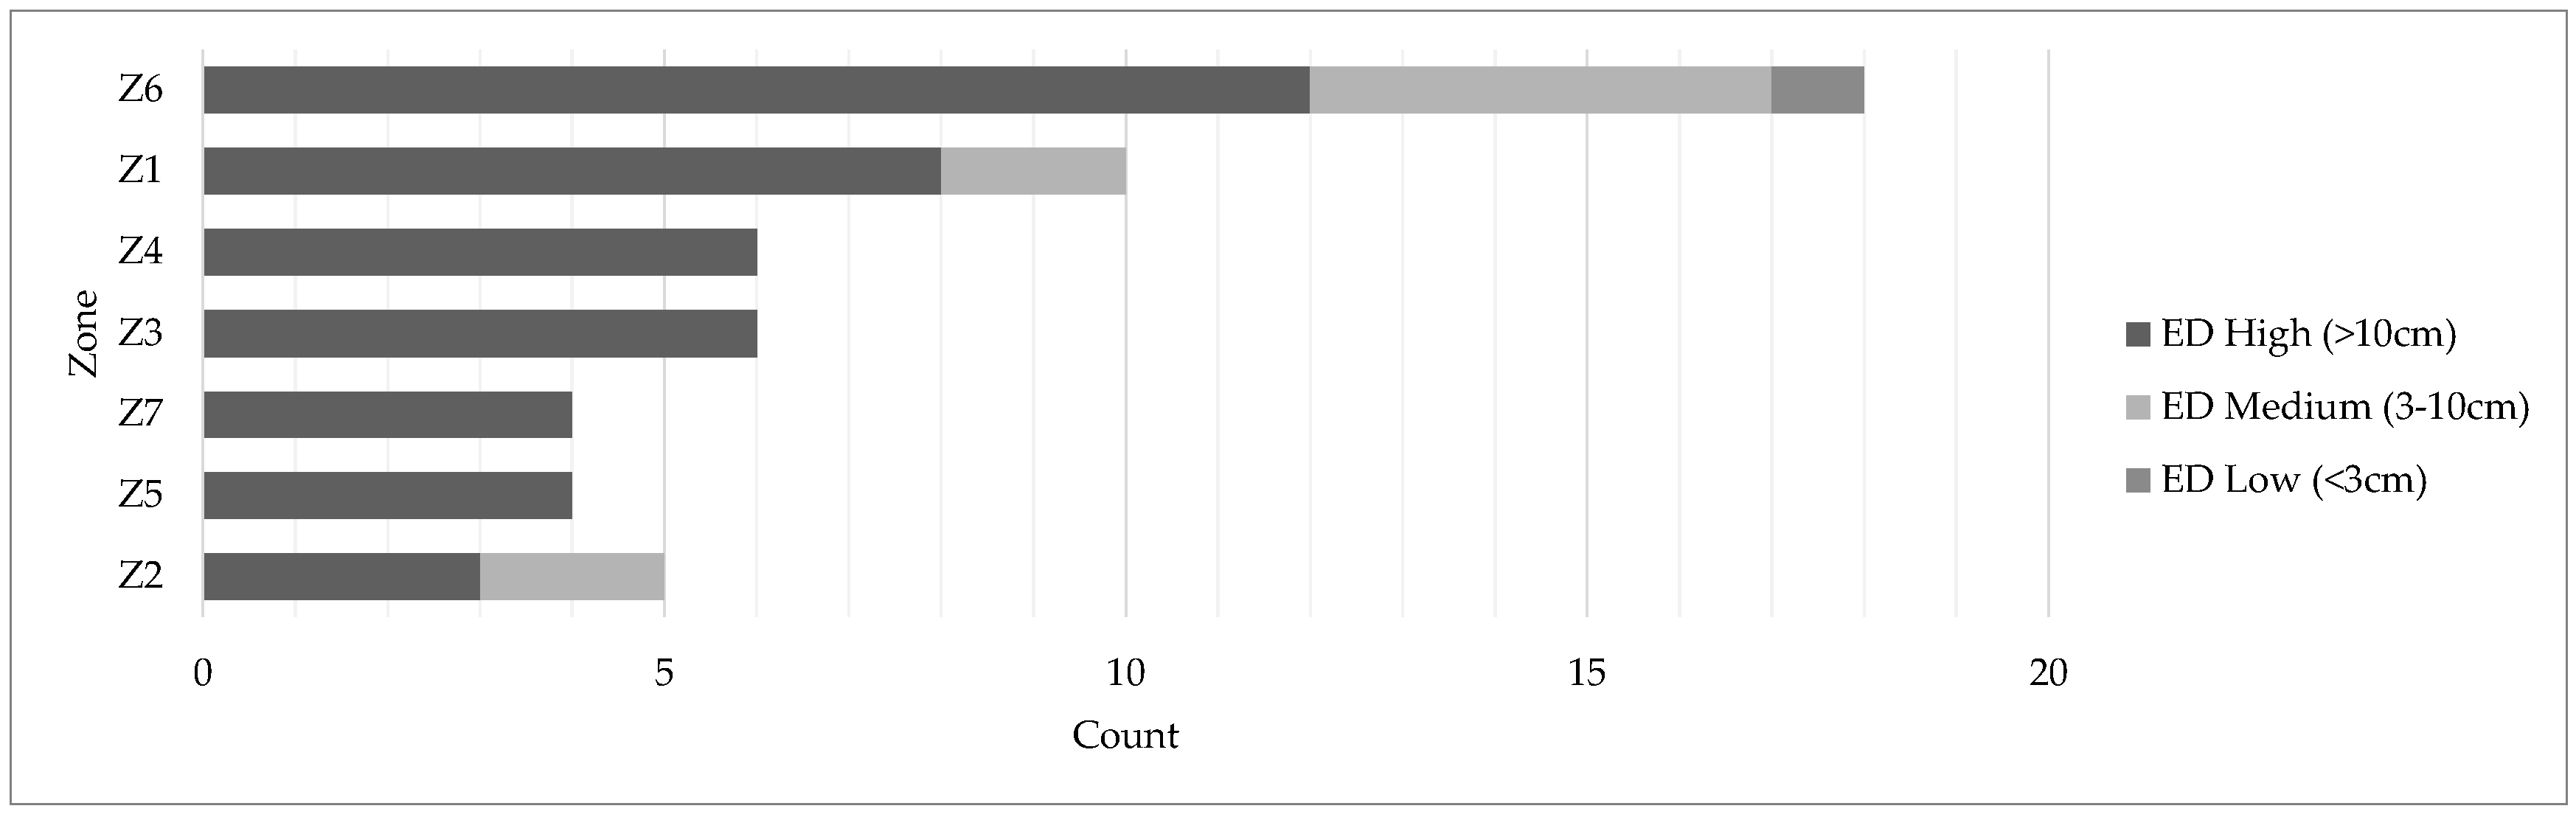
Elevation differences (EDs) are divided into three criteria (Figure 11): ED low (<3 cm), ED medium (3–10 cm), and ED high (>10 cm). The chart shows that high EDs were very predominant at all zones. Medium EDs were found only in two zones (Z1 and Z2), whereas low EDs were found only in Z6. This means that pedestrian comfort is greatly affected by the high number of EDs on the lane. The following figure shows that high EDs (Z6) were more predominant than the other EDs. This is because this path provides access to the buildings, thereby forming significant elevation differences. Thus, a sloping elevation adjustment is required for the pedestrians (Figure 12).
The third unsuitable dominant factor was durability of path material, because many path materials were broken along the way to the campus. Broken materials were divided into two categories: small and big damage (Figure 13). The criterion for big damage was that the damage had huge dimensions (massive), while small damage meant small damage dimensions of not more than 40 cm2. This damage occurred because of poor foundations and broken sidewalk frames. Big damage areas were most common in Z6 (Figure 14a). The pedestrian path in this zone had many areas of big damage because of the access to the building over the pavement. Pavement damage was caused by vehicle traffic. Floor repair work and selection of a stronger pavement are expected to improve conditions for better pavement quality.
Meanwhile, small damages were most common in Z7 (Figure 14b) because of the fragility of the pavement owing to collision of hard objects and natural factors (puddles). In Z5, no damage was found because a lot of spots in that area were not paved (Figure 14c). In addition, paved walkways were mostly in good condition.
4.4. Comparative Analysis per Zone
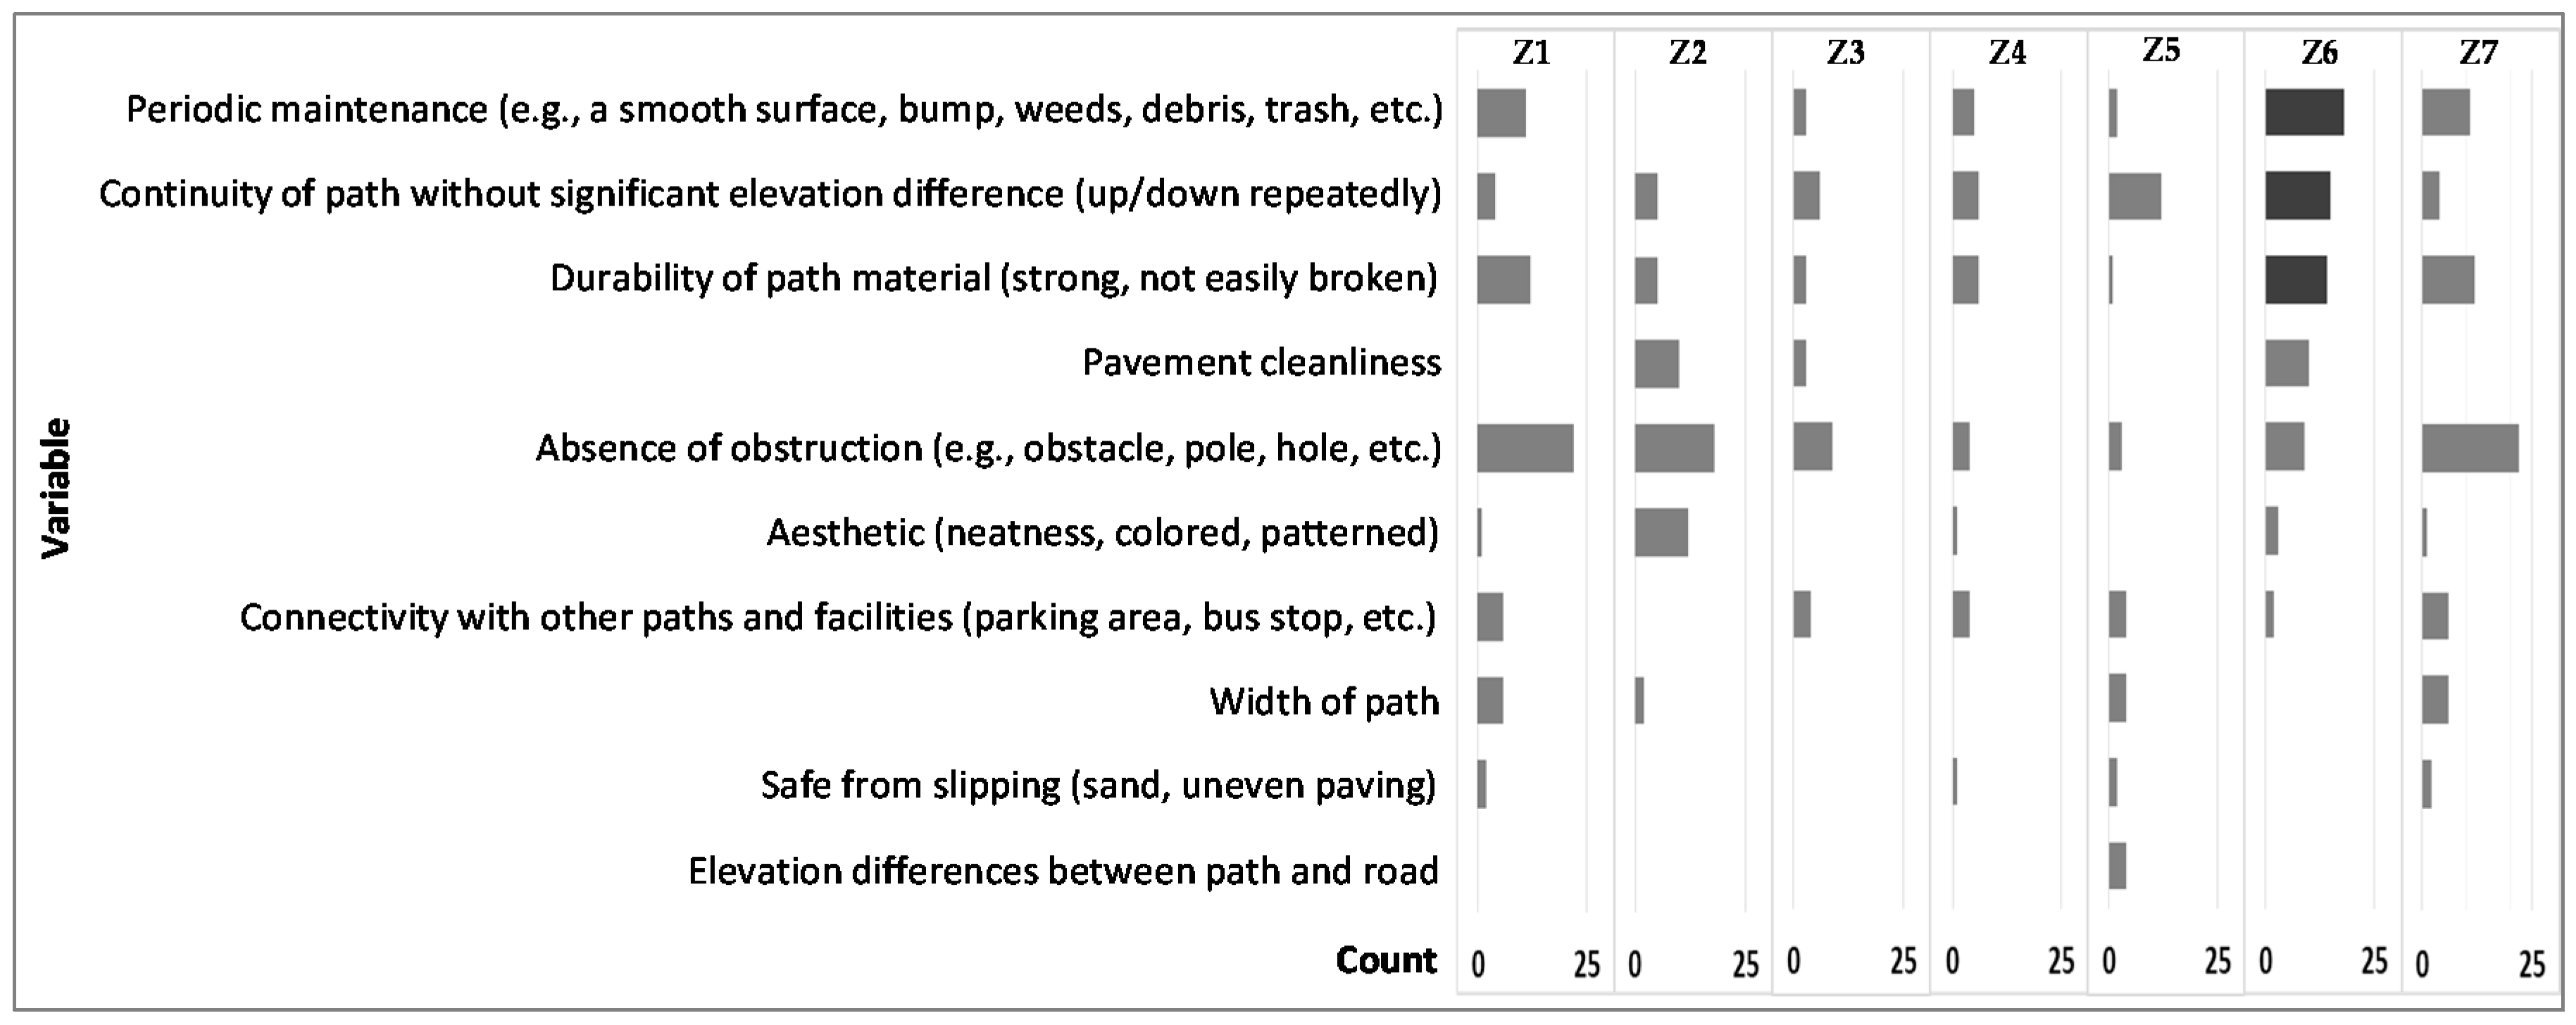
The following distribution analysis describes the condition of each zone using the dominant factors. The most unsuitable dominant factors were mostly in Z6 (Figure 15). This zone had two of the three largest dominant factors: periodic maintenance (smooth surface, bump, and debris), continuity of path without significant elevation differences, and durability of path material. These three unsuitable factors affected the convenience of walking of pedestrians returning through this main entrance.
Another analysis of distribution per zone indicates that the factors present in Z4 were lower (not dominant) than those in other zones, which means that Z4 had a better condition than the other zones. Conditions in Z4 seemed to be wide, clean, flat, a little resistant, and good. Thus, pedestrian activity along this pathway was likely to be comfortable.
Meanwhile, other conditions show that the factors present in Z6 seemed to be higher (dominant) than those in the other zones, which means that Z6 had the worst conditions among the zones. Track conditions in this zone were dirty, riddled with obstacles, and broken, and had many significant elevation differences. Thus, pedestrian activity in this pathway was likely to be uncomfortable compared with that of the other lanes.
Another analysis showed the dominance of certain dimensions in different zones. In the design dimension, Z4 had a design with better conditions compared with that of the other zones. This was indicated by the factors (Design) present in Z4, which were dominant. That is, in the design dimension, Z4 was the best compared with that of the other zones.
In the quality of existing dimensions, the diagram shows that Z5 was not dominant. However, based on the pavement map, Z5 had many paths that were not paved (Figure 14c). Thus, the best quality of the existing dimension cannot be addressed in Z5. Besides Z5, Z4 was a zone whose quality conditions were better than those of the other zones. This is indicated by the factors (Quality) present in Z4, which was not dominant. That is, the quality dimension in Z4 was the best compared with that of the other zones.
Meanwhile, Z4 had the best path among the lanes. The main characteristics of Z4 were accessible to the campus, flat, clean, and wide. That is, the convenience of walking on campus will improve if the other zones have the same conditions as Z4.
4.5. Correlation Analysis between the Dominant Factors and Overall Satisfaction
The above discussion shows that the dominant factors that are the reasons for the dissatisfaction are durability of path material (Quality), absence of obstruction (Quality), continuity of path without significant elevation differences (Design), aesthetics (Design), and availability of shelter (Amenities). Multivariate correlation analysis in Table 5 shows that the five dominant factors have a correlation with overall satisfaction with a significant value of less than 0.05. Two variables have a strong correlation, while the other three variables have a moderate correlation. Continuity of path without significant elevation differences has the strongest correlation with student satisfaction (0.69), which means that this factor needs attention from campus management to make the sidewalk continuous. An alternative solution to this condition is to lower the elevation as well as adding a ramp.
Durability of path material has the second strongest correlation (0.62). Poor durability of path material is probably caused by low quality of material, construction of inappropriate material, obstruction, user, and climate. Selection of better material quality and appropriate construction are a changes that can be made to improve the durability of the material of the path, because these two solutions fall within the authority of campus management.
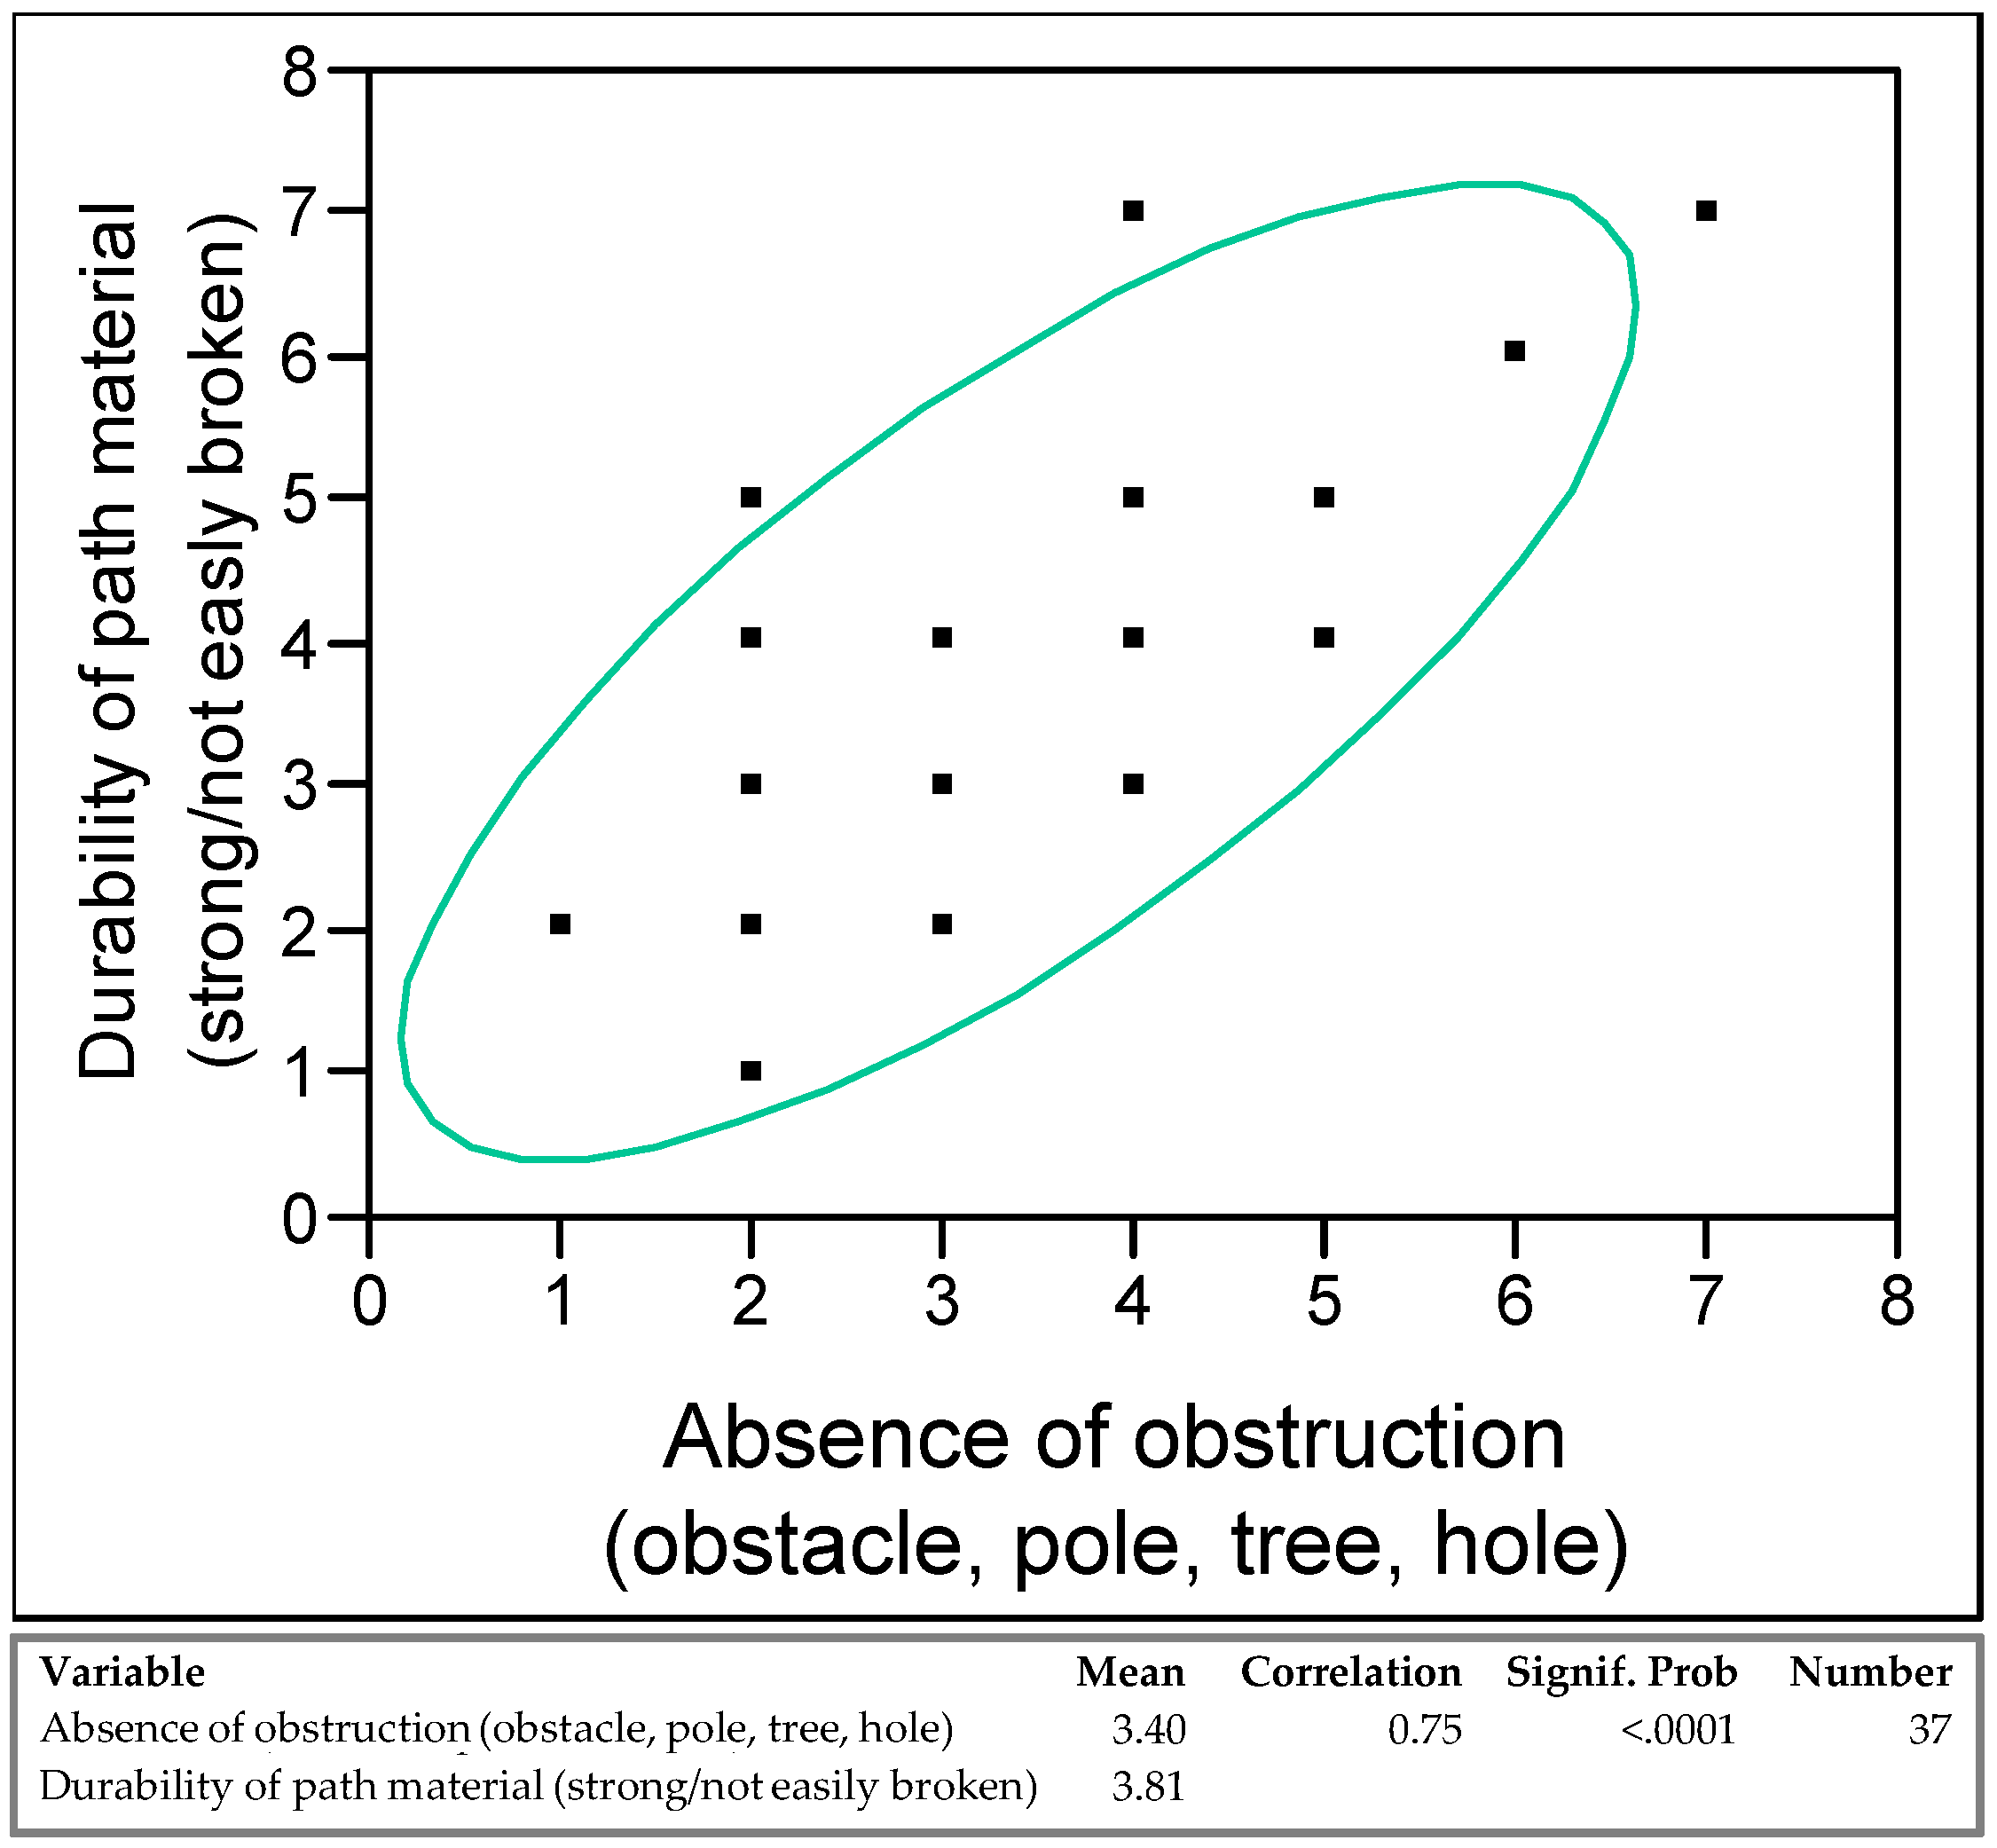
Obstruction is the third leading cause of poor durability, as indicated by the correlation between absence of obstruction and durability of path material. Figure 16 shows the relationship between the two variables with a significant value of less than 0.01 and a correlation value of 0.75 (strong), which means that more obstructions means greater possibility of damage to the material path.
While some factors, such as humans and climate, are difficult for management to control, they can still be addressed by fixing regulations and design to extend the durability of path material. The human factor can be solved through signs, especially those for motorists. Meanwhile, the climate factor can be solved by installing a sloped surface material to avoid the formation of puddles in rainy conditions.
5. Conclusions
This research used a questionnaire method (open) and observation to determine the possibility of finding new keywords for pedestrian paths in a campus context at the University of Lampung. This study examined the five-dimensional evaluation model introduced by quassessment: quality, design, safety, sensory, and amenities. After the examination, the model concluded that the students (68%) expressed their dissatisfaction with the condition of the pedestrian path (pavement) on Soemantri Brodjonegoro Street. The most dominant factors that caused student dissatisfaction were durability of path material (Quality), aesthetics (Design), and continuity of path without significant elevation differences (Design). Two of the three dominant factors involved the quality of the existing dimension. Thus, the quality of the existing dimension influenced respondent satisfaction.
Based on the respondents’ expectations, the dominant factors were durability of path material (Quality), aesthetics (Design), and availability of shelter (Amenities). Durability of path material and aesthetics were consistently identified by the respondents as important to increase their satisfaction. Meanwhile, availability of shelter was the predominant desire of three respondents, who said that they needed shelter on the track whenever the weather was hot or rainy.
At the observation stage, absence of obstruction (Quality), continuity of path without significant elevation differences (Design), and durability of path material (Quality) were the most common factors observed in the path. Durability of path material was also consistently found in responses as regards dissatisfaction, expectation, and observation. That is, this factor can be a major consideration for path improvements. Meanwhile, other dominant factors present in the three stages should also be considered to increase satisfaction with walking on campus. Finally, durability of path material (Quality), absence of obstruction (Quality), continuity of paths without significant elevation differences (Design), aesthetics (Design), and availability of shelter (Amenities) were correlated with overall satisfaction.
The results above are similar to those of research [22] which states that durability is one indicator of pedestrian satisfaction. It was mentioned in the study [26] that discontinuity is a factor that causes pedestrian discomfort. Another study [26] mentions that aesthetics is a positive thing that affects pedestrian comfort. This is in accordance with statements in [7,22], which mention aesthetics as a factor that affects satisfaction.
The conducted study in [18] mentioned that the indicator that affects comfort is availability of roofing. This finding has low compatibility with the result of this study, which is that availability of shelter affects student satisfaction. Other satisfaction factors are influenced by absence of obstruction, because the pedestrian should be given comfort by pathways that are free of obstacles [8].
The evaluation model was formed through literature and perfected by an additional factor observed in the path at the observation stage. This factor must be included as a component dimension of the evaluation model (dimension of design) because this condition is quite common in certain areas, but it has not been discussed yet. The results of this study are only limited to the student population of the department of architecture, University of Lampung.
This study will be followed by another one, which will involve students from all faculties to determine overall satisfaction. Further research aims to determine the level of student satisfaction with the paths, identify differences in the levels of student satisfaction based on their characteristics, and examine the relationships between factors.
Acknowledgments
This study was supported by the Ministry of Research, Technology and Higher Education of Republic of Indonesia (RISTEKDIKTI), The University of Kitakyushu, and Bandar Lampung University. We would like to acknowledge Muhammad Shubhiyuda Wibawa and Panji Kurniawan, Lecturer of Architecture Program, University of Lampung, and also the architecture students, University of Lampung, who participated in this study.
Author Contributions
This paper was conceived and written jointly by the authors. Haris Murwadi contributed to the design method and collected and analyzed the data and Bart Dewancker supervised the process of the research.
Conflicts of Interest
The authors declare no conflict of interest.
References
- Norzalwi, N.; Amiruddin, I. Public Approach towards Sustainable Transportation in UKM’s Campus. Aust. J. Basic Appl. Sci. 2011, 5, 1332–1337. [Google Scholar]
- Nuzir, F.A.; Dewancker, B.J. Redefining place for walking: A literature review and key-elements conception. Theor. Empir. Res. Urban Manag. 2016, 11, 59–76. [Google Scholar]
- Asadi-Shekari, Z.; Moeinaddini, M.; Zaly Shah, M. A pedestrian level of service method for evaluating and promoting walking facilities on campus streets. Land Use Policy 2014, 38, 175–193. [Google Scholar] [CrossRef]
- Tuydes-Yaman, H.; Altintasi, O.; Karatas, P. Evaluating Pedestrian Level of Service at Middle East Technical University ( METU ) Campus. In Proceedings of the Conference: ACE2014 (11th International Conference on Advances in Computer Entertainment Technology), Funchal, Portugal, 11–14 November 2014; pp. 1–6. [Google Scholar]
- Turk, Y.A.; Sen, B.; Ozyavuz, A. Students Exploration on Campus Legibility. Procedia Soc. Behav. Sci. 2015, 197, 339–347. [Google Scholar] [CrossRef]
- Luis, A.P.B.; Martínez, M. Understanding the Factors that Influence Pedestrian Environment Quality. Transp. Res. Board Ann. Meet. 2014, 490, 16. [Google Scholar]
- Rahimiashtiani, Z.; Ujang, N. Pedestrian Satisfaction with Aesthetic, Attractiveness and Pleasurability: Evaluating the Walkability of Chaharaghabbasi Street in Isfahan, Iran. Alam Cipta 2013, 6, 13–22. [Google Scholar]
- Iamtrakul, P.; Zhang, J. Measuring pedestrians’ satisfaction of urban environment under transit oriented development (TOD): A case study of Bangkok Metropolitan, Thailand. Lowl. Technol. Int. 2014, 16, 125–134. [Google Scholar] [CrossRef]
- Zainol, R.; Ahmad, F.; Nordin, N.A.; Aripin, A.W. Evaluation of users’ satisfaction on pedestrian facilities using pair-wise comparison approach. IOP Conf. Ser. Earth Environ. Sci. 2014, 12175, 1–6. [Google Scholar] [CrossRef]
- Kim, S.; Park, S.; Lee, J.S. Meso- or micro-scale? Environmental factors influencing pedestrian satisfaction. Trans. Res. Part D Trans. Environ. 2014, 30, 10–20. [Google Scholar] [CrossRef]
- Zakaria, J.; Ujang, N. Comfort of Walking in the City Center of Kuala Lumpur. Procedia Soc. Behav. Sci. 2015, 170, 642–652. [Google Scholar] [CrossRef]
- Sotoude, H.; Ziari, K.; Gharakhlo, M. Evaluation of Satisfaction of Pedestrian Safety to Vehicles in Urban Environment, Case Study: Old Context of Marvdasht City. Curr. World Environ. 2015, 10, 268–275. [Google Scholar] [CrossRef]
- Pratiwi, A.R.; Zhao, S.; Mi, X. Quantifying the relationship between visitor satisfaction and perceived accessibility to pedestrian spaces on festival days. Front. Archit. Res. 2015, 4, 285–295. [Google Scholar] [CrossRef]
- Arshad, A.K.; Bahari, N.I.; Hashim, W.; Halim, A.G.A. Gender Differences in Pedestrian Perception and Satisfaction on the Walkability of Kuala Lumpur City Center. In Proceedings of the 3rd International Conference on Civil and Environmental Engineering for Sustainability (IConCEES 2015), Melaka, Malaysia, 1–2 December 2015; Volume 47, pp. 1–4. [Google Scholar]
- Moura, F.; Paulo, C.; Gonçalves, A. IAAPE—Pedestrian Accessibility and Attractiveness Assessment Tool when planning for Walkability. 7th Annual Conference, CITTA (Centro de Investigação do Território, Transportes e Ambiente, abbreviation in portuguese), (Research Center for Territory, Transport and Environment). 2014, pp. 1–18. Available online: https://pdfs.semanticscholar.org/4c13/800009829143e19844c1ea039c820b0a0dce.pdf (accessed on 23 November 2017).
- Nuzir, F.A.; Dewancker, B. Re-Finding PL.AC.E. for Walking: Assessment of Key-Elements Using Questionnaire. Curr. Urban Stud. 2015, 3, 267–285. [Google Scholar] [CrossRef]
- Ranasinghe, G.; Amarawickrama, S.; Rathnayake, R.; Randeniya, T.; Rathnasiri, S. A Model for Assessing the Level of Walkability in Urban Neighborhoods in Sri Lanka. Int. J. Built Environ. Sustain. 2015, 2, 292–300. [Google Scholar] [CrossRef]
- Erna, W.; Surjono, A.; Amin, S.L. Convenience Component of Walkability in Malang City Case Study the Street Corridors around City Squares. Procedia Soc. Behav. Sci. 2016, 227, 587–592. [Google Scholar] [CrossRef]
- Kang, L.; Xiong, Y.; Mannering, F.L. Statistical analysis of pedestrian perceptions of sidewalk level of service in the presence of bicycles. Trans. Res. Part A 2013, 53, 10–21. [Google Scholar] [CrossRef]
- Kadali, B.R.; Vedagiri, P. Evaluation of pedestrian crosswalk level of service (LOS) in perspective of type of land-use. Transp. Res. Part A Policy Pract. 2015, 73, 113–124. [Google Scholar] [CrossRef]
- Zhou, J.; Guo, Y.; Dong, S.; Zhao, L.; Yang, R. Structural Equation Modeling for Pedestrians’ Perception in Integrated Transport Hubs. Procedia Eng. 2016, 137, 817–826. [Google Scholar] [CrossRef]
- Lefrandt, L.; Sulistio, H.; Wicaksono, A. Model Movement Pedestrian Satisfaction in Manado Using Structural Equation Modeling. J. Appl. Environ. Biol. Sci. 2016, 6, 31–37. [Google Scholar]
- Moura, F.; Cambra, P.; Gonçalves, A.B. Measuring walkability for distinct pedestrian groups with a participatory assessment method: A case study in Lisbon. Landsc. Urban Plan. 2017, 157, 282–296. [Google Scholar] [CrossRef]
- Abdul, N.G.; Shimizu, T.; Mokhtar, S. Assessment of Pedestrian Facilities in Malacca World Heritage Site, Malaysia using P-Index Method. J. East. Asia Soc. Transp. Stud. 2015, 11, 1535–1554. [Google Scholar]
- Asadi-Shekari, Z.; Moeinaddini, M.; Zaly Shah, M. Pedestrian safety index for evaluating street facilities in urban areas. Saf. Sci. 2015, 74, 1–14. [Google Scholar] [CrossRef]
- Martokusumo, W.; Kusuma, H.E.; Octaviana, S. Evaluation of Walkability on Pedestrian Sidewalk in Bandung. In Proceedings of the Second Planocosmo Conference, Bandung, Indonesia, 21–22 October 2013; pp. 1–11. [Google Scholar]
- Ferrer, S.; Ruiz, T.; Mars, L. A qualitative study on the role of the built environment for short walking trips. Transp. Res. Part F Traffic Psychol. Behav. 2015, 33, 141–160. [Google Scholar] [CrossRef]
- Mateo-Babiano, I. Pedestrian’s needs matters: Examining Manila’s walking environment. Trans. Policy 2016, 45, 107–115. [Google Scholar] [CrossRef]
- Florez, J.; Muniz, J. Pedestrian quality of service : Lessons from Maracanã Stadium. Procedia Soc. Behav. Sci. 2014, 160, 130–139. [Google Scholar] [CrossRef]
- Creswell, J.W. Research Design: Qualitative, Quantitative, and Mixed Methods Approached; SAGE Publication: Thousand Oaks, CA, USA, 2003. [Google Scholar]
Figure 1.
Previous research papers about pedestrian walkways.

Figure 2.
Research location map (zone division).

Figure 3.
Method flow chart. SFGD = small focus group discussion.

Figure 4.
Distribution of student satisfaction.

Figure 5.
Distribution analysis of student dissatisfaction.
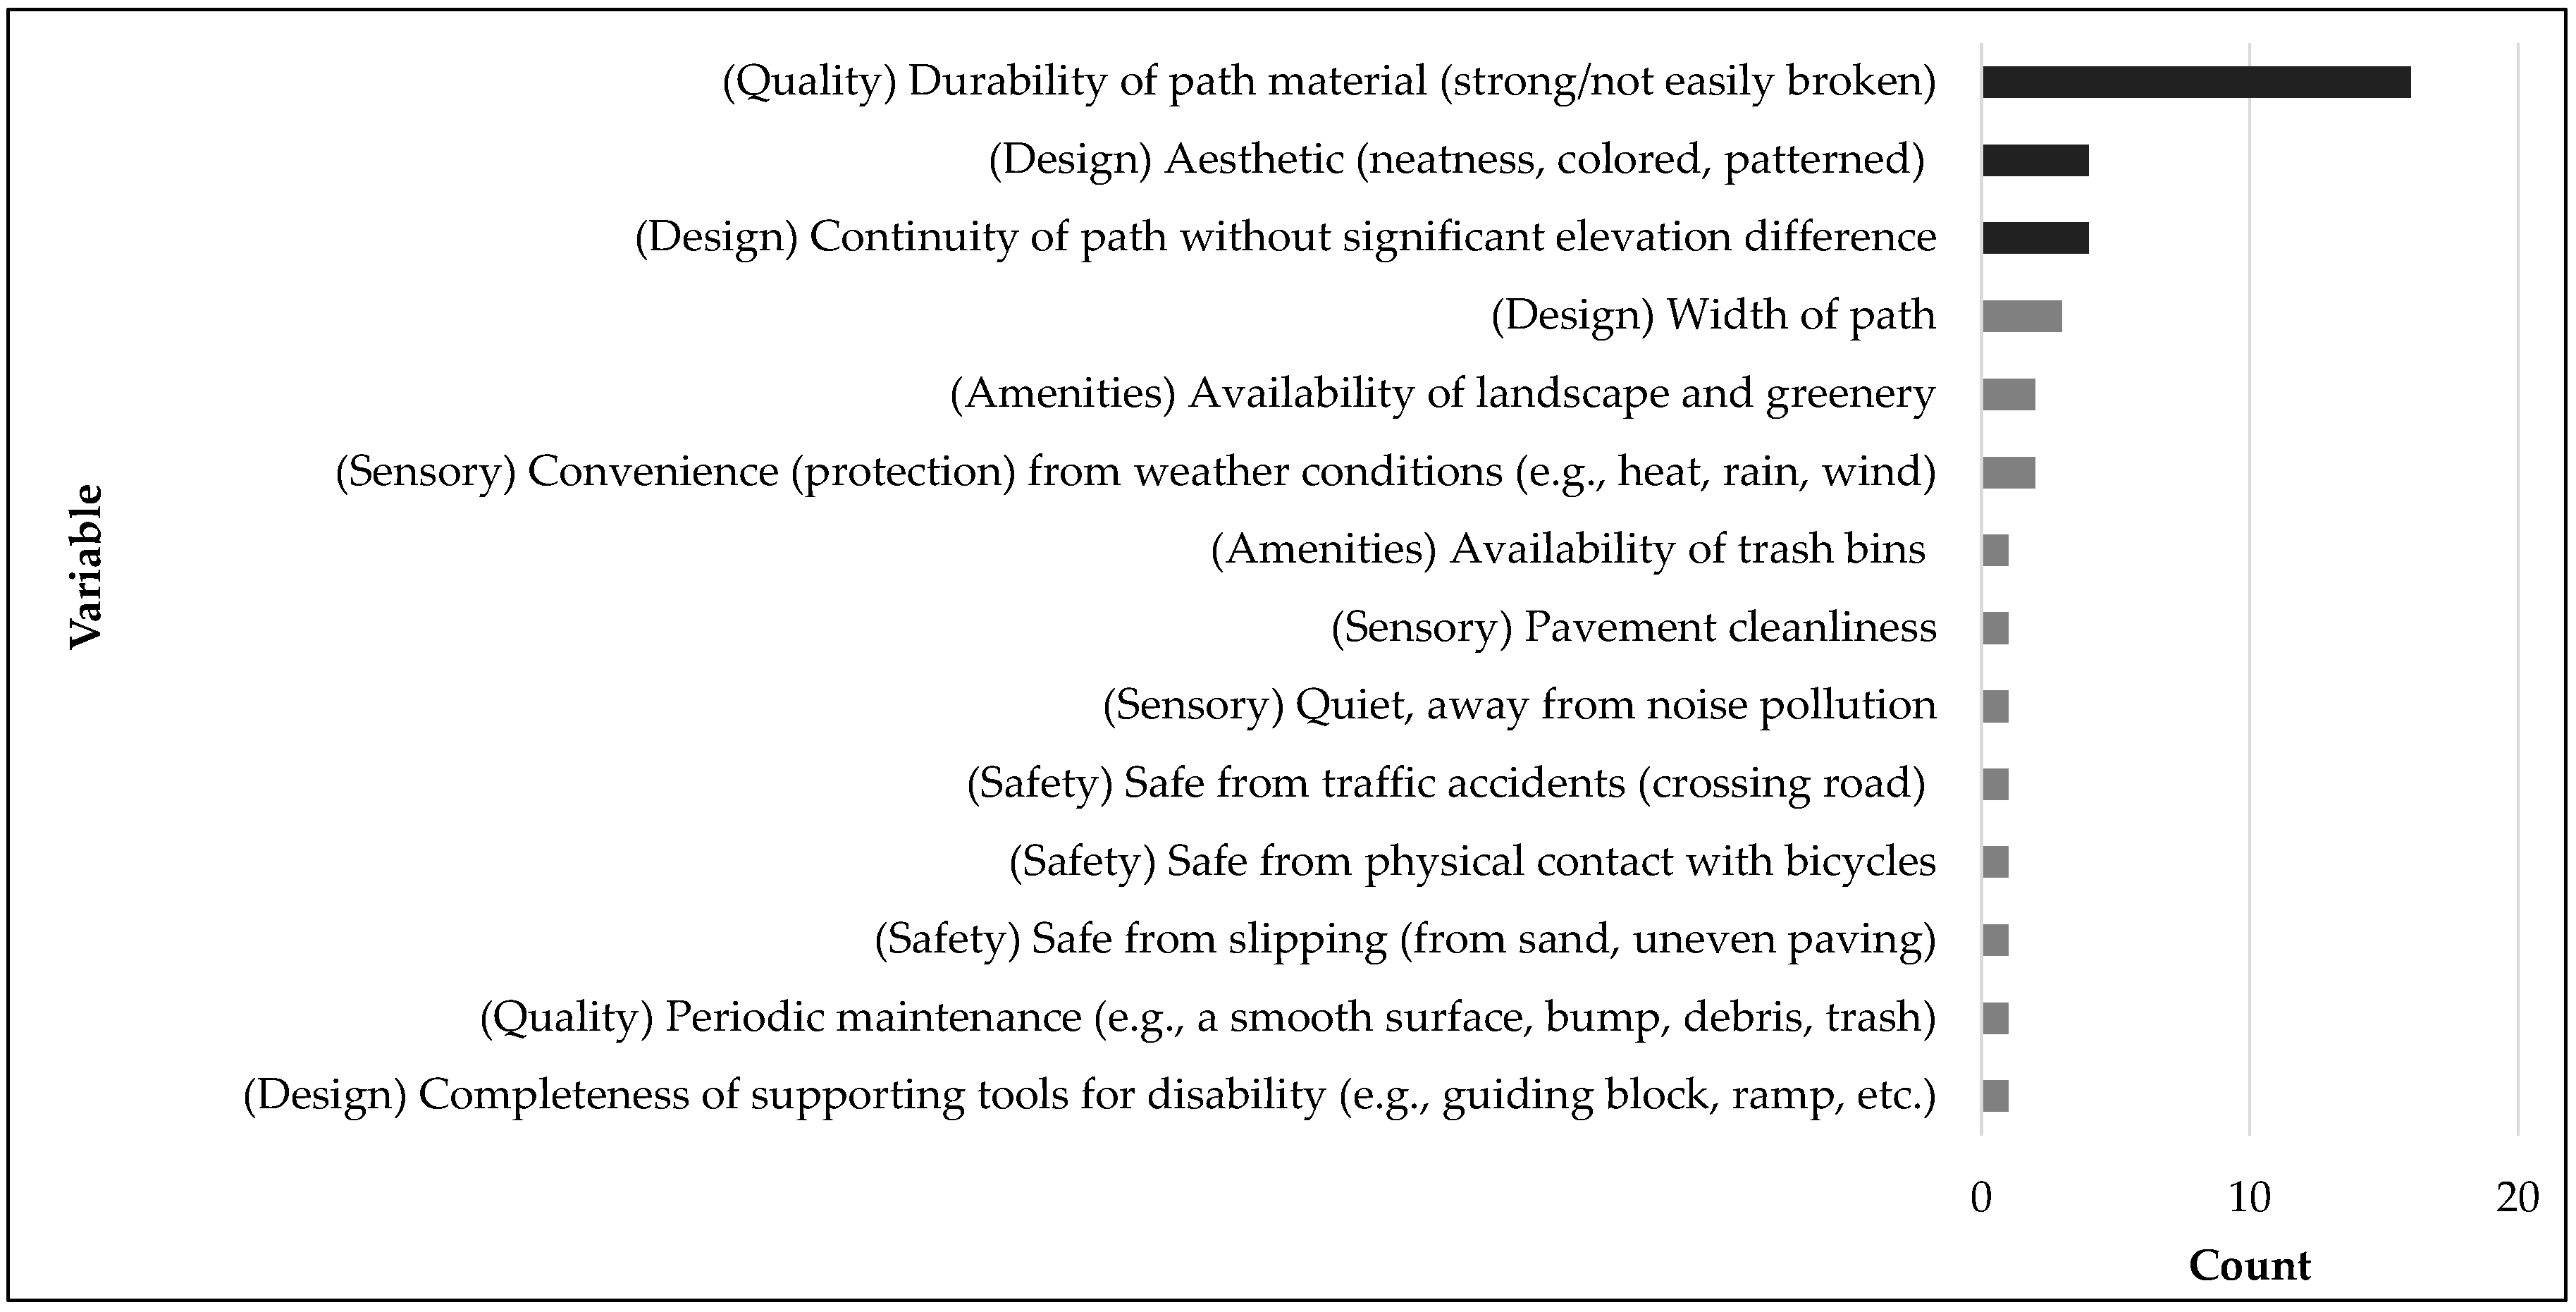
Figure 6.
Dominant factors of pedestrian dissatisfaction: (a) durability of path material; (b) aesthetics, (c) continuity of path without significant elevation differences.
Figure 6.
Dominant factors of pedestrian dissatisfaction: (a) durability of path material; (b) aesthetics, (c) continuity of path without significant elevation differences.
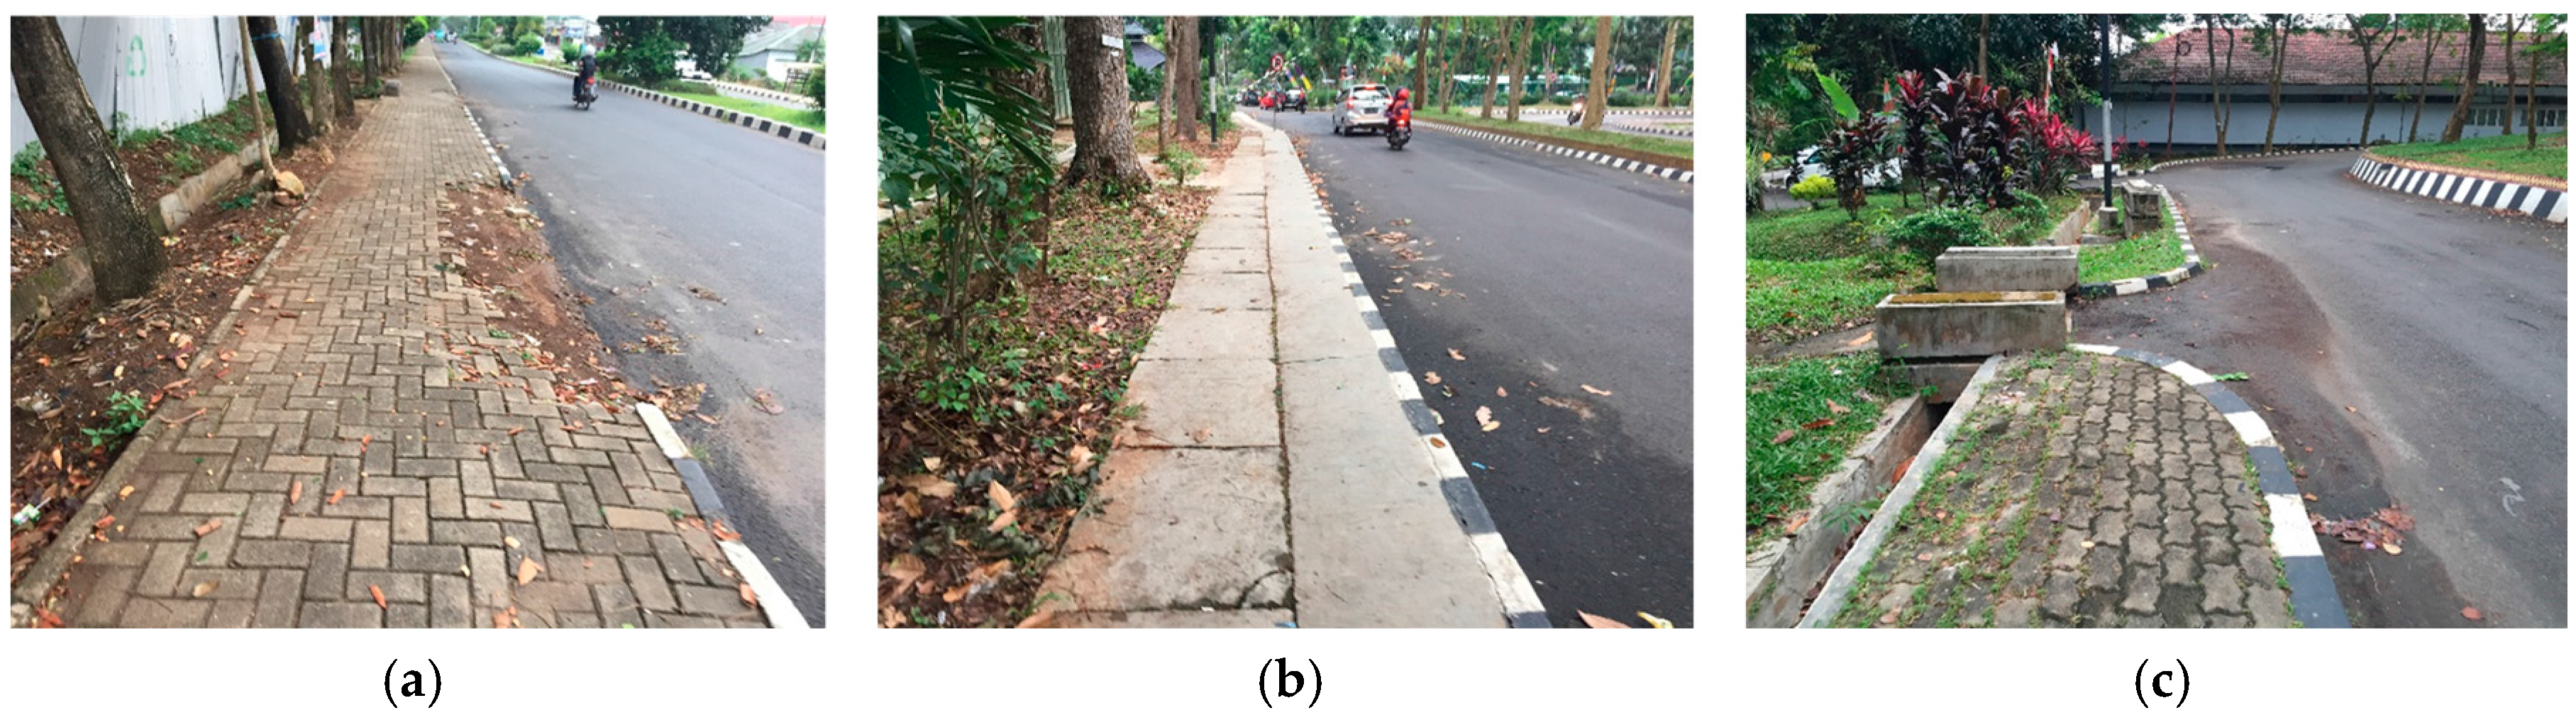
Figure 7.
Distribution analysis of student expectations.

Figure 8.
Distribution analysis of observation.

Figure 9.
Obstruction conditions: (a) permanent obstruction and (b) impermanent obstruction.
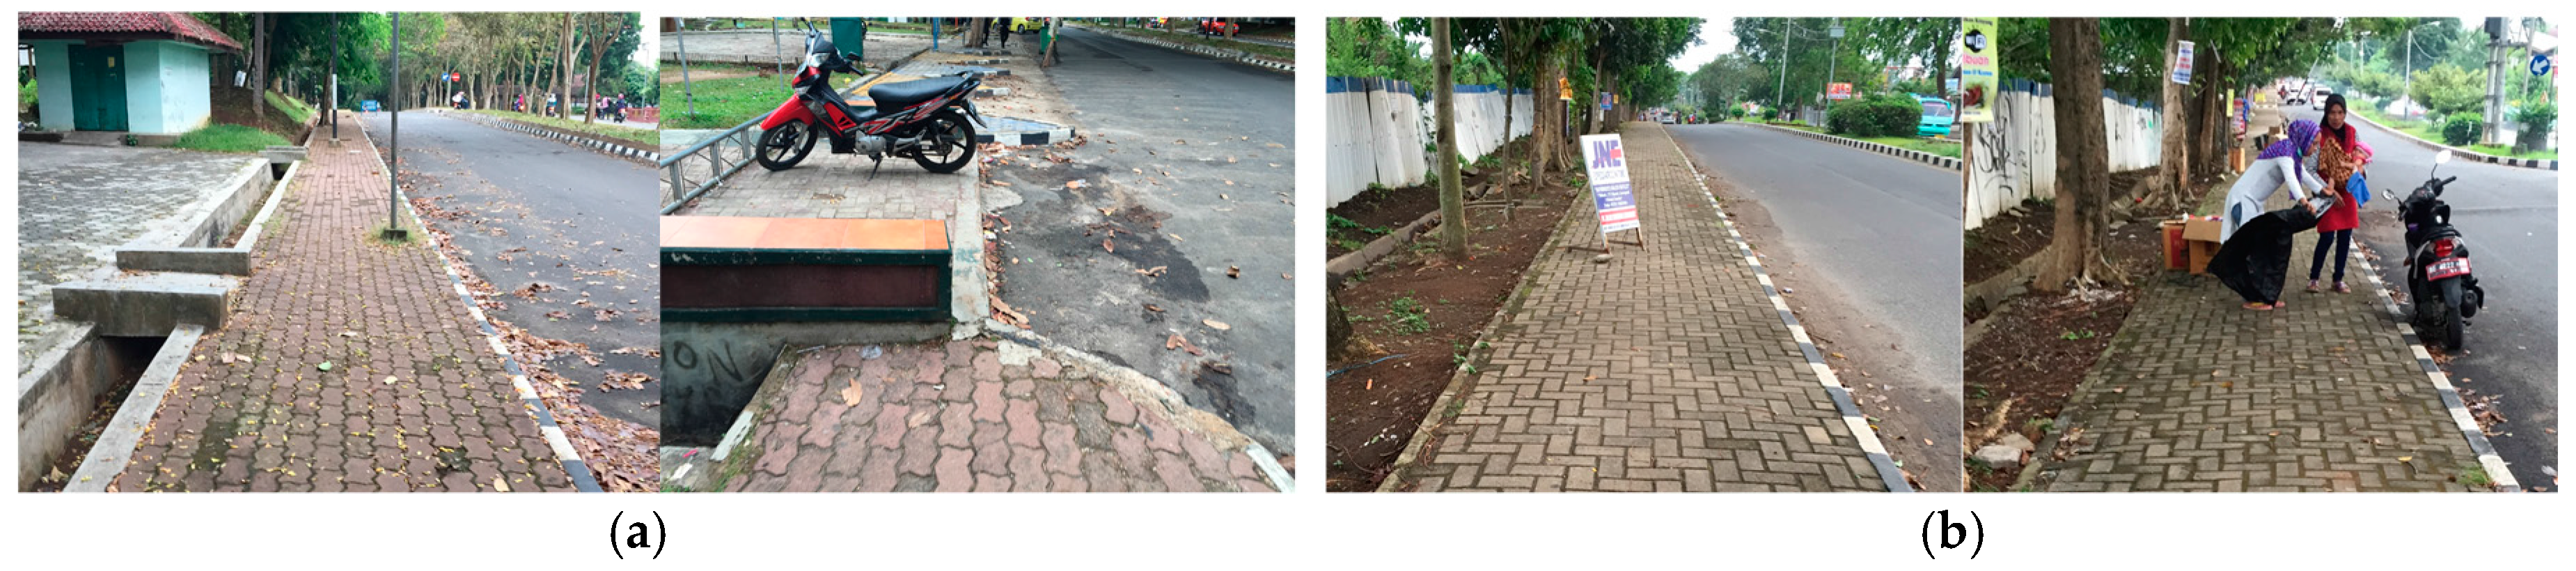
Figure 10.
Distribution of obstructions.
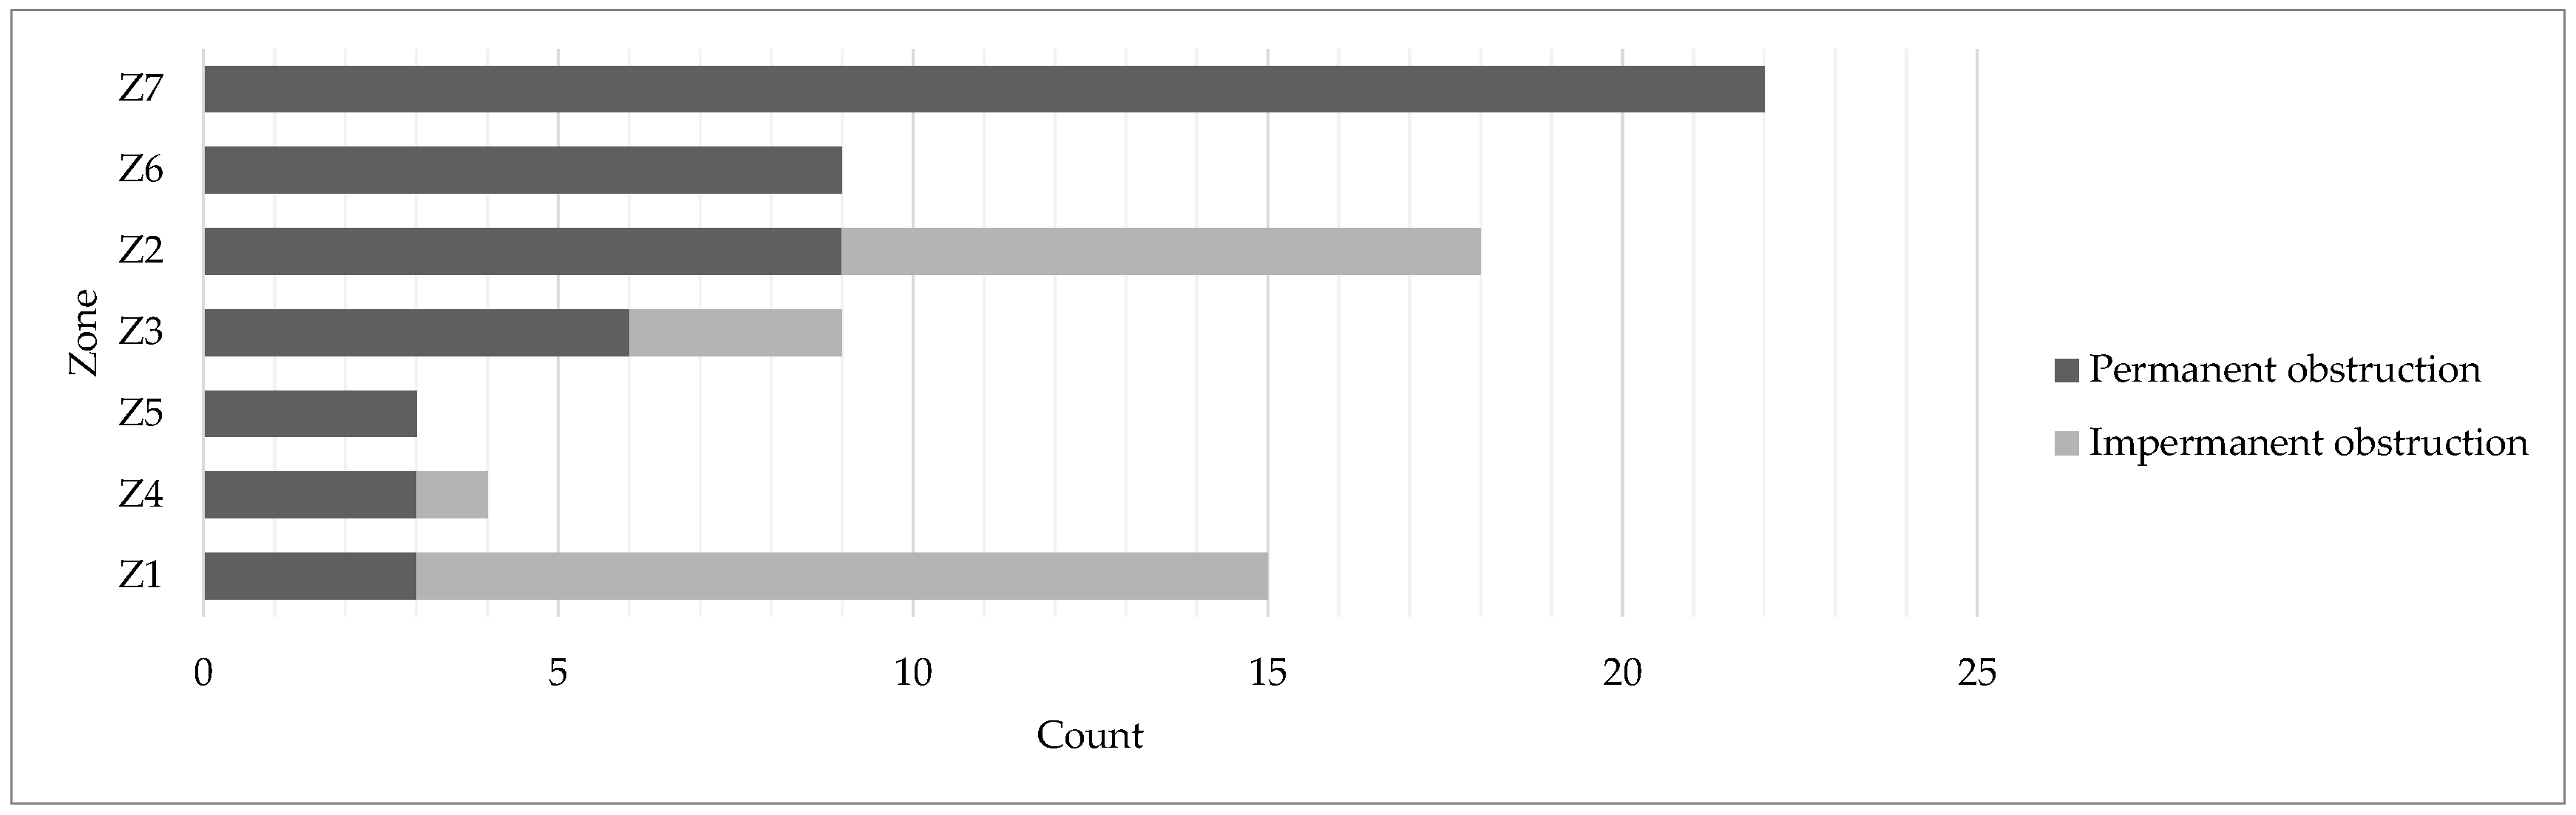
Figure 11.
Distribution of continuity of path without significant elevation differences.

Figure 12.
Elevation adjustment.

Figure 13.
Distribution of broken materials.
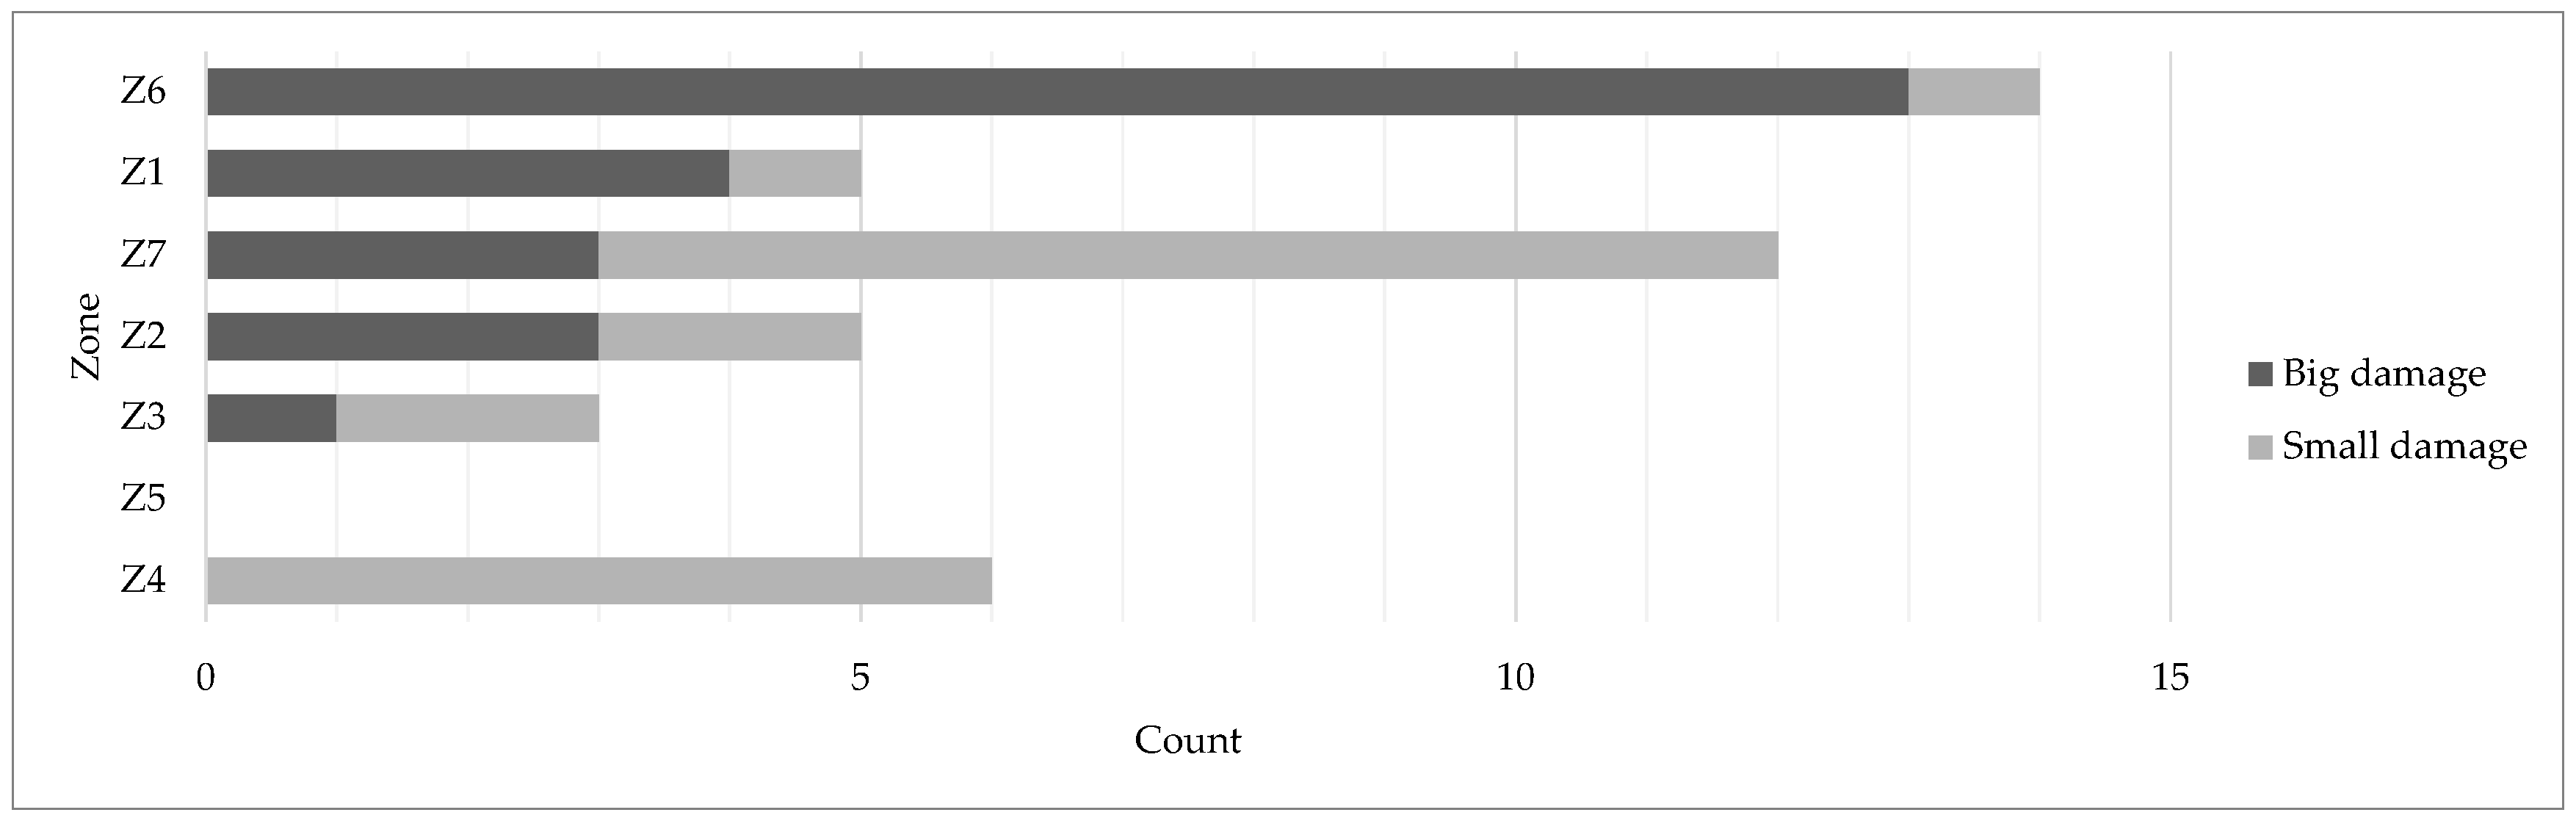
Figure 14.
Pavement condition: (a) big damage (Z6); (b) small damage (Z7); (c) no pavement (Z5).
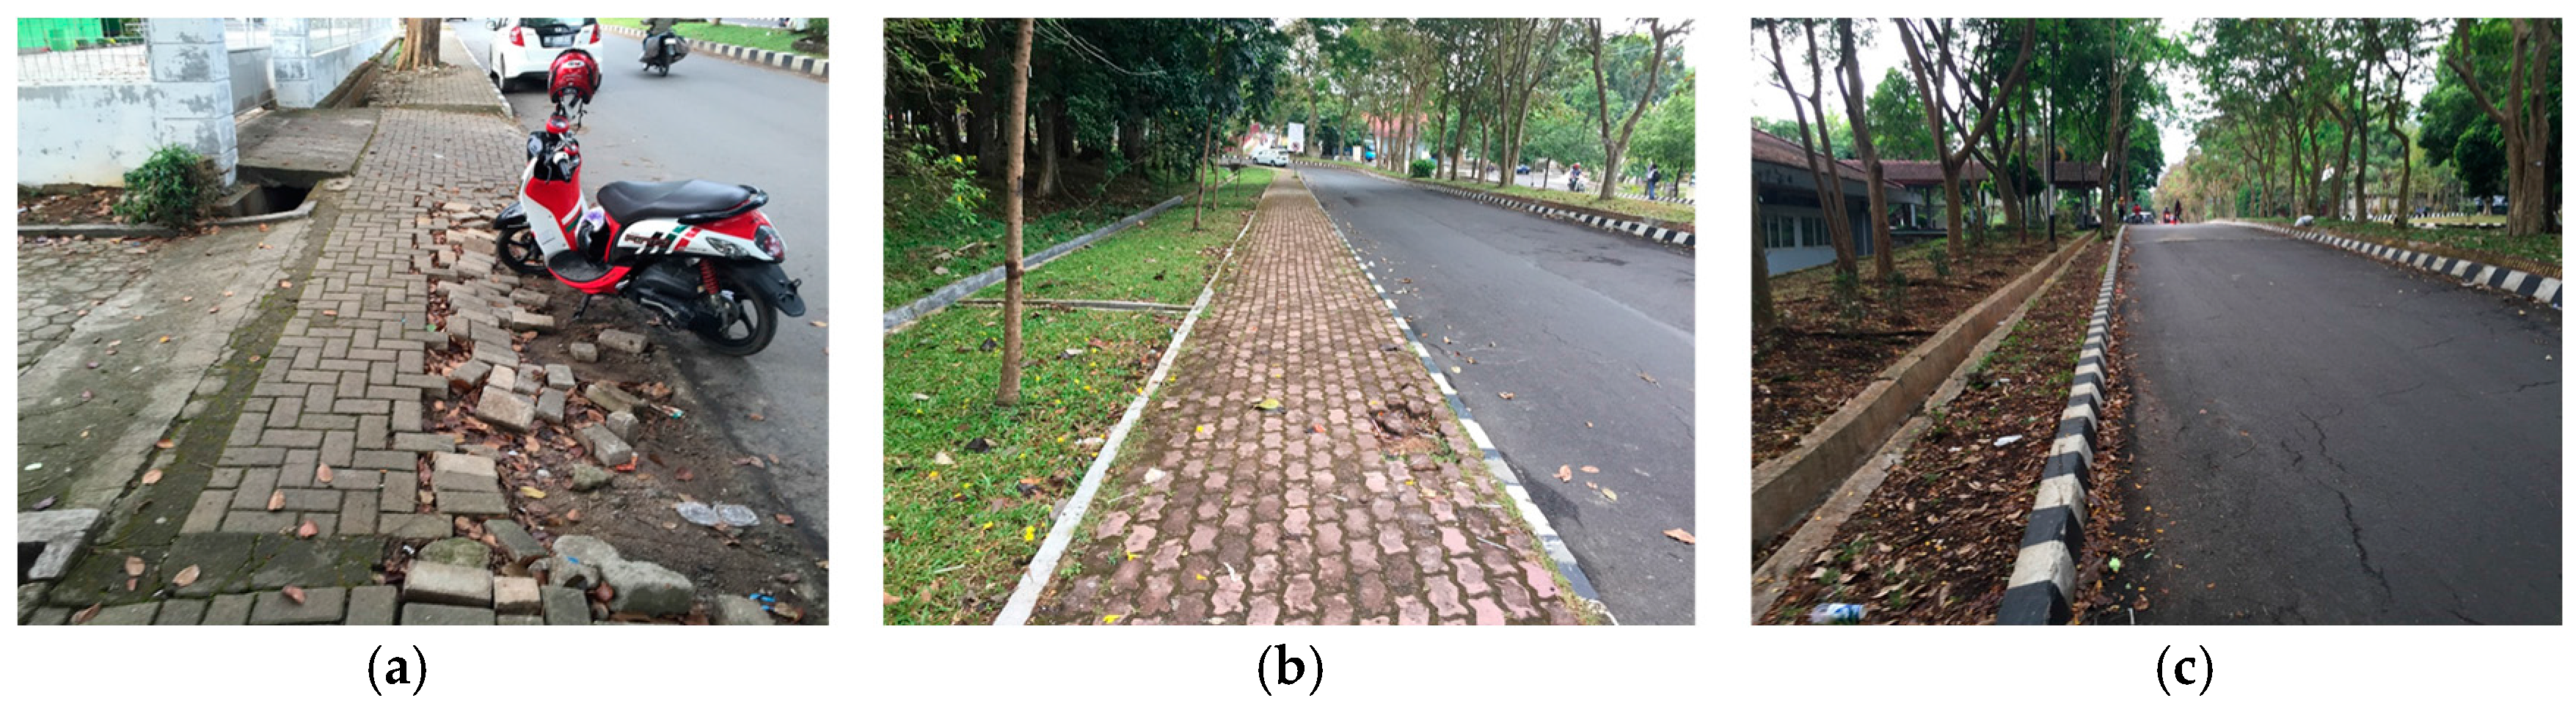
Figure 15.
Distribution of factors per zone.

Figure 16.
Correlation between durability of path material (strong/not easily broken) and absence of obstruction (obstacle, pole, tree, hole).
Figure 16.
Correlation between durability of path material (strong/not easily broken) and absence of obstruction (obstacle, pole, tree, hole).

Table 1.
Techniques previously used for evaluation of pedestrian walkways.
| Techniques for Evaluation | Author |
|---|---|
| Satisfaction Evaluation | [6,7,8,9,10,11,12,13,14] |
| Assessment Evaluation | [15,16,17,18] |
| Pedestrian Level of Service | [3,4,19,20] |
| Measurement Evaluation | [21,22,23] |
| Pedestrian Index | [24,25] |
| Focus Group | [26,27] |
| Examining Evaluation | [28] |
Table 2.
Content analysis of literature.
| No | Variable/Factor | Author 1 * | Author 2 * | Author 3 * | Author 4 * | Author 5 * | Author 6 * | Author 7 * | Author 8 * | Author 9 * | Author 10 * | Author 11 * | Author 12 * | Author 13 * | Author 14 * | Author 15 * | Author 16 * | Author 17 * | Author 18 * | Author 19 * | Author 20 * | Author 21 * | Author 22 * | Author 23 * | Author 24 * | Author 25 * | Author 26 * |
|---|---|---|---|---|---|---|---|---|---|---|---|---|---|---|---|---|---|---|---|---|---|---|---|---|---|---|---|
| 1 | Absence of obstruction (e.g., obstacle, pole, hole, etc.) | 1 | 0 | 1 | 0 | 0 | 1 | 1 | 0 | 1 | 0 | 0 | 1 | 0 | 1 | 1 | 0 | 1 | 1 | 0 | 0 | 0 | 0 | 0 | 0 | 0 | 0 |
| 2 | Absence of unpleasant smell (e.g., garbage, rotten, etc.) | 0 | 0 | 0 | 0 | 0 | 0 | 0 | 0 | 0 | 0 | 0 | 0 | 0 | 1 | 0 | 0 | 0 | 0 | 0 | 0 | 0 | 1 | 0 | 0 | 0 | 0 |
| 3 | Adequacy of light at night | 0 | 0 | 1 | 0 | 0 | 0 | 0 | 0 | 0 | 0 | 1 | 1 | 1 | 0 | 1 | 1 | 0 | 0 | 1 | 1 | 0 | 0 | 0 | 0 | 1 | 0 |
| 4 | Aesthetic (neatness, colored, patterned) | 1 | 0 | 0 | 1 | 1 | 0 | 0 | 1 | 0 | 1 | 0 | 0 | 1 | 1 | 0 | 0 | 0 | 1 | 0 | 1 | 1 | 0 | 0 | 1 | 0 | 1 |
| 5 | Air cleanliness (from dust, smoke, etc.) | 0 | 0 | 0 | 0 | 0 | 1 | 0 | 0 | 0 | 1 | 1 | 0 | 0 | 0 | 0 | 0 | 0 | 1 | 0 | 1 | 0 | 0 | 1 | 0 | 0 | 0 |
| 6 | Availability of benches (seats around the sidewalk) | 0 | 0 | 0 | 0 | 0 | 0 | 0 | 0 | 0 | 0 | 1 | 0 | 0 | 1 | 0 | 0 | 1 | 1 | 0 | 0 | 0 | 1 | 0 | 0 | 0 | 0 |
| 7 | Availability of bus stops (public transport) | 0 | 0 | 1 | 0 | 0 | 0 | 0 | 0 | 0 | 1 | 0 | 0 | 0 | 1 | 0 | 0 | 0 | 0 | 0 | 0 | 0 | 0 | 0 | 0 | 1 | 1 |
| 8 | Availability of hydrants | 0 | 0 | 0 | 0 | 0 | 0 | 0 | 0 | 0 | 0 | 1 | 0 | 0 | 0 | 0 | 0 | 0 | 0 | 0 | 0 | 0 | 0 | 0 | 0 | 0 | 0 |
| 9 | Availability of landscape and greenery | 0 | 1 | 0 | 1 | 0 | 1 | 0 | 0 | 0 | 0 | 1 | 0 | 0 | 1 | 1 | 1 | 1 | 0 | 0 | 0 | 1 | 0 | 0 | 0 | 0 | 0 |
| 10 | Availability of parking lots | 1 | 0 | 0 | 0 | 0 | 0 | 0 | 0 | 1 | 0 | 0 | 1 | 0 | 1 | 1 | 1 | 0 | 1 | 0 | 1 | 0 | 1 | 0 | 0 | 0 | 0 |
| 11 | Availability of shade trees | 0 | 0 | 0 | 1 | 0 | 0 | 0 | 1 | 0 | 1 | 0 | 0 | 0 | 1 | 0 | 0 | 1 | 0 | 0 | 1 | 0 | 1 | 0 | 1 | 0 | 0 |
| 12 | Availability of shelter (gazebo) | 0 | 0 | 0 | 0 | 0 | 0 | 0 | 0 | 0 | 0 | 0 | 1 | 0 | 0 | 0 | 0 | 0 | 0 | 0 | 0 | 0 | 0 | 0 | 0 | 0 | 0 |
| 13 | Availability of signage (traffic sign, map) | 0 | 0 | 0 | 0 | 0 | 0 | 0 | 0 | 0 | 1 | 1 | 1 | 1 | 1 | 0 | 1 | 1 | 1 | 0 | 1 | 0 | 0 | 0 | 0 | 1 | 1 |
| 14 | Availability of street lighting and sidewalks (lamp) | 0 | 1 | 0 | 0 | 0 | 1 | 1 | 0 | 0 | 1 | 0 | 0 | 0 | 1 | 1 | 0 | 0 | 1 | 0 | 1 | 0 | 1 | 0 | 1 | 0 | 0 |
| 15 | Availability of trash bins | 0 | 0 | 0 | 0 | 0 | 0 | 0 | 0 | 0 | 1 | 1 | 0 | 0 | 0 | 1 | 0 | 1 | 0 | 0 | 0 | 0 | 1 | 0 | 0 | 0 | 0 |
| 16 | Availability of zebra cross (street crossing/crosswalk) | 1 | 0 | 1 | 0 | 0 | 0 | 1 | 1 | 0 | 0 | 1 | 1 | 1 | 1 | 1 | 1 | 1 | 1 | 1 | 1 | 0 | 0 | 0 | 1 | 0 | 1 |
| 17 | Completeness of supporting tools for disability (e.g., guiding block, ramp, etc.) | 0 | 0 | 1 | 0 | 0 | 0 | 0 | 0 | 0 | 1 | 1 | 1 | 1 | 0 | 0 | 1 | 1 | 1 | 1 | 1 | 0 | 1 | 0 | 0 | 1 | 1 |
| 18 | Connectivity with other path and facilities (parking area, bus stop, etc.) | 0 | 0 | 1 | 0 | 0 | 1 | 0 | 0 | 1 | 0 | 0 | 1 | 0 | 1 | 0 | 0 | 1 | 1 | 1 | 1 | 1 | 0 | 0 | 0 | 0 | 1 |
| 19 | Continuity of path without significant elevation difference | 0 | 1 | 0 | 0 | 0 | 1 | 1 | 0 | 0 | 0 | 1 | 1 | 1 | 0 | 0 | 0 | 1 | 0 | 1 | 1 | 0 | 0 | 0 | 0 | 1 | 1 |
| 20 | Convenience (protection) from weather conditions (e.g., heat, rain, wind) | 0 | 0 | 1 | 0 | 0 | 0 | 0 | 0 | 0 | 0 | 0 | 0 | 0 | 0 | 0 | 0 | 1 | 0 | 0 | 0 | 1 | 1 | 0 | 0 | 0 | 0 |
| 21 | Durability of path material (strong, not easily broken) | 0 | 1 | 0 | 0 | 0 | 0 | 0 | 0 | 0 | 0 | 0 | 0 | 0 | 0 | 0 | 0 | 0 | 0 | 0 | 0 | 0 | 0 | 0 | 1 | 0 | 0 |
| 22 | Pavement cleanliness | 0 | 0 | 0 | 1 | 0 | 0 | 0 | 0 | 0 | 1 | 0 | 0 | 0 | 1 | 1 | 0 | 1 | 1 | 0 | 0 | 0 | 1 | 0 | 0 | 0 | 1 |
| 23 | Periodic maintenance (e.g., a smooth surface, bump, weeds, debris, trash) | 0 | 0 | 0 | 0 | 0 | 0 | 1 | 0 | 0 | 0 | 1 | 1 | 0 | 0 | 0 | 0 | 1 | 1 | 0 | 1 | 0 | 1 | 0 | 0 | 0 | 1 |
| 24 | Presence of barrier from vehicle (e.g., fence, bollard) | 1 | 0 | 1 | 1 | 0 | 0 | 0 | 0 | 0 | 0 | 1 | 0 | 1 | 1 | 0 | 1 | 0 | 0 | 1 | 1 | 0 | 0 | 0 | 0 | 0 | 1 |
| 25 | Quiet, away from noise pollution | 0 | 0 | 0 | 0 | 0 | 1 | 0 | 0 | 0 | 0 | 0 | 0 | 0 | 1 | 0 | 0 | 0 | 1 | 0 | 1 | 0 | 0 | 1 | 0 | 0 | 0 |
| 26 | Roughness level of material surface (not slippery) | 0 | 0 | 1 | 0 | 0 | 0 | 0 | 0 | 0 | 1 | 0 | 1 | 0 | 0 | 0 | 0 | 1 | 0 | 0 | 0 | 1 | 0 | 0 | 0 | 0 | 0 |
| 27 | Safe from physical contact with bicycles | 1 | 0 | 0 | 0 | 0 | 0 | 0 | 0 | 0 | 0 | 0 | 0 | 0 | 0 | 0 | 0 | 1 | 1 | 0 | 0 | 0 | 0 | 0 | 0 | 0 | 0 |
| 28 | Safe from physical contact with other walkers | 0 | 0 | 0 | 0 | 0 | 0 | 0 | 0 | 0 | 0 | 0 | 0 | 0 | 0 | 0 | 0 | 1 | 0 | 0 | 0 | 0 | 0 | 0 | 0 | 0 | 0 |
| 29 | Safe from slipping (sand, uneven paving) | 0 | 0 | 0 | 0 | 0 | 0 | 0 | 0 | 0 | 0 | 0 | 0 | 0 | 0 | 0 | 0 | 1 | 0 | 0 | 0 | 0 | 0 | 0 | 0 | 0 | 0 |
| 30 | Safe from the dangers of crime and wild animals | 0 | 0 | 1 | 1 | 1 | 0 | 0 | 1 | 0 | 0 | 0 | 1 | 0 | 1 | 0 | 0 | 1 | 1 | 0 | 1 | 1 | 0 | 0 | 0 | 0 | 1 |
| 31 | Safe from traffic accidents (crossing road) | 0 | 1 | 0 | 1 | 1 | 1 | 0 | 1 | 0 | 0 | 0 | 1 | 1 | 1 | 1 | 1 | 1 | 1 | 1 | 0 | 1 | 0 | 0 | 0 | 0 | 1 |
| 32 | Type of material on the pedestrian path (grass, tiles, concrete, asphalt, etc.) | 0 | 0 | 0 | 0 | 0 | 0 | 0 | 0 | 0 | 0 | 0 | 0 | 0 | 0 | 0 | 0 | 1 | 0 | 0 | 0 | 0 | 0 | 0 | 0 | 0 | 0 |
| 33 | Visual attractiveness/ experience | 1 | 0 | 0 | 1 | 0 | 0 | 0 | 0 | 0 | 1 | 0 | 1 | 0 | 1 | 0 | 0 | 1 | 1 | 0 | 1 | 0 | 0 | 0 | 0 | 0 | 0 |
| 34 | Width of path | 1 | 0 | 1 | 0 | 0 | 0 | 1 | 0 | 0 | 1 | 1 | 1 | 0 | 1 | 1 | 1 | 1 | 1 | 1 | 1 | 0 | 1 | 0 | 0 | 0 | 1 |
Table 3.
Photo distribution.
| Zone | Zone 1 (Z1) | Zone 2 (Z2) | Zone 3 (Z3) | Zone 4 (Z4) | Zone 5 (Z5) | Zone 6 (Z6) | Zone 7 (Z7) | Total Photo |
|---|---|---|---|---|---|---|---|---|
| Number of Photos | 50 | 63 | 53 | 51 | 77 | 92 | 73 | 459 |
Table 4.
Five dimensions (quassessment) of model evaluation.
| No | Dimension | Variable |
|---|---|---|
| 1 | Quality | 1 Durability of path material (strong, not easily broken); 2 Roughness level of material surface (not slippery); 3 Absence of obstruction (e.g., obstacle, pole, hole, etc.); 4 Periodic maintenance (e.g., a smooth surface, bump, weeds, debris, trash, etc.) |
| 2 | Design | 1 Width of path; 2 Type of material on the pedestrian path (grass, tiles, concrete, asphalt, etc.); 3 Continuity of path without significant elevation difference (up/down repeatedly); 4 Connectivity with other paths and facilities (parking area, bus stop, etc.); 5 Aesthetic (neatness, colored, patterned); 6 Presence of barrier from vehicle (e.g., fence, bollard); 7 Completeness of supporting tools for disability (e.g., guiding block, ramp, etc.) |
| 3 | Safety | 1 Safe from the dangers of crime and wild animals; 2 Safe from physical contact with other walkers; 3 Safe from physical contact with bicycles; 4 Safe from traffic accidents (crossing road); 5 Safe from slipping (sand, uneven paving) |
| 4 | Sensory | 1 Convenience (protection) from weather conditions (e.g., heat, rain, wind); 2 Pavement cleanliness; 3 Visual attractiveness/experience; 4 Adequacy of light at night; 5 Quiet, away from noise pollution; 6 Air cleanliness (from dust, smoke, etc.); 7 Absence of unpleasant smell (e.g., garbage, rotten, etc.) |
| 5 | Amenities | 1 Availability of landscape and greenery; 2 Availability of shade trees; 3 Availability of shelter (gazebo); 4 Availability of benches (seats around the sidewalk); 5 Availability of trash bins; 6 Availability of signage (traffic sign, map); 7 Availability of street lighting and sidewalks (lamp); 8 Availability of zebra crossing (street crossing/crosswalk); 9 Availability of parking lots; 10 Availability of bus stops (public transport); 11 Availability of hydrants |
Table 5.
Correlation between dominant factors and overall satisfaction.
| Variable | By Variable | Correlation | Count | Signif. Prob. |
|---|---|---|---|---|
| Overall Satisfaction | Continuity of path without significant elevation differences | 0.69 | 37 | <0.0001 * |
| Overall Satisfaction | Durability of path material (strong/not easily broken) | 0.62 | 37 | <0.0001 * |
| Overall Satisfaction | Absence of Obstruction (obstacle, pole, tree, hole) | 0.60 | 37 | <0.0001 * |
| Overall Satisfaction | Aesthetics (neatness, color, pattern) | 0.59 | 37 | 0.0001 * |
| Overall Satisfaction | Availability of shelter (gazebo) | 0.53 | 37 | 0.0007 * |
Note: * = significance probability less than 0.05, Signif. Prob. = significance probability.
© 2017 by the authors. Licensee MDPI, Basel, Switzerland. This article is an open access article distributed under the terms and conditions of the Creative Commons Attribution (CC BY) license (http://creativecommons.org/licenses/by/4.0/).
Share and Cite
MDPI and ACS Style
Murwadi, H.; Dewancker, B. Study of Quassessment Model for Campus Pedestrian Ways, Case Study: Sidewalk of the University of Lampung. Sustainability 2017, 9, 2285. https://doi.org/10.3390/su9122285
AMA Style
Murwadi H, Dewancker B. Study of Quassessment Model for Campus Pedestrian Ways, Case Study: Sidewalk of the University of Lampung. Sustainability. 2017; 9(12):2285. https://doi.org/10.3390/su9122285
Chicago/Turabian StyleMurwadi, Haris, and Bart Dewancker. 2017. "Study of Quassessment Model for Campus Pedestrian Ways, Case Study: Sidewalk of the University of Lampung" Sustainability 9, no. 12: 2285. https://doi.org/10.3390/su9122285
Note that from the first issue of 2016, this journal uses article numbers instead of page numbers. See further details here.