1. Introduction
Residential and commercial end users together accounts for 20.1% of the total delivered energy consumed worldwide. According to the IEO2016 Reference case, energy consumed in residential sector will be 13% of total world delivered energy consumption in 2040 [
1]. China has been the world’s largest energy consumer since 2010 [
2]. The residential sector is China’s second largest energy consumer [
3], which accounted for 20.5% of the total energy consumption of the final consumption in 2014 [
4]. In response to global climate change and energy demand, residential building energy consumption research in China has received extensive attention.
However, most of the methodologies used in existing residential building stock research lack accuracy. Residential end-use energy consumption could be divided into a top-down model and a bottom-up model [
5]. Top-down models are easily to develop based on information provided by macroeconomic indicators. Various methods, such as cluster analysis, the classification analysis method [
6] and the STIRPAT model [
7] were used for top-down models. However, top-down models do not objectively show the actual energy consumption situation. Bottom-up models are considered relative more comprehensive. There is a growing interest in questionnaire survey. For example, Shan Hu et al. surveyed Chinese 31 cities’ residential buildings in 2015, summarized the change trend of the energy consumption of residential buildings in these cities and analysed the relationship of energy consumption and energy use behaviours [
8]. Iwan et al. promoted a questionnaire survey of 11 living areas in Indonesia and used a lifestyle analysis to calculate the construction of residential energy consumption [
9]. This type of research was more concerned about the factors that influence the energy consumption and the energy consumption of the families in the area. However, few of them payed attention to the energy consumption of the public part of apartment buildings. Simulation tools, such as BIM [
10], Visual DOE (version 4) [
11], IDA-ICE [
12], and TRNSYS [
13] showed good performance. Among these sorts of software, eQUEST, which uses DOE-2’s building description language (BDL), showed more practicability and convenience. It is in line with the U.S. LEED (Leadership in Energy & Environmental Design Building Rating System) as the most commonly used tool for simulation coding [
14]. eQUEST software simulation has been used in the research of energy consumption of the object from United States [
15], Canada [
16], South Korea [
17] and China [
18,
19,
20,
21]. Further, the accuracy of the energy consumption simulation in the Olympic centre area has been verified by the simulation of the energy consumption in large public buildings in the case area [
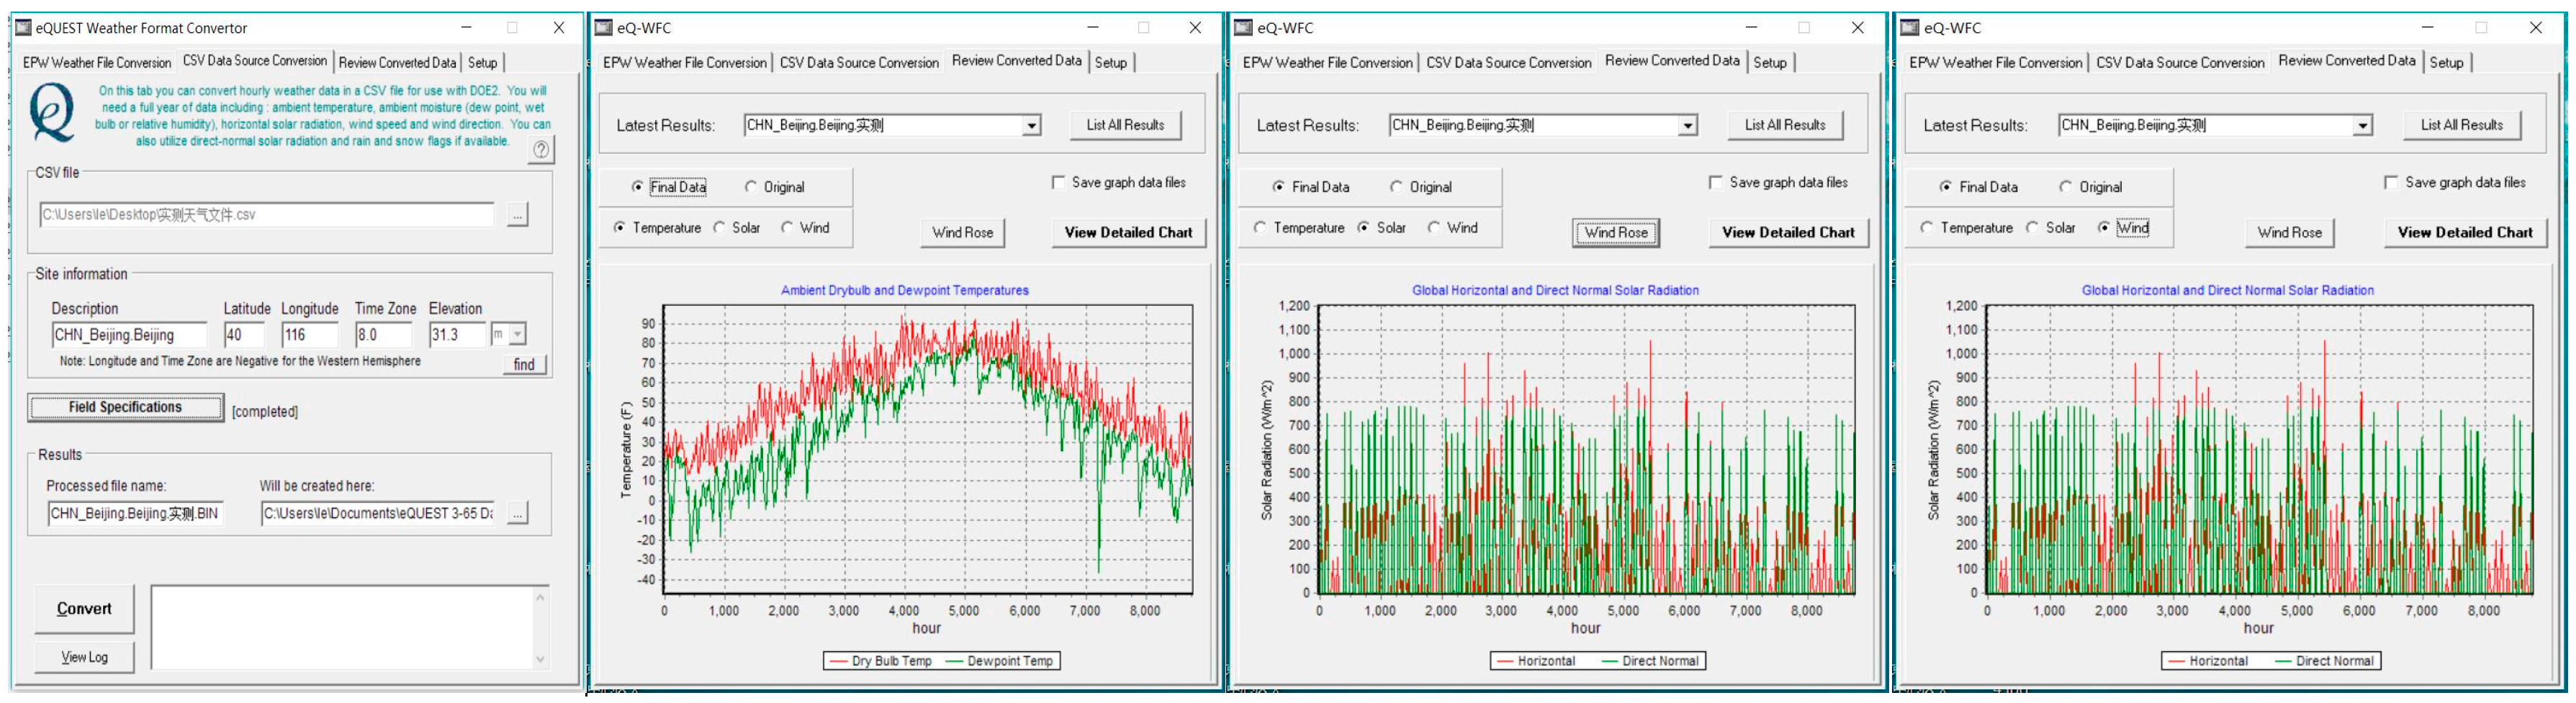
22]. The existing simulation tools mainly used standard climate data, focused on the simulation of a building’s physical structure and lacked studies on the actual energy consumption behaviour of residents. The weather data change every year [
23]. The use of real-time meteorological data to simulate the actual situation is considered to be an appropriate approach to building simulation applications [
24] which can effectively improve the accuracy of energy consumption simulation and prediction [
5]. Real-time meteorological data includes a full range of data, including dry bulb temperature, wet bulb temperature, wind speed, wind direction, relative humidity, solar radiation intensity, and air pressure [
24]. What’s more, occupant behaviours are varied, which greatly affect the energy consumption of residential buildings [
5]. Different lifestyles of the residents lead to different energy consumption data [
25]. Existing research showed that occupant behaviours had significant effect on space ventilation rates [
26] and affected overall residential energy consumption forecast accuracy by ±15–20% [
27]. Therefore, we combine eQUEST simulation, questionnaires survey and incorporate real-time meteorological data to make the simulation results more accurate.
In order to simplify the calculation, it is necessary to classify the residential buildings in the study area according to the obvious classification factors. Firstly, the age of construction is an important basis for research. A research based on a survey in Basel showed that the energy consumption of residential buildings and the construction age had a nonlinear correlation [
28]. Brounen et al. surveyed 300,000 Dutch families, and the research results showed that the energy consumption of buildings built before the 1980s is almost 50% higher [
29]. The implementation of “Three Steps Energy Saving” in Beijing City, which is the mandatory standards for building energy-saving heating energy consumption in three stages, including a residential space heating energy saving of 30%, 50%, 65%, comparing 1980s buildings with the residential buildings constructed from 1991 to 1999, from 2000 to 2004 and after 2005, respectively [
30]. Further, the residential building classification factor also includes building function, floor area and building shape [
4,
31,
32]. Xiaochen Liu et al. researched family energy consumption and carbon dioxide emissions in the Greater Dublin area, and the results showed that the smaller residential areas demand less energy use [
33]. The simulation results of BIM software show that the annual energy consumption of different orientations are quite different [
10]. Tianren Yang and other scholars, in the study of residential energy consumption in the residential area of Chongming Island, classified urban residential buildings, platoon villas, Banlou and high-rise residential units [
34]. It can be seen that building construction, interior residential area, building height, building orientation, building function and building shape greatly affect internal energy consumption, and they are important classifications for building energy consumption research.
The influencing factors of energy consumption in residential buildings analysed in different research have difference. Some macro-scale research involved energy market, climate, urbanization, income, and so on. Hossein, for example, defined household, building, home appliances, energy market, climate as five determinants of residential energy consumption [
35]. YANG Yanfang et al. showed that urbanization is the most important factor affecting Beijing’s building carbon emissions [
36]. However, some of these factors are not significant in micro-scale studies. Instead, demographic characteristics, building conditions, lifestyle, household appliances and energy-saving concept are five main influencing items. PU Qingping selected 29 variables out of these items in his research, and the result showed that permanent resident, per capita building area, building type, number of air conditioning and computer, and air conditioning cooling method are the most important factors [
37]. The variables analysed in this research came from survey questionnaire data, and 19 of them were selected from the items of household income, household conditions, building conditions, lifestyle, household appliances and energy-saving concept referencing to PU’s selection.
Beijing has become China’s second largest energy consuming city and entered the stage of building a low-carbon city. The next 20 to 30 years will be the crucial period for the construction of low-carbon city [
38].To face the challenge, energy-saving residential buildings renovation gradually began from 2006 [
39]. Beijing put forward the comprehensive transformation of the old district built before 1990 [
40] and further promoted energy-saving renovation plan [
41] during the 12th Five-Year and 13th Five-Year, respectively. However, the energy-saving design and transformation of residential buildings lacks scientific research support.
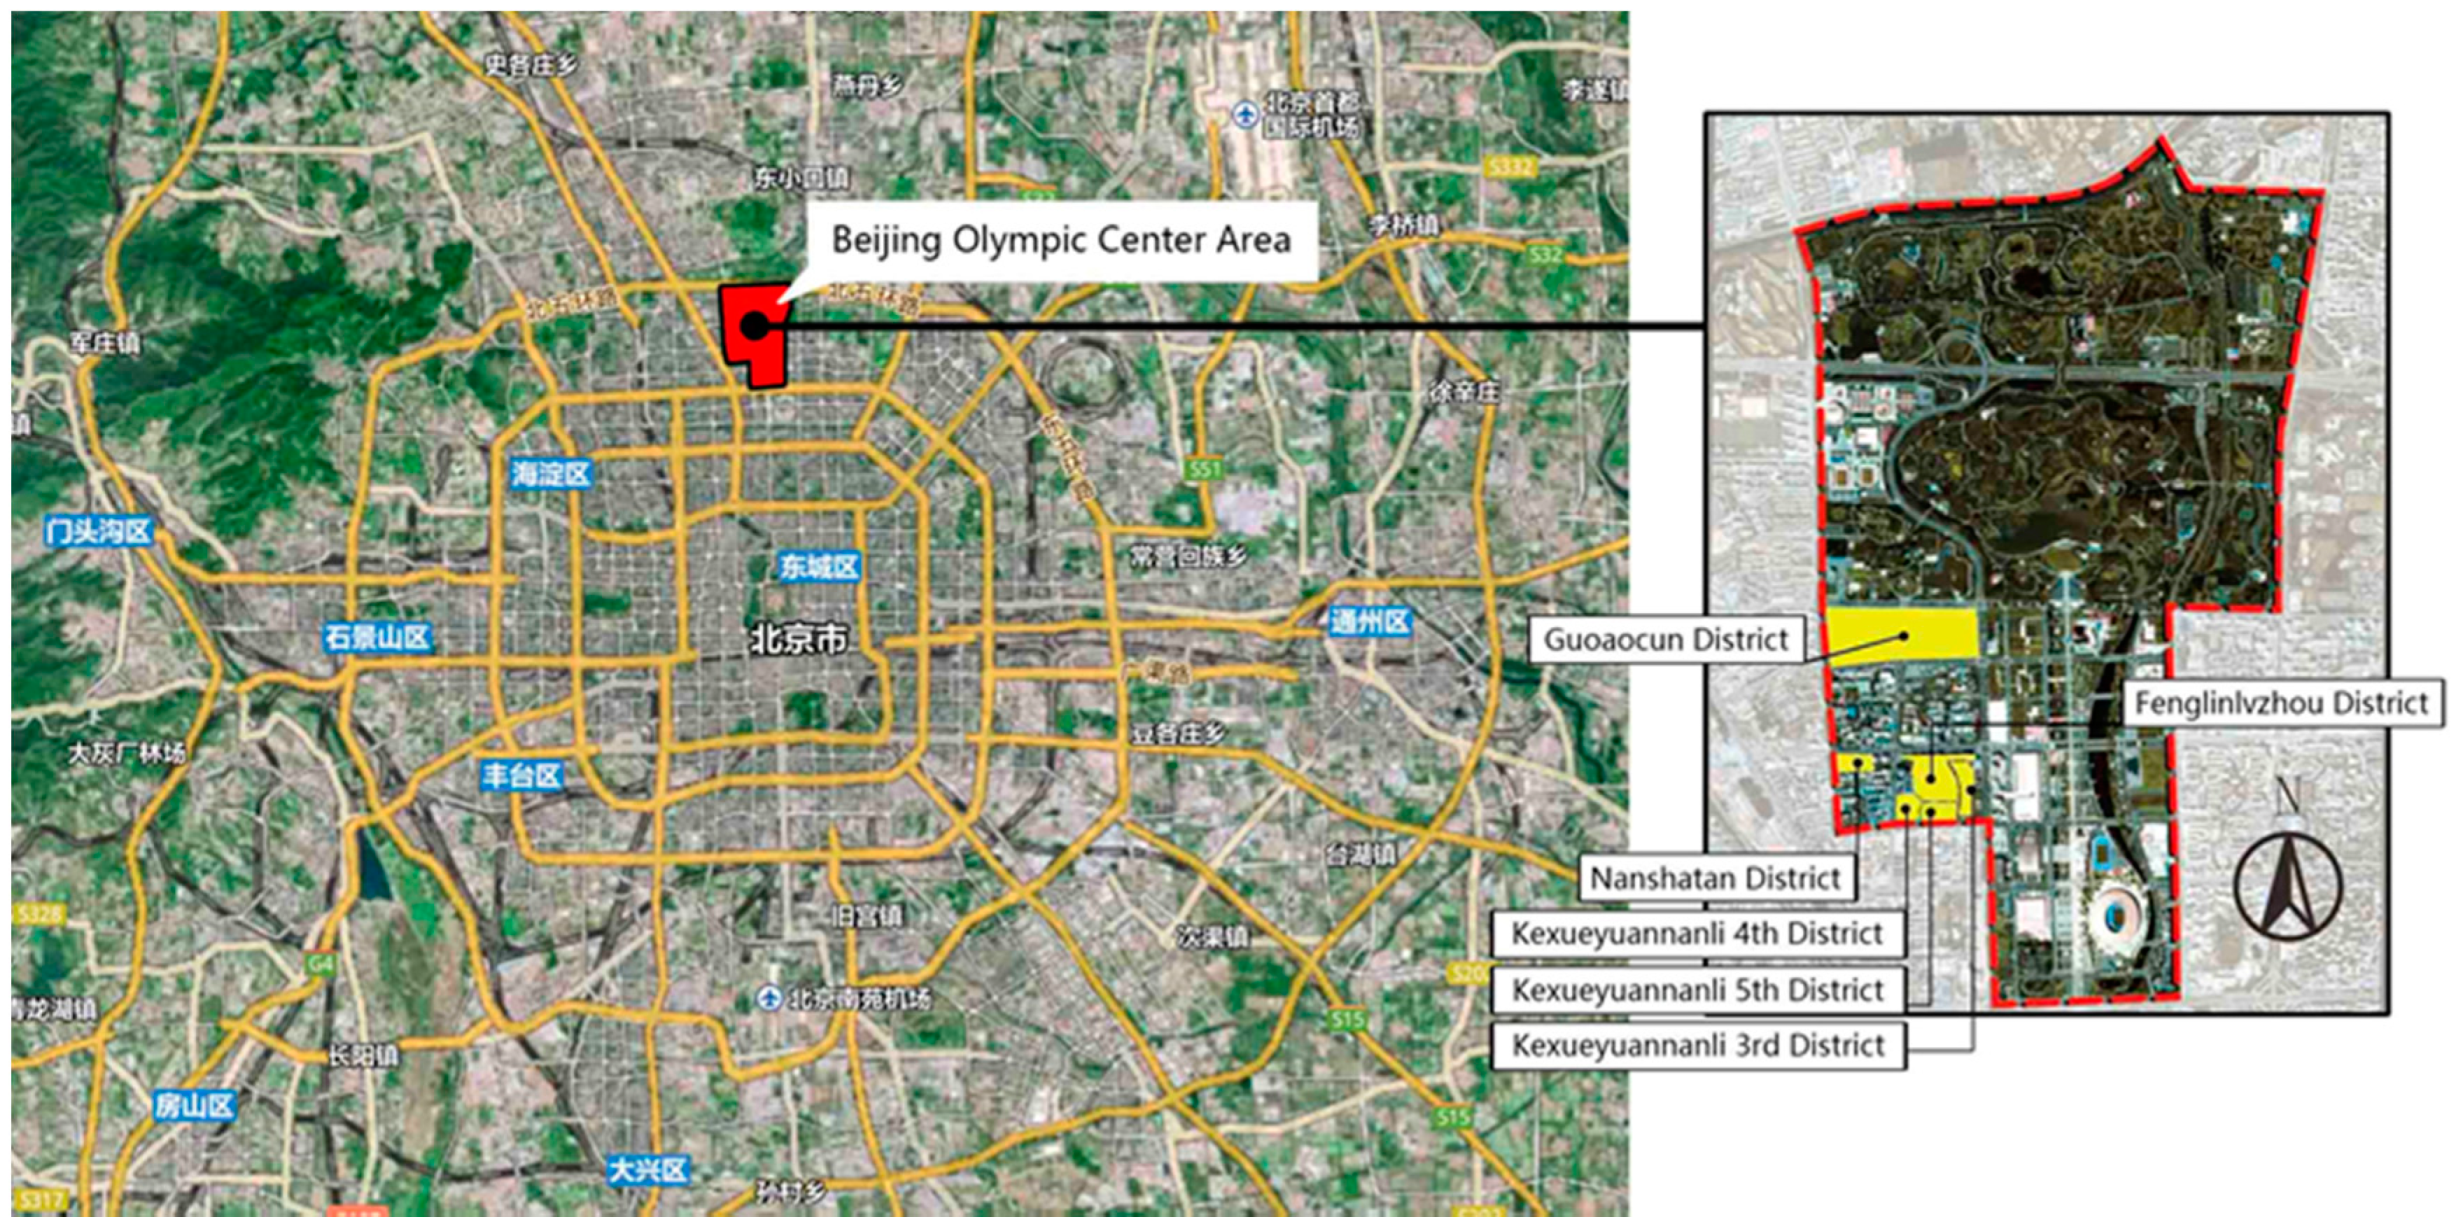
Based on the above requirements, residential buildings which covered different construction ages and architecture forms in the Olympic Central Area in Beijing (
Figure 1) were chosen to simulate residential building energy consumption and analysis influencing factors. This study surveyed a large number of households in 6 existing districts. Subjected to objective conditions, the actual electricity and natural gas energy consumption data cannot be obtained through the energy supply sector. Thus, the results cannot be calibrated. However, we used the real-time meteorological observation date in the case area and the actual energy consumption schedule of the residents to improve the accuracy of the eQUEST software (James J. Hirsch & Associates, Camarillo, CA, USA), and converted the final energy consumption into standard coal. We comparative analyze the energy consumption intensity of per unit area in different residential building types and explore the social behaviour influencing mechanism behind the energy consumption change, to provide practical reference for energy saving reconstruction of residential buildings in Beijing.
4. Discussion
4.1. Composition and Variance Analysis of Total Energy Consumption
Of the overall energy consumption structure, space heating represents the greatest annual energy consumption per unit area, with a proportion of 45%. Appliance energy consumption is second, with a proportion of 20%; domestic hot water energy consumption is third, with 11%; space cooling energy consumption is fourth, with 9%; and elevator and cooking are 5%, respectively. In apartment buildings with elevators, the unit area of residential building elevator energy consumption accounted for 7% of the total energy consumption. Visible elevator energy consumption in residential buildings represents a certain proportion of energy consumption (see
Table 2).
We identified 8 types of residential building energy use, including space heating, space cooling, fan, water pump, appliances, lighting, domestic hot water, and cooking. We obtained the annual total energy consumption using an SPSS analysis of variance, and we analysed the differences between the groups (see
Table 3). Because the space heating and cooling consumption is extremely different among the seasons, the influence of a non-cooling season and a non-heating season is eliminated in the two analyses. In this analysis, elevator energy consumption is determined in accordance with the “elevator technical conditions” GB/T 10058-2009 Appendix A calculation, and not the simulation value. The results showed that there was no significant difference in space cooling consumption between the groups, and there were differences in fan energy consumption among the groups. In general, building type has a great impact on the final energy consumption.
4.2. Comparison of Energy Consumption in Different Types of Buildings
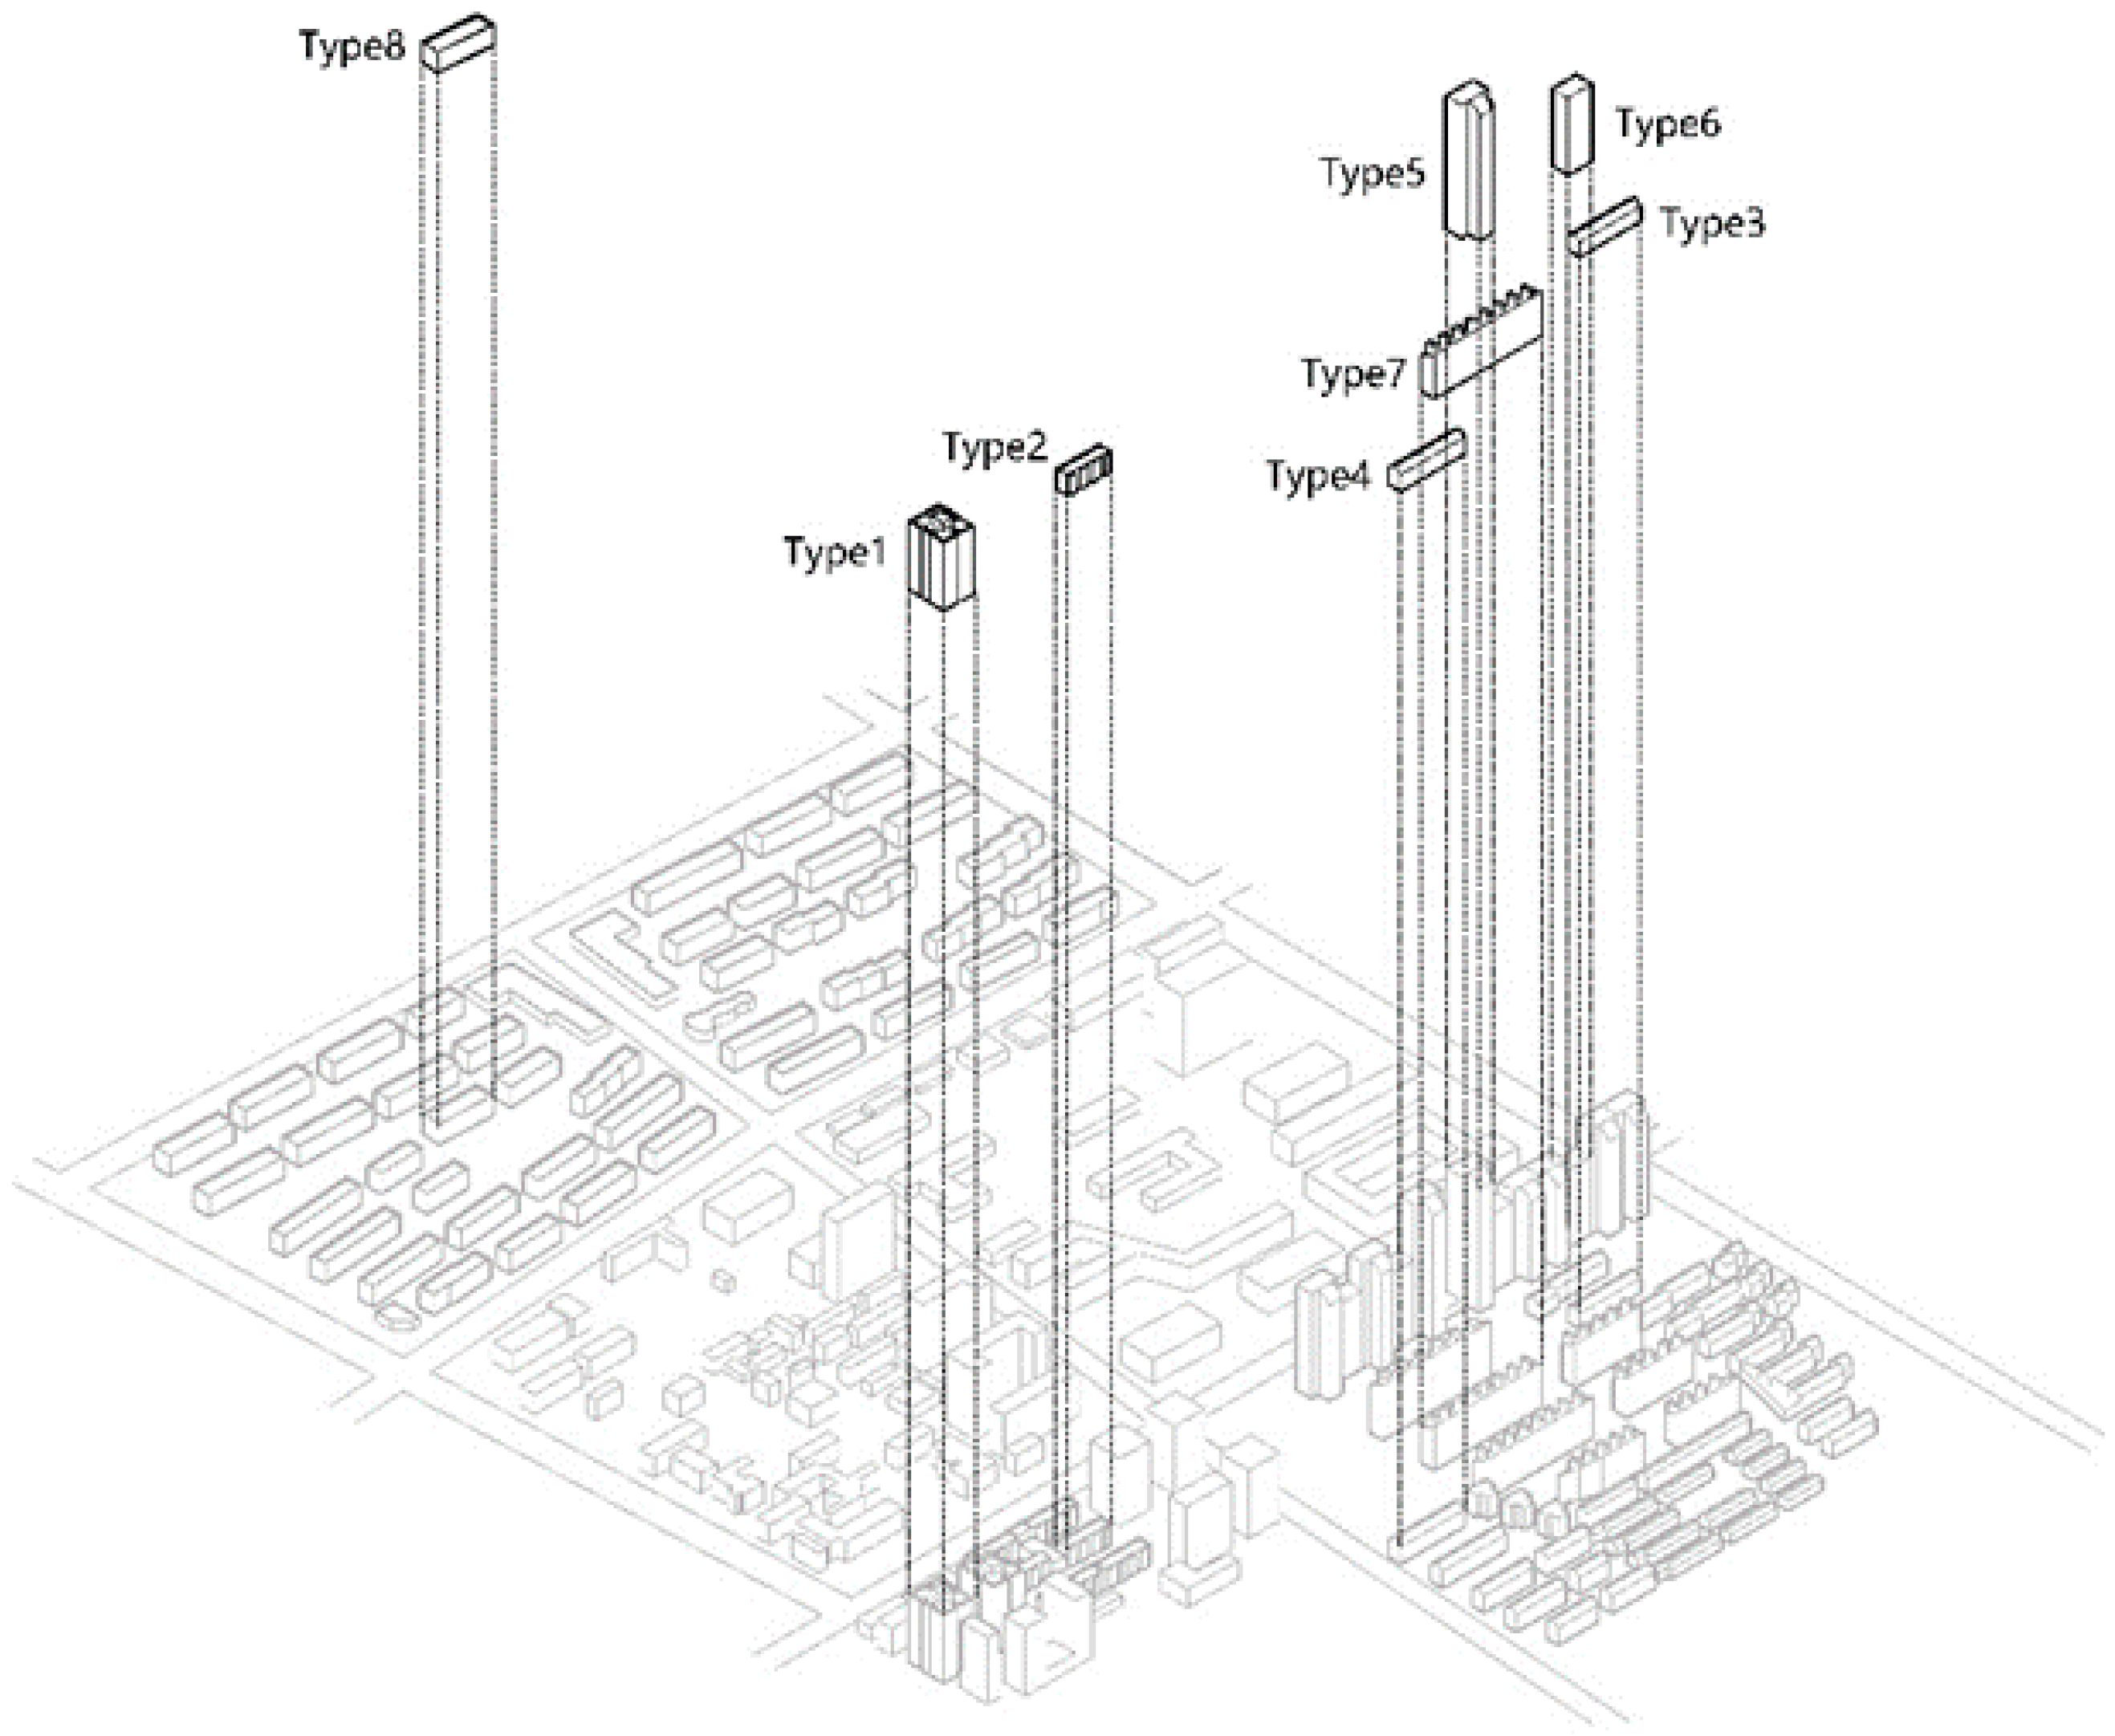
In this part, we comparative analyzed the energy consumption in different types of buildings, according to construction age, building height, apartment sizes, and construction forms. The type 8 (Guoaocun District, built after 2005) applied the water source heat pump system, which reduced space heating and space cooling energy consumption much more than the natural gas district heating system, will affect the results of the comparative analysis. Therefore, in the comparative analysis for energy consumption per unit area according to building height, apartment sizes, and construction forms, we exclude the type 8, and only analyzed the other 7 types residential buildings, which applied the natural gas district heating system.
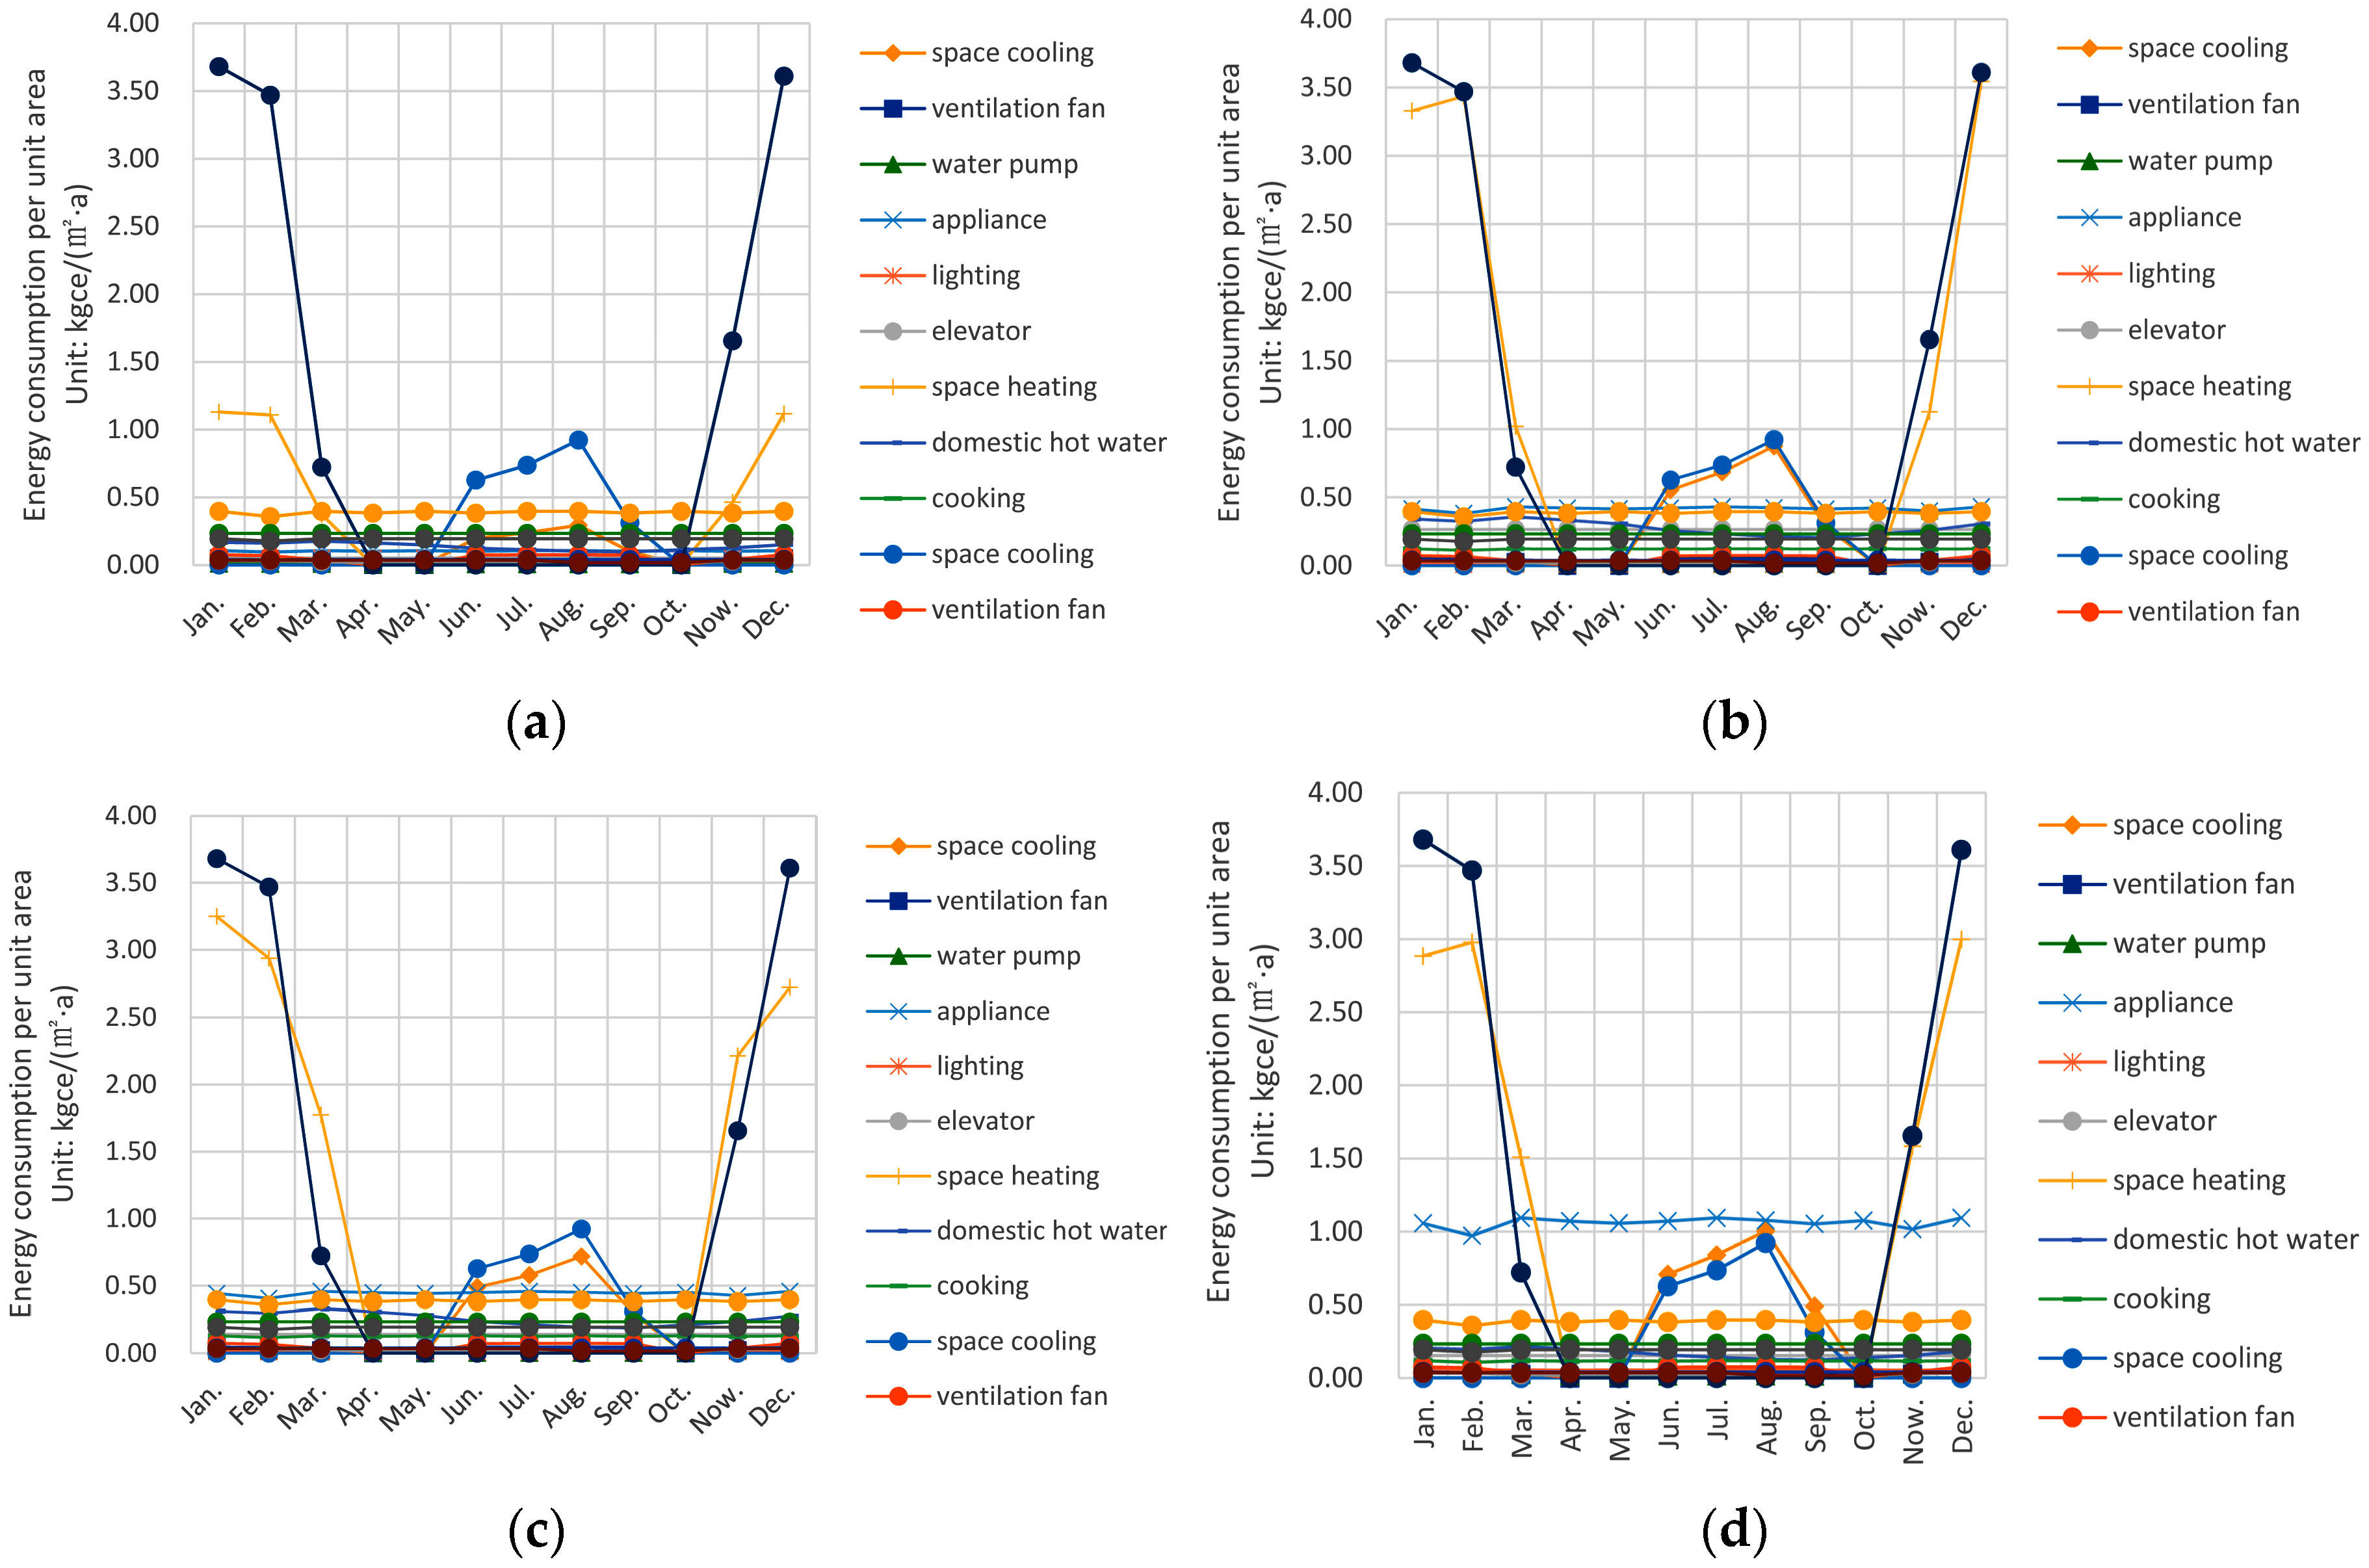
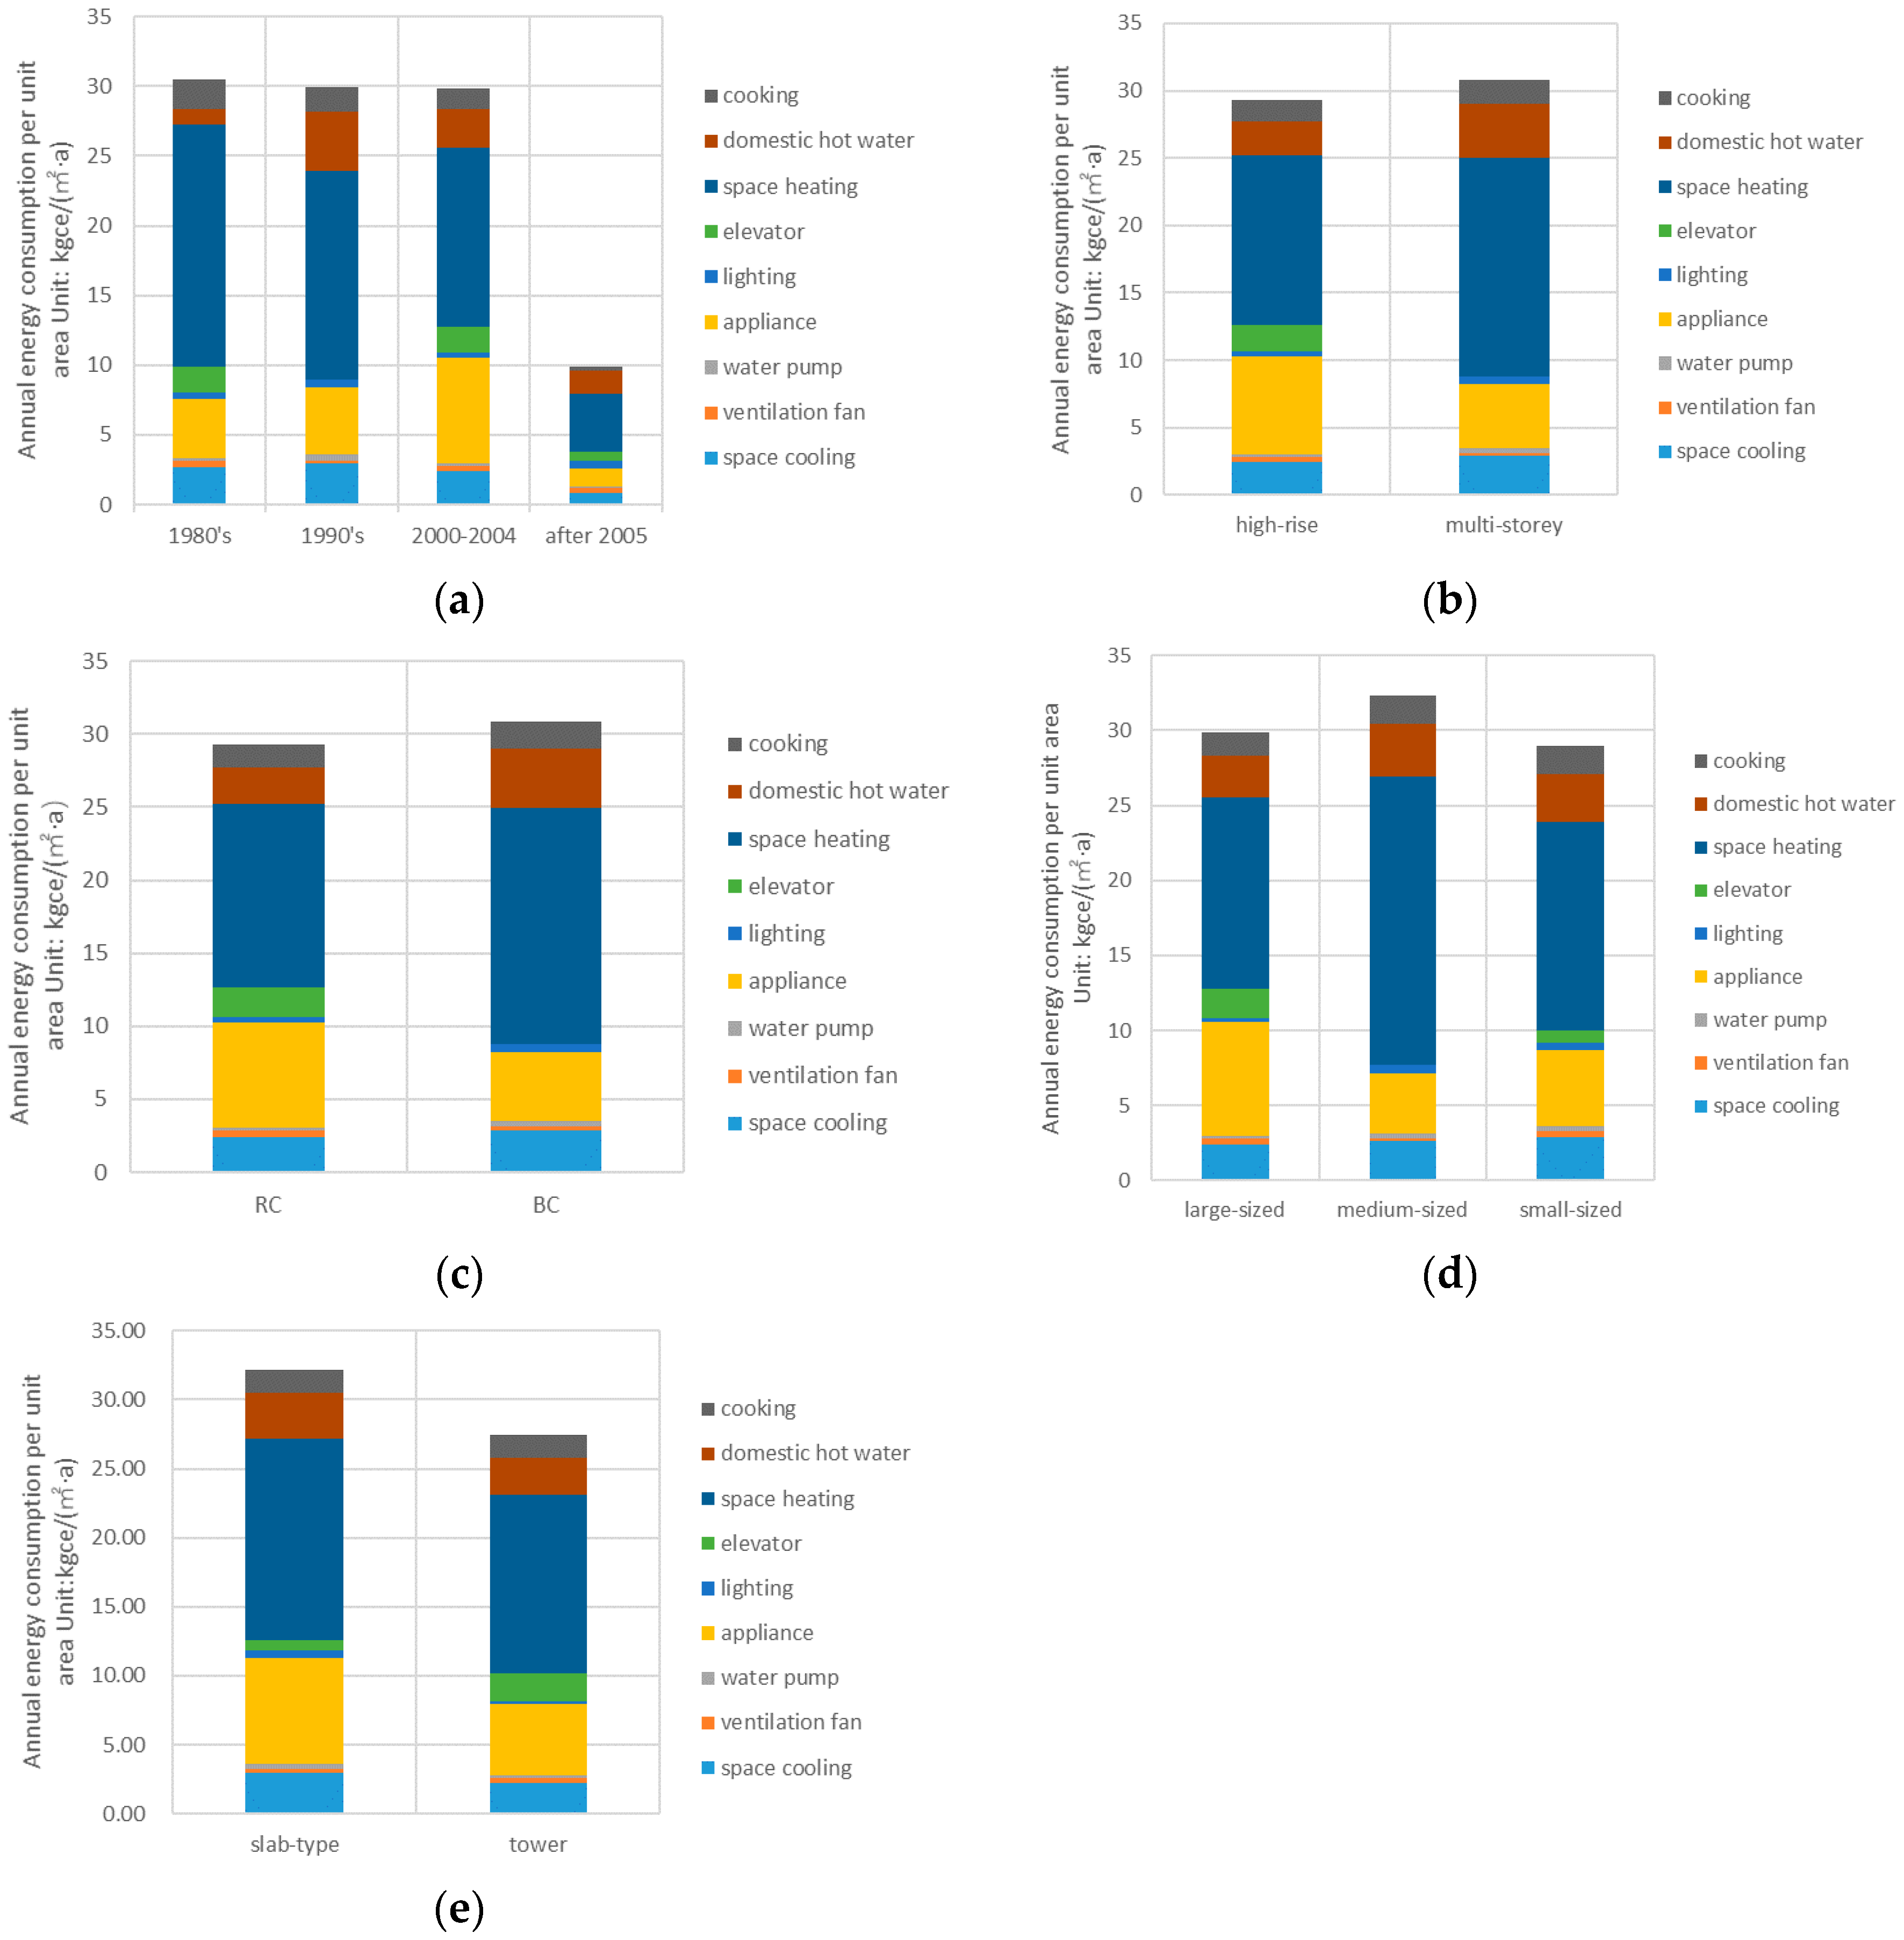
4.2.1. Comparison of Energy Consumption of Residential Buildings in Different Ages
Generally, the difference in energy consumption per unit area of residential buildings during different construction time periods is large, and the energy consumption per unit area decreases over time. The buildings that were constructed after 2005 have a minimum energy consumption per unit of 9.34 kgce/(m
2·a), and the 1980s buildings have a maximum energy consumption per unit of 30.52 kgce/(m
2·a). The 1980s and 1990s building heating unit area energy consumption was 25.07 kgce/(m
2·a) and 14.92 kgce/(m
2·a), which is higher than the average value of Beijing city civil building heating energy consumption in 2014, at 13.9 kgce/(m
2·a) [
43]. Buildings that were built in the 1990s, the period from 2000 through 2004, and after 2005 have heating energy savings of 14.1%, 26.2%, 76%, respectively, compared to the heating energy consumption of buildings that were built in the 1980s. The building energy consumption is greatly reduced in the buildings that were built after 2000, which is related to the upgrading of the building structure and the change of heating form. The hot water energy minimum was in the 1980s buildings, at 1.13 kgce/(m
2·a), followed by the 2000 building, at 2.49 kgce/(m
2·a), and the highest were the buildings that were built in the 1990s, at 4.24 kgce/(m
2·a). In addition, the unit area of space cooling and cooking consumption is influenced by the age of the building. The 1980s and 1990s building exterior wall insulation performance is poor, and the space cooling energy consumption is higher than the 2000–2004 buildings, and the buildings that were built after 2005 had lower space cooling energy consumption due to the use of water source heat pump centralized space cooling. Cooking gas is more affected by user behaviour.
4.2.2. Comparison of Energy Consumption of Residential Buildings with Different Heights
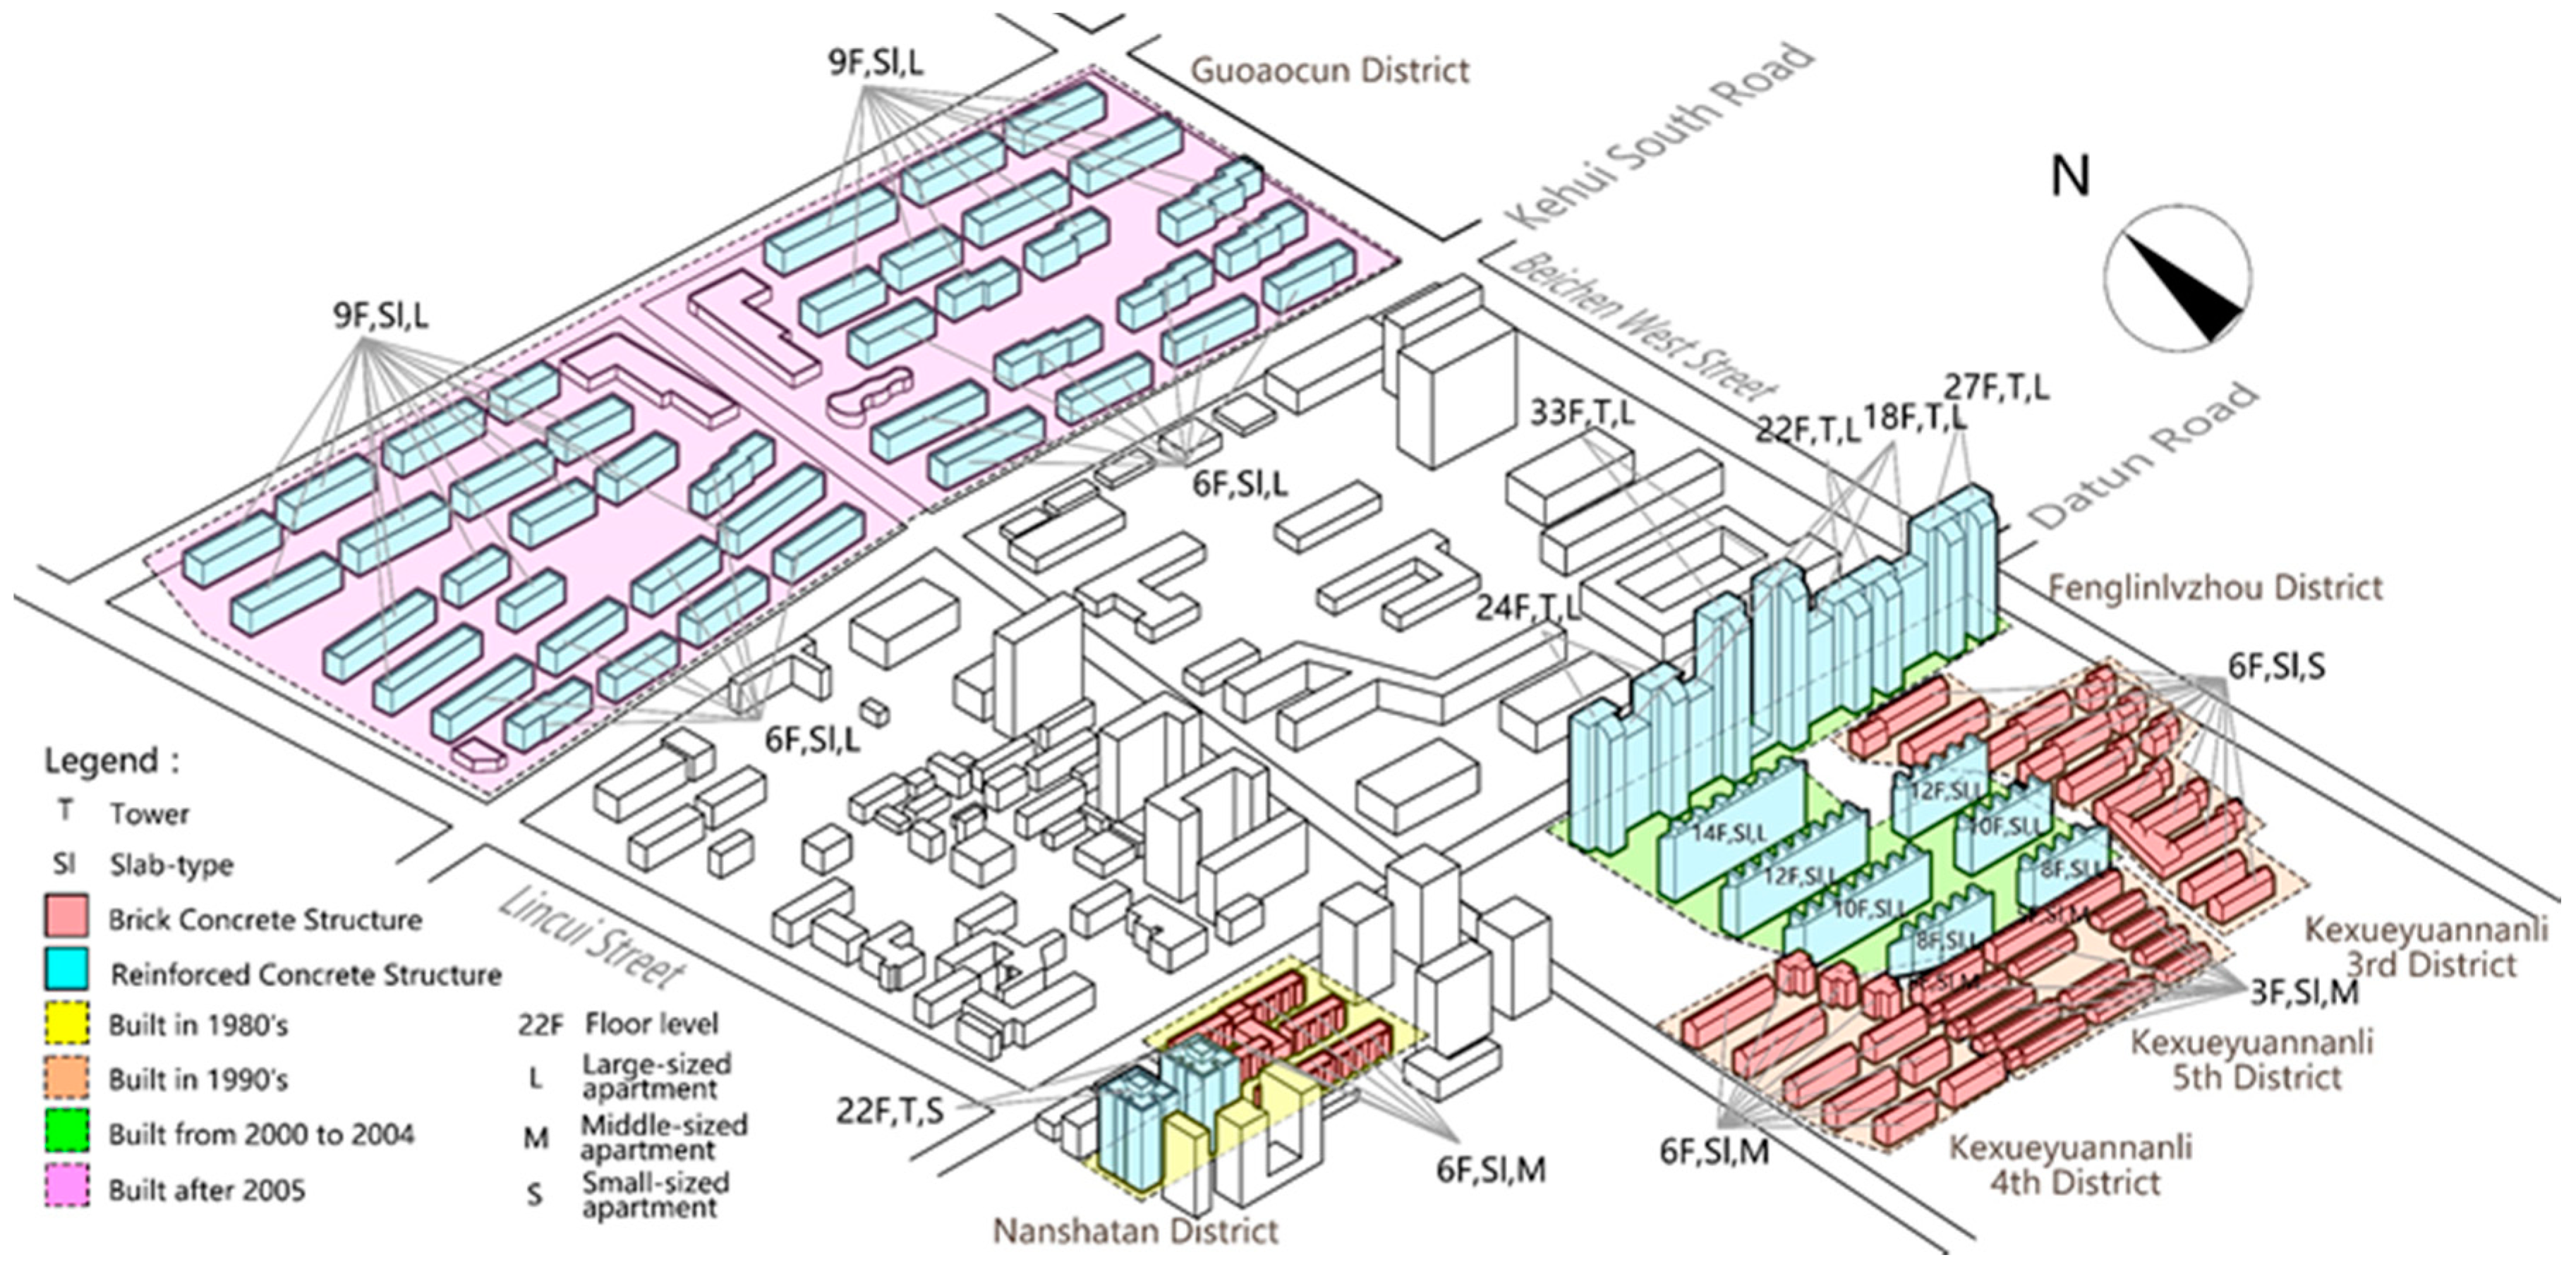
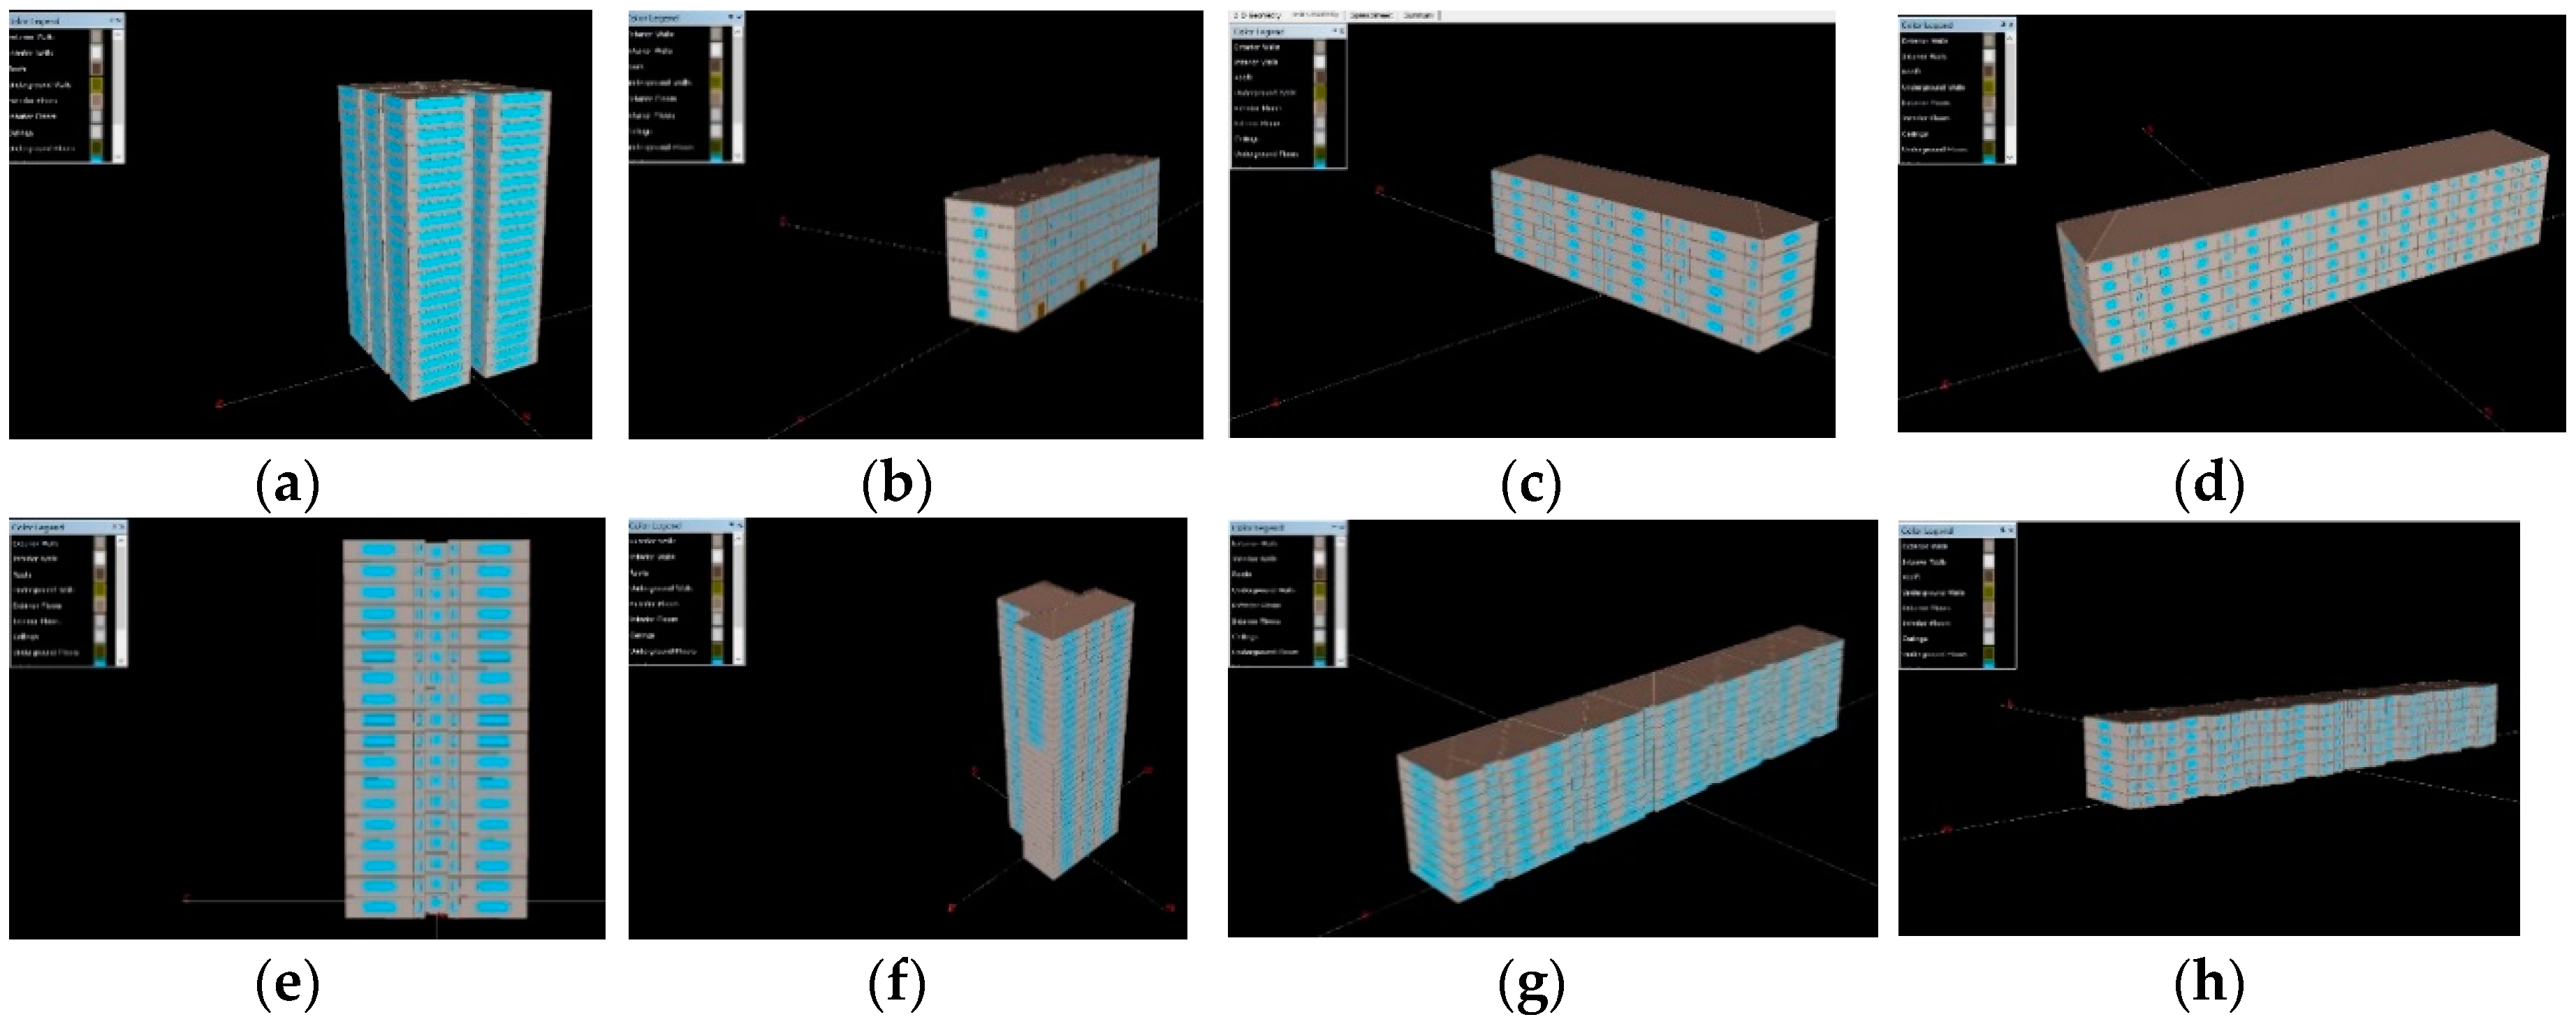
The residential buildings in the study area are divided into two types according to the height of the buildings. They are high-rise buildings (more than 10 floors) and multi-storey buildings (between 3 and 6 floors). These structures appear to correspond to the reinforced concrete structure and the brick and concrete structure buildings in
Figure 8. The overall energy consumption differences between the two types of building is small, at only 1.27 kgce/(m
2·a). The total energy consumption per unit area of the high-rise buildings was lower than the energy consumption in multi-story buildings by 4%. High-rise buildings showed good structural insulation performance because they are 22% more energy efficient in space heating, 16% more efficient in space cooling, and 37% more efficient in domestic hot water energy consumption compared with multi-storey buildings. However, high-rise buildings per unit area of household appliance energy consumption is 7.26 kgce/(m
2·a), which is 53% higher than that in multi-storey buildings. Elevator energy consumption accounted for 7% of high-rise buildings per unit area of energy consumption. To reduce such energy consumption, the high-rise building relative to the multi-storey building energy savings per unit area is 11%.
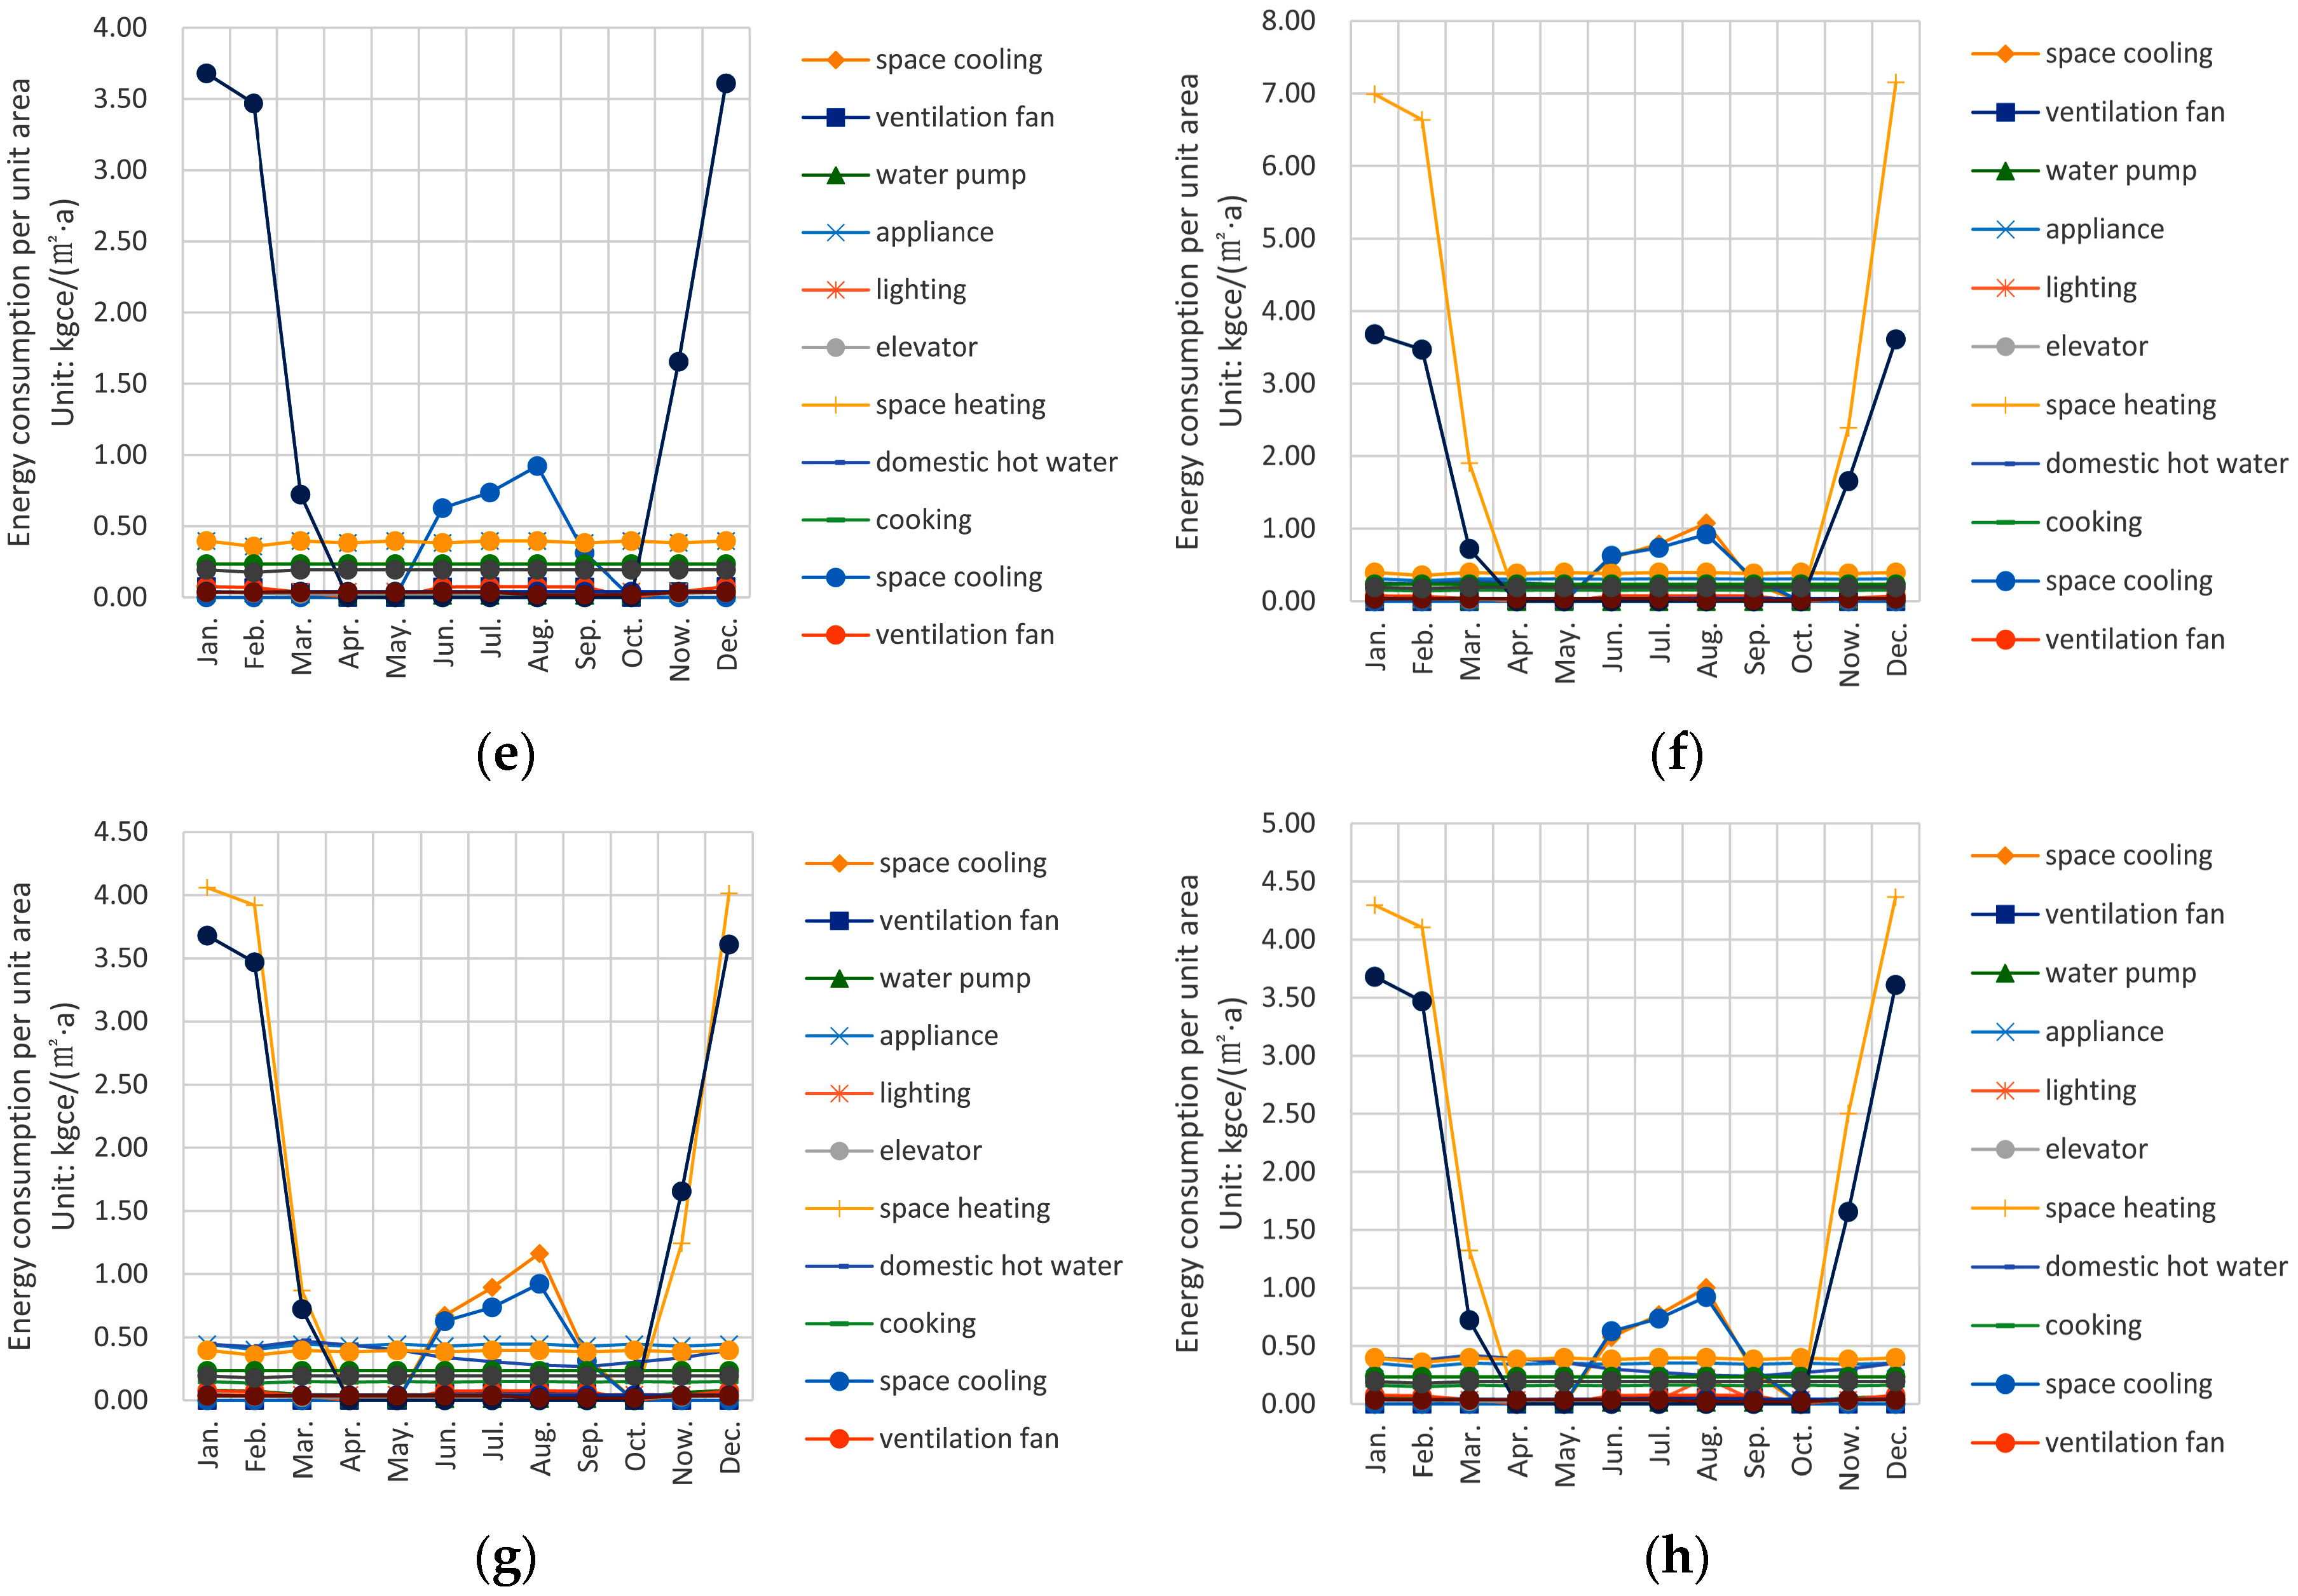
4.2.3. Comparison of Energy Consumption of Residential Buildings with Different Apartment sizes
According to the building interior units, the residential buildings in the case study area are divided into three types of building: small-sized apartment buildings (apartment area is less than 60 m2), medium-sized apartment buildings (apartment area is between 60 and 120 m2), and large-sized apartment buildings (apartment area is more than 120 m2). Among them, small-sized apartment buildings have the lowest energy consumption per unit area of 29.02 kgce/(m2·a), and medium-sized apartment buildings’ energy consumption per area is the highest, at 32.32 kgce/(m2·a). Some of the recent research has shown that small-sized apartments are more energy efficient, and the state has published policy terms to encourage small apartment buildings. However, large-sized buildings in the case study area showed more energy reduction in space cooling (18%), space heating (7%) and domestic hot water (14%) than the small-sized buildings. This may be because the large-sized apartment buildings in the case study area were constructed later and have more energy-efficient exterior structures. In addition, there is an average of 0.02 people per unit area in large-sized apartment buildings, whereas the number in small-sized ones is 0.05. Occupants in small-sized apartment buildings are more intensive, so is the energy use. In the Kexueyuannanli District, the buildings were constructed during the same time period, and their external maintenance structures are similar. The small-sized apartment buildings save 2% of all energy consumption and have a lower space heating energy consumption than the medium-sized apartment buildings at 15%.
4.2.4. Comparison of Energy Consumption of Residential Buildings with Different Construction Forms
The residential buildings in the study area are divided into two main types of slab-type building and towers. Overall, the total annual energy consumption per unit area of towers is lower than that of slab-type buildings by 15%. Based on the composition of the energy consumption, towers’ annual space cooling, space heating and appliance energy consumption per unit area of energy consumption are 72%, 63% and 69%, respectively, compared to the slab-type buildings. However, towers have abundant orientations, and the number of north- and west-oriented rooms accounted for a relatively large proportion. Therefore, space cooling and heating energy demand more, and energy consumption should be relatively high. In the Fenglinlvzhou District, the space heating energy consumption per unit area in slab-type buildings (type 4) is 11.95 kgce/(m2·a), which is relatively less than that in towers, which is 12.46 kgce/(m2·a) (type 2) and 12.90 kgce/(m2·a) (type 3), respectively.
4.3. Analysis of Household Energy Impact Variables in Residential Buildings in Case Area
The impact of energy consumption in residential buildings usually involves household income, household conditions, building conditions, lifestyle, household appliances and energy-saving concept. This study select the per capita income, resident population, construction age, residential floor, and so on, from the six aspects. The correlation of these variables to the energy consumption of households in residential buildings are analyzed. Household energy consumption is calculated by eQUEST energy consumption simulation of all types of residential buildings per unit area (
Table 4).
19 selected factors that affect household energy consumption are shown in
Table 3. Semi-parametric treatment was made for building height (BH), building structure (BS), architectural form (AF), internal unit (IU) and construction age (CA). For BH, the high-rise building is assigned to 1, multi-storey building assignment 2; for BC, the concrete building is assigned to 1, brick and concrete structure is assigned to 2; for AF, the tower building is assigned to 1, floor building is assigned to 2 ; for CA, the construction after 2005 is assigned to 1, the 2000–2004 construction is assigned to 2, the 1990s construction assignment to 3, the 1980s construction assignment to 4; for IU, the large-sized apartment is assigned to 1, the medium-sized apartment is assigned to 2, the small-sized apartment is assigned to 3.
A stepwise linear regression analysis was performed using SPSS20.0. The final model variables are internal units, building height, per capita building area, the number of residents, length of power use five variables. The
R2 of the model is 0.949 and the Sig value is 0.000, which proves that the model has high accuracy and the result of regression is feasible (
Table 5).
From
Table 6, the following conclusions can be drawn:
According to the building condition item, the internal units, building height, and per capita construction area were inputted into the model. The internal unit for the residential building energy consumption is a negative impact, indicating that the smaller the units, the less the energy consumption of the family, because the small apartment building is relatively compact; building height for the family energy consumption is a negative impact, indicating that the high-rise building relatively multi-storey building energy consumption is less, because the high-rise building shape coefficient is smaller; per capita building area was positively correlated, indicating that the larger the per capita construction area, the higher the energy consumption, the greater the area of heating and cooling.
From the household condition, the number of occupants entered the final model. The number of residents is the positive factor, indicating that the more people living there, the greater the family energy consumption, because the greater the number of residents, the more intensive the use of energy, and the greater the need for household electricity and gas use.
From the energy-saving concept, the length of power use entered the final model. Power consumption and the final carbon dioxide emissions were positively correlated, indicating that the longer the use of household appliances, the more will be the energy consumption of the family. Therefore, it is necessary to strengthen the residents of the energy-saving education to make the occupants consciously reduce the unnecessary use of household appliances.


