1. Introduction
In recent decades, changes in climate including increases in warm temperature extremes, extreme high sea levels, and extreme weather events have threatened both natural systems and human society [
1]. It should be noted that the economic losses and fatalities caused by climate change are not equally distributed among and within nations, regions, and communities [
2,
3]. It is certain that already vulnerable groups of people such as children and the elderly, lower socioeconomic persons, those with pre-existing health conditions, or communities with a high climate risk of exposure such as those living in low-lying areas, will be disproportionately affected by the impacts of climate change [
2]. In China, the mainland continuous coastline measures about 18,000 km on the western shore of the Pacific Ocean [
4]. It is acknowledged that in particular, the coastland below five meters is exposed to climate change and related hazards. Such a high-risk area in China is about 14.39 million km
2 and has more than 70 million inhabitants [
5]. The State Oceanic Administration of China has found that the annual rate of China’s sea level rise reached 3.2 mm from 1980 to 2016, much higher than the average rate of the world, and the sea level in 2016 was the highest during this period [
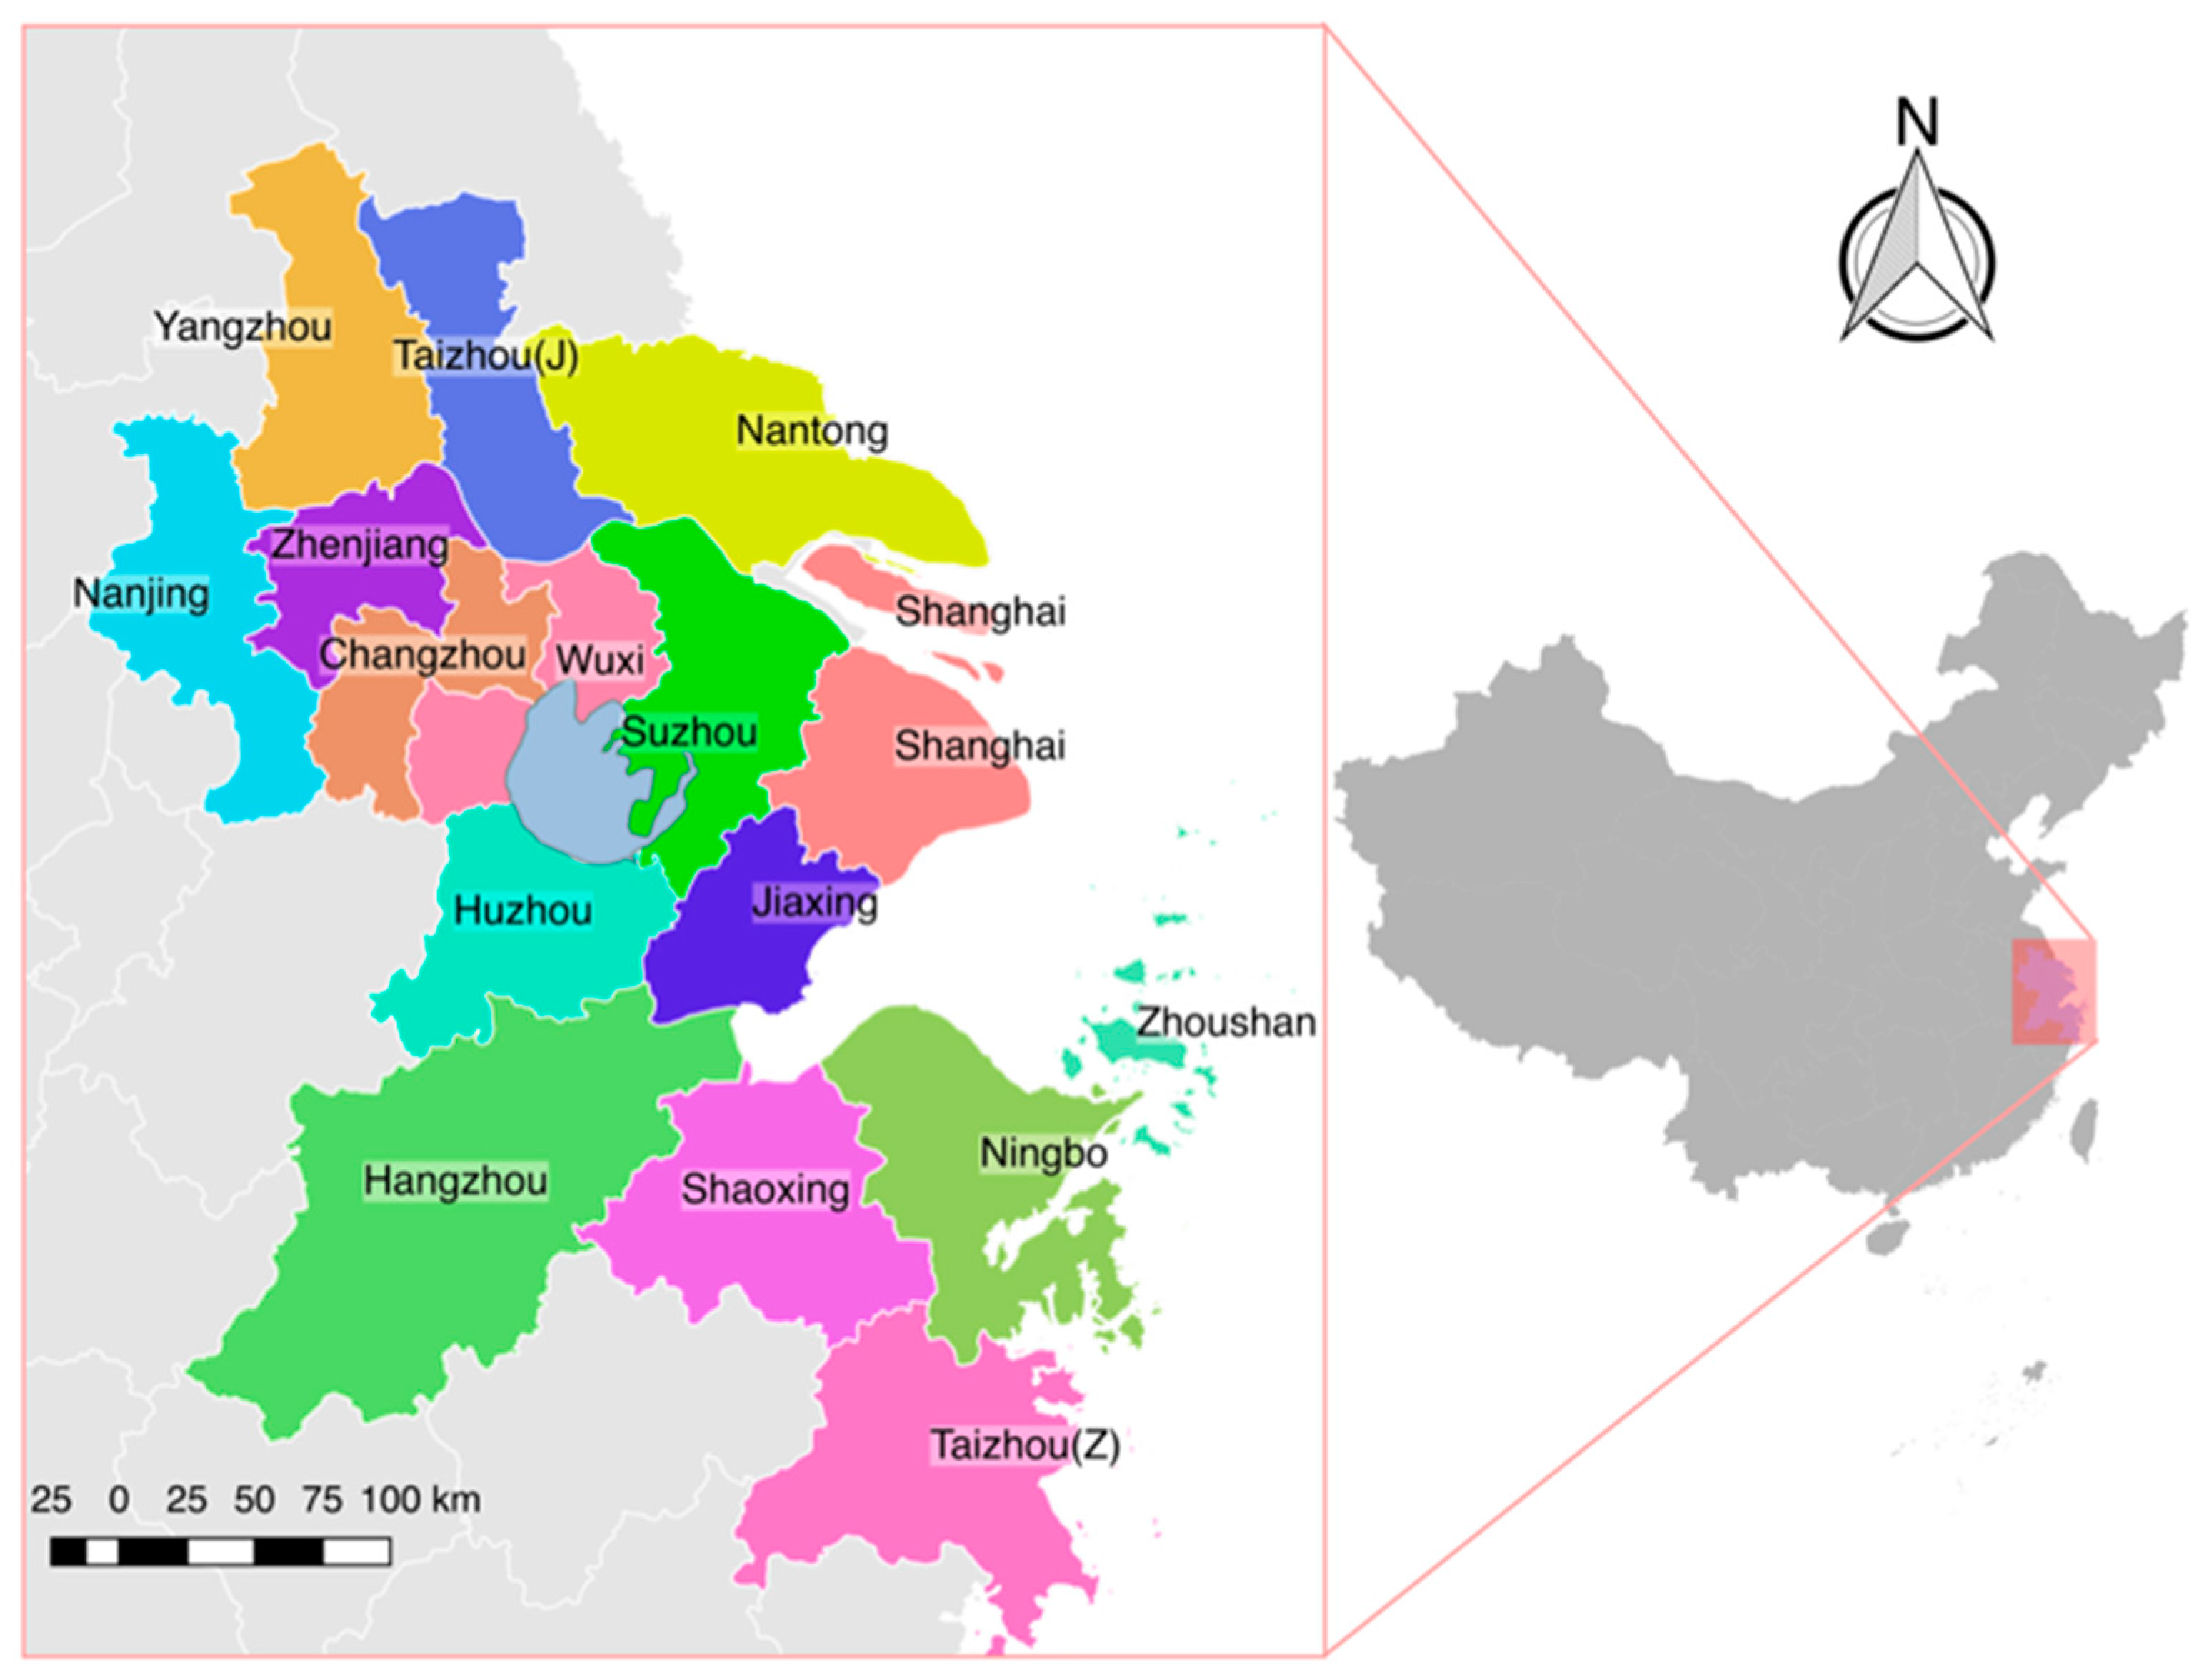
6]. Such rapid rates of rising sea level will bring to this country even more storm surges, flooding and sea erosion; furthermore, it will exacerbate the damage from these climate-related hazards. Located halfway along China’s eastern coastline, the Yangtze River Delta (YRD) is considered to be a high-risk area of climate change. It has been indicated that the YRD along with the Yellow River Delta and the Pearl River Delta are the most vulnerable coastal regions in China [
7]. Therefore, a good trial of social vulnerability assessment is required so that the vulnerable regions or groups can be identified and given more attention.
This paper focused on China’s social vulnerability to climate change and explored a modified approach based on the method of the Hazard Vulnerability Similarity Index (HVSI) [
8]. The remainder of the paper is organized as follows.
Section 2 of this paper situates the research within the literature that is directly relevant to social vulnerability to climate change or natural hazards, clarifies the methodologies for assessment, and describes their limitations; it also provides the whole process for assessing social vulnerability with our modified similarity-based method, and presents it in our case study of the Yangtze River Delta (YRD) region.
Section 3 presents a detailed analysis of the study results on social vulnerability to climate change.
Section 4 concludes with a discussion of our findings and some recommendations for future research and practices in assessing social vulnerability to climate change.
3. Results
Our results support the idea that social vulnerability can help decision makers find the focus of their mitigation works, where the efficiency of practices will then be improved. First of all, based on the ESI, SSI, ASI, and VSI matrixes, the referenced communities were found (
Table 4). According to our relevant research in this study area, practical works of local risk management and the statistical data in the “Atlas of Natural Disaster in China”, it was easy to compare these referenced communities. In detail, it was deduced that the SVI of Xianju County was definitely worse than Binjiang; then, Xianju County was the most vulnerable community, and Binjiang District was the least vulnerable community. Huangpu District of Shanghai was exposed less than Baoying County of Yangzhou; then, the former was the minimum and the latter the maximum. Similarly, Haimen County of Nantong was the least sensible community and Yuhuan County of Taizhou (Z) was the most sensible community; Xinghua County of Taizhou (J) lacked the most adaptability, and Shangcheng District of Hangzhou was the most adaptable [
56,
66].
Aside from helping calculate EI, SI, AI, and SVI in the process of assessment, this result is extremely useful for risk managers to bridge their professional knowledge and practice in their mitigation works. In detail, if managers of a district or county plan to reduce exposure, they can refer to the portfolio of Huangpu. The exposure of Huangpu District was the least that was calculated. If they want to reduce sensitivity, Haimen provides a good example. Furthermore, if they focus on improving local adaptability, they can follow the development of Shangcheng. Of course, if they plan to reduce social vulnerability directly, the portfolio of Binjiang District is worth taking into account.
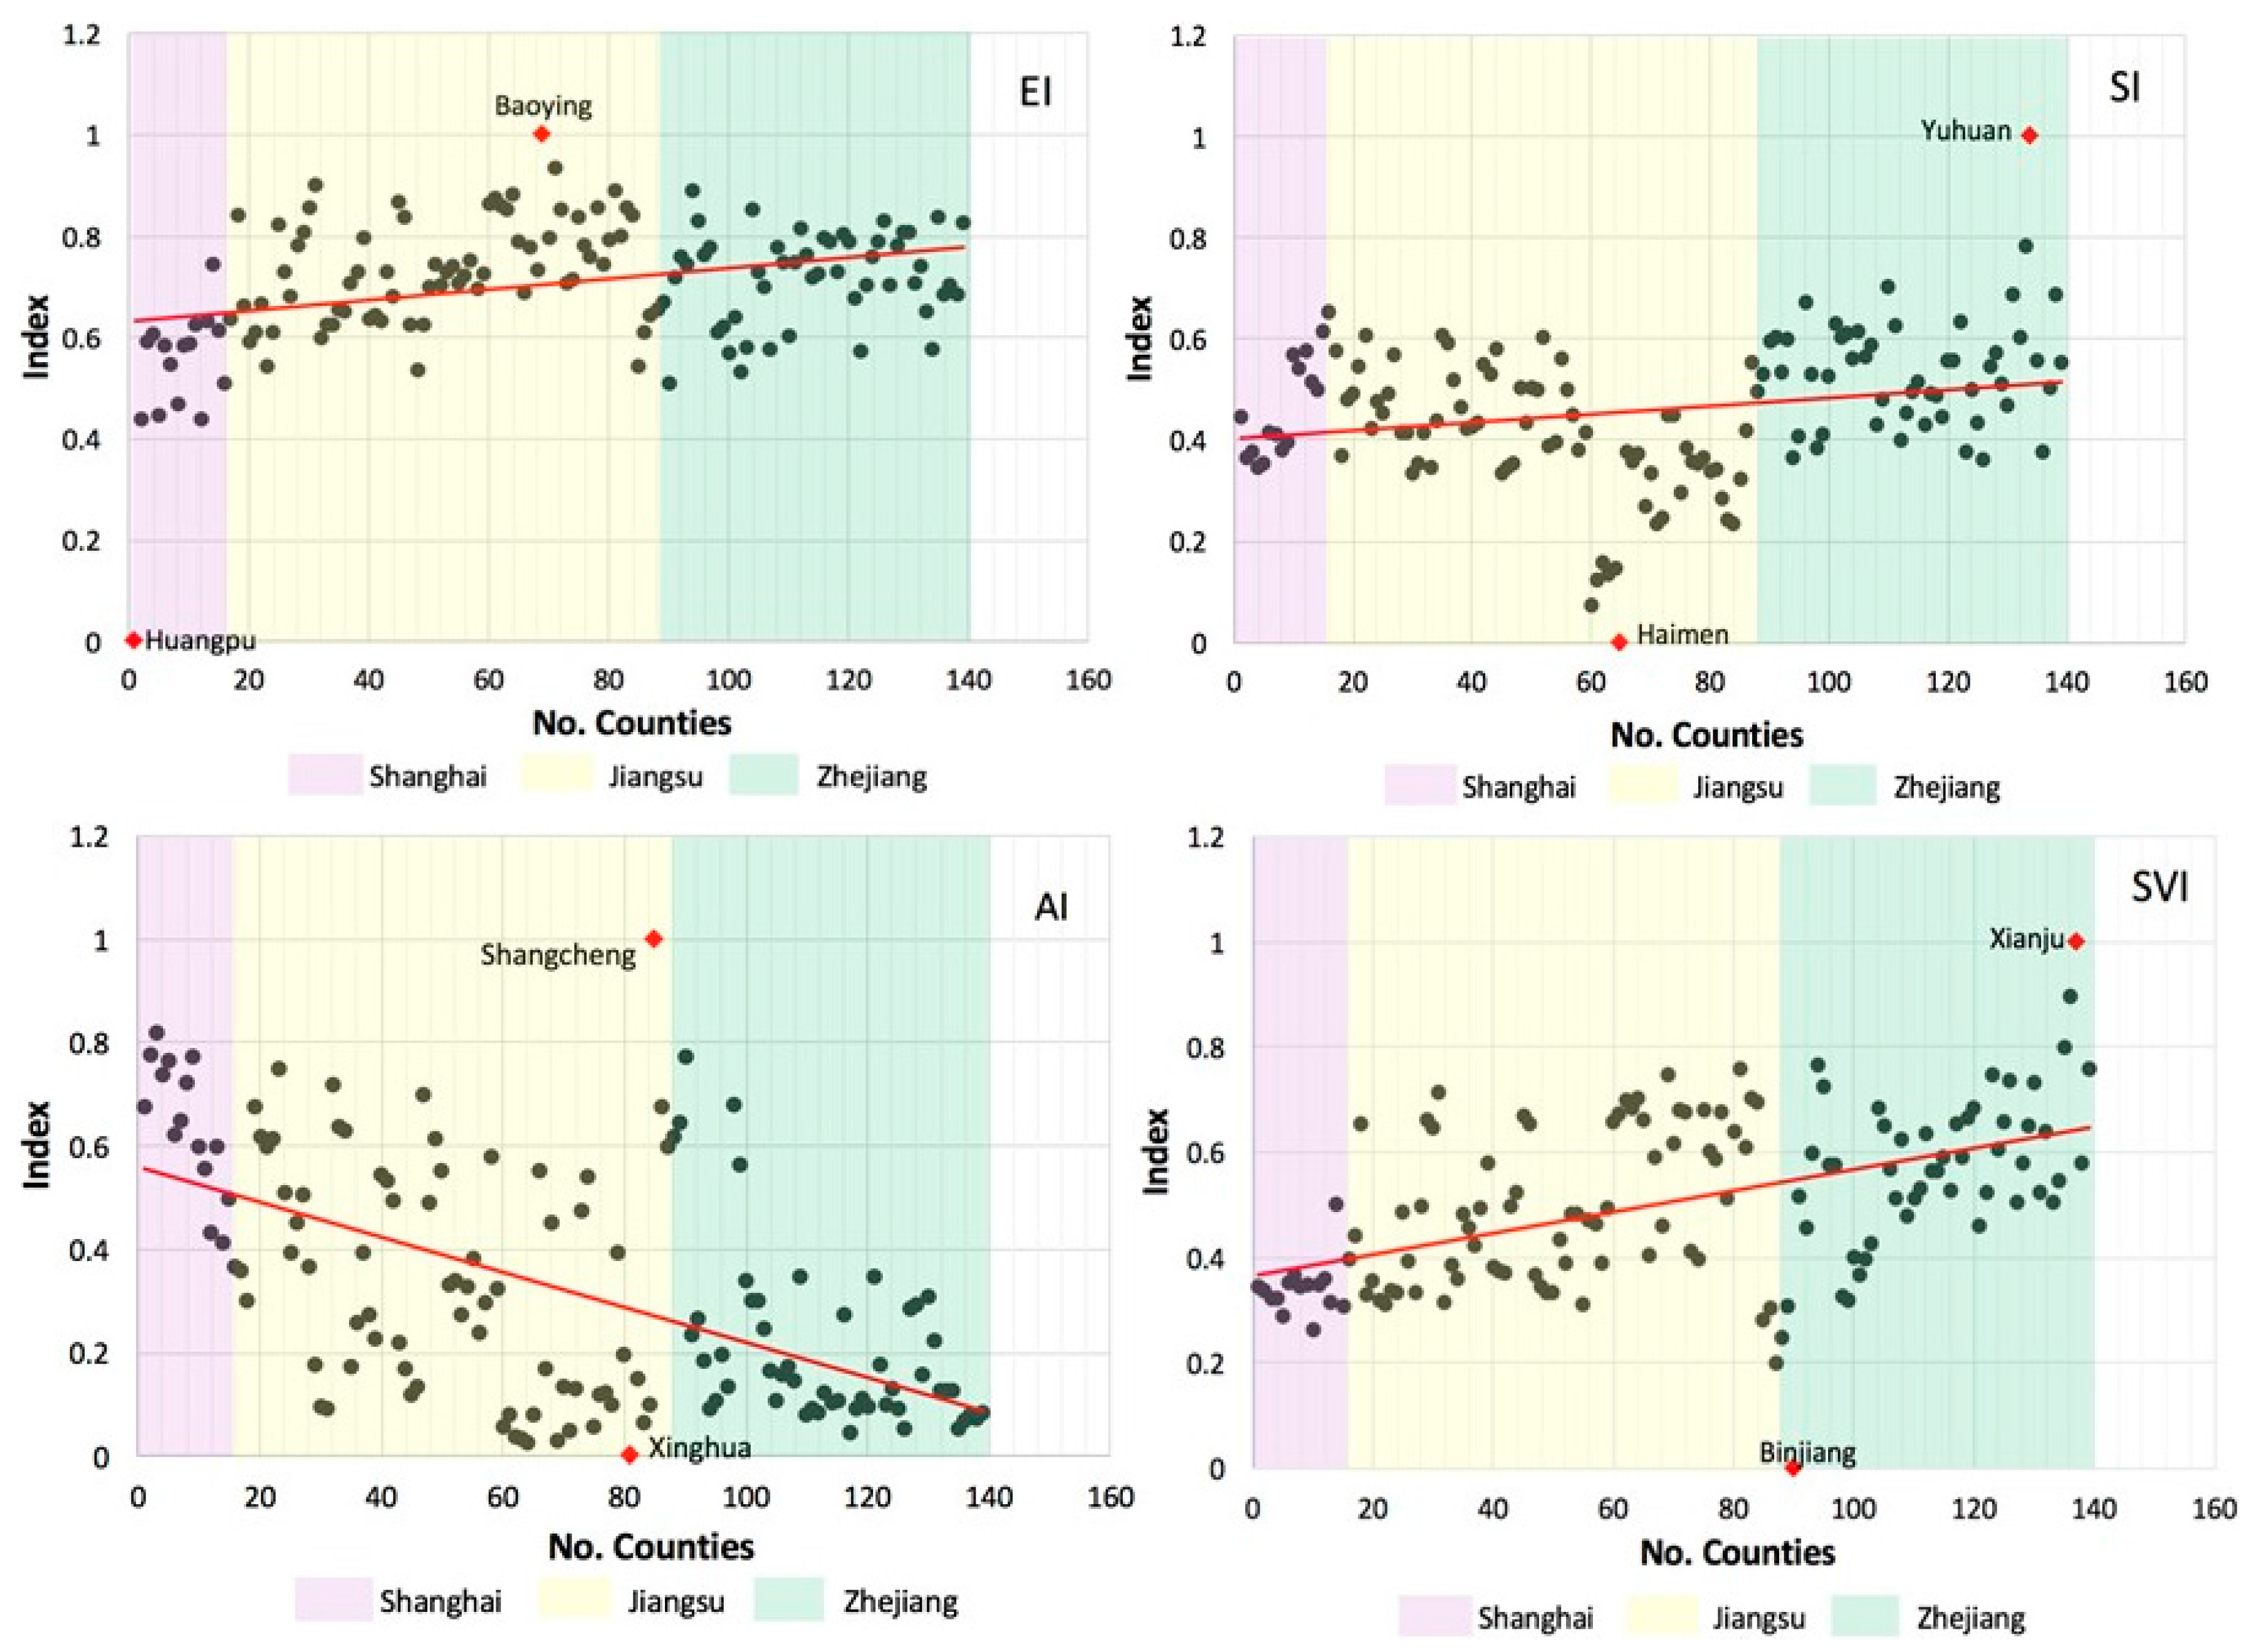
Table 5 shows the general statistics about exposure index (EI), sensitivity index (SI), adaptability index (AI) and social vulnerability index (SVI) of all counties in the Yangtze River Delta (YRD). More details can be found in
Figure 2. In this figure, counties from 1–18 belong to the Municipality of Shanghai, which are located in the purple zone, numbers 19–84 belong to Jiangsu Province that are located in the yellow zone, and numbers 85–139 belong to Zhejiang Province, which are located in the green zone. According to
Figure 2, several conclusions can be drawn. First, the condition of the counties’ adaptability was different based on the condition of exposure, sensitivity, and social vulnerability. In detail, from Shanghai, Jiangsu to Zhejiang, the trend of the adaptability index was decreasing, which meant that adaptability in Zhejiang Province was the worst, and adaptability in Shanghai was the best. However, the other three indexes all displayed an ascending order. Hence, exposure and social vulnerability in Shanghai were less than those of Jiangsu Province, and the exposure, sensitivity, and social vulnerability of Jiangsu Province were less than those of Zhejiang Province. Moreover, this picture of SI showed that many counties of Jiangsu Province (e.g., numbers 60–84) were less sensitive than that of the Shanghai Municipality and Zhejiang Province. Second, the average value of EI was the highest (0.707) and the average value of AI was the lowest (0.323). The average value of SI was 0.459 and the average value of SVI was 0.507. Thus, in general, counties in the study area had high exposure, medium sensitivity, low adaptability, and medium SVI. This result corresponded to the reality of the YRD region we alluded to previously: it is one of the most threatened by climate change in China. Third, the standard deviation of AI was the highest (0.236), while the value of EI was the lowest (0.125), which indicated there were the least differences in EI among all counties in the study area, but among them AI varied the most. Therefore, developing adaptability of the YRD region should be one of the most important and efficient works in the process of reducing social vulnerability to climate change.
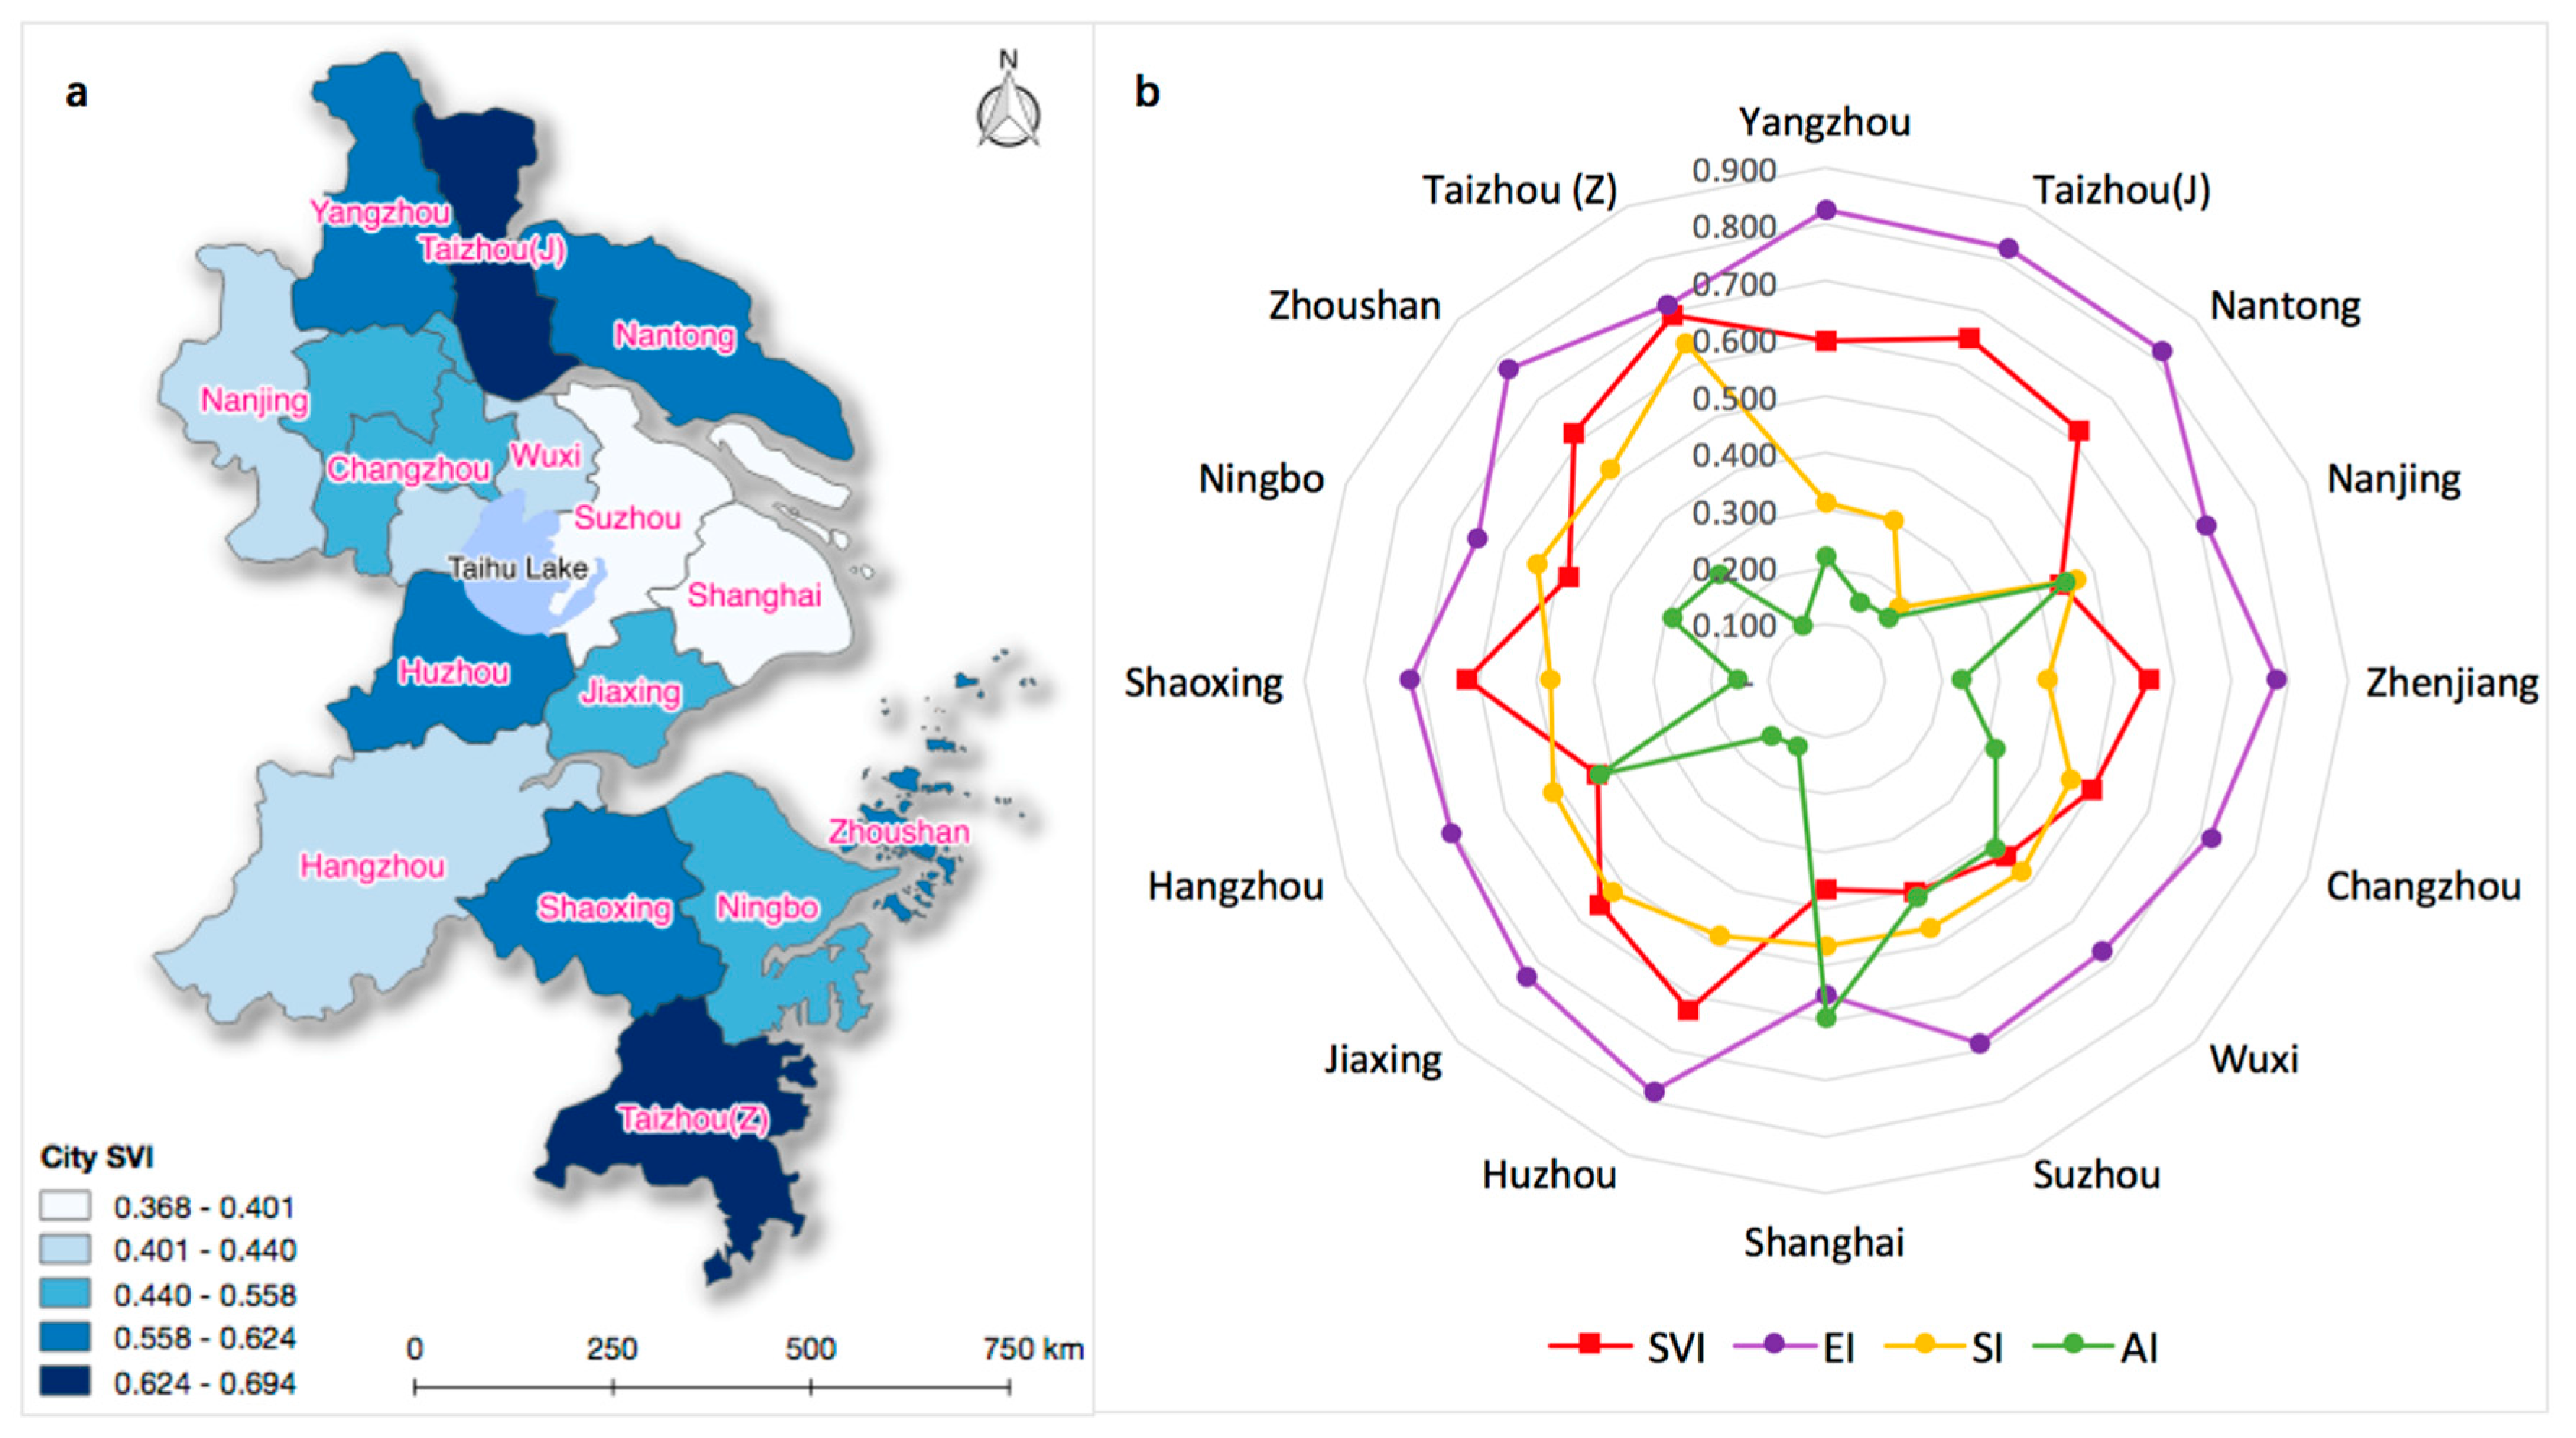
Figure 3a shows the spatial pattern of SVI of 16 cities in the YRD region. Taizhou of Jiangsu Province and Taizhou of Zhejiang Province are the most vulnerable to climate change. Adjacent to them, the cities of Yangzhou, Nantong, Shaoxing, and Ningbo are more vulnerable than the others. Suzhou and Shanghai together form the low zone of the SVI map. Cities of Nanjing, Zhenjiang, Changzhou, and Wuxi form a medium zone of the SVI map. Furthermore, the other medium zone located in the cities of Huzhou, Jiaxing, and Hangzhou. In conclusion, from the low zone (Suzhou and Shanghai) to the south or north, the SVI increased. In addition, the distribution of EI, SI, AI, and SVI is displayed in
Figure 3b from the cities in the northern part to cities in the southern part of the YRD region. First, the average values of EI were higher than the other three indexes, which again proves that the exposure to climate change in the YRD region is serious. Second, the distribution of EI, SI, and AI was similar to the SVI. Generally, Yangzhou, Taizhou, and Nantong belonged to one kind; Nanjing, Changzhou, Wuxi, Suzhou, and Shanghai were very similar; the cities of Zhejiang Province including Huzhou, Jiaxing, Hangzhou, Shaoxing, Ningbo, Zhoushan, and Taizhou (Z) were likely to be clustered. It should be noted that variation of AI was the largest: the values in the big cities (e.g., Nanjing, Wuxi, Suzhou, Shanghai, and Hangzhou) were all much higher than the other cities. This AI result relates closely to the economic characteristics of cities as shown in
Table 2, where the correlation coefficient between the AI and GDP of cities reached 0.84. Third, as is known, only adaptability was negatively correlated with social vulnerability, but the adaptability performance of the 16 cities’ performance was not as good: AI was much less than the SI and EI (except for Shanghai). This led to the SVI of 16 cities in the YRD region being high. However, it is worth noting that the four cities of Shanghai, Nanjing, Suzhou, and Hangzhou were much less vulnerable than the others due to their high adaptability.
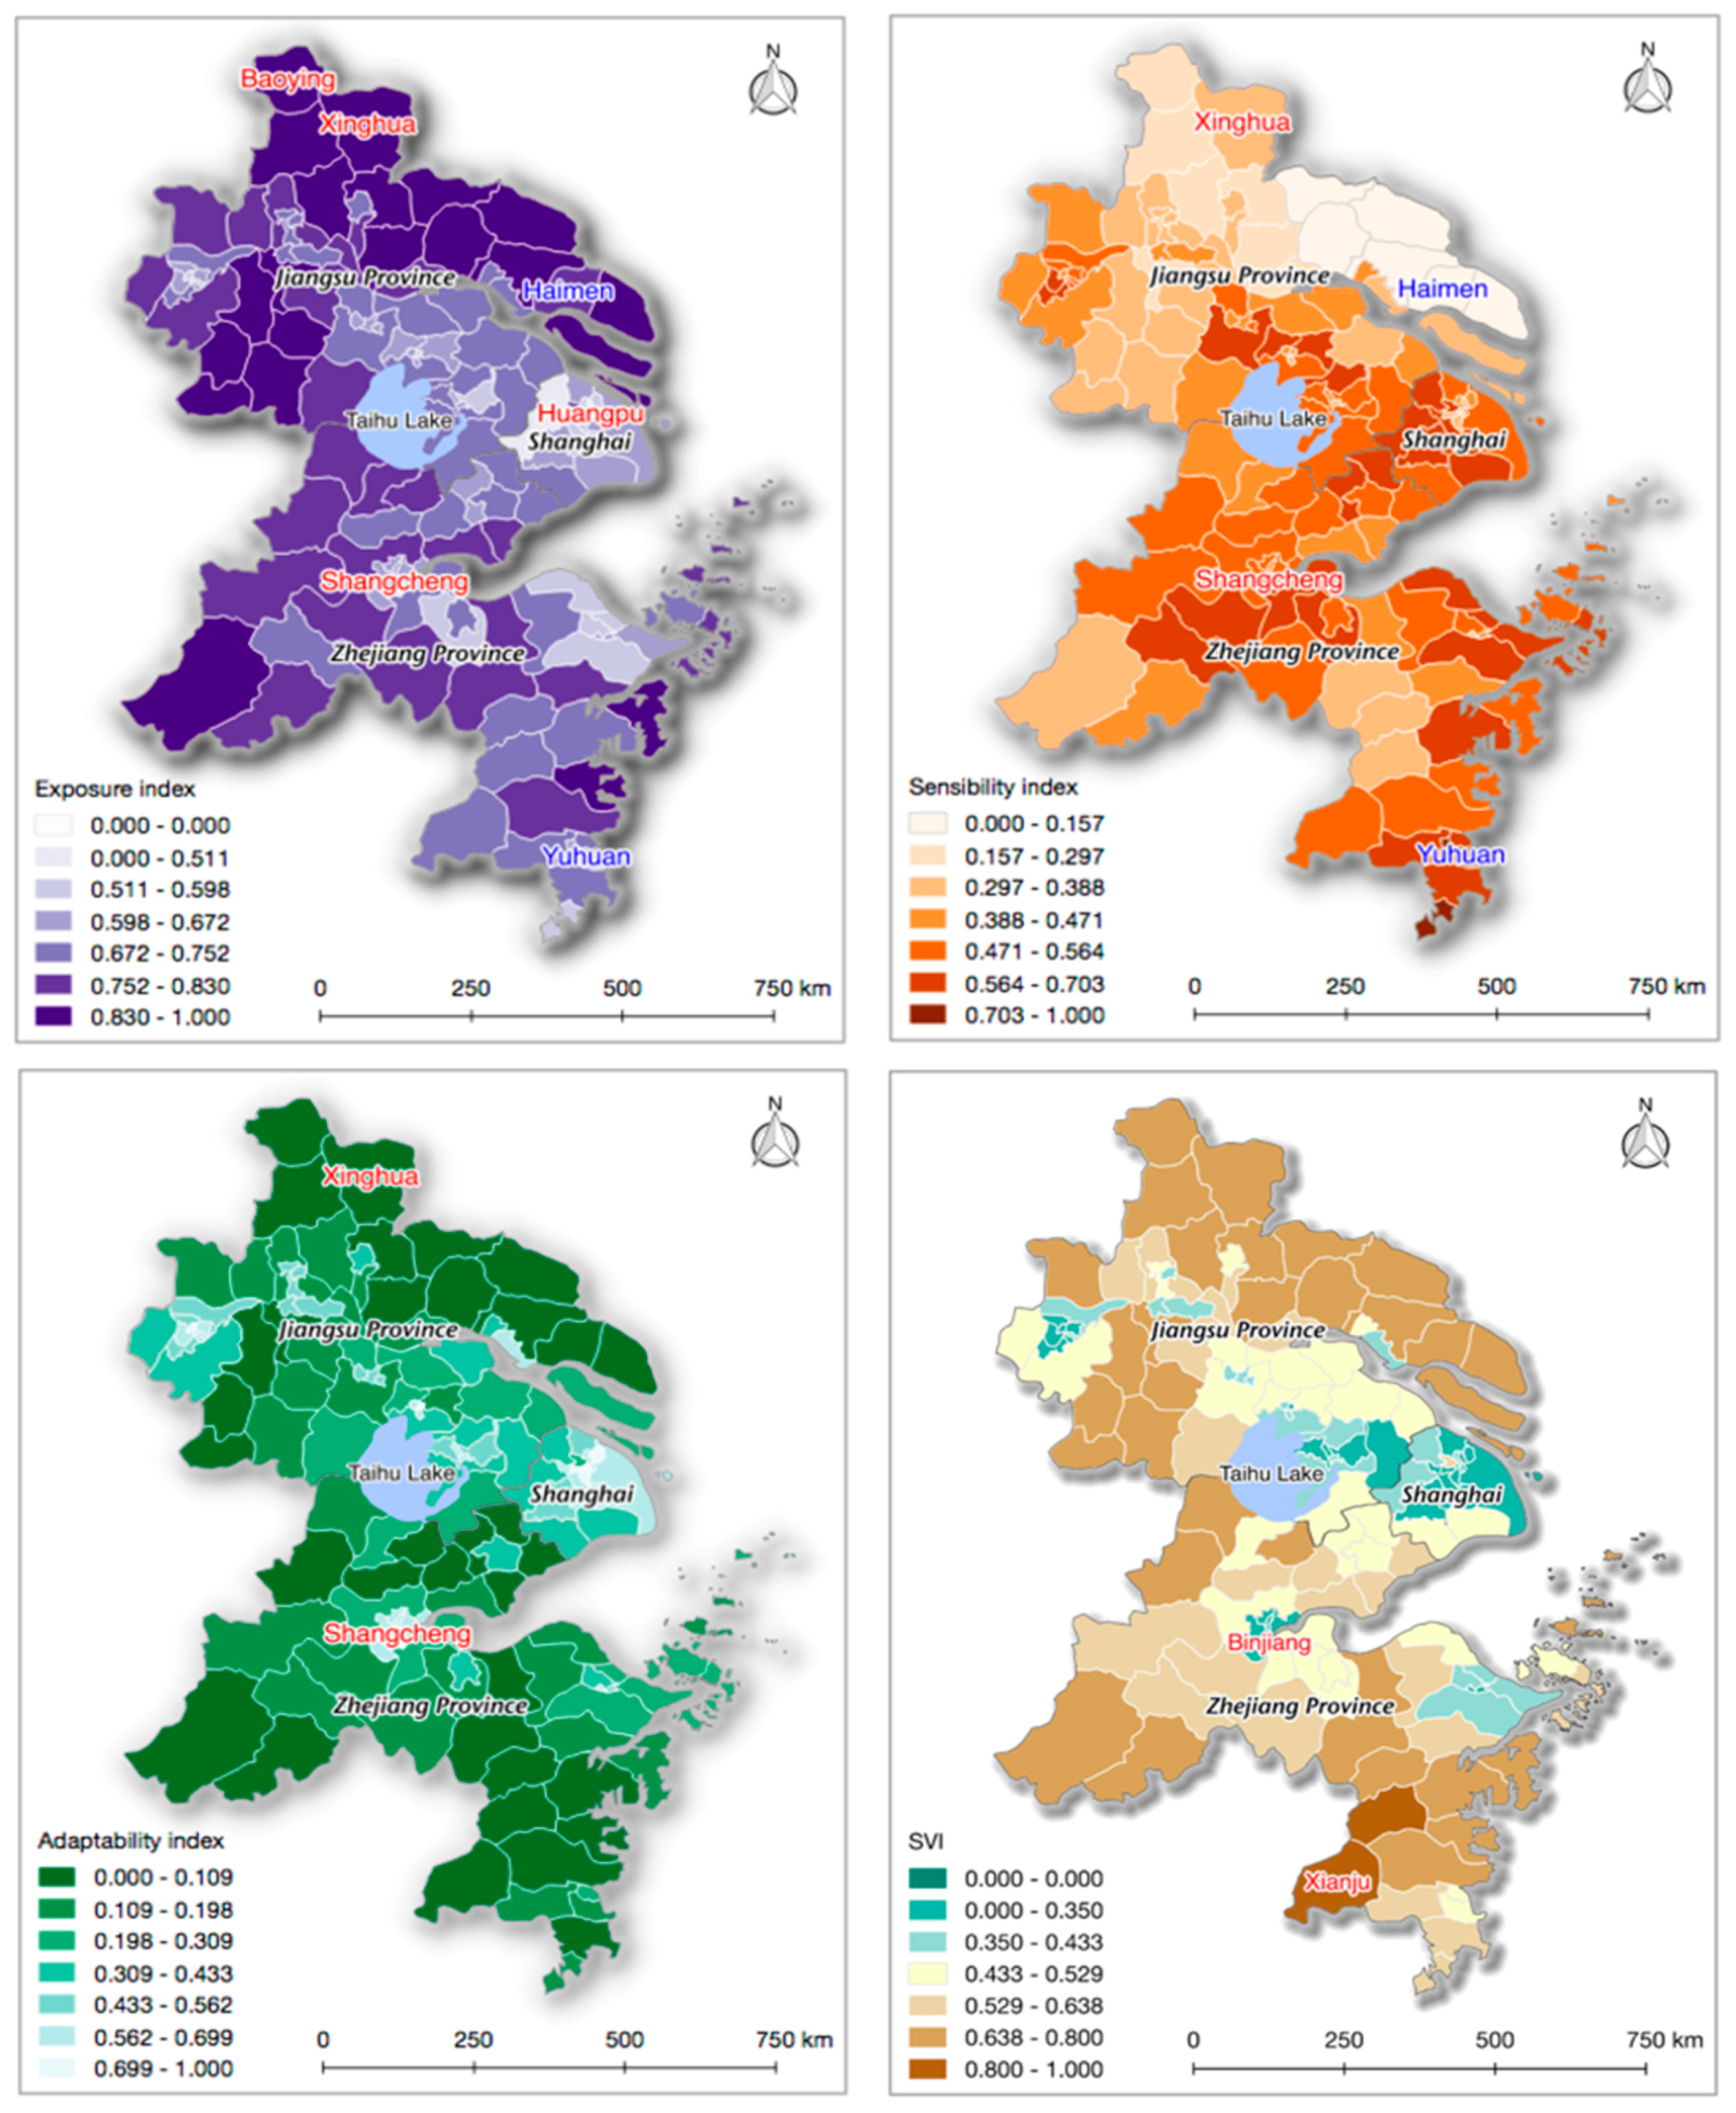
For the whole YRD region, more detailed information can be seen in the spatial patterns of EI, SI, AI, and SVI (
Figure 4). Based on
Figure 4, several conclusions can be drawn. First, although the deviation of EI in the YRD region was low according to
Figure 2, obvious variations still can be found in the spatial patterns. High EI was observed in the northern part of the YRD region, for example, the cities of Yangzhou, Taizhou, and Nantong; the western part including parts of Nanjing, Zhenjiang and Changzhou, and parts of Hangzhou City. This also indicated that the exposure did not simply relate to the distance from the locations to the coastline.
Second, a high SI emerged in the center of the YRD region such as Wuxi, Suzhou, Shanghai, Ningbo, and Taizhou. However, sensitivity in North Jiangsu Province was low, especially for Haimen County. Therefore, following the portfolio on the dimension of sensitivity in Haimen County is a feasible way to reduce sensitivity in other districts or counties. Compared to the distribution of the other two indexes (EI and AI), the number of counties with high values was less, which means the whole level of sensitivity was not very bad.
Third, low AI could be found in the Northern YRD (e.g., cities of Yangzhou, Taizhou, and Nantong), the Western YRD (some parts of Hangzhou City), and Southern YRD (Shaoxing City and Taizhou City). Based on
Figure 4, it was found that adaptability in most counties was low or medium-low.
Fourth, an overall high SVI was generally spread across the Northern, Western, and Southern parts of the YRD, especially, the Taizhou city in South Zhejiang Province. Though the sensitivity indexes of the main urban areas in Nanjing, Changzhou, Suzhou, Shanghai, Hangzhou, and Ningbo were high or medium-high, all of them had a low social vulnerability because of their low to medium EI and sufficiently high AI. This has provided another way to reduce social vulnerability: increasing the adaptability of communities can be useful if the exposure and sensitivity are not reduced.
Fifth, to evaluate whether the spatial patterns of four indexes were clustered, dispersed, or random, the Global Moran’s I was calculated. It was found that the Moran’s I of AI was 0.7196, which was bigger than the others. The next was the Moran’s I of SVI (0.7137), which was followed by the Moran’s I of EI (0.6232), and that of SI (0.590). Hence, there are geographical similarities to some extent.
Finally, the correlation coefficients of the indicators and indexes were calculated and are shown in
Table 6. Separately, the indicator of “Employees in primary industry” related most to SVI and the indicator of “Ethnic minorities” related to SVI the least. The indicator of “Renter” related to EI the most and the indicator of “Houses with no tap water” related to EI the least. As for SI, the indicator of “Elderly” related to it the most and the indicator of “Higher education graduate” related to it least. Considering AI, the indicator of “Urban residents” related to it most, while the indicator of “Ethnic minorities” related to it least. These results can help decision makers find the focus of their mitigation works to improve the efficiency of practices.
4. Discussion and Conclusions
A modified approach based on the HVSI method was explored in this paper and a pilot demonstration was provided to illustrate its practical use. The strengths of our method were that first, based on the similarity matrix, our modified method could provide a procedure to choose the referenced community objectively and conveniently. Secondly, our method ranked social vulnerability, exposure, sensitivity, and adaptability according to profiles of the similarity matrix and specific attributes of the referenced community.
With the modified method, our findings are summarized as follows. First, according to the matrixes of Exposure Similarity Index (ESI), Sensitivity Similarity Index (SSI), Adaptability Similarity Index (ASI), and Vulnerability Similarity Index (VSI), the crucial referenced counties were found: Huangpu District, Baoying County, Haimen County, Yuhuan County, Xinghua County, and Shangcheng District. Second, most counties in the study area had high exposure, medium sensitivity, low adaptability, and medium social vulnerability. Third, there were the least differences of exposure among all counties in the study area, but adaptability among them varied the most. Fourth, when focusing on the city-level scale in the Yangtze River Delta, it showed that the adaptability performance of the 16 cities was not so good: adaptability index was much less than sensitivity index and exposure index (except for Shanghai). This led to the social vulnerability of 16 cities in this region being high, whereas the four cities of Shanghai, Nanjing, Suzhou, and Hangzhou were much less vulnerable than the other cities due to their high adaptability. Fifth, there were geographical similarities in separate patterns of the exposure index, sensitivity index, adaptability index, and social vulnerability index. Finally, the indicator of “Employees in primary industry” related to social vulnerability index the most, the indicator of “Renter” related to exposure index the most, the indicator of “Elderly” related to sensitivity index the most, and the indicator of “Urban residents” related to adaptability index the most.
Though this modified method provided a new way for measuring social vulnerability to climate change and climate-related hazards, limitations still exist. First, there is still a lack of a consistent set of metrics to measure social vulnerability to climate change. In this paper, the indicators on the dimension of adaptability was less than the other two dimensions (exposure and sensitivity). Second, the missing data can be accepted and treated in this method theoretically, but the impact on results has not been evaluated apparently and accurately. Considering that data availability in China is one of the most crucial factors affecting indicator selection—especially at the county or town level—it is valuable and necessary to pay more attention to data incompleteness. Regarding the problem of missing data, this will particularly be explored and analyzed in our future study. After that, we will overlay our social vulnerability index with flood maps or other climate-related hazards to explore where vulnerable people are. Finally, validating the results of the social vulnerability assessment has remained difficult until now. Our results in this paper were not validated directly, but can be justified by similar research conducted in the Yangtze River Delta region [
66,
67]. Moreover, the results can be proven indirectly by differentiated patterns of socioeconomic status and demographic changes in the Yangtze River Delta region.


