The Spatiotemporal Dynamics of Natural Gas Imports in OECD Countries


1
Energy Development and Environmental Protection Strategy Research Center, Jiangsu University, Zhenjiang 212013, China
2
School of Mathematical Science, Nanjing Normal University, Nanjing 210042, China
*
Authors to whom correspondence should be addressed.
Sustainability 2017, 9(11), 2106; https://doi.org/10.3390/su9112106
Submission received: 20 October 2017
/
Revised: 7 November 2017
/
Accepted: 14 November 2017
/
Published: 16 November 2017
Abstract
:The natural gas receives universal attention and priority use around the world because of its high quality and cleanness. The Organisation for Economic Co-operation and Development (OECD) countries’ data on imports of natural gas are rich in market information and have foresight. We quantify the role of the market in resource allocation. Based on the random matrix method, this article studies the correlation coefficient matrix of OECD countries’ natural gas imports by average correlation coefficients and explores the information that the natural gas imports market contains. At the same time, this article analyzes the risk and correlation in the OECD countries’ natural gas imports market by eigenvalues, regression analysis and absorption. Finally, combined with the clustering method, we synchronize and regionalize the OECD countries’ natural gas import market. We can find that the OECD countries’ natural gas imports are related by analyzing the correlation coefficient and the risk. Correlations in OECD countries’ natural gas imports market are high. We find that different eigenvalues have different effects on the OECD countries’ natural gas imports market by researching on the entropy of the eigenvalues. We can correctly predict the turning points of OECD countries’ natural gas imports and find the correlation coefficient matrix contains advanced market information. Through the method of absorption rate, the risk of the gas import market in OECD countries is further studied. It is found that the import of natural gas in OECD countries is large and the whole market is unstable. Through the method of dynamic clustering, it is found that the whole OECD countries have high synchronism in the market of natural gas import, except for Germany.
1. Introduction
As an efficient, safe and clean energy, natural gas plays an important role in reducing global temperature. It is also the new favorite of the international energy trade. With the rapid development of their economies, organization for Economic Co-operation and Development (OECD) member countries are increasingly attracted to the cleanness and efficiency of natural gas. Various countries have begun to reform the natural gas industry. Due to the high oil prices in the country, the United States began to switch to use natural gas and sped up the construction of natural gas pipelines in 2003. Due to the shortage of natural resources, Germany’s natural gas imports once reached 66% of the total use in 2015 [1]. In recent years, countries such as Australia, Canada, Norway and the Netherlands have begun to transform natural gas because of the increasingly damaging ecological environment, which has greatly increased the demand for natural gas. Therefore, analyzing the actual situation of gas imports in the world is of great significance to the whole market.
Countries attach great importance to natural gas. Meanwhile, due to the imbalance of natural gas reserves and the large use of natural gas in various countries, and it has aroused the discussion of academic issues. At present, many experts and scholars have launched a great deal of research on the impact of natural gas imports on the economy and society.
As a clean energy, the global natural gas reserves are rich and the strategic reserves of natural gas plays an important role in the development of the global economy and society. The analysis and research of the OECD countries’ natural gas import quantities has a certain directivity function to the natural gas trade between the OECD member countries, and avoids the blind and vicious competition brought by natural gas imports. Thus promoting the stability of the whole natural gas import market can promote the economic improvement of all countries. Research and analysis of the natural gas import market of all OECD countries will also help us to explore the international gas market, and then explore the interaction between the OECD countries’ natural gas import market and the international market.
In this paper, we take OECD natural gas import as an example to study the OECD import market and we get the quantitative characteristics of OECD natural gas import. OECD market description of natural gas imports stimulates the dynamic mechanism of description.
As can be seen from Figure 1, the market dynamics are manifested in volatility due to changes in natural gas imports, so OECD natural gas imports implied changes in market conditions. Under the influence of a market dynamic mechanism, the characteristics of market operation are stimulated, such as market risk, market operation state, inflection point, synchronization, stability, etc. Using these features, we can effectively evaluate the current market operation, and then get the next market with quantifiable features.
The innovation of this paper is to study the correlation coefficient matrix of the OECD countries’ natural gas import market by using stochastic matrix theory, and analyze the risk and correlation of the whole OECD countries’ natural gas import market through its average correlation coefficient. Secondly, by means of eigenvalue entropy and feature combination method, this paper divides the market of natural gas import of OECD countries and obtains 8 different stages. By talking about the inflection point of the average import volume of the OECD countries’ natural gas import market and the discontinuity of the regression coefficients, we find that the volatility inflection points of the OECD countries’ natural gas imports can be predicted. Based on the absorption rate and the average correlation coefficient, it is found that the whole OECD countries have high synchronism in the market of natural gas import, except for Germany.
This paper is organized as follows: first part is the introduction and literature review. In the second part, the correlation coefficient matrix is analyzed and its implied market information is excavated. These include the selection and standardization of data, the smoothness test, the establishment of the correlation coefficient matrix of the OECD countries’ natural gas import volumes, a correlation analysis of the OECD country’s natural gas import market, a feature combination, a regression analysis and an OECD gas market division. The third part uses the absorbance rate to study the risk of the natural gas import market in OECD countries. At the same time, the synchronization of the natural gas import market in OECD countries is studied by dynamic clustering method and the natural gas import market in OECD countries is divided. The last part is conclusion.
Specific research framework is as follows: using the random matrix, we can find the latent information of the import of natural gas in OECD countries, which is not available in other statistical methods. Through the analysis of regression coefficients, we can get some information about the market of natural gas import, such as risk, synchronization and so on.
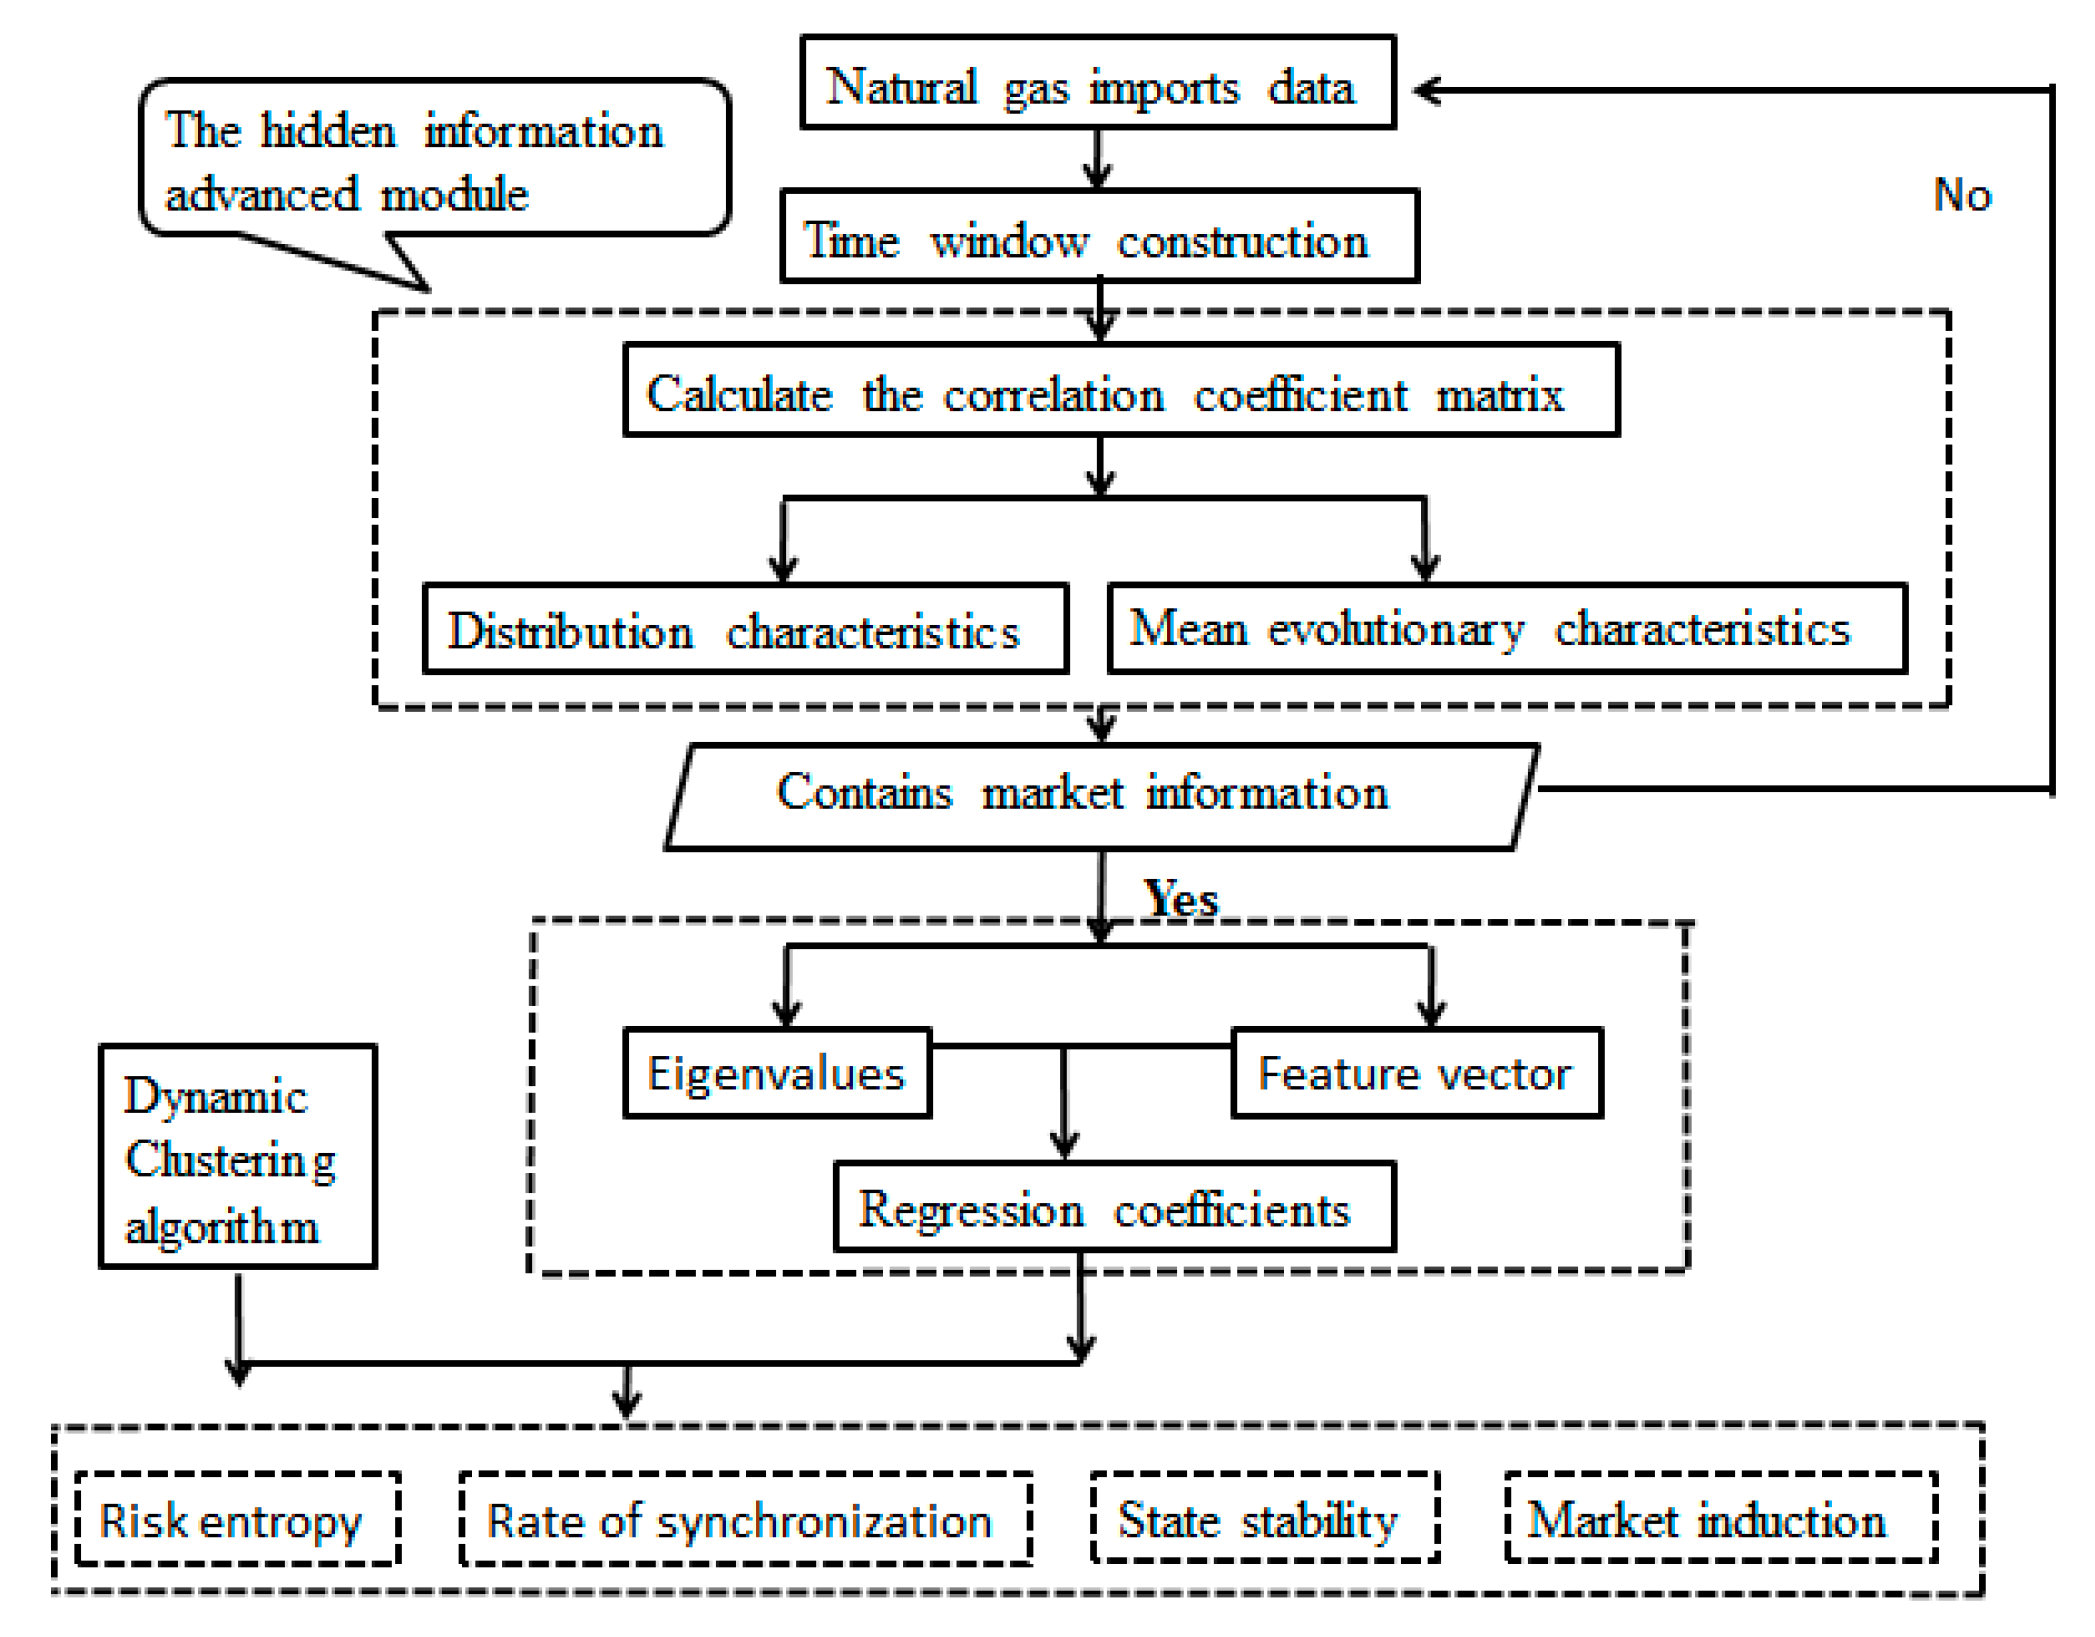
As shown in Figure 2, we first process a selected set of data, construct a moving window and find the correlation coefficient matrix. Then the average correlation coefficient is analyzed to extract the information of the whole natural gas import market of OECD countries. Meanwhile, in order to further analyze the natural gas import market and divide the whole natural gas market of OECD countries, we investigate the entropy and feature combination. Finally, we utilize the regression coefficient and absorption rate to characterize the OECD natural gas import market risk, and study the OECD country’s natural gas import market synchronization and regional division of the market.
2. Literature Review
2.1. Literature Review of Stochastic Matrices
The stochastic matrix theory can reflect the random deviation degree of the real data and reveal the behavior characteristics of the whole association in actual data by comparing the statistical characteristics of the stochastic multi-dimensional time series. It is this particular view that makes the matrix widely applied in the fields of physics and science.
In the early stage of development, random matrix theory is mainly used to solve the problems encountered in scientific experiments. Since then, stochastic matrix theory has been widely used in many fields, such as physics, mathematics and communication. Mehta system expounded the theory of random matrices and introduced biorthogonal polynomials, skew orthogonal polynomials and their applications [2]. Based on the stochastic matrix theory, Plerou and Gopikrishnan, et al. selected the stock data of the 1000 largest companies in the United States, and analyzed the correlation matrix of stock price volatility [3]. Tulino described the application of the basic constraints of wireless communication channels on the basis of stochastic matrix theory [4]. Varsha Kulkarni analyzed the volatility of the Indian stock market based on stochastic matrix theory [5]. Based on the knowledge of stochastic matrix, Meng and Xie used absorption rate, linear regression and clustering methods to study the correlation degree and division of the American real estate market, and found that the risk of the American estate market was very high and the whole market was unstable [6,7]. Tian, et al. investigated the information and characteristics of the international crude oil market (1999–2015) based on the random matrix theory [8].
2.2. Literature Review of Natural Gas Import
Wang and Lin established Gray Model for China’s natural gas production and import/export data for the period 1980 to 2010 and found that China’s foreign gas dependence would be respectively 41% in 2015 (about twice the level in 2012), 61% in 2020 and 78% in 2025 if only conventional gas was developed [9]. Tian used the 2011 oil and liquefied petroleum gas China net oil imports data analysis for the China oil and gas trade, and found from research that Chinese natural gas production growth had been reduced to 7%, but imports increased, and import dependence was expanded to 25% [10]. Through the study of Russia, Australia and Japan and other countries import gas details, Ma and Han summed up some import and export experience [11]. It was found by Sen that the two countries needed to cooperate with each other to ensure mutual import, and import of natural gas through data analysis and policy analysis of natural gas imports from India and Pakistan [12]. Dong and Kong established the Cointegration Model to study the relationship between China’s natural gas import, market risk and natural gas import costs. The results show that the corresponding impact on gross domestic product (GDP) is 2305.2 million Yuan, assuming a 10% increase in China’s NGIRs. Some suggestions are proposed to improve China’s long-term natural gas import security such as improving early warning services for maritime disaster risks [13]. Maxwell and Zhu examined the import of liquefied natural gas in the United States by using monthly data on LNG imports from 1997 to 2007 [14]. Jia, Geng and Fan used the panel cointegration method to study the impact of international oil prices on natural gas import prices in the three major natural gas markets. The results show that both global economic activity and international crude oil prices have significant long-term positive effects on regional natural gas import prices. The volatility of international crude oil prices has a negative impact on regional natural gas import prices [15]. Egging proposed the equilibrium model of natural gas market, explored the uncertainty of shale gas reserves, and analyzed the impact of the risk of natural gas market on the investment behavior of natural gas suppliers in Poland and Ukraine [16]. Batten, Cliner and Lucey studied the price spillover effects of natural gas and crude oil markets over time from 1994 to 2014. The research shows that in a large part of our sample the natural gas price leads the price of crude oil with price spillover effects lasting up to two weeks [17]. Bernstein and Tuladhar used the global natural market model, a broad EMF 31 scenario, to assess the destination and level of LNG exports in the United States. By studying the reserves and prospects of natural gas in Central. The authors concluded that limiting U.S. LNG exports is inconsistent with simulated uncertainties and it should be left to the market to determine the levels and destination of exports [18]. Kang concluded that the focus of the reform of the economic system lies in the further prosperity of China’s oil and gas market [19]. Egging and Holz studied gas consumption and supply in Europe, North America and China, and investigated the various possible risks of infrastructure and trade in the natural gas market structure [20]. Vivoda explored major regional importers’ approaches to LNG import diversification between 2002 and 2012 and explains why patterns of LNG imports differ between states and over time [21]. Shi et al. explored the uncertainty of China’s natural gas market and analyzed the causes of uncertainty, while quantifying the impact of the uncertainty on the world’s natural gas market [22]. Vivoda found that Asia’s natural gas trade had been dominated by long-term market structures, besides, liquefied natural gas and crude oil prices remained indexed [23].
3. The Empirical Analysis
Due to imbalance in natural gas production and use of OECD countries, the inevitable trend in a large amount of imported natural gas has been observed. Natural gas imports have also led to the instability of the natural gas market. This chapter is based on the standardization of natural gas import data from selected OECD countries and the testing of smoothness. We construct the correlation coefficient matrix, and analyze the average correlation coefficient to excavate the market information of natural gas imports. By combining the characteristics of the combination of knowledge, selecting and studying the first three eigenvalues, through the establishment of a linear regression model in the case of OECD countries, we further study the natural gas import market and the market stage.
3.1. Data
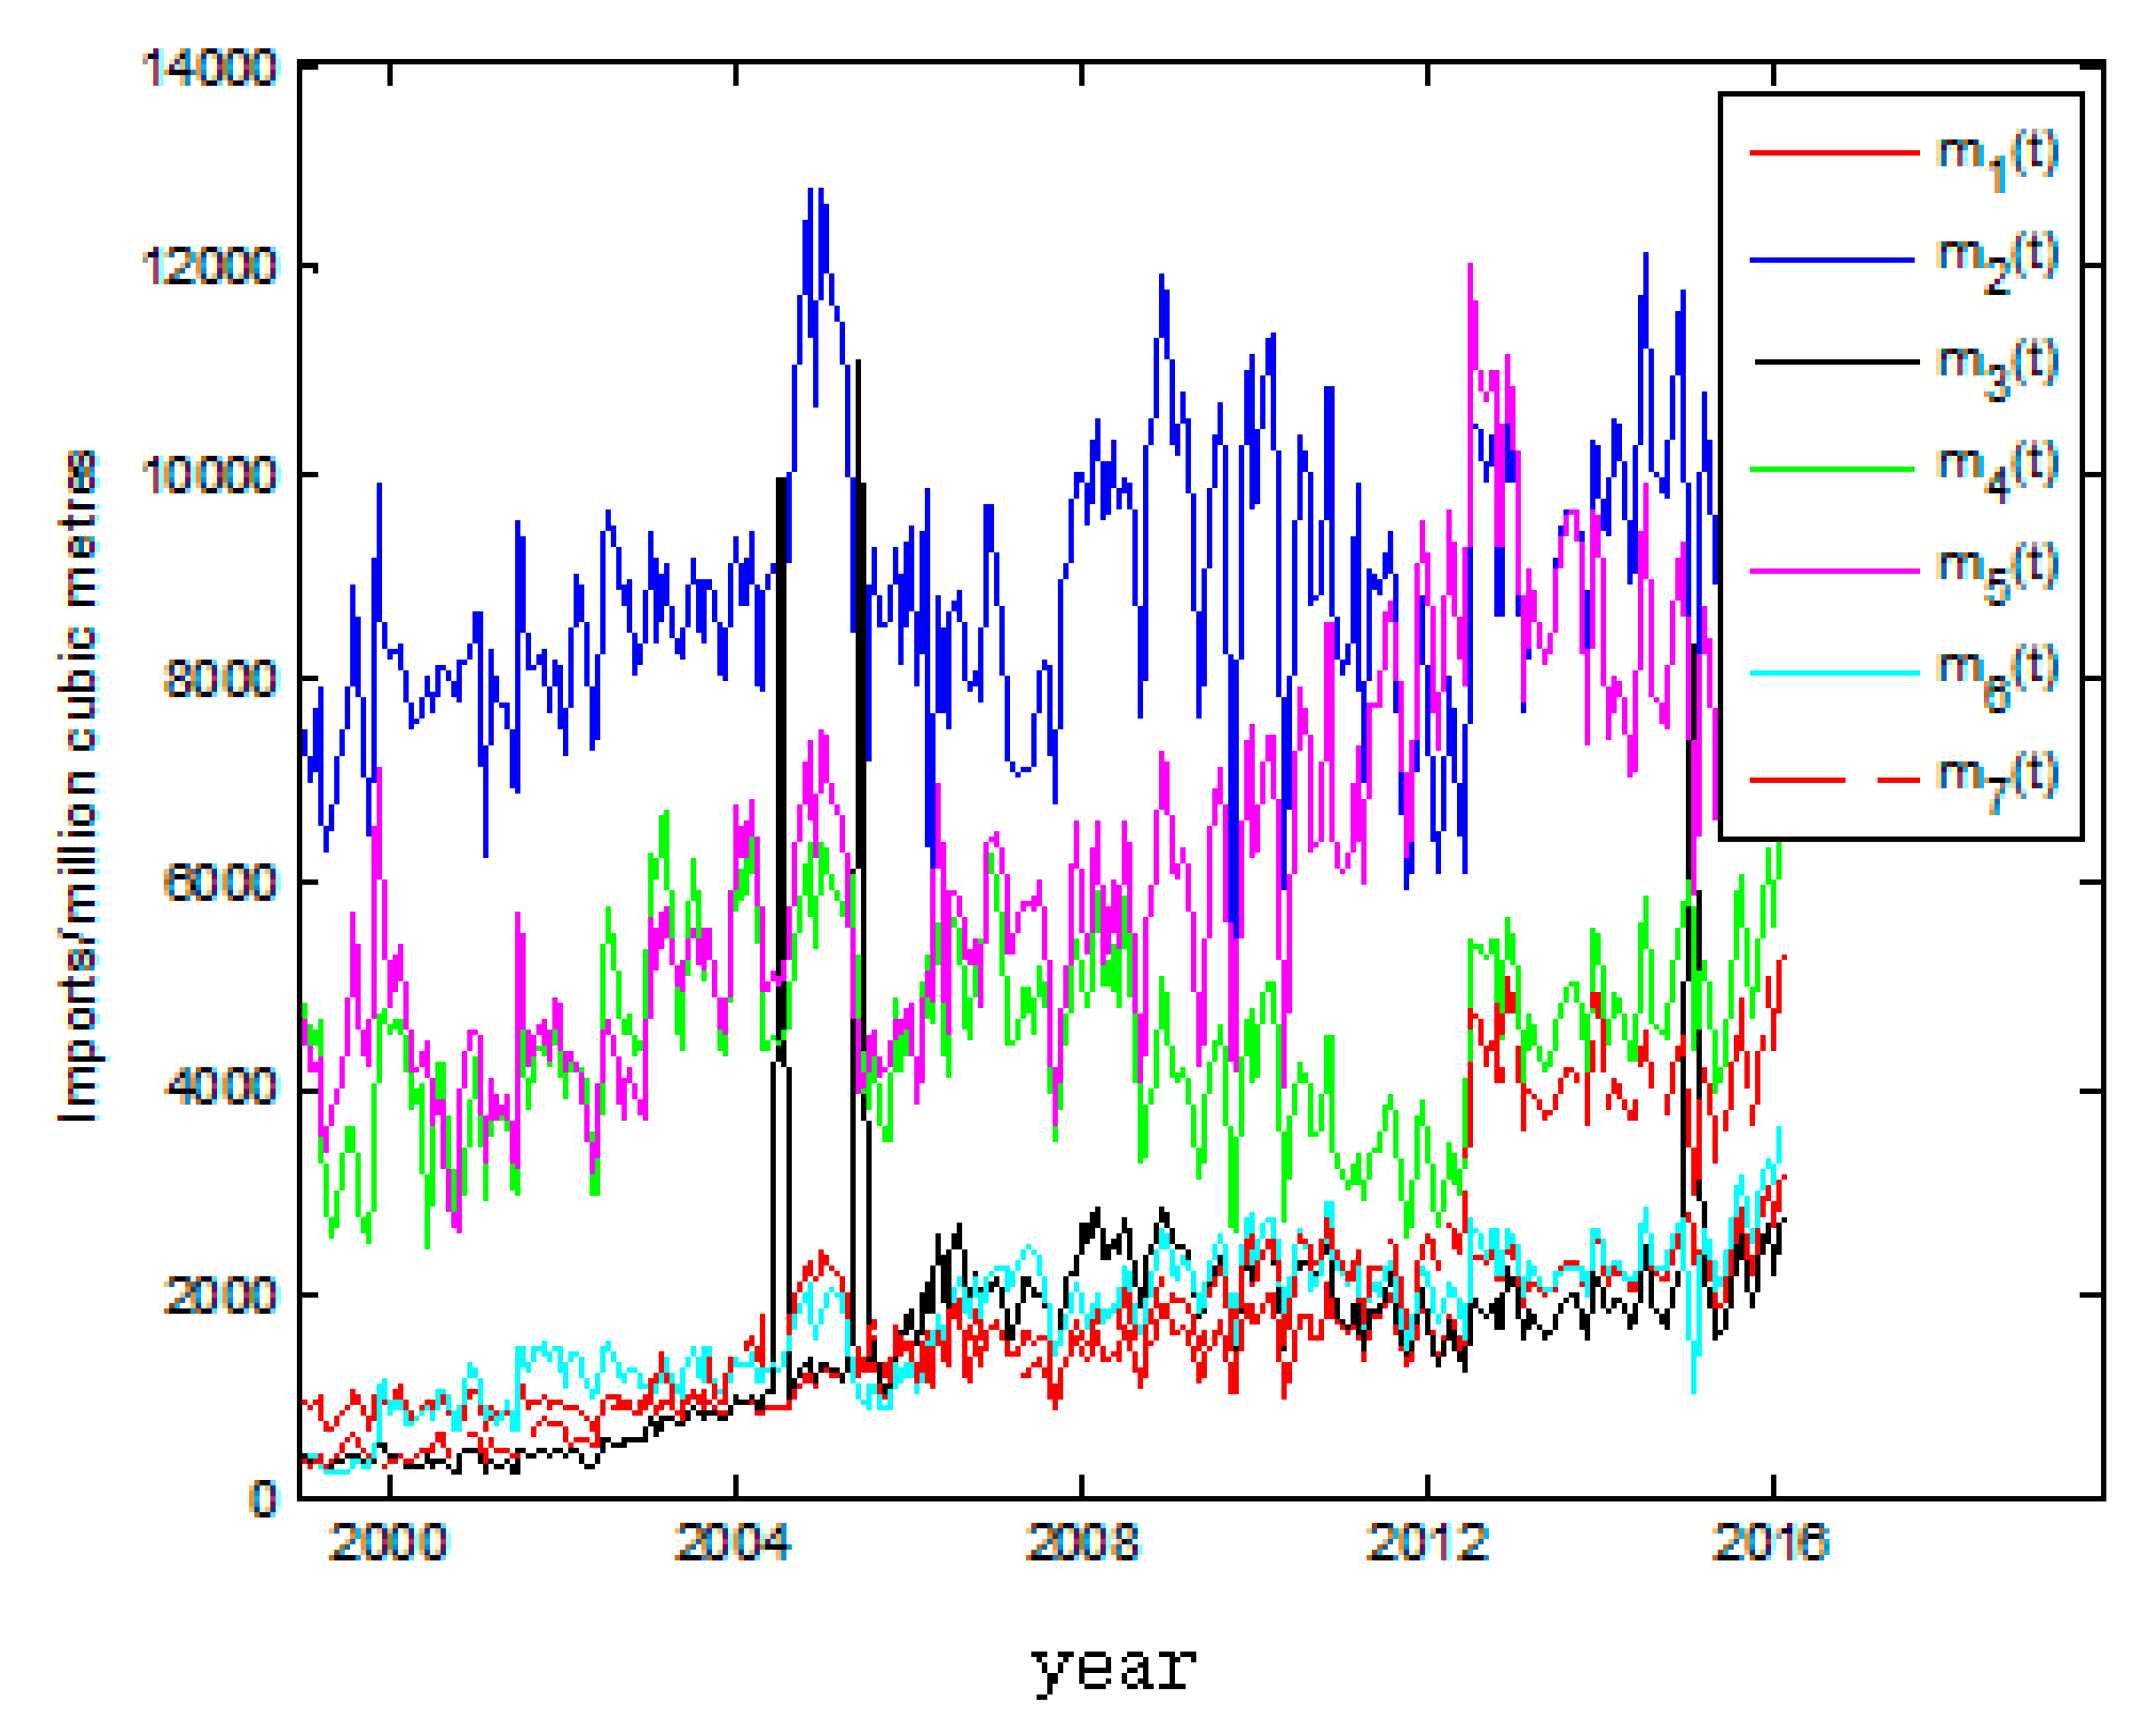
The data come from the monthly natural gas imports in Australia, Canada, Germany, Netherlands, Norway, Britain and America from January 1991 to February 2016. The number of samples is 1442 and every region has 206 data points. The data on imports of natural gas in these seven countries are, respectively, . The data are shown in Figure 3.
In the OECD countries, the import of natural gas is implied by the market information. Based on the matrix, considering the big gap between the seven countries’ natural gas imports, we firstly standardize the data using Equation (1).
Then the logarithmic variable at time is defined as
The is called the researching index. For each moving window at time of size , we compute the correlation matrix ,
where and are the sample means and and are standard deviations of the two countries and respectively. Then we can obtain the researching index and . Figure 4 shows the standardized data.
3.2. Establishing the Moving Windows
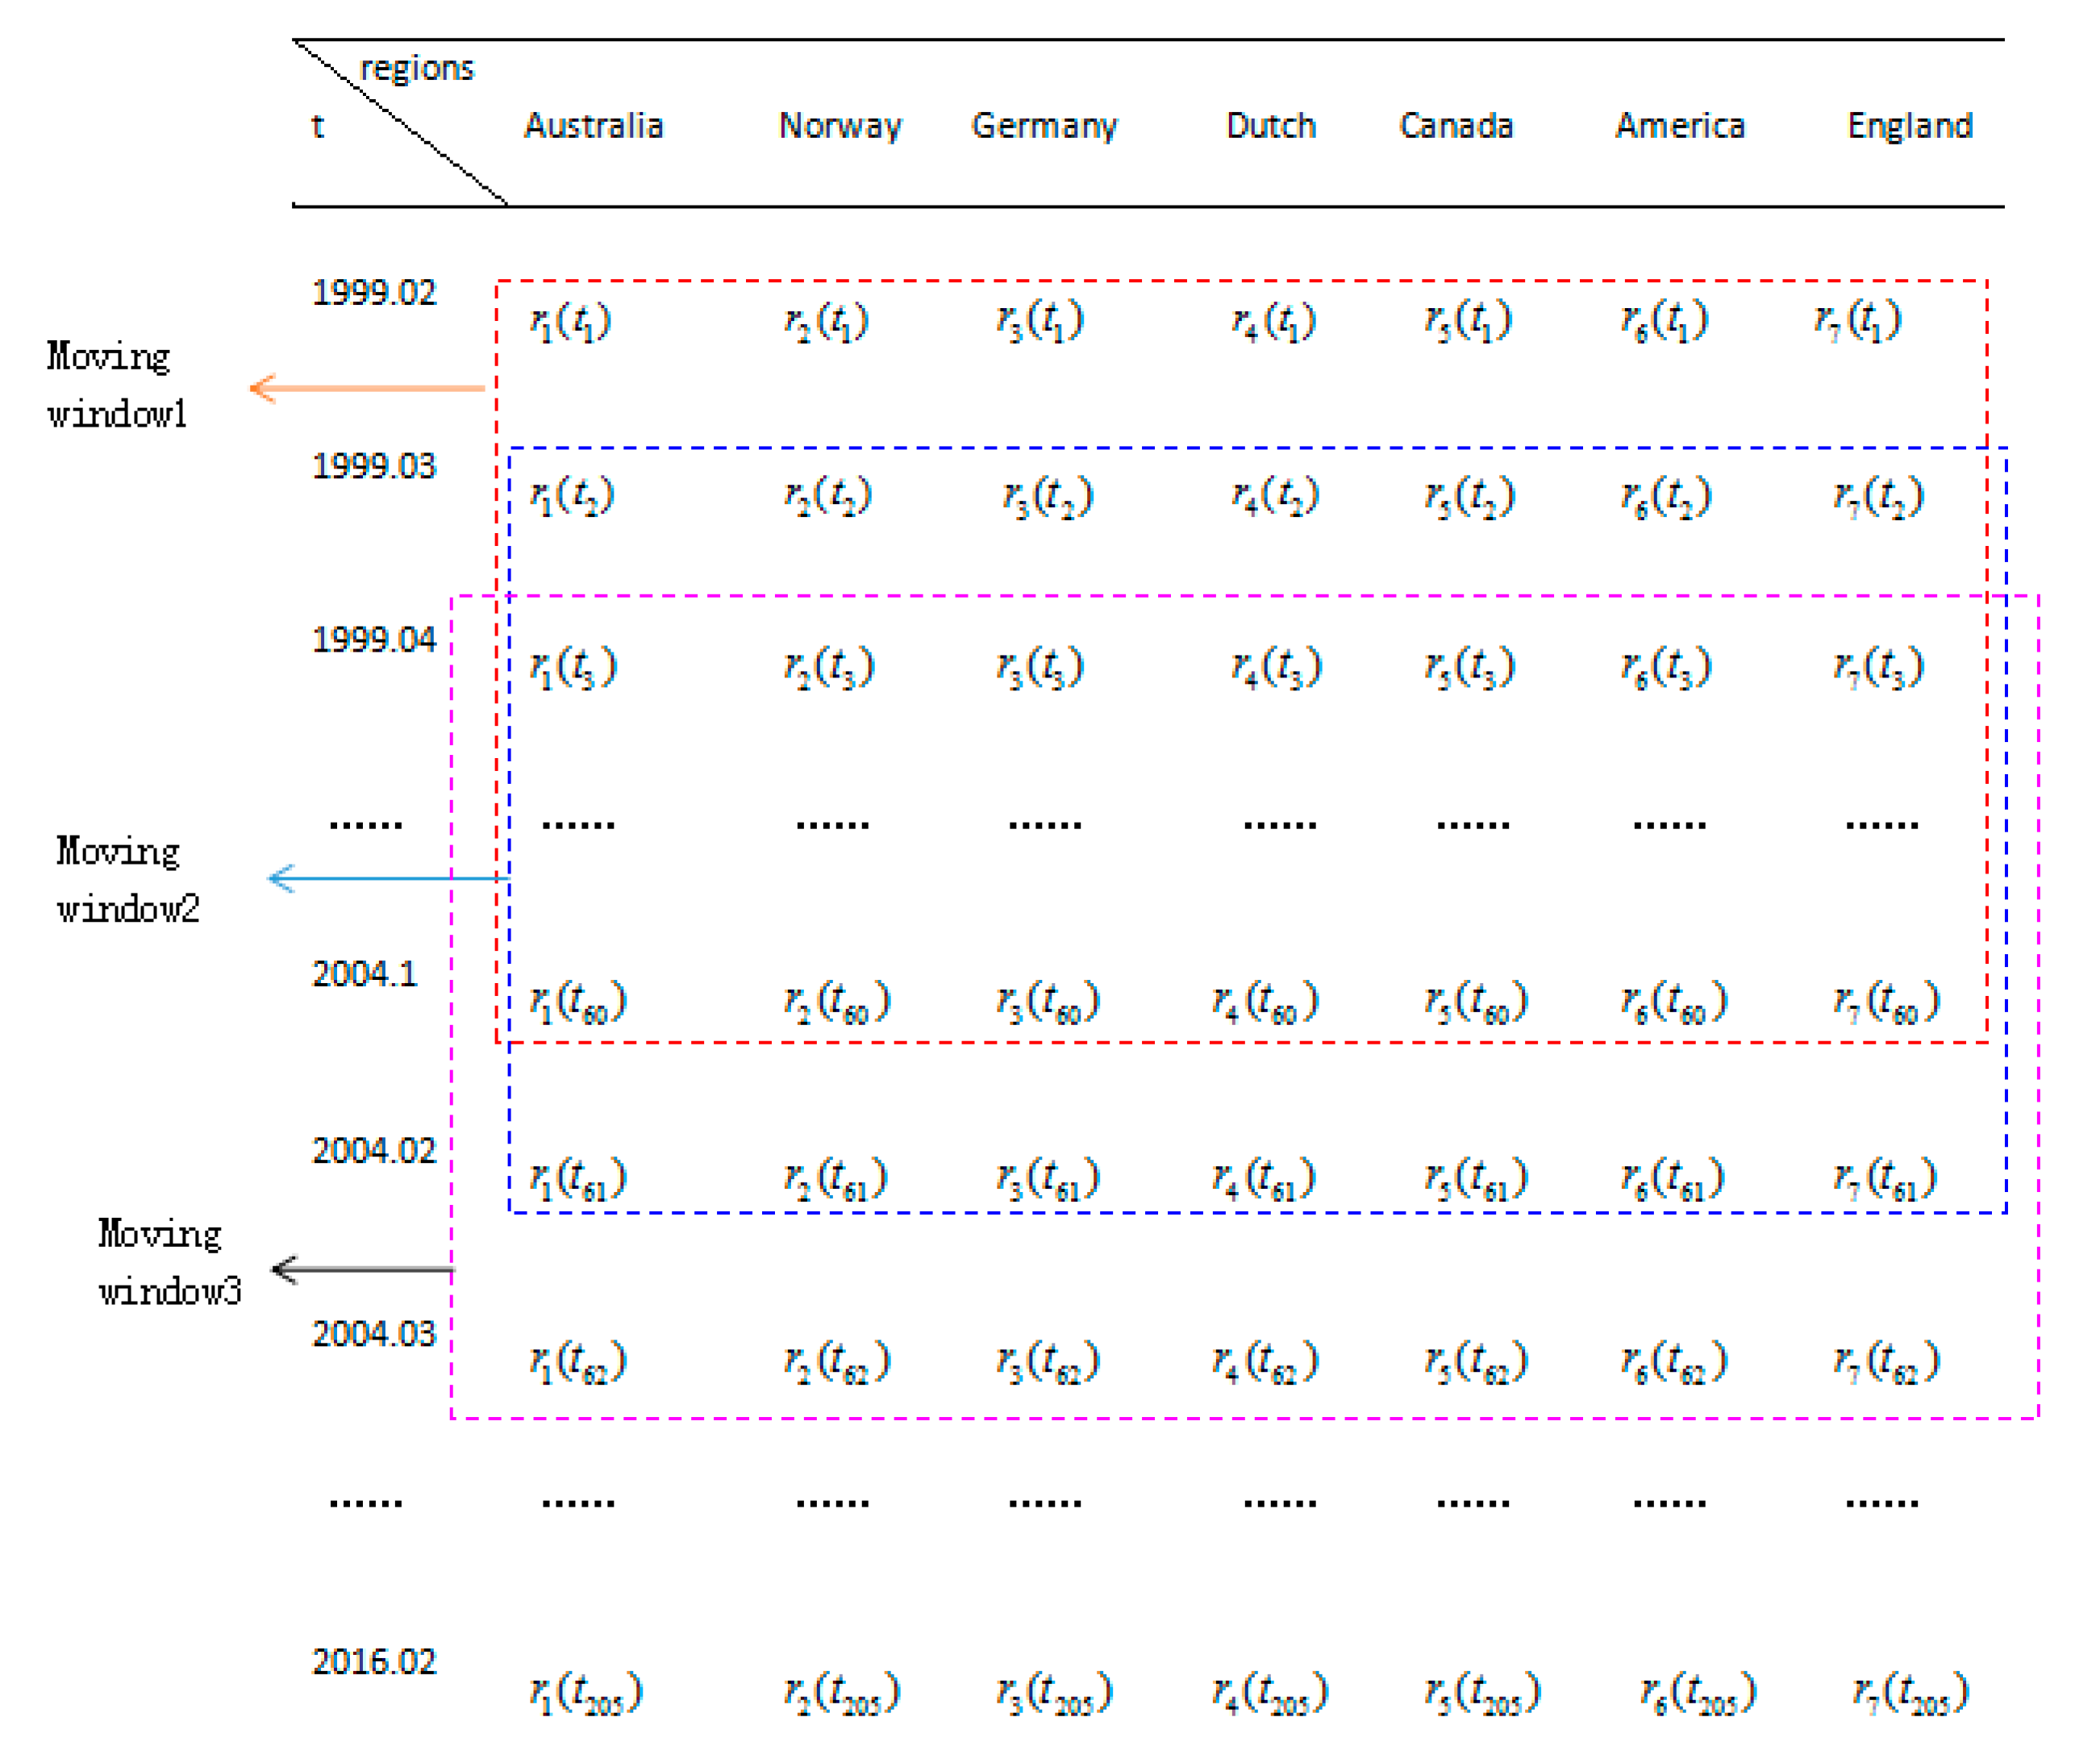
We establish the moving windows based on the chosen data and the length of moving window. Here and . Figure 5 shows the moving windows.
3.3. Probability Density of Correlation Coefficients
In general, the Pearson correlation coefficient is used to measure the correlation between natural gas imports in OECD countries. In order to study the correlation of the import market as a whole, we first analyze the correlation between the standardized time series.
According to the definition of , it is easy to get that ; If , it means that it is completely positive correlation; if , there is no relevance, if , there is completely negative correlation.
In the process of specific study of correlation coefficient , because of the change of the import volume of natural gas in OECD countries, the relationship between the OECD countries has been changing. There are many factors that will affect the correlation coefficient and interfere with one’s judgment. Therefore, in order to ensure the accuracy of , we can test the random matrix and correlation coefficient in matrix of Natural Gas Import Correlation Coefficient in OECD countries, through the difference between the two to identify the credibility of the correlation coefficient. If the correlation coefficients of the two images are uniformly distributed, the interference is indicated. If the correlation coefficients between them are different, then it is very reliable to say that contains the authenticity.
The distribution difference of the correlation coefficient between the matrix and the random matrix is shown in Figure 6, Here we use the row, column of the Gauss sequence to simulate the construction of random matrix, calculated 1000 times, the average value of . We can find that not only the center but also the symmetric distribution is zero. On the contrary, the correlation coefficients of the import volume of natural gas in OECD countries are asymmetric distribution and the mean value is all greater than 0. As a result, the OECD countries are associated with the import of natural gas and are not independent. It is easy to find that the correlation degree of natural gas import in OECD countries varies with time through the difference of mean value of correlation coefficient.
3.4. The Analysis of Average Correlation Coefficient
Firstly, the average correlation coefficient of the OECD country gas imports was calculated, as shown in Figure 7. The average correlation coefficient indicates that OECD has a high degree of correlation with the total import of natural gas. In early 2004, the natural gas with the advantages of convenient cleaning had been paid more and more attention. The import of natural gas had become the inevitable trend of economic development in many countries. The average correlation coefficient of the overall market of imports of natural gas began to rise gradually at about 0.15 L to June 2005. What’s more, due to the impact of the Iraq war in the end of 2004, the average correlation coefficient of natural gas imports’ overall market slightly decreased by about 0.06. In August 2005, the OECD countries issued a series of policies to re-regulate the natural gas market, leading to the natural gas market into a fierce competition. As OECD countries also gradually reduced sectorial interference to strengthen market management, the import volume of natural gas in countries began to change, resulting in the deadline of the overall average correlation coefficient, until 2008, 0.38. After 2008, with the impact of the global financial crisis, the average correlation coefficient increased rapidly. In the following three years, the average correlation coefficient of natural gas import market continued to rise. After 2011, with the recovery, the OECD countries began to carry out large-scale mining and import and export of oil, making the average correlation coefficient of the natural gas import market decline. By the beginning of the 2013, due to the gradual development of science and technology, natural gas utilization rate and the improvement of natural gas pipelines in the world, natural gas had become more and more favored by countries. By the beginning of 2015, the average correlation coefficient of natural gas import market gradually increased. It had risen about 0.13. In the year of 2015, the natural gas pricing mechanism change intensified, natural gas price was high, while the oil and coal and other fuel prices had fallen sharply. All those series resulted in the average correlation coefficient beginning to decline sharply. In June 2015, due to the strengthening of the OECD countries’ modern supervision of the gas industry, while the government intervention greatly weakened, the whole OECD countries’ gas import market had picked up, and its average correlation coefficient gradually increased. Overall, from the beginning of June 2015, with the steady growth of the world economy, the global natural gas industry began to enter a new era. The average correlation coefficient of the OECD countries’ natural gas imports market continued to rise, meaning that because of the association degree of OECD countries’ imports of natural gas market had been strengthening constantly.
3.5. Researching on the Entropy of Eigenvalues
Kenett defined the entropy of eigenvalues as
where , and is the eigenvalues of correlation matrix.
By analogy with the information entropy, the characteristic value entropy has the following characteristics:
- 1)
- , If the value is 1, the remaining values are 0, that ; otherwise, ;
- 2)
- For a given , when all equal, then gets the maximum value of 1.
Therefore, according to the definition and nature of eigenvalue entropy, we can get .
The mare close to 0 is, the more information eigenvalues imply.
The virtual red line in Figure 8 shows eigenvalue entropy of the correlation matrix, “◊” blue features of removing the largest eigenvalue of the value of entropy. According to Figure 8 and Table 1, the eigenvalue entropy of the correlation coefficient matrix is 0.0476, which directly shows that the correlation coefficient matrix contains a large amount of market information. At the same time, after removing the maximum eigenvalue, the eigenvalue entropy increased obviously to 0.5154. The correlation coefficient matrix contains a large amount of market information, so the maximum eigenvalue contains absolute market information. When removal of the second and third eigenvalue occurs, the eigenvalue entropy increased from 0.0476 to 0.0684 and 0.0618, indicating that the 2rd and the 3rd largest eigenvalues imply less information; the characteristics of the top three eigenvalues removal value have little effect on the characteristics of entropy, so they imply very little information. In the next section we will discuss and analyze and .
3.6. The Analysis of Eigenvectors
Next, by analyzing the feature vector and other methods, we will further analyze the market information of natural gas import in OECD countries. In combination with the previous studies, we directly analyze the first three major eigenvalues. We take the eigenvector matrix as a representation. At the same time, we have
We can draw the changing images of the three eigenvalues and they are shown in Figure 9a–c.
The change of the eigenvalue is shown in Figure 9a. From the Figure 9a we found the change of time shows different characteristics. Through the judgment of the size, we can get five periods, the entire OECD imports of natural gas market, can get five periods, namely, ,, , , . The change of the eigenvalue is shown in Figure 9b, through the size of the situation, we can divide the whole OECD natural gas import market into phases, namely, ,, and . The change of the eigenvalue is shown in Figure 9c, By the size of the situation, we can also separate the entire sample period into five phases, namely, , , , .
3.7. Feature Combination and Regression Analysis
3.7.1. Feature Combination Algorithm
In order to further study the influence of the eigenvalues of the correlation coefficient matrices on the natural gas import market in OECD countries, we define
where, , . We construct a regression model
where, and are and for and standardized processing of the data, is the average import volume of natural gas in OECD countries, is the regression coefficient of and at time . By the least squares method and the regression model is established
where is the length of the time moving window and , is the mean.
Because has been determined at any time by moving the window, , therefore, Equation (8) can be changed to
where , . and have equivalent properties. The market information within time period can be reflected by the regression coefficient at time . If , then we can conclude that the matrix of the OECD countries’ natural gas imports contains reliable market information. The larger is, the more information OECD countries’ natural gas imports matrix contains on the OECD natural gas import market.
Based on the above analysis, for the set constant , we can get
Then the moment is the dissentious point of the regression coefficient.
3.7.2. Regression Analysis
We calculate the regression coefficients, , and . As can be seen from Figure 9, most of them are much larger than 0, which have an absolute impact on the total quantity of OECD natural gas import market.
In Figure 10a, it can be found is very unstable in the period of January 2004–February 2016. The change in the value of indicates the change of the correlation of the whole OECD gas import market. The four discontinuity points in Figure 10a also hint at an inflection point in the OECD countries’ average imports of natural gas. We see the same thing in Figure 10b,c.
According to the change chart of time, , and the division results of OECD natural gas import market, we can divide the January 2004–2016 February into 8 stages, namely, , , , , , , and . The changes of , and in various stages can be found in the first, second, third, the 4th, the 5th, the 7th stage contain rich market information, which contain a large number of market information in the second, third, fifth and 8 stage, and contain a wealth of market information in the fifth, the sixth, the seventh and the 8th stages.
In order to further explore the link between the discontinuity point of regression coefficients and the inflection point of the average import volume of natural gas in OECD countries, the discontinuity points of the regression coefficients are shown in the evolution of the average import volume of natural gas in OECD countries. In Figure 10, the red line shows the OECD national average natural gas imports, the blue “○” represents the discontinuity of regression coefficients, the green “◊” represents the discontinuity of regression coefficient, “□” signifies pink discontinuity point of regression coefficient. From Figure 11, it can be found that the regression coefficient and the break point operate earlier than that of OECD country’s average fluctuation of natural gas import. Therefore, we can predict and analyze the inflection point of the OECD country’s natural gas import volume by the discontinuity points of the regression coefficient and also indicate the market information of the correlation coefficient matrix.
4 Market Risk
4.1. Absorption
The market risk is mainly manifested in the occurrence of the risk of potential loss caused by the change of price in the market. In the OECD country’s natural gas import market, the market risk is mainly reflected in the sharp fluctuation of natural import volume of some country or countries, which leads to the instability of the whole natural gas import market; then we will use the absorption rate method to study the risk of the OECD countries’ natural gas import market.
Based on the effective market information, the characteristic value of the correlation coefficient matrix to quantify the market risk is to be studied. We define the rate of absorption , as follows
where n is the number of eigenvalues of the correlation coefficient matrix including the effective market information, N is the dimension of the correlation coefficient matrix, and is the eigenvalue of the market information, .
In this section, we use to evaluate the fluctuation of market risk. When increasing, the empirical eigenvalue imply risk information is grows, indicating a greater market. On the contrary, if is decreased, which indicates that the empirical eigenvalue imply risk information drops, meaning a smaller.
4.2. The Risk Assessment of Natural Gas Imports Market in OECD Countries
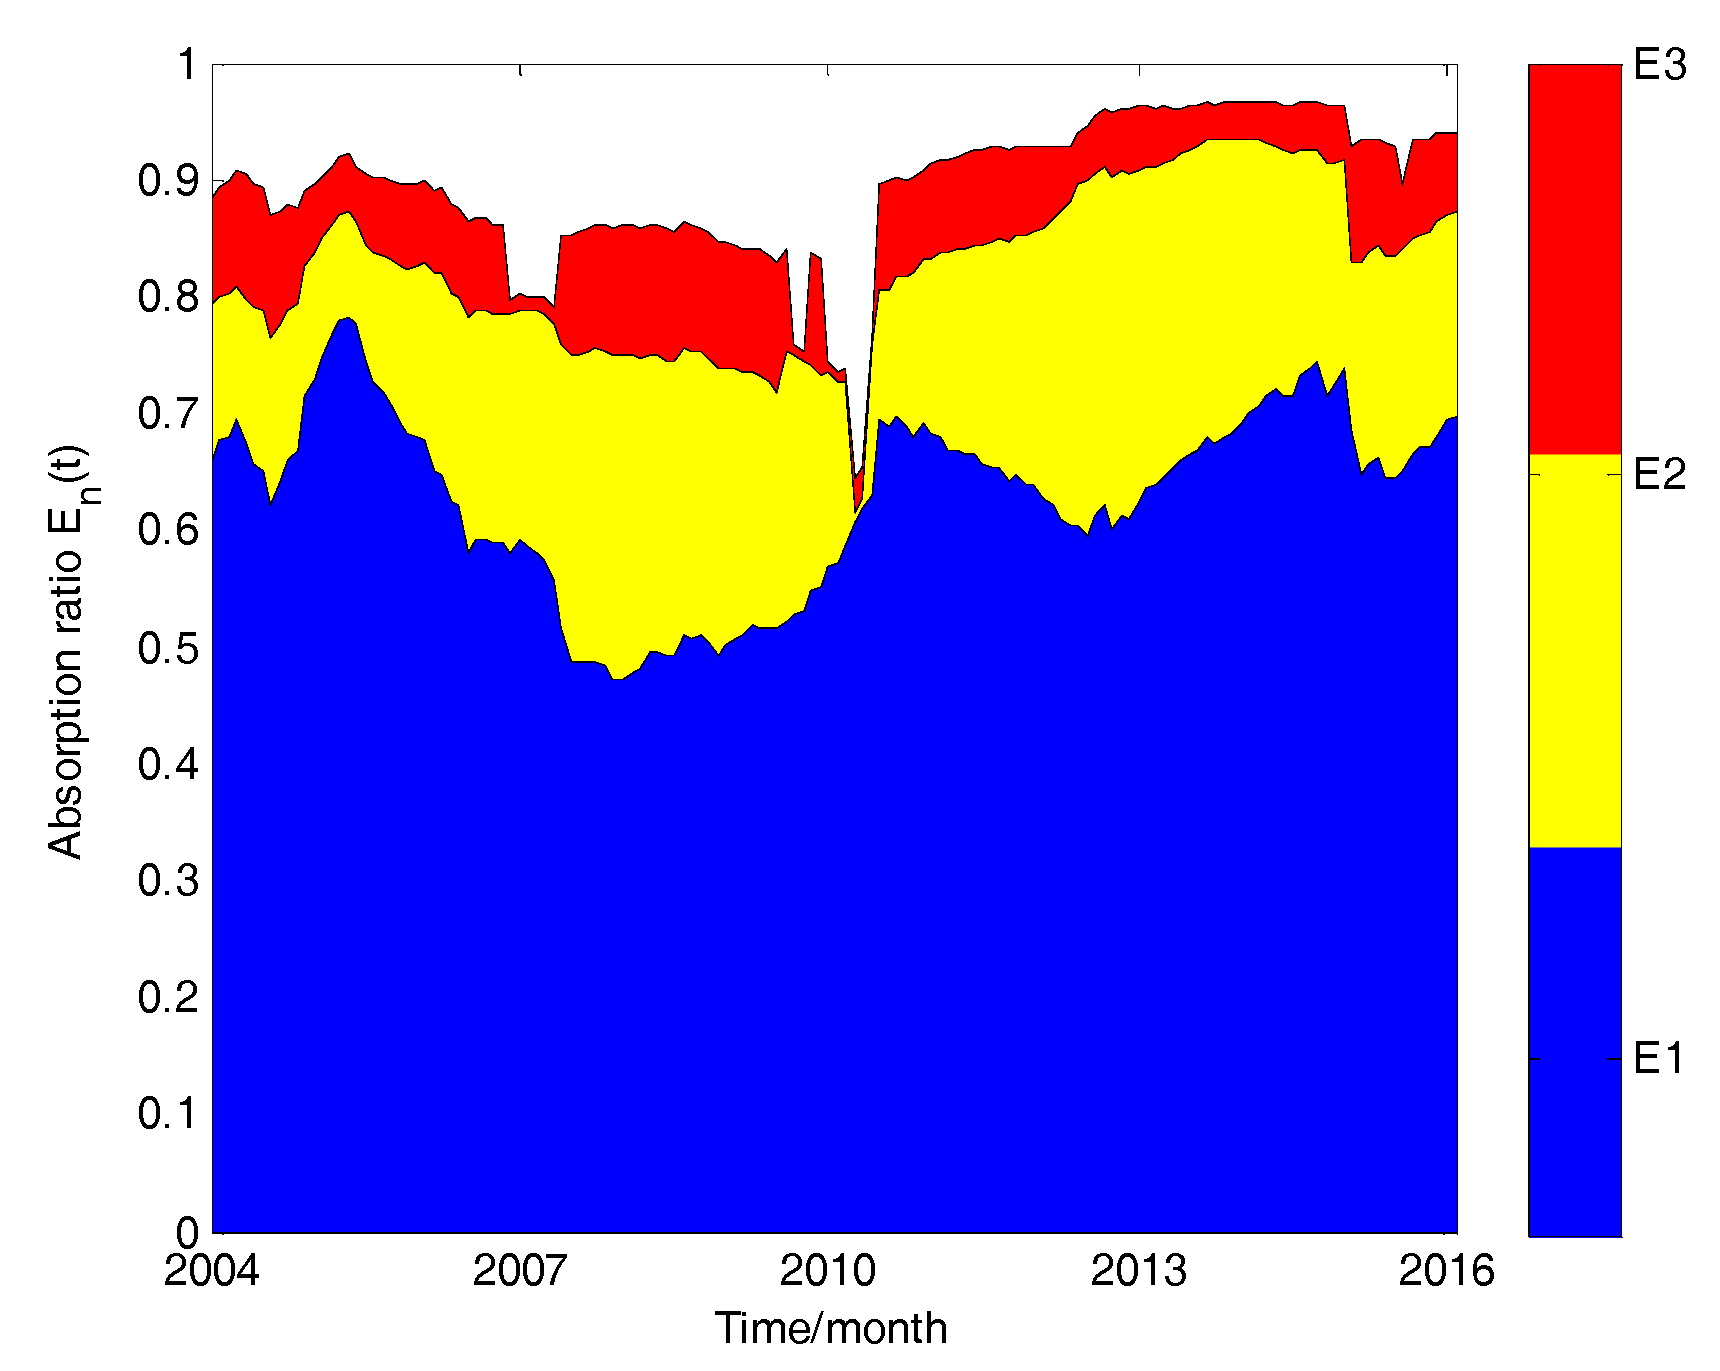
The absorption rate of OECD national natural gas import market is calculated by Formula (6), and the evolution picture of the absorption rate of the whole OECD natural gas import market is obtained. According to Figure 12, the absorption rate is very large, which shows that the gas import market of OECD countries is at a high level of risk. Based on the above-average correlation coefficient, the paper analyzes the data of import of natural gas in OECD countries. It can be found that at the beginning of 2004, natural gas had been paid more and more attention because of its convenient and clean advantage. Imported natural gas has become an inexorable trend of developing economy in many countries. All the OECD countries have strengthened the market correlation of natural gas import volume, and the market absorption rate has soared. Around May 2004, when the Iraq war reached its climax, Britain and the United States began to take sustained consumption of oil, reducing the use and import of natural gas, which resulted in a decrease in the relative degree of the whole gas import market and a slight reduction in the absorption rate. Up to August 2005, as the OECD countries issued a series of policies to regulate the natural gas market, including demand reform, market structure improvement and corresponding regulatory regimes, which led to the natural gas industry into a fierce competition, the import volume of natural gas began to show inconsistent changes. As a result, the OECD country’s natural gas import market overall declined in the degree of association, with the market absorption rate dropping down to until 2008. In September 2008, as a result of the global economic crisis, the OECD countries suffered a heavy blow. Natural gas was favored by the OECD countries, and the overall absorption rate of the gas import market began to rise. In the following three years, the overall relevance of the OECD country’s natural gas import market had been high, and the absorption rate has remained high. After 2011, with the economic recovery of the OECD member countries, OECD member countries began to emulate the United States, and the absorption rate began to decline. At the beginning of 2013, with the progress of science and technology, the improvement of the utilization of natural gas energy and the transportation of world natural gas pipeline was becoming more perfect, natural gas was getting more and more popular in the world, and imports of natural gas market overall correlation degree were increasingly large, and the absorption rate continued to rise at the same time. In the month of 2015, as the gas pricing mechanism changed, the price of natural gas increased and the prices of fuels such as oil and coal fell sharply, which led to a decline in the absorption rate. In June 2015, due to the strengthening of the OECD countries’ regulation of the natural gas industry and the significant weakening of government intervention, the import volume of natural gas has been picking up. Its market relevance become higher and the absorption rate increased. Overall, from the beginning of June 2015, as global economic development has become increasingly stable, the global natural gas industry, with its clean and high calorific value, coupled with the downward trend, has gradually stepped out of the shadows. OECD countries are equipped with the perfect facilities of the natural gas pipeline, and the entire OECD imports of natural gas market has resulted in the market absorption rate beginning to rise.
We calculate the correlation coefficient between the import volume of natural gas and the average import volume of OECD gas in OECD countries. We then draw the clustering evolution image of natural gas import in OECD countries by the method of dynamic clustering (see Figure 13). All correlation coefficients were calculated and classified by the symbols “△”, “□” and “◊”, then Figure 13 is obtained according to the order of size. At the same time, it is found that each country’s position in the whole natural gas import market changes with time.
From Figure 13, it can be found that while many OECD countries have a high degree of synchronicity in their imports of natural gas, Germany relies heavily on imports for energy and fuel supplies. The result is that when compared to other countries, there exists a remarkable relationship among the phenomenon of natural gas imports. Since 2010 especially, almost 66% of Germany’s primary energy sources, including natural gas, have relied on imports. The promotion of national environmental standards and the sharp fluctuations in international oil prices, Germany’s high demand for natural gas, along with the European gas giants, including Russia, as well as the domestic investment in natural gas pipelines in Germany, ensured a large amount of annual imports of natural gas and economic development in Germany. The 6 other countries had a high degree of synchronicity during the time of January 2004 to February 2016, particularly in the time of June 2003 to October 2010, during which the 6 regions had a synchronization of 75%, indicating that the 6 countries had a high level of consistency in the demand for natural gas imports during this period. During the period of November 2010–February 2016, synchronization among the 6 countries decreased, especially in January 2015–February 2016. The United States charged to be the supply country for the first time. At the same time, the Canadian natural gas trades have faced a difficult period, so that the domestic oil price adjustment and many industries led to a disorder of the natural gas industry, which resulted in reduced imports of natural gas market synchronization of 6 countries. From Figure 13, it can also be found that the synchronization in Norway and the Netherlands between January 2004 and February 2016, reached 91%. Finally, it can be concluded from Figure 13 that these 7 countries had a nearly 90% synchronization during the period of November 2010–June 2012, indicating that the whole OECD countries had a high degree of consistency in the market for the import of natural gas.
4.3. The Region Division of Natural Gas Imports Market in OECD Countries
According to the analysis about the synchronization of the import volume of natural gas in OECD countries, it is found that these seven countries have high synchronicity with other countries, except for Germany, thus they can be divided into a separate category. In February 2016, the synchronization of natural gas imports volume of the market was very high, so Norway and Hollandwill be categorized as a class. The United States from 2014 experienced gradual decline in imports of natural gas, and even at the end of 2015 began to export natural gas, so the United States stands alone in a class. In the rest of the countries—United Kingdom, Canada and Australia—synchronization is higher, so can be divided into a class. Therefore, 7 regions are broadly classified as 4 categories, Germany belongs to the first category, Norway and the Netherlands belong to the second category, the United Kingdom, Canada and Australia belong to the third category, the United States belongs to the fourth category.
4.4. The Classification Verification of the United Kingdom, Canada and Australia
In the above countries, according to the clustering variation with time evolution of the image, the 7 countries are divided into 4 categories. Due to the domestic shortage of natural resources, Germany has a large number of imports to meet domestic demand compared to the other 6 countries of the natural gas. In this case, there is no doubt that it is classified as a separate category. The United States in recent years, due to sudden change in natural gas imports into being an export country, is classified as a class. In the period of January 2004 to February 2016, the gas import market of the two countries Norway and the Netherlands is close to 91% of synchronicity. It is also clear that the two countries should be classified as a category. Australia, Canada and the United Kingdom is a category, as shown in Figure 13. By analyzing the correlation scatter chart of the 3 countries and the correlation between any pairs, the classification of the 3 countries will be validated further.
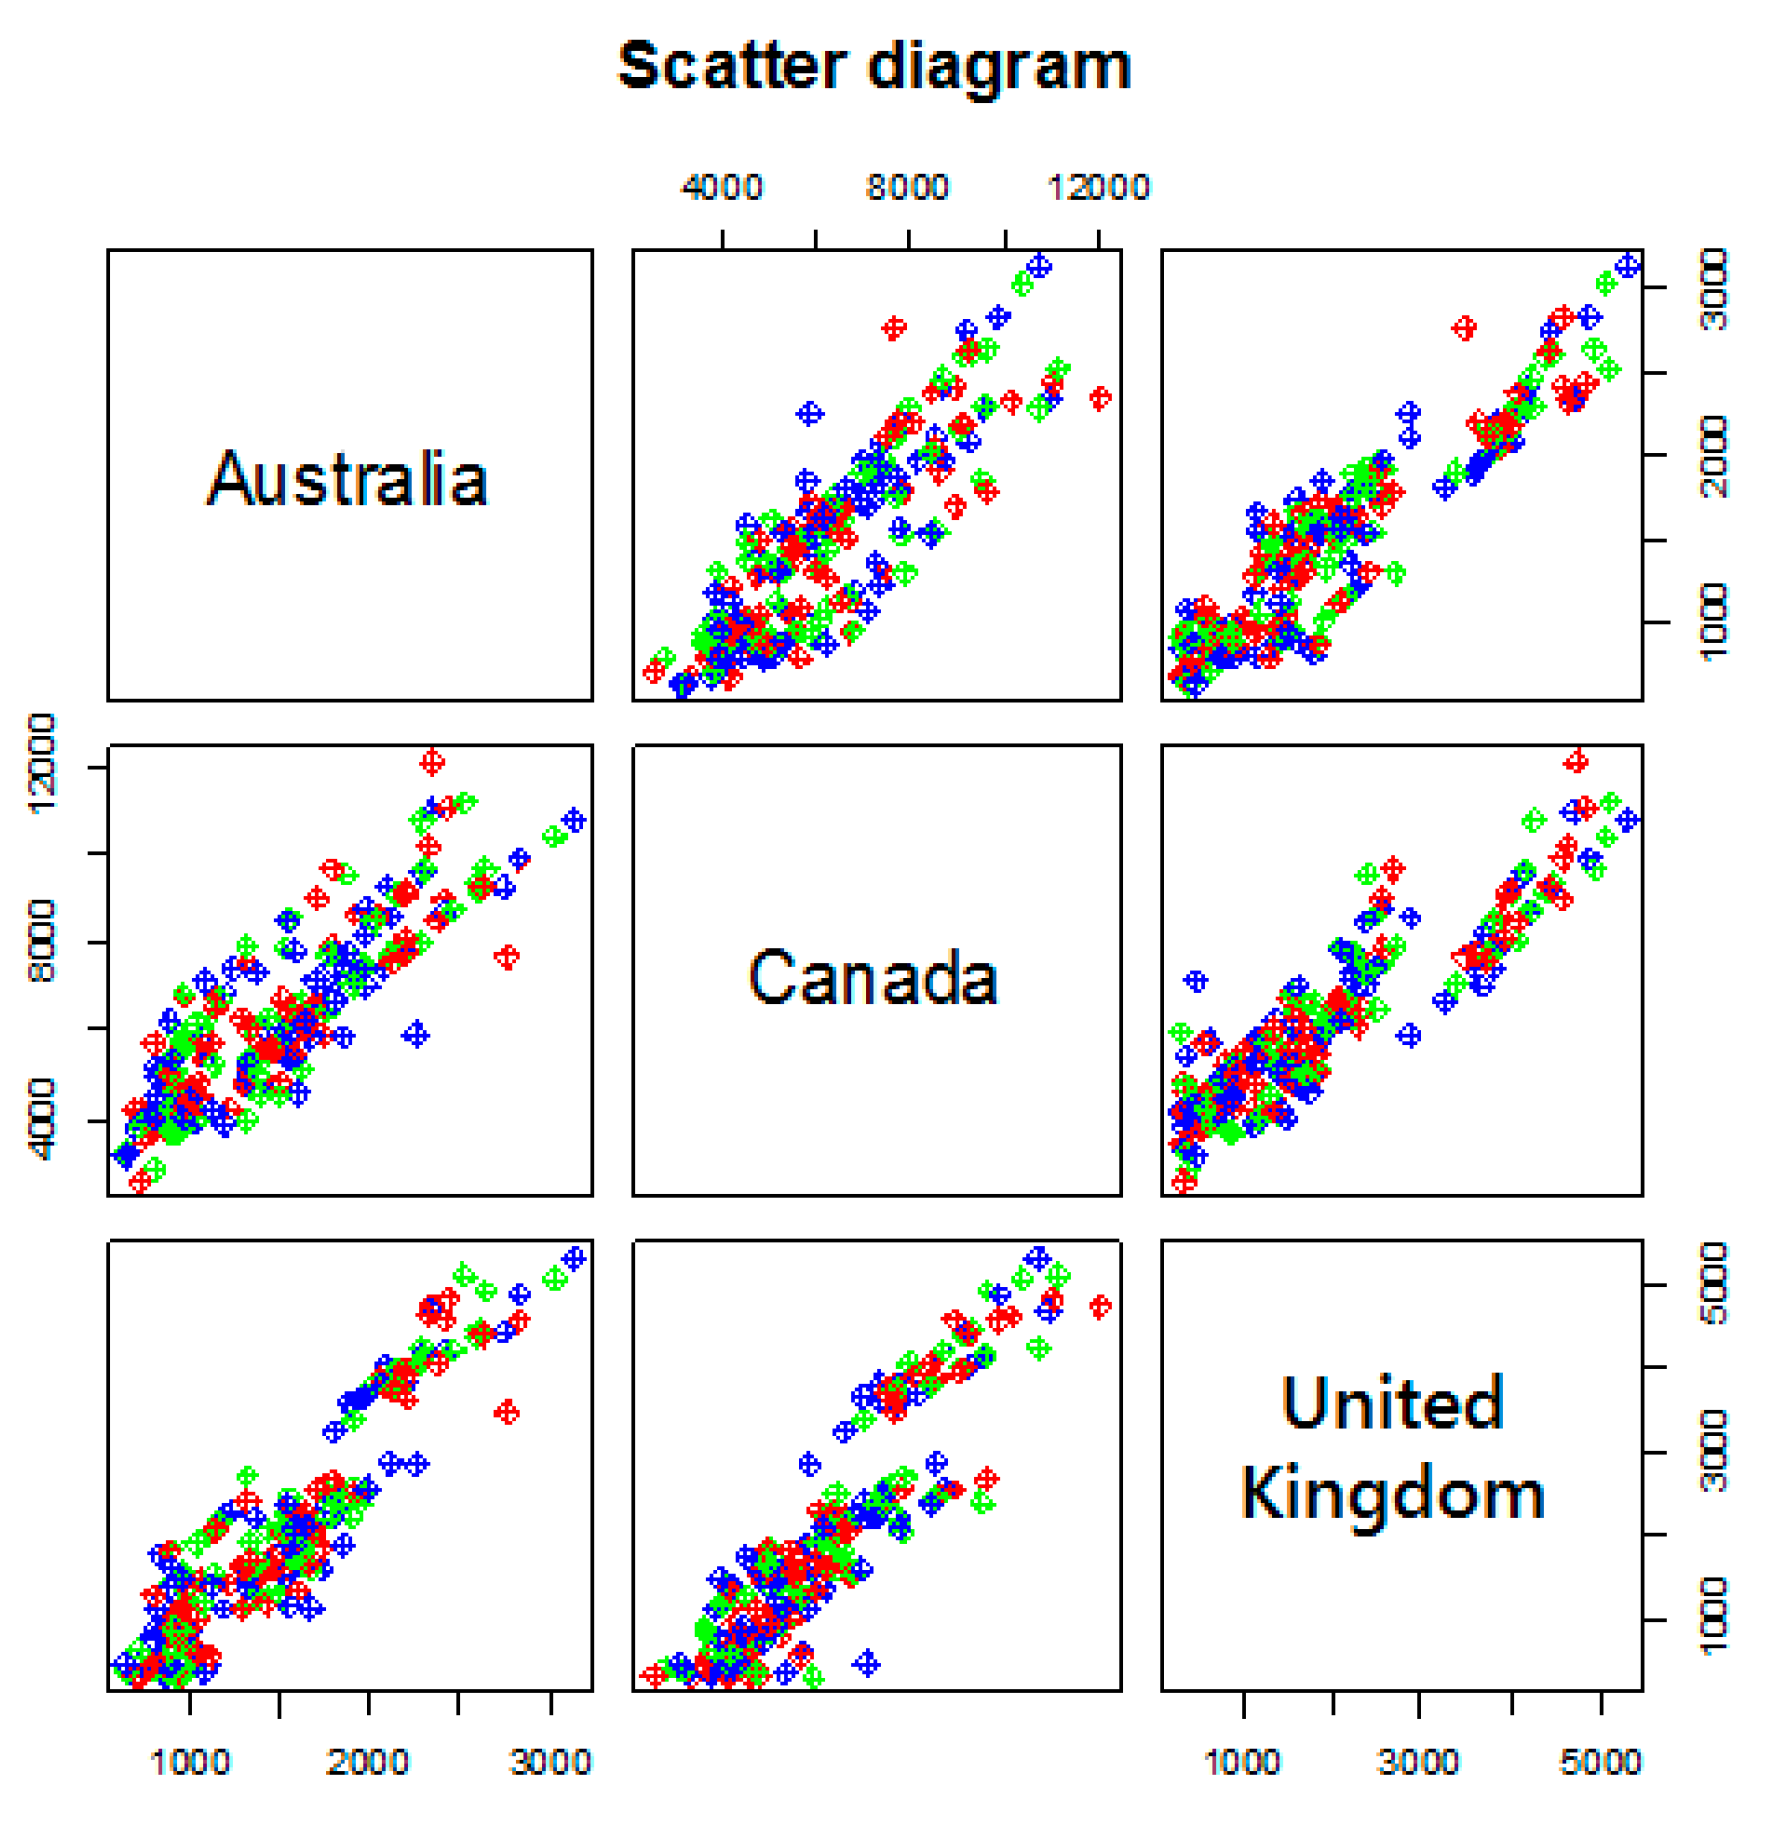
The natural gas import data from Australia, Canada and the United Kingdom are plotted as a scatter plot, as shown in Figure 14. Besides, it can be found from Figure 14 that the data on imports of natural gas from Australia, Canada and the United Kingdom in 3 countries are roughly in a straight line and its left and right sides—that is, the data of the 3 countries’ natural gas imports—are roughly straight line. This shows that Australia, Canada and the United Kingdom are highly correlated in the natural gas import market. Pearson correlations are tested by data on imports of natural gas from 3 countries. The test results are shown in Table 2. According to Table 2, it can be concluded that the p values between Australia and Canada, Australia and the UK and Canada and the United Kingdom are less than 0.05. Thus, we rejected the original hypothesis, showing that Australia, Canada and the United Kingdom have a correlation between each two. In addition, because Australia and Canada, Australia and the United Kingdom and Canada and the United Kingdom have correlation coefficients more than 0.8, Australia, Canada and the United Kingdom are highly relevant, and should belong to a category.
This part evaluates the risk of the natural gas import market in OECD countries by the absorbance method. It has been found that the natural gas import market across OECD countries is fraught with risk and the risk of change over time is always changing remains high. At the same time, the average correlation coefficient also indirectly depicts the risk of the natural gas import market in OECD countries. Through the method of dynamic clustering, it is concluded that, except for Germany, the whole OECD countries have high synchronism in the natural gas import market, and the synchronization of the gas import market between Norway and the Netherlands is up to 91%, indicating that the two countries have similar import demand for natural gas in recent years. The 7 countries could be divided roughly into 4 categories: Germany belongs to the first category, Norway and the Netherlands belong to the second category, the United Kingdom, Canada and Australia belong to the third category, and U.S. belongs to the fourth category. Through the scatter chart and Pearson correlation coefficient, the clustering of the United Kingdom, Canada and Australia’s was validated.
5. Conclusions
Based on the theory of natural gas in OECD countries, the market information of natural gas imports in OECD countries is quantitatively characterized by correlation coefficient matrix, eigenvalues and eigenvectors. Theoretical and empirical studies have revealed the implicit market information in rich and advanced OECD countries’ natural gas imports. The evolutionary characteristics of the spatiotemporal dynamics of the natural gas market in the OECD countries are obtained under the intrinsic motivation and vitality of the OECD countries’ natural gas import volume, which is characterized by the systematic risk entropy and the synchronization ratio.
In this paper, we first establish the correlation coefficient matrix based on the stochastic matrix theory and the average correlation coefficient. This paper analyzes and excavates the market information of the OECD country’s natural gas import quantity, and then studies the OECD countries’ natural gas import markets and divides the market by the characteristic value entropy, the characteristic combination, and the linear regression method. At last, the risk of the whole natural gas market is analyzed and evaluated by the absorption rate method, and the synchronization of the OECD countries’ natural gas import market is studied by a clustering algorithm, and the region of the OECD country’s natural gas import market is divided. The conclusions are as follows:
- Combined with the stochastic matrix theory, the OECD countries are not independent of the correlation of natural gas imports. At the same time, the average correlation coefficient of the correlation coefficient matrix shows that the OECD national gas import market has a great degree of correlation and high risk.
- Through the characteristic combination and regression analysis, we can roughly divide OECD national gas import market into 8 different stages and the correlation degree of OECD gas import market varies in each stage.
- The discontinuity point of the regression coefficient appeared earlier than the fluctuation inflexion of the average import volume of natural gas in OECD countries. Thus, the inflection point of natural gas import quantity in OECD countries can be roughly predicted, and the correlation coefficient matrix can imply the market information at the same time.
- Through the absorption rate method, the authors find that the OECD country’s natural gas imports market is not stable, with high and increasing risk. Overall, in recent years, especially since April 2013, with the development of science and technology, the increase of natural gas utilization rate and the improvement of natural gas transportation pipelines around the world, natural gas has been favored by many countries. The OECD countries have used and imported natural gas extensively, and the degree of association of the whole natural gas import market in the OECD is becoming stronger. At the beginning of 2015, a warming up of the gas pricing mechanism led to higher gas prices and a sharp fall in the prices of fuels such as oil and coal, which reduced the use and import of natural gas in OECD countries, and the market correlation of the entire gas import volume began to decline.
- It can be found through the clustering method that, except Germany, the synchronization of the OECD national imports of natural gas market is very high; Norway and the Netherlands in recent years have been in line with the basic pace of import demand for natural gas. In addition, the 7 countries can be roughly divided into 4 categories. Germany and the United States belong to one category, Norway and Netherlands belong to one category, and United Kingdom, Canada and Australia belong to one category.
It was not until the second half of 2015 that the world economy grew more and more stable, and oil prices continued to plunge. With the weakening of government intervention in OECD countries, the global natural gas industry entered a new era, with the strengthened modern regulation and the downward trend of natural gas pricing.
Acknowledgments
This paper is supported by the National Natural Science Foundation of China (Grant Nos. 71690242, 91546118 and 11731014), and the Major Project of Natural Science Foundation of Jiangsu Province Colleges and Universities (Grant No. 14KJA110001), and the Advantages of Jiangsu Province and the Innovation Project for Graduate Student Research of Jiangsu Province (Grant No. KYLX16_0899).
Author Contributions
Min Fu designed and performed experiments, and then wrote the manuscript. Yang Yang guided the whole research. Lixin Tian designed the program algorithm and provided some valuable academic advice. Zaili Zhen completed the proofreading of this paper.
Conflicts of Interest
The authors declare no conflict of interest.
References
- World Energy Agency. Available online: http://www.iea.org/statistics/ (accessed on 14 November 2017).
- Mehta, M.L. Notes-Random Matrices (Revised and Enlarged Second Edition); Elsevier: Amsterdam, The Netherlands, 1991; pp. 535–544. [Google Scholar]
- Plerou, V.; Gopikrishnan, P.; Rosenow, B.; Amaral, L.A.N.; Stanley, H.E. Universal and non-universal properties of cross-correlations in financial time series. Phys. Rev. Lett. 1999, 83, 1471–1474. [Google Scholar] [CrossRef]
- Tulino, A.M.; Verdú, S. Random matrix theory and wireless communications. Commun. Inf. Theory 2004, 1, 1–182. [Google Scholar] [CrossRef]
- Kulkarni, V.; Deo, N. Correlation and volatility in an Indian stock market: A random matrix approach. Eur. Phys. J. B 2007, 60, 101–109. [Google Scholar] [CrossRef]
- Meng, H.; Xie, W.J.; Jiang, Z.Q.; Podobnik, B.; Zhou, W.X.; Stanley, H.E. Systemic risk and spatiotemporal dynamics of the US housing market. Sci. Rep. 2014. Available online: https://www.ncbi.nlm.nih.gov/pmc/articles/PMC3888986/ (accessed on 14 November 2017).
- Tian, L.; Ding, Z.; Wang, M.; Zhen, Z. The spatiotemporal dynamic analysis of the implied market information and characteristics of the correlation coefficient matrix of the international crude oil price returns. Energy Ecol. Environ. 2016, 1, 197–208. [Google Scholar] [CrossRef]
- Wang, M.; Chen, Y.; Tian, L.; Jiang, S.; Tian, Z.; Du, R. Fluctuation behavior analysis of international crude oil and gasoline price based on complex network perspective. Appl. Energy 2016, 175, 109–127. [Google Scholar] [CrossRef]
- Wang, T.; Lin, B. Impacts of unconventional gas development on China’s natural gas production and import. Renew. Sustain. Energy Rev. 2014, 39, 546–554. [Google Scholar] [CrossRef]
- Tian, C. Analysis of China’s oil & gas imports and exports in 2012. Int. Pet. Econ. 2013, 3, 44–45. [Google Scholar]
- Ma, S.; Han, F. Natural gas reserves situation and experiences of foreign countries. Nat. Gas Ind. 2010, 30, 62–66. [Google Scholar]
- Sen, A. Natural gas imports into South Asia: A study in international relations. Energy Policy 2000, 28, 763–770. [Google Scholar] [CrossRef]
- Dong, X.; Kong, Z. The impact of China’s natural gas import risks on the national economy. J. Nat. Gas Sci. Eng. 2016, 36, 97–107. [Google Scholar] [CrossRef]
- Maxwell, D.; Zhu, Z. Natural gas prices, LNG transport costs, and the dynamics of LNG imports. Energy Econ. 2010, 33, 217–226. [Google Scholar] [CrossRef]
- Jia, Q.; Geng, J.; Fan, Y. Separated influence of crude oil prices on regional natural gas import prices. Energy Policy 2014, 70, 96–105. [Google Scholar] [CrossRef]
- Egging, R.; Pichler, A. Risk aversion in imperfect natural gas markets. Eur. J. Oper. Res. 2017, 259, 367–383. [Google Scholar] [CrossRef]
- Batten, J.A.; Ciner, C.; Lucey, B.M. The dynamic linkages between crude oil and natural gas markets. Energy Econ. 2017, 2, 155–170. [Google Scholar] [CrossRef]
- Bernstein, P.; Tuladhar, S.D. Economics of U.S. natural gas exports: Should regulators limit U.S LNG exports? Energy Econ. 2016, 60, 427–437. [Google Scholar] [CrossRef]
- Zhang, K. Natural gas supply-demand situation and prospect in China. Nat. Gas Ind. B 2014, 10, 103–112. [Google Scholar]
- Egging, R.; Holz, F. Risks in global natural gas markets: Investment, hedging and trade. Energy Policy 2016, 94, 468–479. [Google Scholar] [CrossRef]
- Vivoda, V. LNG import diversification in Asia. Energy Strategy Rev. 2014, 2, 289–297. [Google Scholar] [CrossRef]
- Shi, X.; Variam, H. Global impact of uncertainties in China’s gas market. Energy Policy 2017, 104, 382–394. [Google Scholar]
- Vivoda, V. Natural gas in Asia: Trade, markets and regional institutions. Energy Policy 2014, 74, 80–90. [Google Scholar] [CrossRef]
Figure 1.
Schematic diagram of the dynamic mechanism triggered by Organization for Economic Co-operation and Development (OECD) national natural gas import information.
Figure 1.
Schematic diagram of the dynamic mechanism triggered by Organization for Economic Co-operation and Development (OECD) national natural gas import information.
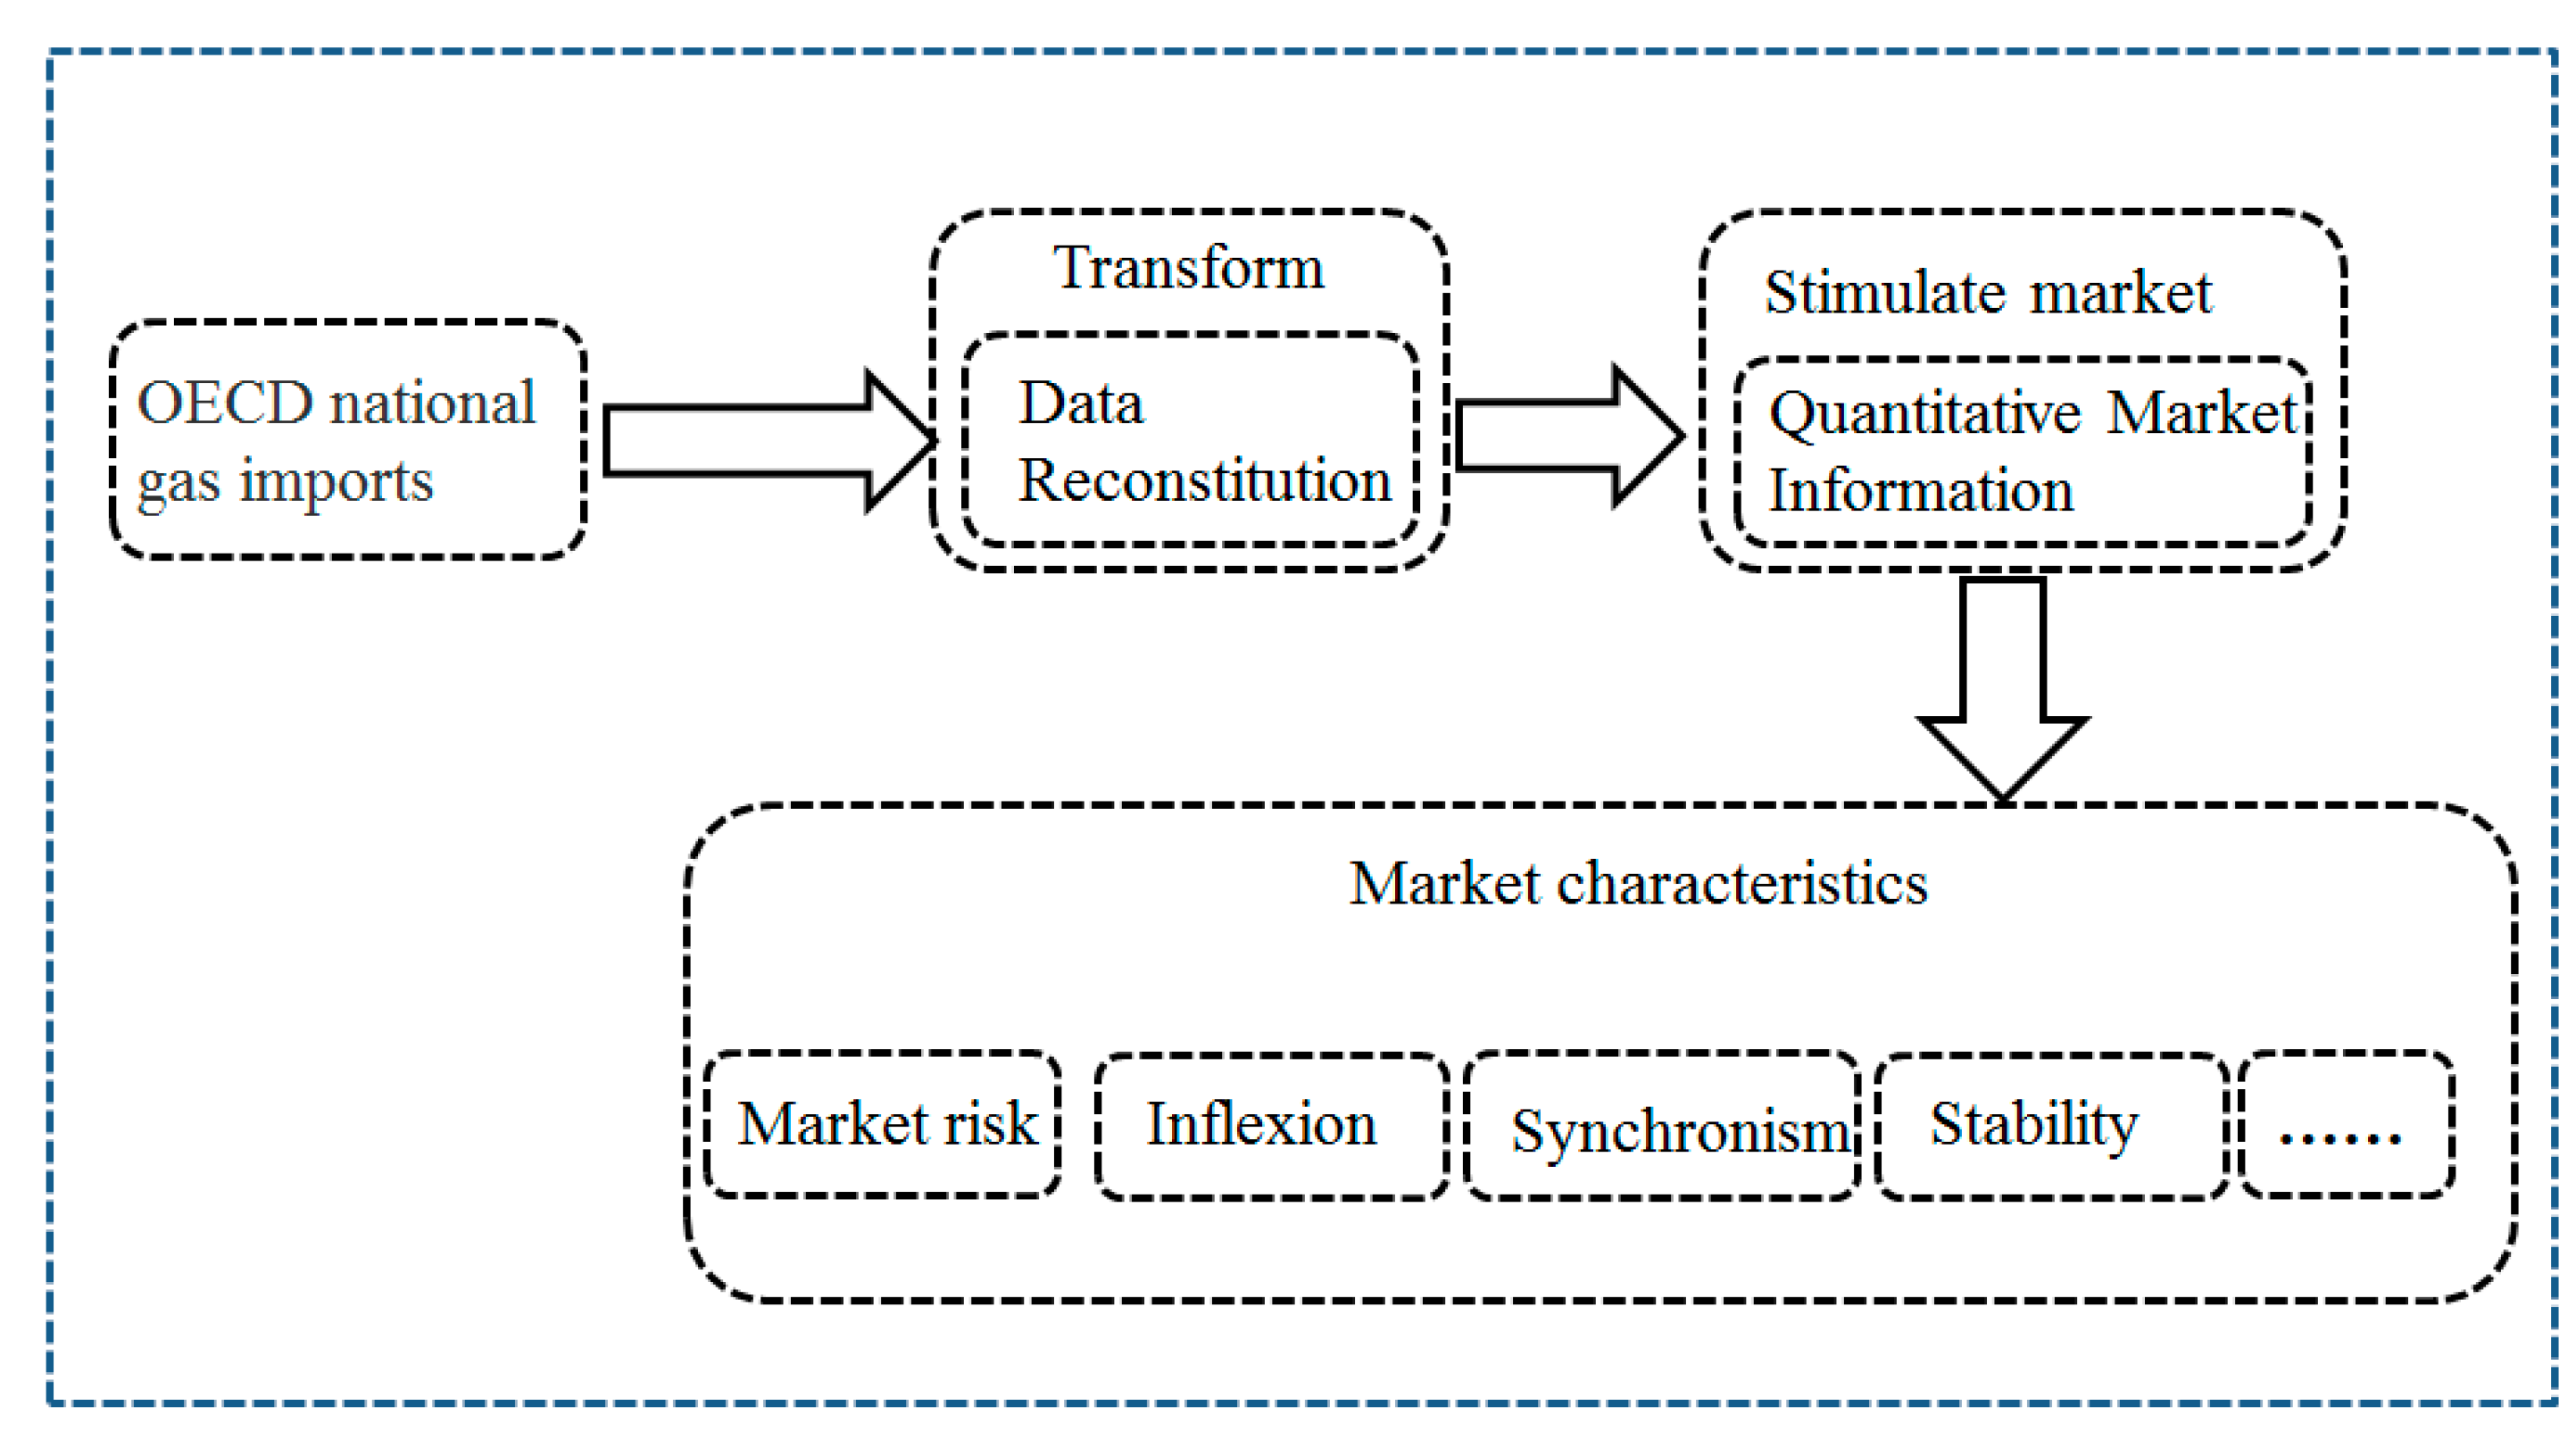
Figure 2.
Research flow chart.

Figure 3.
Natural gas imports.

Figure 4.
Standardized natural gas imports.
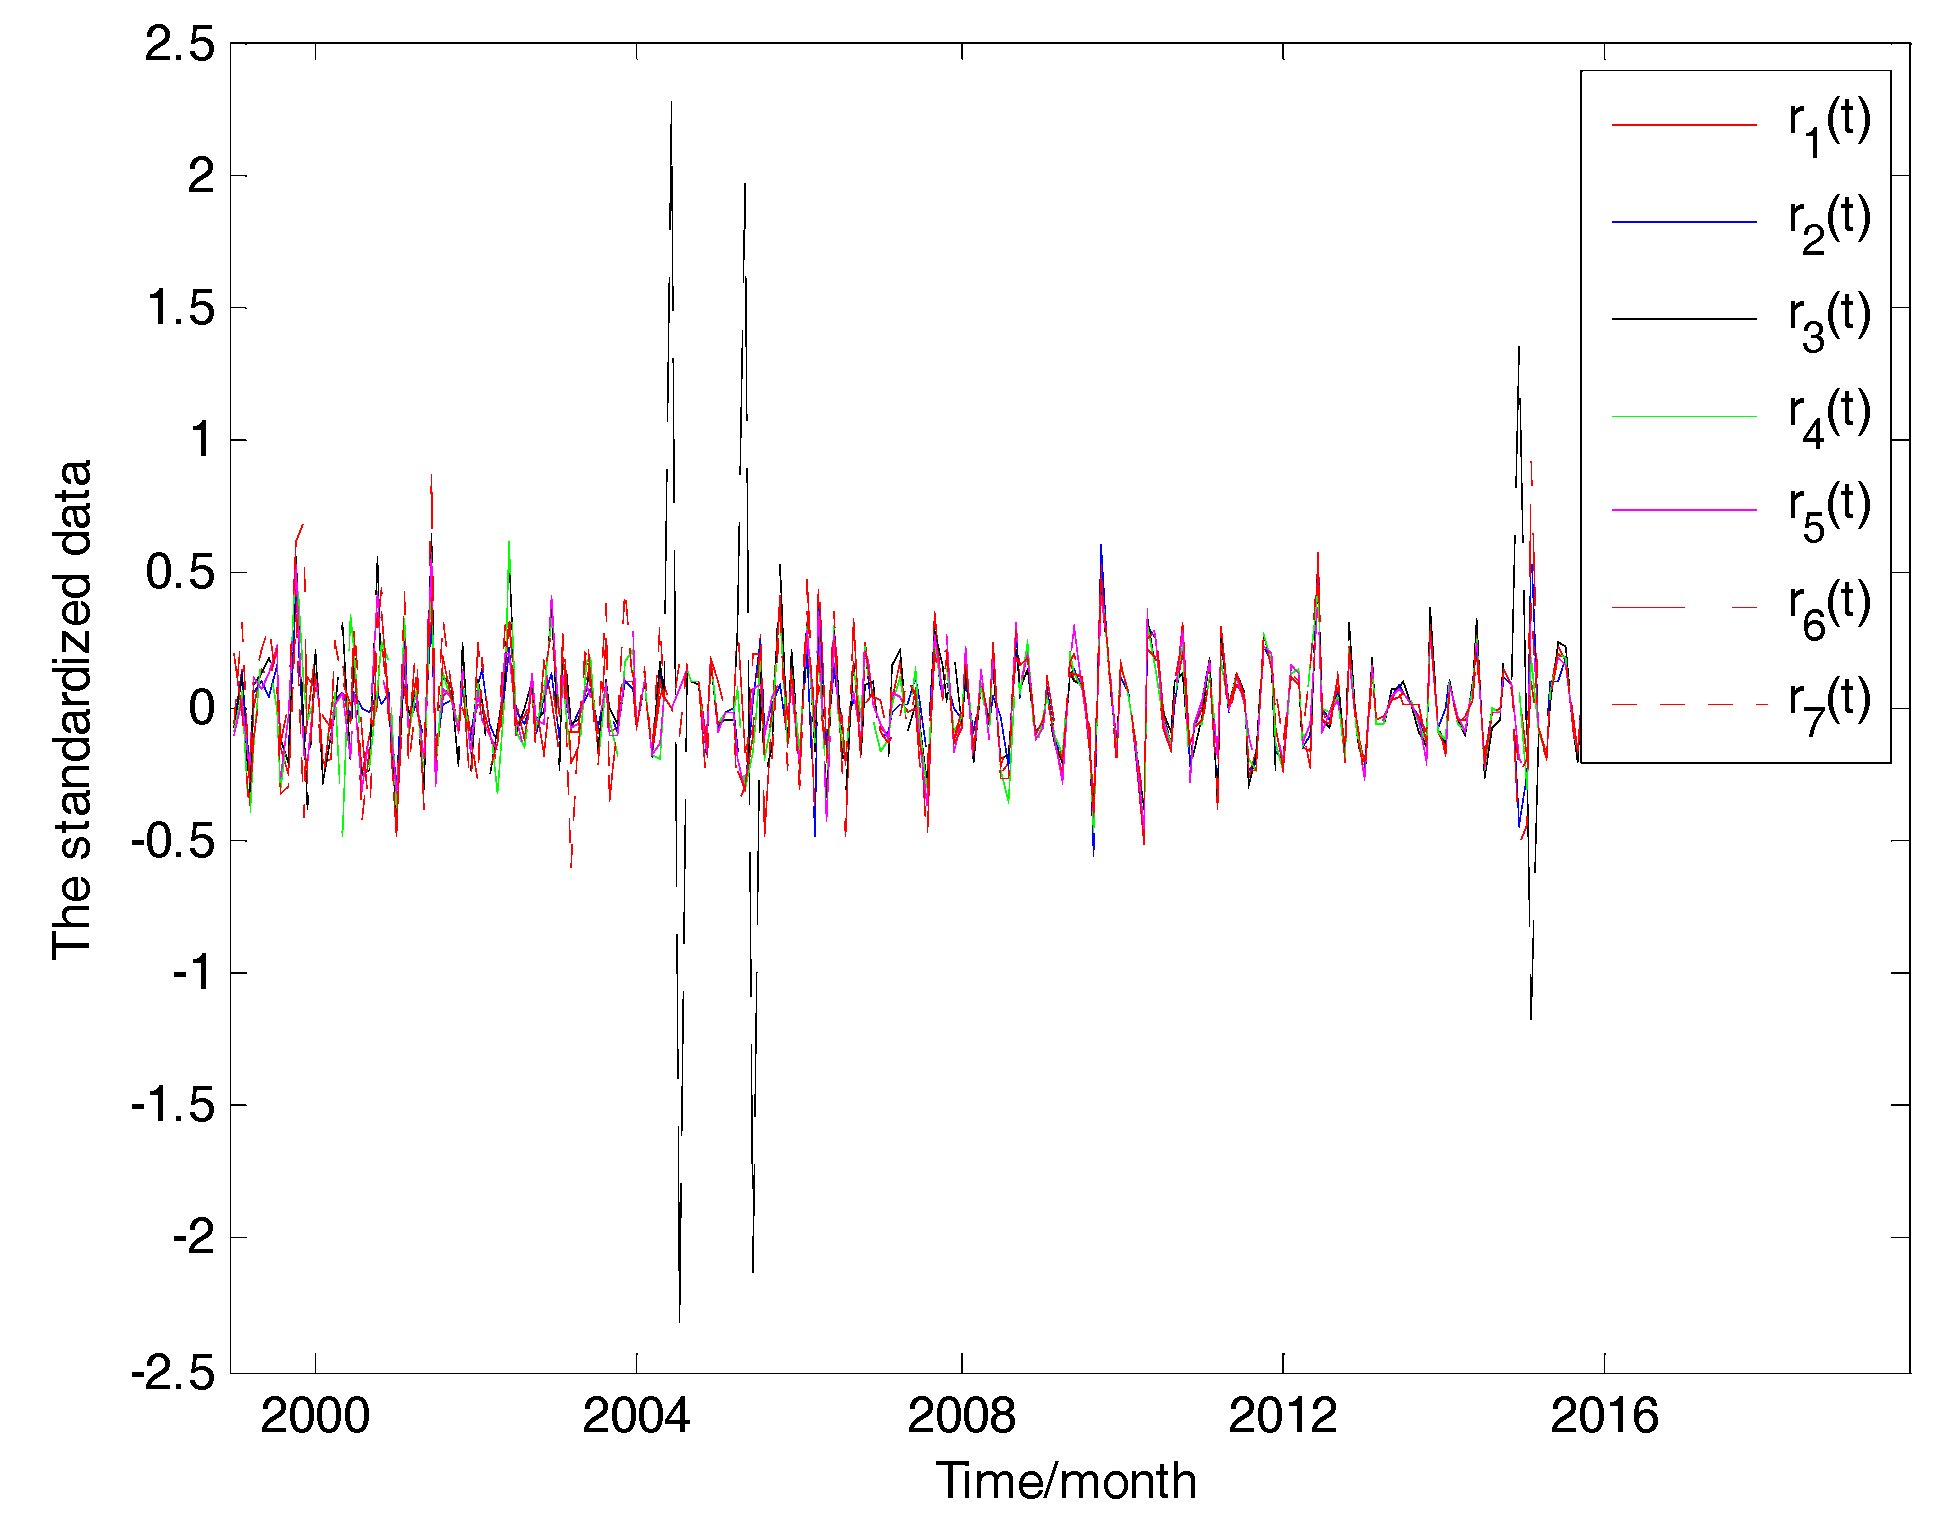
Figure 5.
Moving windows.

Figure 6.
Probability density of correlation coefficients.
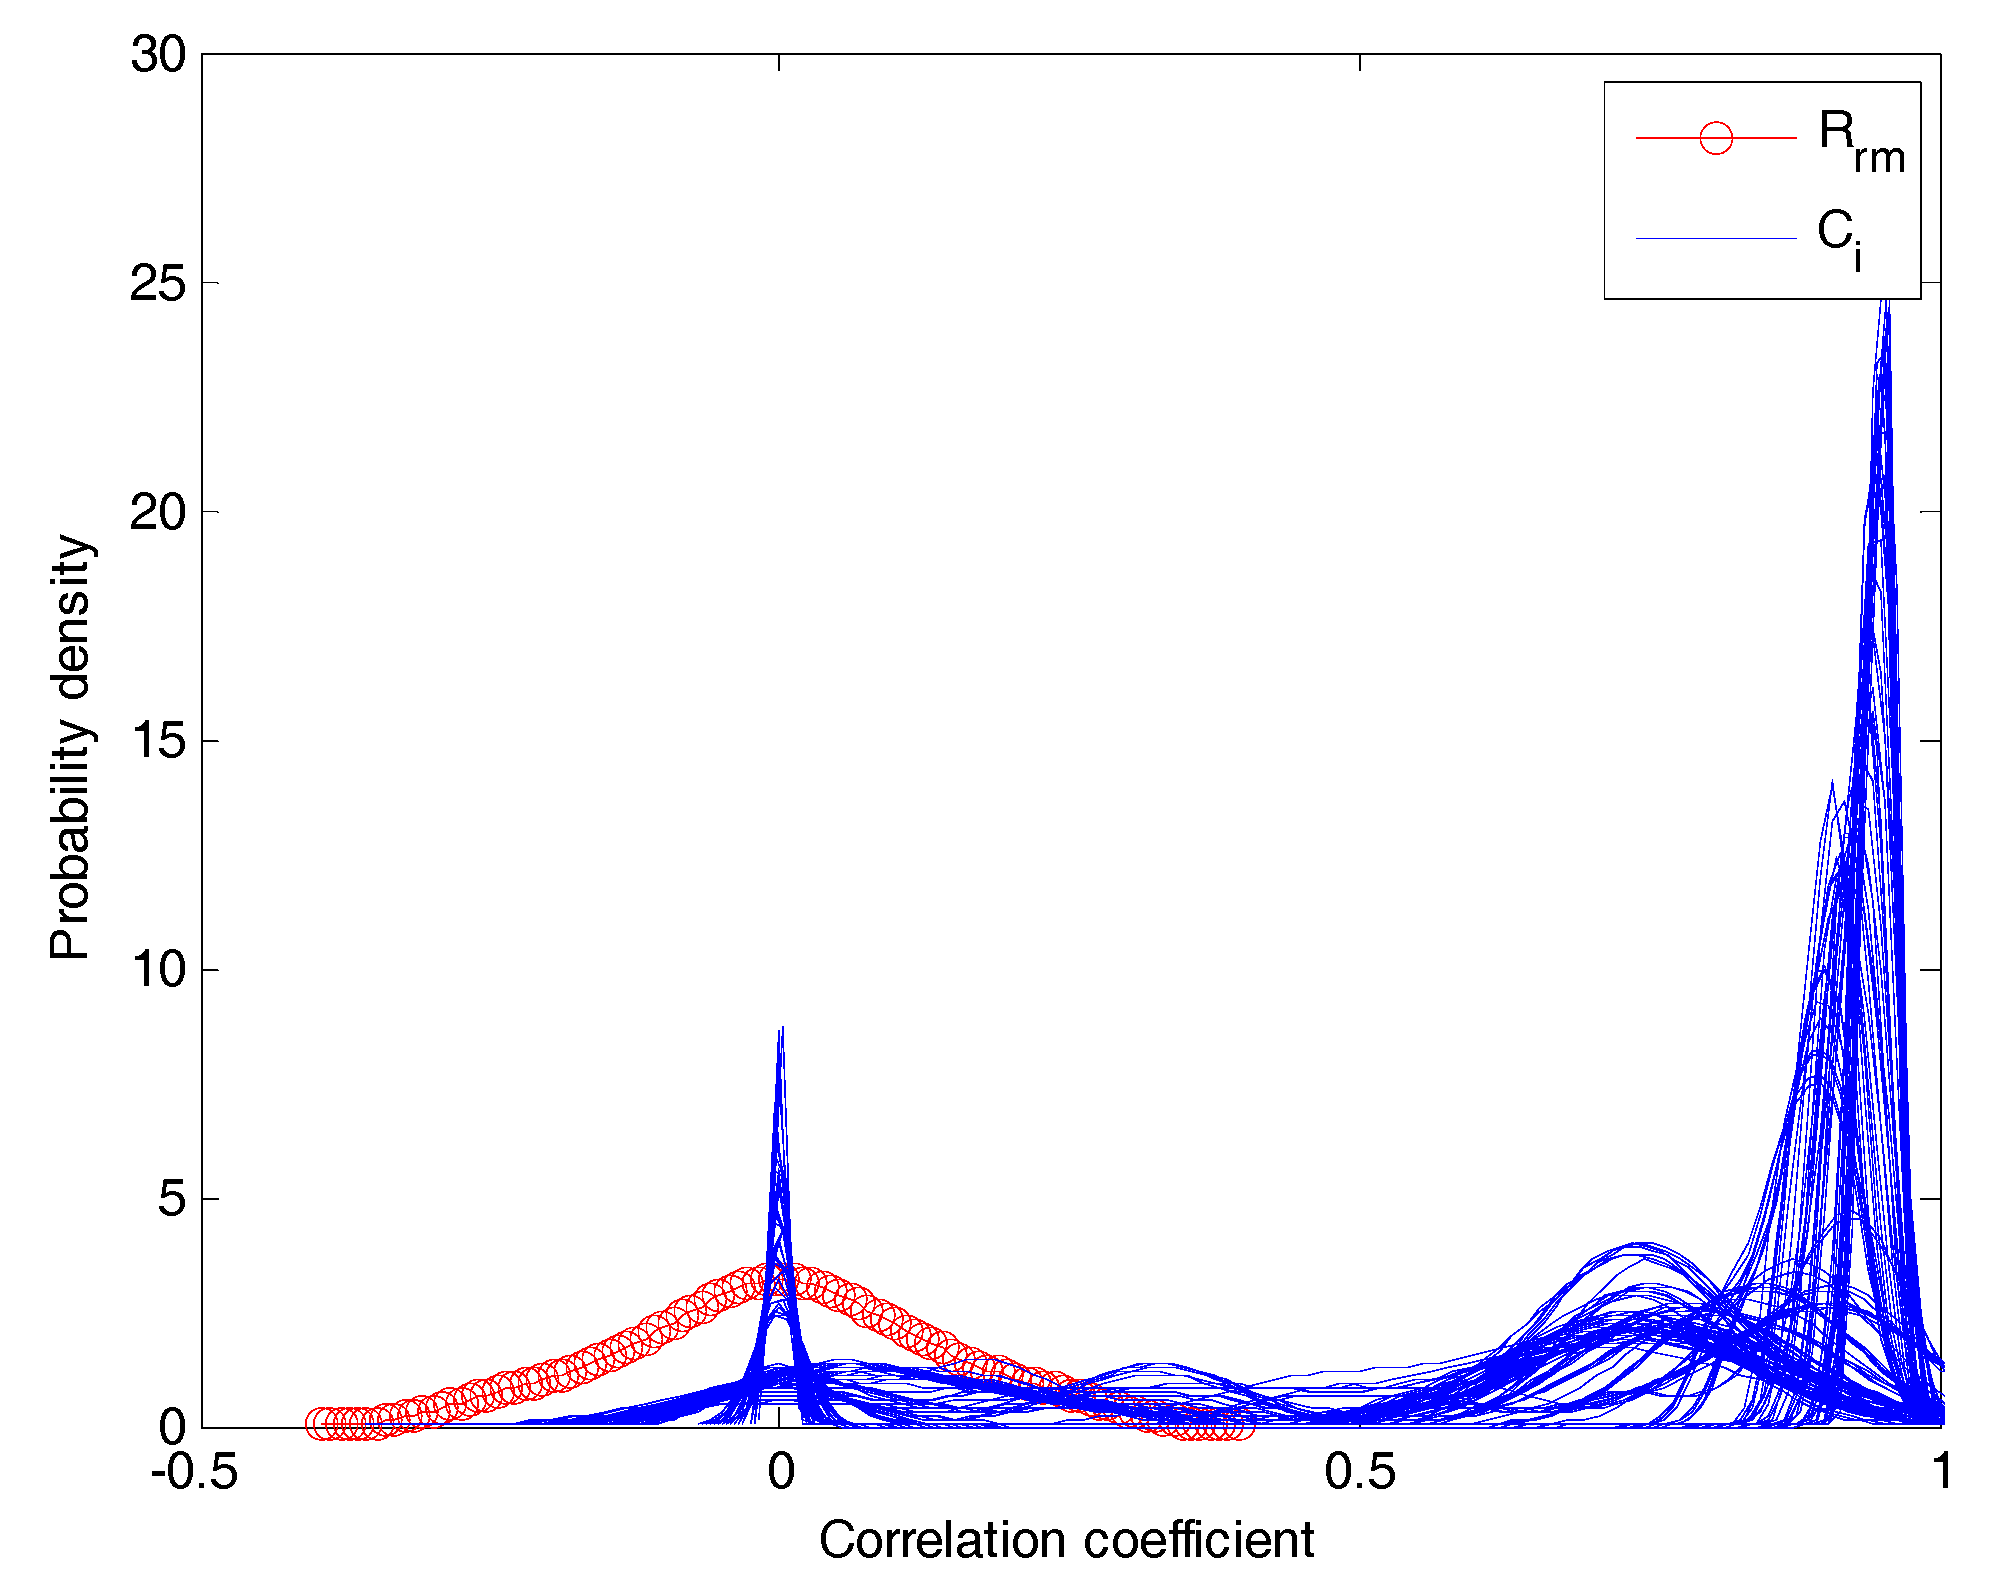
Figure 7.
Average correlation coefficients.
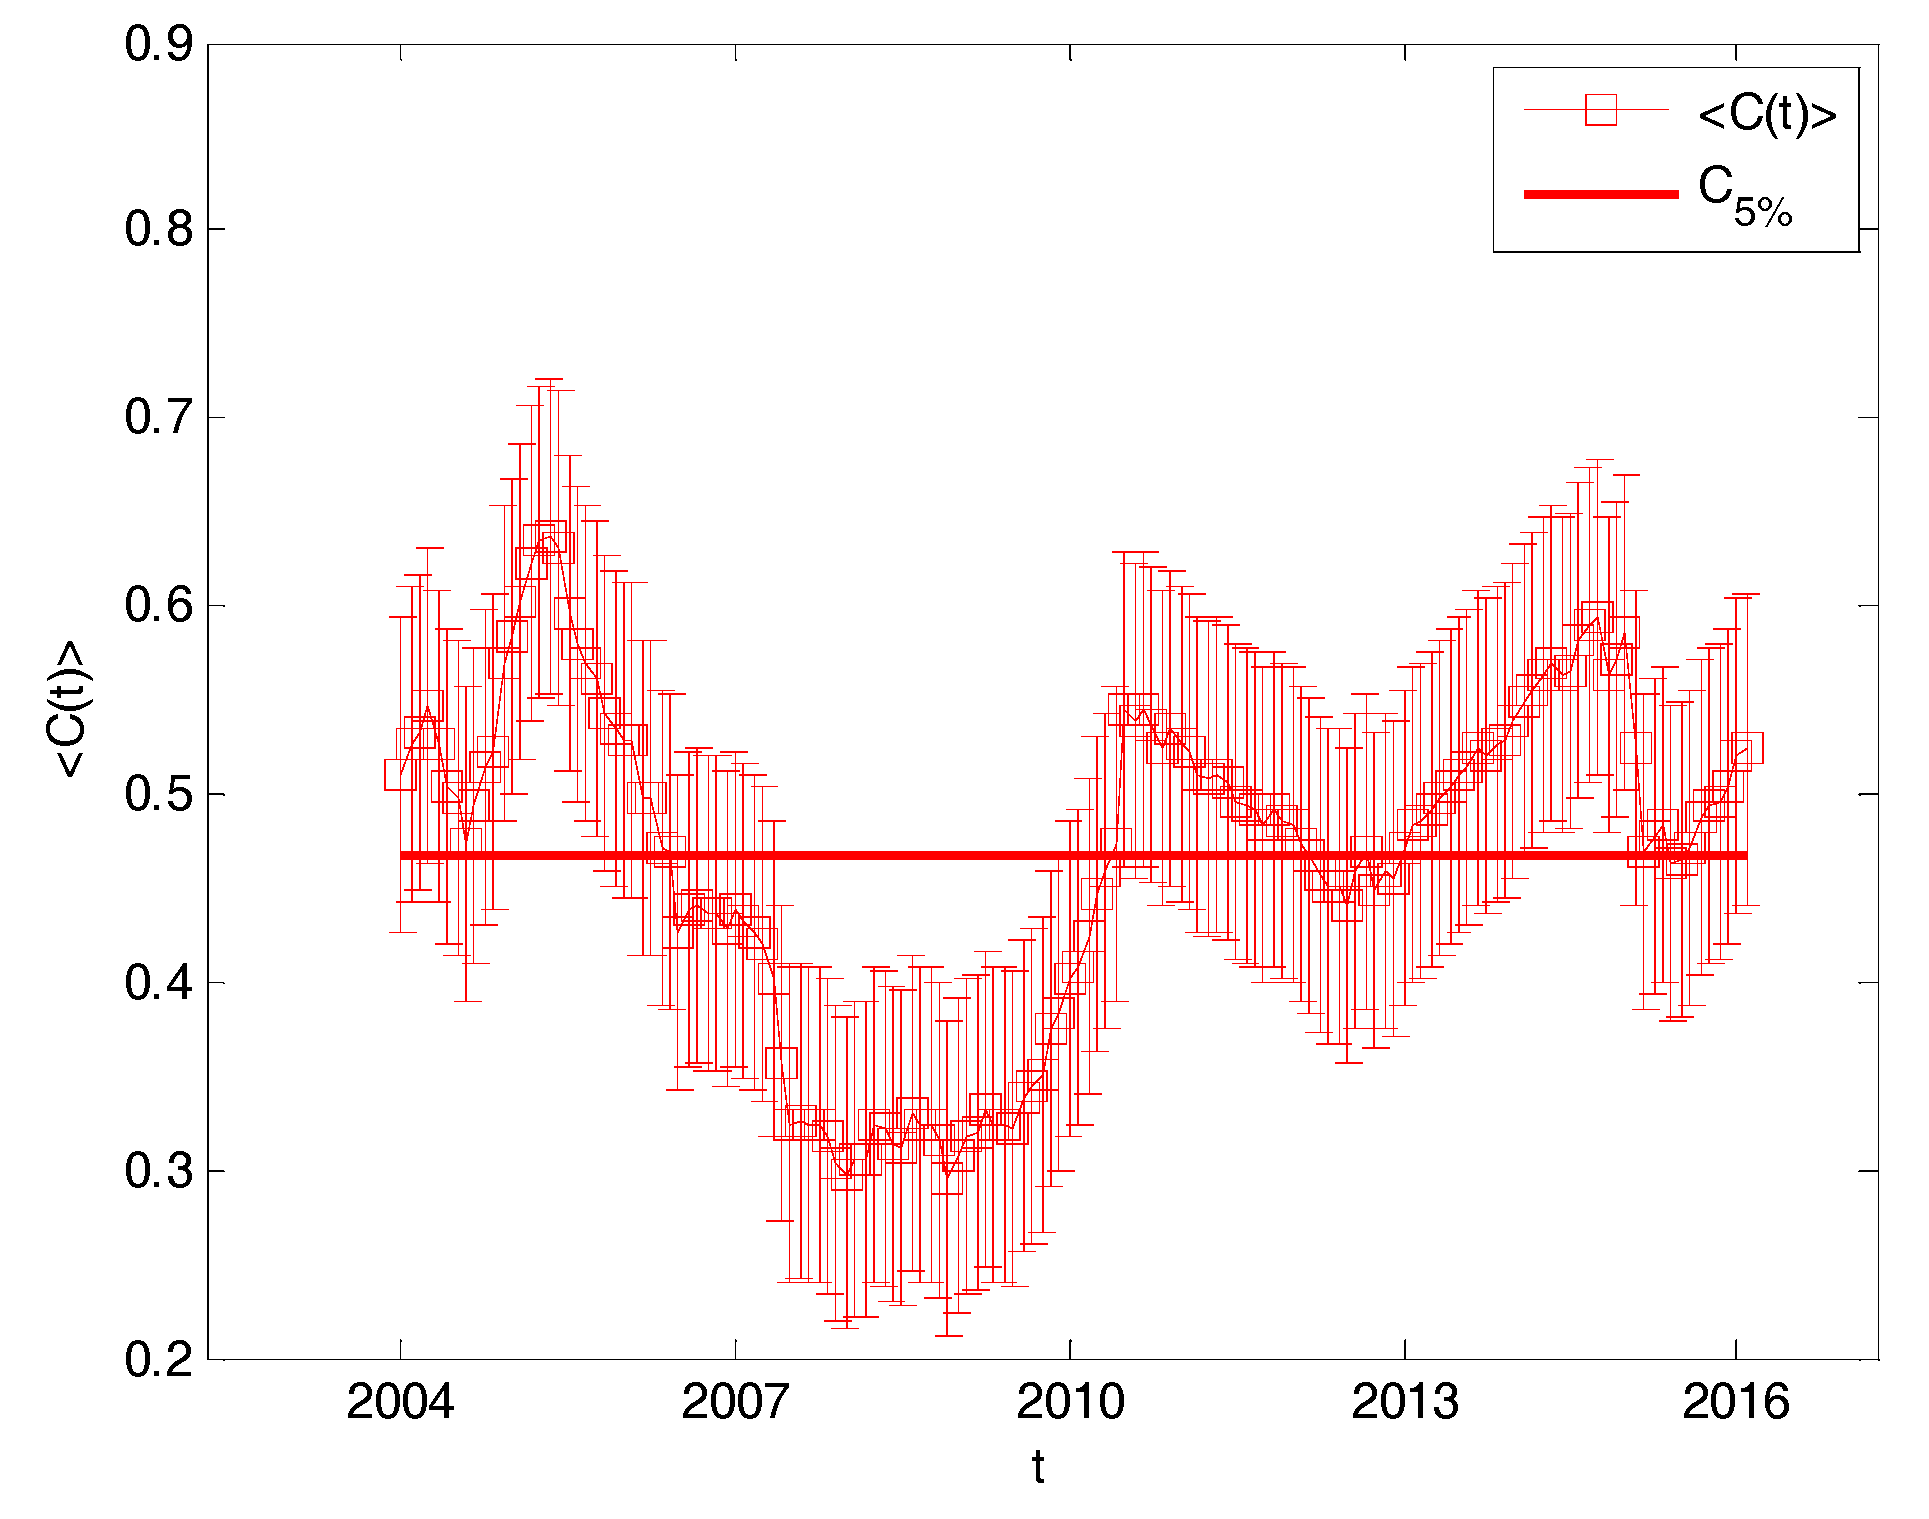
Figure 8.
(a,b) Eigenvalue entropy when the ith eigenvalue.
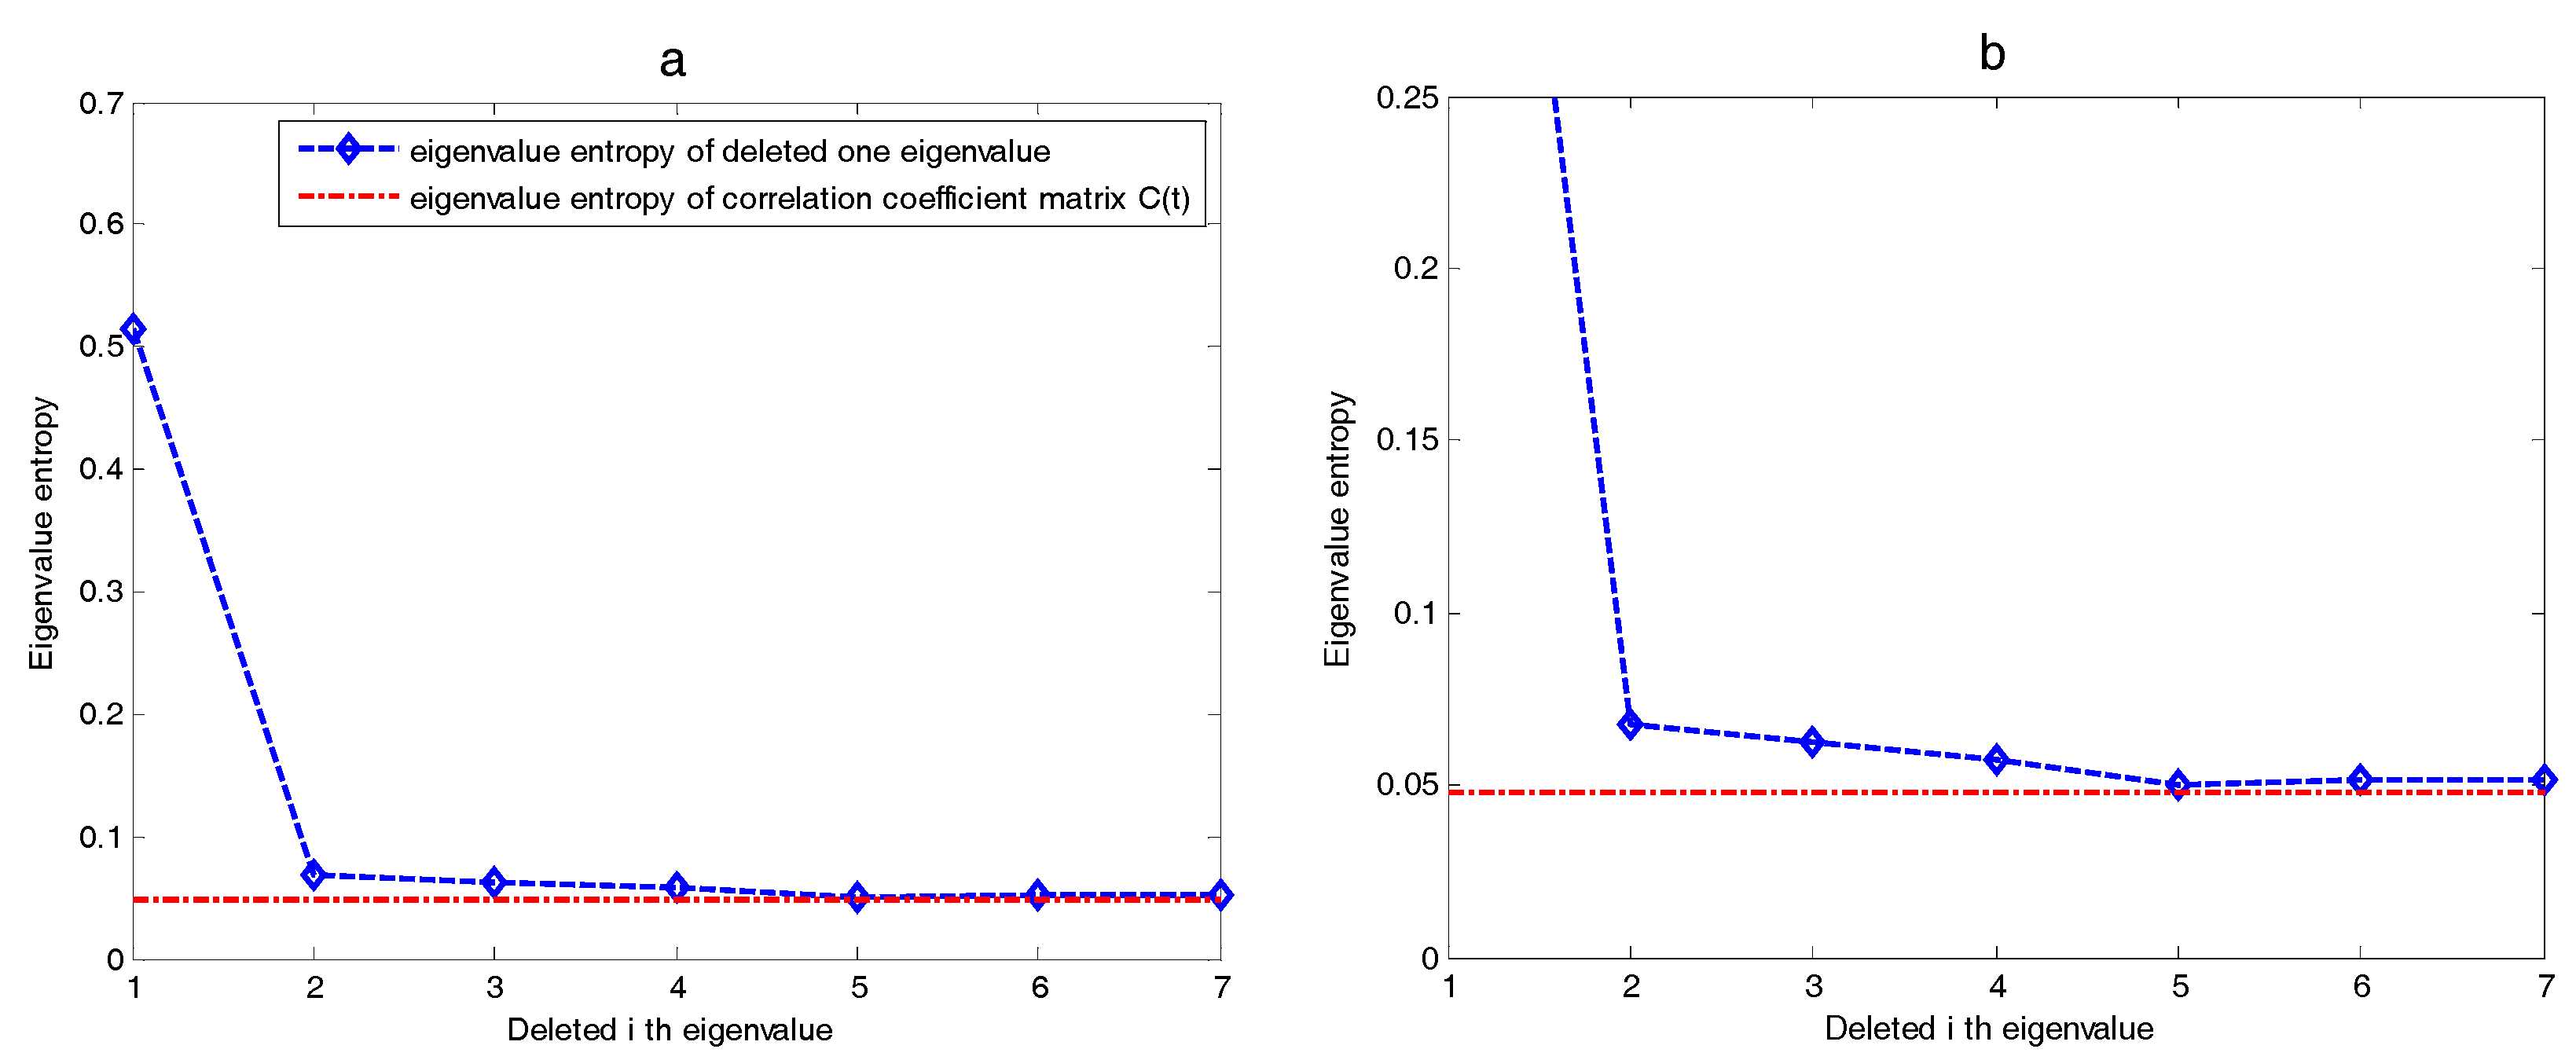
Figure 9.
(a) The evolution image of eigenvector . (b) The evolution image of eigenvector . (c) The evolution image of eigenvector .
Figure 9.
(a) The evolution image of eigenvector . (b) The evolution image of eigenvector . (c) The evolution image of eigenvector .
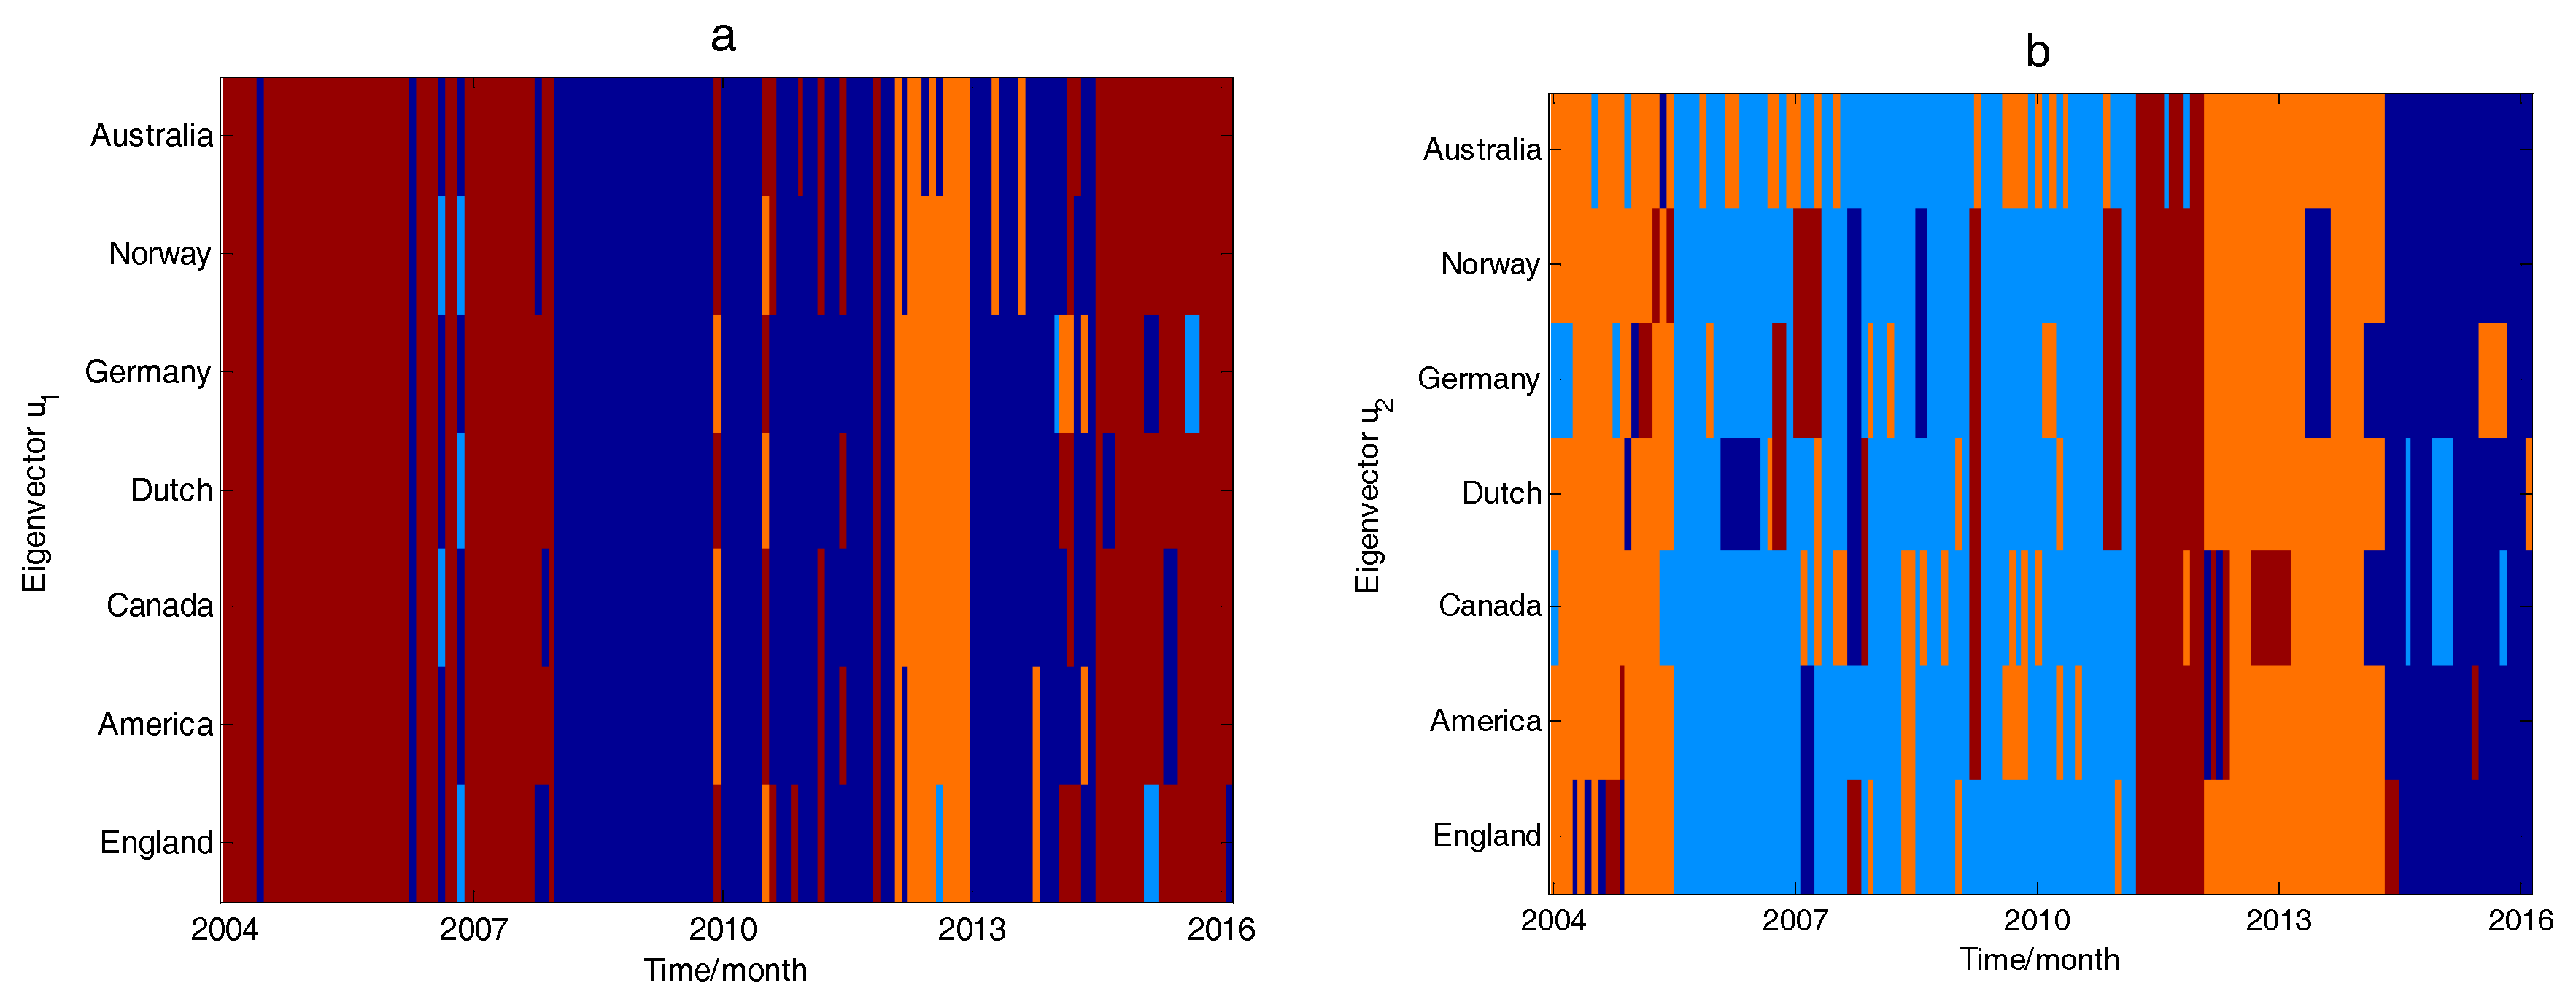
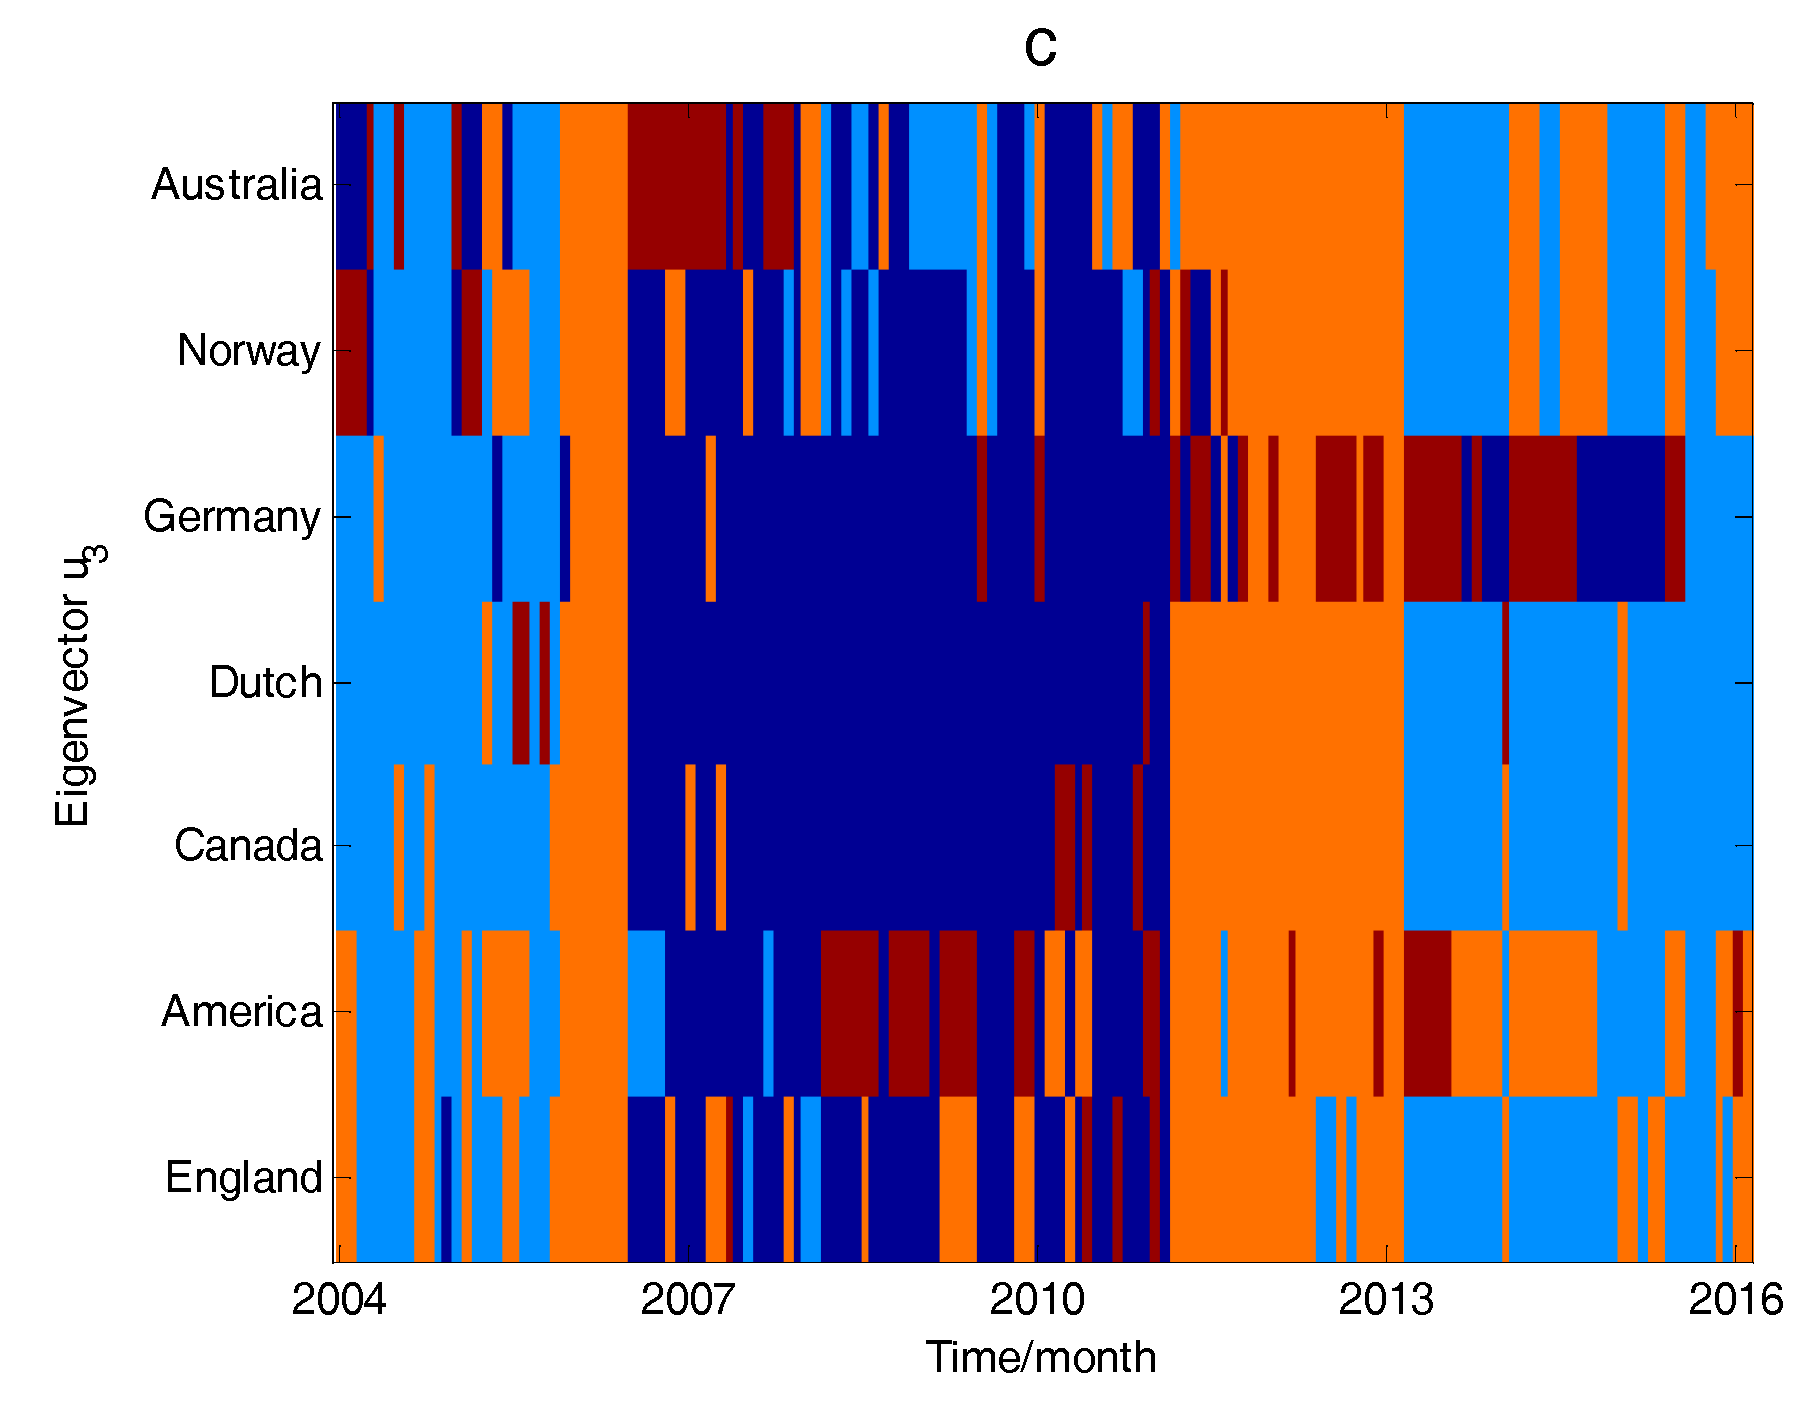
Figure 10.
(a) The evolution image of . (b) The evolution image of . (c) The evolution image of .
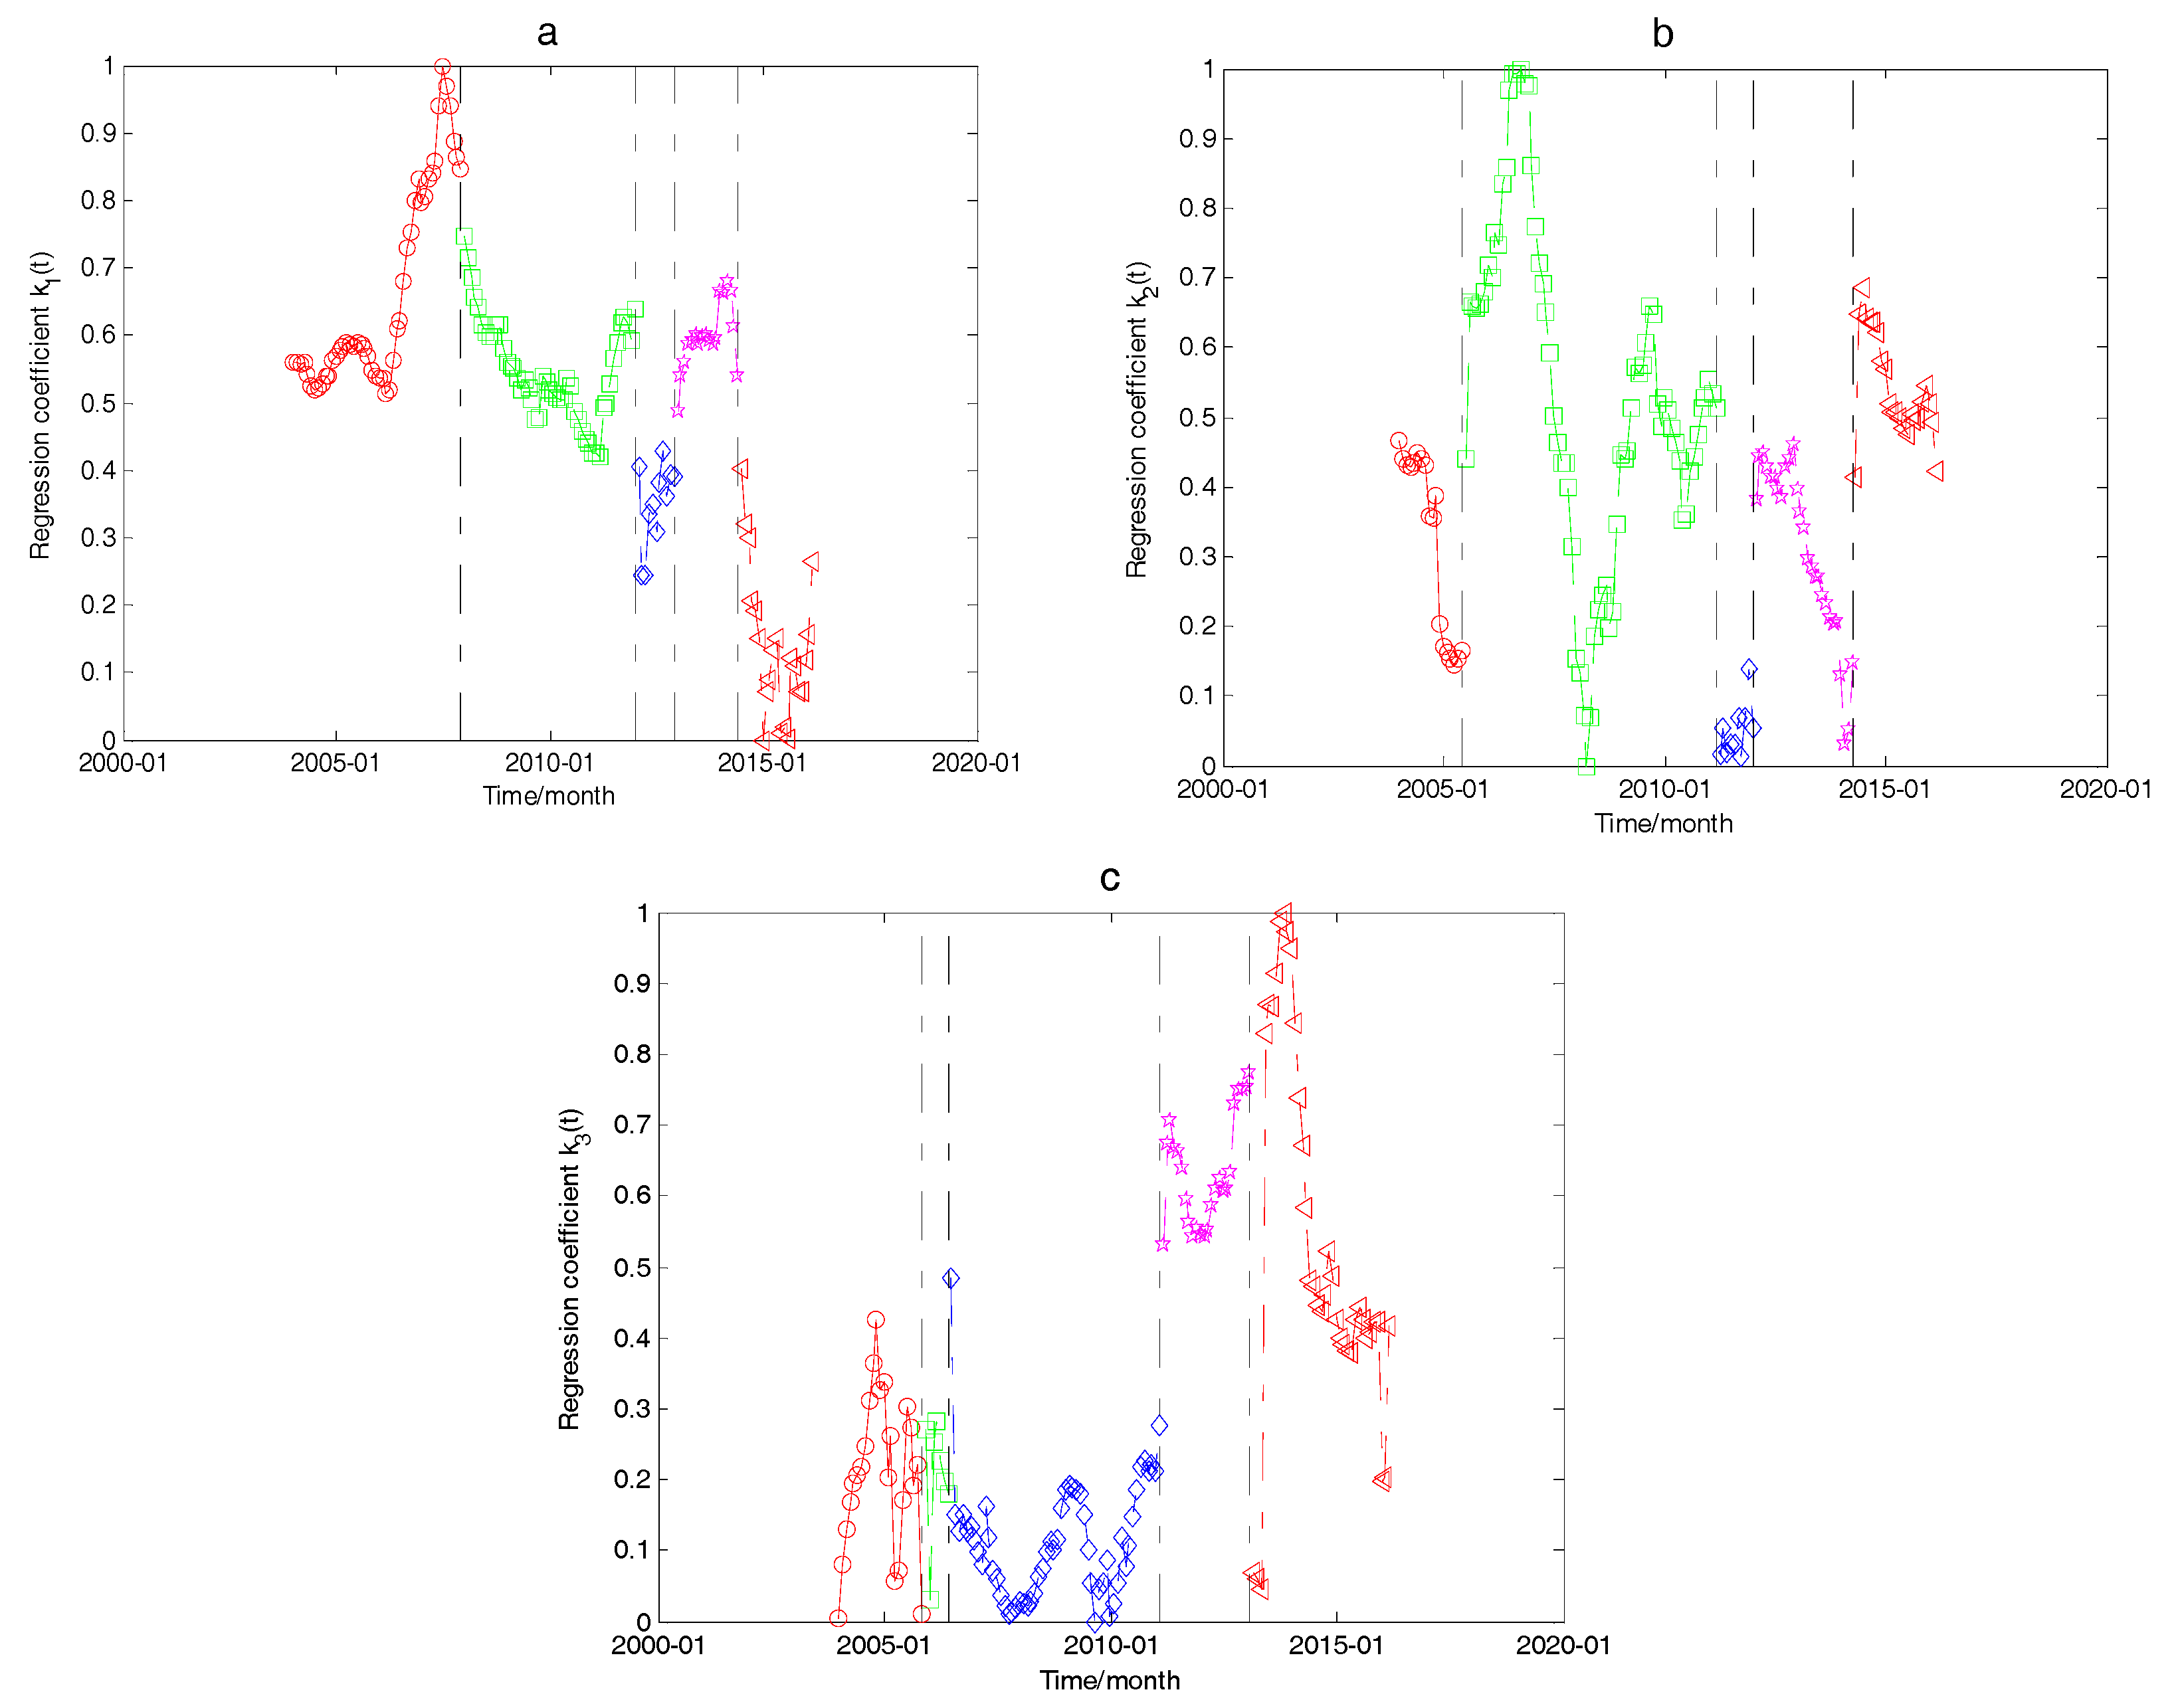
Figure 11.
The relationship between the discontinuity points of the regression coefficients and the turning points of the average natural gas imports in OECD countries.
Figure 11.
The relationship between the discontinuity points of the regression coefficients and the turning points of the average natural gas imports in OECD countries.
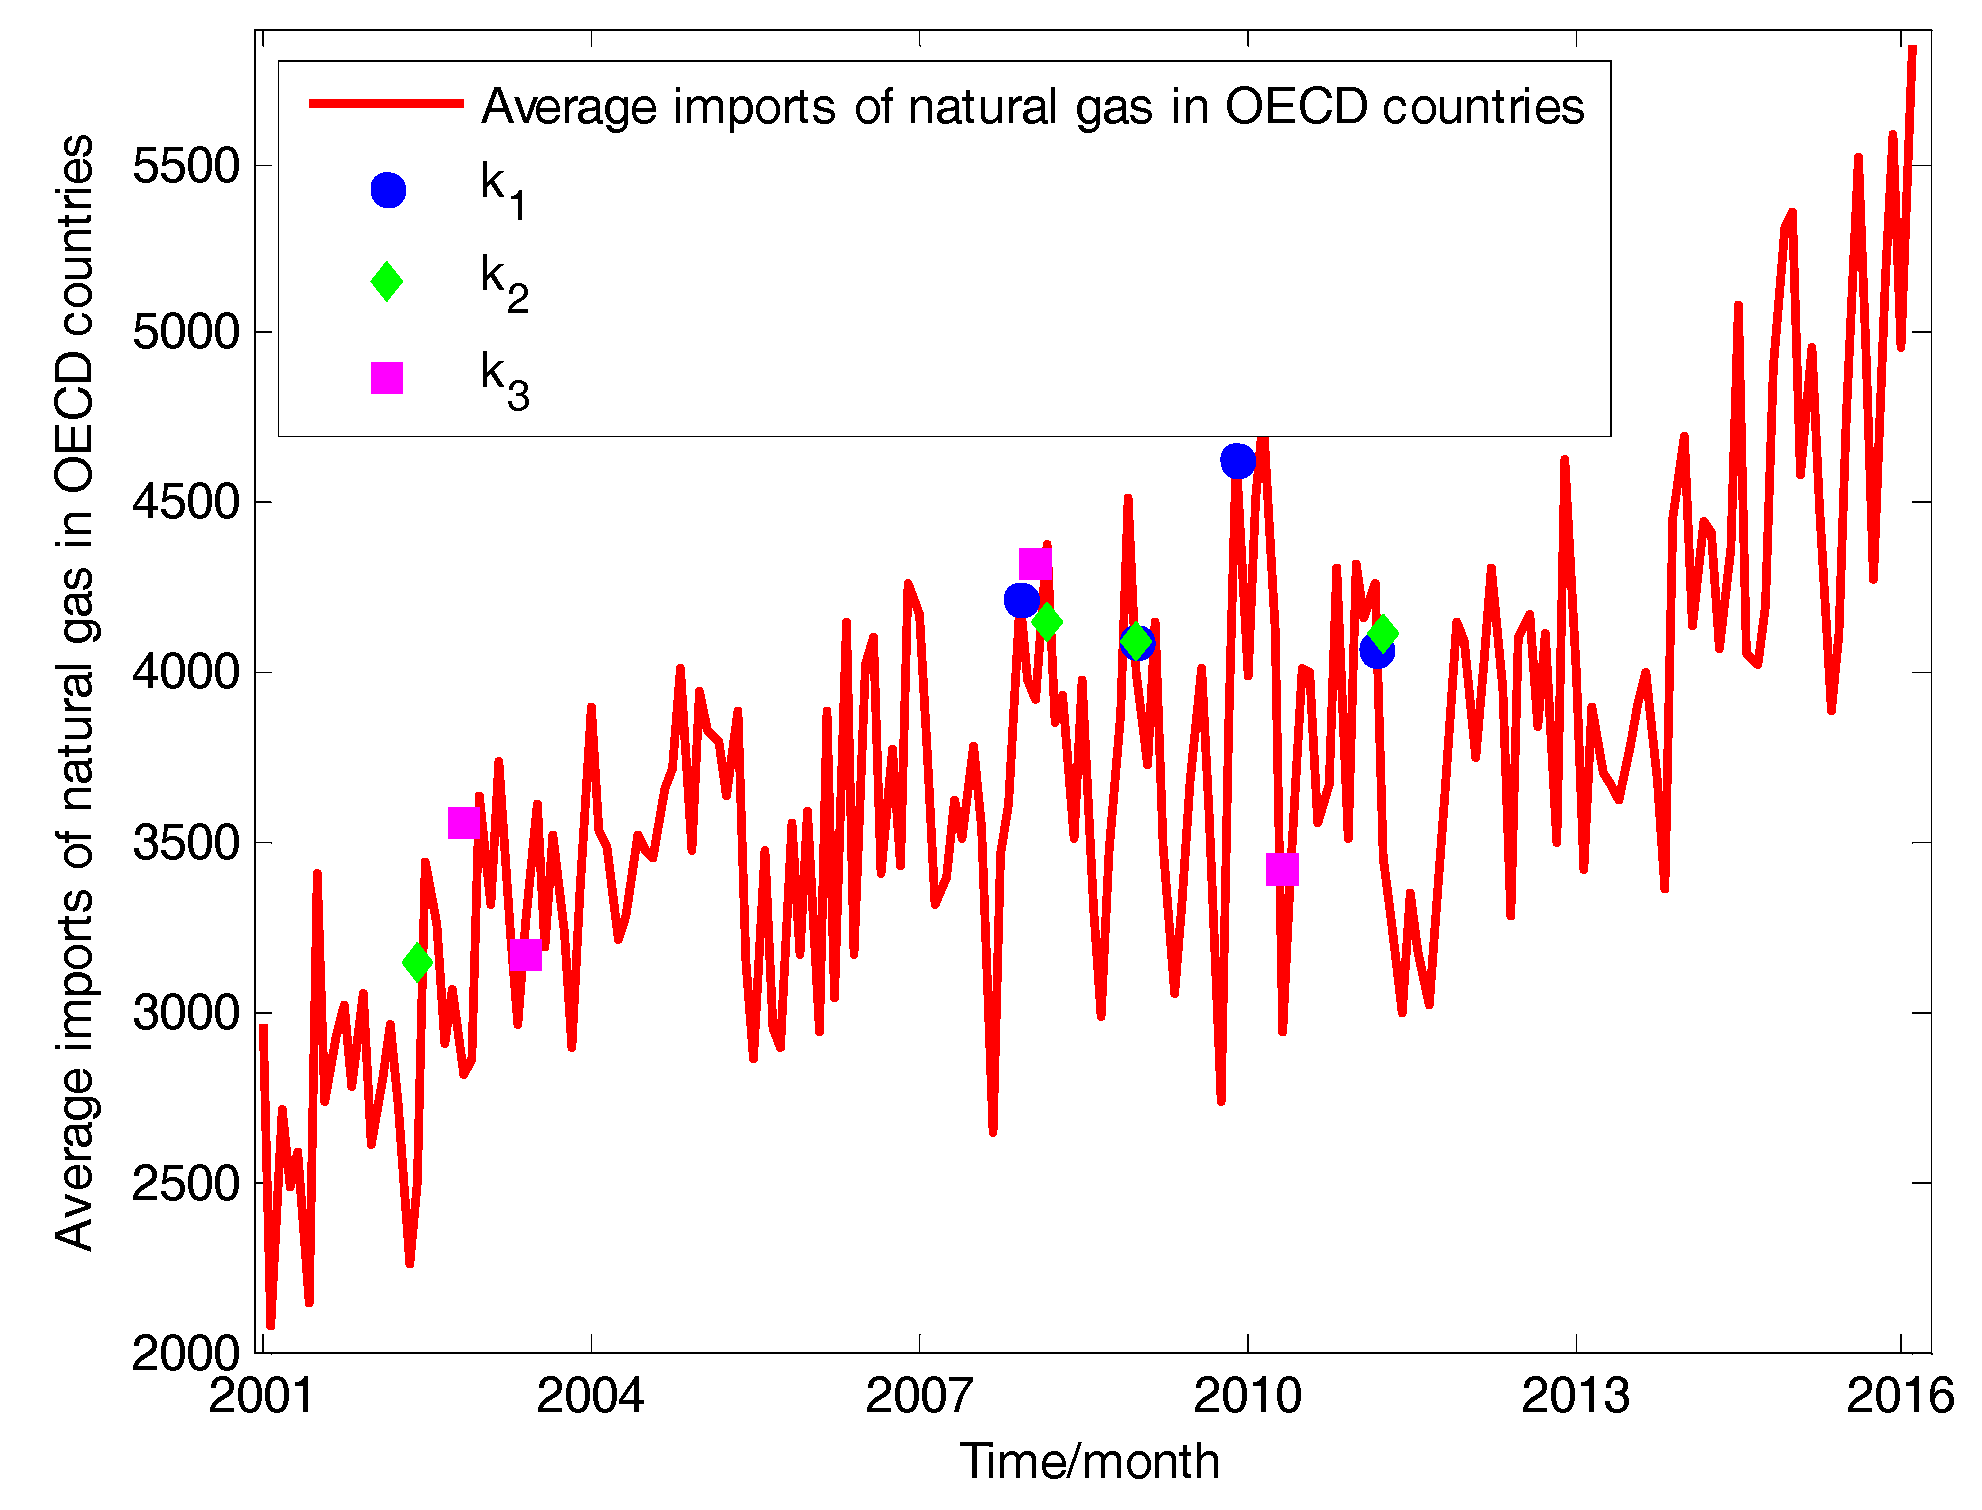
Figure 12.
The evolution image of absorption ratio.

Figure 13.
The clustering evolution diagram of every country.
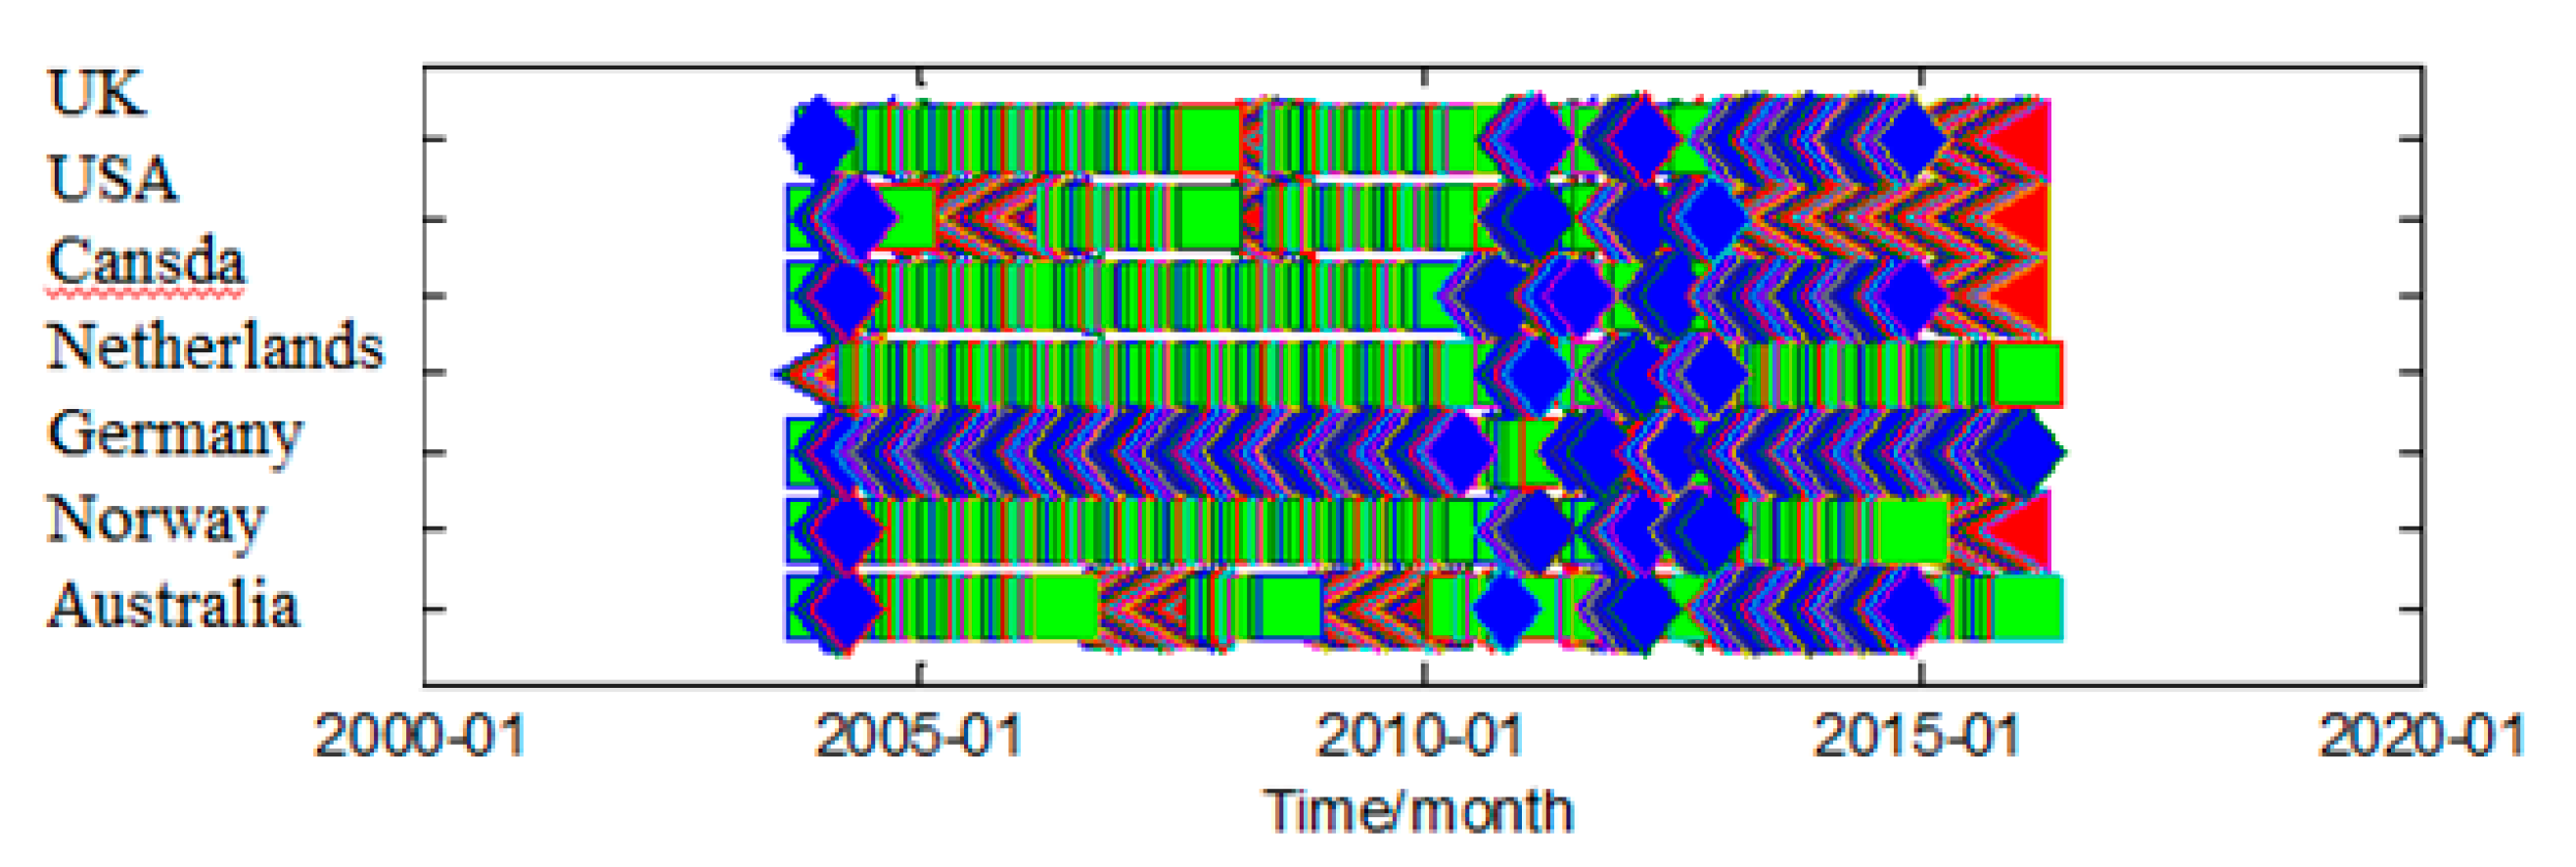
Figure 14.
Scatter diagram of Australia, Canada and the United Kingdom.


Table 1.
Eigenvalue entropy when the ith eigenvalue is removed.
| Eigenvalue Entropy in Each Case | The Value of the Characteristic Entropy |
|---|---|
| Eigenvalue entropy with the maximum eigenvalues | 0.0476 |
| The eigenvalue entropy of the largest eigenvalue is removed | 0.5154 |
| The eigenvalue entropy of the second largest eigenvalue is removed | 0.0684 |
| The eigenvalue entropy of the third largest eigenvalue is removed | 0.0618 |
| The eigenvalue entropy of the fourth largest eigenvalue is removed | 0.0587 |
| The eigenvalue entropy of the fifth largest eigenvalue is removed | 0.0516 |
| The eigenvalue entropy of the sixth largest eigenvalue is removed | 0.0523 |
| The eigenvalue entropy of the seventh eigenvalue is removed | 0.0520 |
Table 2.
The examination of Pearson correlation.
| The Correlation Coefficient between the Variables and The p Value | |||||
|---|---|---|---|---|---|
| Correlation Coefficient | p Value | ||||
| Canada | United Kingdom | Canada | United Kingdom | ||
| Australia | 0.8663803 | 0.9271938 | Australia | 2.2 × 10⁻¹⁶ | 2.2 × 10⁻¹⁶ |
| Canada | 0.9041986 | Canada | 2.2 × 10⁻¹⁶ | ||
© 2017 by the authors. Licensee MDPI, Basel, Switzerland. This article is an open access article distributed under the terms and conditions of the Creative Commons Attribution (CC BY) license (http://creativecommons.org/licenses/by/4.0/).
Share and Cite
MDPI and ACS Style
Fu, M.; Yang, Y.; Tian, L.; Zhen, Z. The Spatiotemporal Dynamics of Natural Gas Imports in OECD Countries. Sustainability 2017, 9, 2106. https://doi.org/10.3390/su9112106
AMA Style
Fu M, Yang Y, Tian L, Zhen Z. The Spatiotemporal Dynamics of Natural Gas Imports in OECD Countries. Sustainability. 2017; 9(11):2106. https://doi.org/10.3390/su9112106
Chicago/Turabian StyleFu, Min, Yang Yang, Lixin Tian, and Zaili Zhen. 2017. "The Spatiotemporal Dynamics of Natural Gas Imports in OECD Countries" Sustainability 9, no. 11: 2106. https://doi.org/10.3390/su9112106
Note that from the first issue of 2016, this journal uses article numbers instead of page numbers. See further details here.