Real-Time Monitoring System Using Smartphone-Based Sensors and NoSQL Database for Perishable Supply Chain


1
u-SCM Research Center, Nano Information Technology Academy, Dongguk University, Seoul 100715, Korea
2
Department of Industrial and Systems Engineering, Dongguk University, Seoul 100715, Korea
*
Author to whom correspondence should be addressed.
Sustainability 2017, 9(11), 2073; https://doi.org/10.3390/su9112073
Submission received: 11 October 2017
/
Revised: 5 November 2017
/
Accepted: 8 November 2017
/
Published: 10 November 2017
(This article belongs to the Special Issue Sustainability in Food Supply Chain and Food Industry)
Abstract
:Since customer attention is increasing due to growing customer health awareness, it is important for the perishable food supply chain to monitor food quality and safety. This study proposes a real-time monitoring system that utilizes smartphone-based sensors and a big data platform. Firstly, we develop a smartphone-based sensor to gather temperature, humidity, GPS, and image data. The IoT-generated sensor on the smartphone has characteristics such as a large amount of storage, an unstructured format, and continuous data generation. Thus, in this study, we propose an effective big data platform design to handle IoT-generated sensor data. Furthermore, the abnormal sensor data generated by failed sensors is called outliers and may arise in real cases. The proposed system utilizes outlier detection based on statistical and clustering approaches to filter out the outlier data. The proposed system was evaluated for system and gateway performance and tested on the kimchi supply chain in Korea. The results showed that the proposed system is capable of processing a massive input/output of sensor data efficiently when the number of sensors and clients increases. The current commercial smartphones are sufficiently capable of combining their normal operations with simultaneous performance as gateways for transmitting sensor data to the server. In addition, the outlier detection based on the 3-sigma and DBSCAN were used to successfully detect/classify outlier data as separate from normal sensor data. This study is expected to help those who are responsible for developing the real-time monitoring system and implementing critical strategies related to the perishable supply chain.
1. Introduction
The usage of Internet of Things (IoT) sensors has greatly increased due to being cheaper, smaller, less power-consuming, and easier to use. The IoT sensors typically collect a huge amount of data and send it to a remote server. The data collected by the sensors must be analyzed and presented for different purposes. Various IoT architectures have been applied to many different areas and have demonstrated the potential of the IoT for improving the quality of life of our society [1]. All IoT applications require one or more sensors to collect data from the environment. Aloi et al. (2017) explained that smartphones may be used as a flexible gateway to collect and forward data received from different sensors/IoT devices to the internet [2]. The smartphone, specifically, is a very handy and user-friendly mobile device that has a host of built-in communication and data-processing features. With the increasing popularity of smartphones, researchers are showing an interest in building smart IoT solutions using smartphones because of their embedded sensors, such as accelerometers, digital compasses, gyroscopes, global positioning systems (GPS), microphones, and cameras. Applications of smartphone-based sensors have been utilized in many areas [3]. Collectively, these sensors are enabling new applications across a wide variety of domains, such as healthcare [4,5], agriculture [6], and transportation [7].
It is important for the perishable food supply chain to monitor food quality and safety, as customer attention is increasing due to growing consumer health awareness [8]. Previous research has shown that temperature is the most critical factor affecting perishable food safety and quality. Therefore, a temperature monitoring system is required to monitor perishable food quality in the supply chain [9,10] and IoT sensors could be utilized for this temperature monitoring system. In addition, a real-time monitoring system for agriculture has been applied in the past. That study utilized the sensor network to gather environmental sensing data, while the relational database was used to store the sensor data [11].
By utilizing smartphones, environmental conditions such as temperature and humidity may be collected. In addition, information on the location of the device and images may be gathered from the GPS sensor and built-in camera, respectively. Previous research [12] utilized the camera as well as the temperature and humidity sensors in the smartphone to collect information on agricultural events from rural farmers. In addition, the smartphone-based sensors were used as soil-color sensors. Soil-color information was read from images taken by built-in digital cameras on smartphones and processed using image processing techniques [13]. Smartphone-based sensors have also been used in agriculture to monitor employees during their work at the farm [14] and to detect tractor rollovers, as well in order to report emergency events [15].
Using the various IoT application sensors in smartphones will generate a huge amount of sensor data on the server side. Thus, a big data platform is needed to handle the large amount of unstructured and continuously generated real-time sensor data. Previous research showed that the Not Only SQL (NoSQL) database is capable of processing a massive input/output of unstructured data efficiently, and that it is easy to add servers when the number of sensors or clients increases [16]. Furthermore, due to the imperfect nature of the sensing device and the flimsiness of the network, some of the data collected may be incomplete, creating outlier sensing data [17]. The outliers of the sensing data are referred to as abnormal sensed values/sudden changes and are extremely different from the rest of the data. As such, it may introduce errors into sensed data analysis.
This study proposes a real-time monitoring system that utilizes the temperature, humidity, GPS, and camera sensors in smartphones to gather data on the environmental conditions of perishable food during transportation and storage. The Smartphones, which can collect the sensor data, are utilized by the staff (employee) and installed inside the cold storage of the transporter, producer, and distributor. As may be expected, the sensors will be exposed to a huge number of environmental conditions (temperature, humidity, GPS, and image sensor data), and, as such, this study utilizes a NoSQL database to handle the big data of the IoT sensors. In addition, outlier detection will be developed in order to find outliers and discover interesting events. A statistical-and clustering-based outlier detection approach will be utilized to detect outliers in the sensor data. The integration of these technologies (smartphone-based sensors, a NoSQL database, and outlier detection methods) should ensure the quality and safety of the agricultural food products throughout the supply chain.
2. Literature Review
2.1. Monitoring System in Food Supply Chain
Nowadays, consumers have become increasingly concerned about the quality and safety of food products. As a result, the quality control and assurance standards in the food industry are emerging or have already been implemented in various countries worldwide. By implementing quality assurance systems, consumers receive benefits in terms of better quality and safer food supply [8]. It is essential for the food industry to implement the systems necessary to improve quality assurance, food product integrity, food safety guarantees, and the transparency associated with these concepts along the complete food supply chains.
Temperature is the most critical factor affecting the safety and quality of perishable foods during the journey from producers to consumers. Therefore, it is important to keep foods at a safe temperature throughout the entire food supply chain. In recent years, IoT sensors have increasingly been applied in the food industry due to their promising capabilities. A real-time-monitoring, online-decision-support system based on RFID and sensor networks was developed to improve the delivery system for perishable products [18]. The proposed system monitors environmental conditions in real-time and provides warnings should the temperature, humidity, or other factors exceed the safety limit. The combination of monitoring and a decision-making support system showed promising results in reducing transportation losses. In addition, Aung and Chang (2014) utilized WSN-based temperature control and management and found that the system was crucial for delivering perishable food products to consumers. The system also ensured that the food was in good condition and safe to eat [9]. Furthermore, Thakur and Foras (2015) have developed an EPCIS-based online system for time-temperature monitoring in a cold meat chain [10]. The system was tested during the transportation of chilled lamb products and temperature sensor data was collected from RFID-based temperature sensors. By implementing the monitoring system, the losses caused by quality deterioration due to temperature variations were reduced, thus improving the performance of the whole food supply chain.
The implementation of traceability and monitoring system ensures quality and sustainability in food supply chain. A traceability system provides track and trace for the complete food information, thereby guaranteeing food quality and safety [19,20]. Manzini and Accorsi (2013) proposed conceptual framework for food supply chain which simultaneously control the quality, safety, sustainability, and logistics efficiency of food products and processes along the whole food supply chain [21]. Pizzuti and Mirabelli (2015) proposed global track and trace system based on the integration of parameters and data within the business process model generated to represent the behaviour of the whole supply chain. The system is expected to be adapted to different supply chains [22]. In addition, food traceability should be considered as an important part of logistics management in the food supply chain so that the product can be checked for safety and quality control, traced upward, and tracked downward at any time required [23].
The concept of sustainability is based on three important dimensions: they are economic dimension (relates to the efficient use of resources), environmental dimension (ensuring the natural resources are available in the future), and social dimension (human health and welfare) [24]. Sustainability in food supply chain is necessary and one of the most important challenges is to ensure sustainable development and growth starting from the sharing of information among all the actors of the sector. Wognum et al. (2011) studied the current status of information systems to support sustainability in food supply chains [25]. The current study showed that traceability system serves mainly the social dimension of sustainability. The traceability system provides an effective and efficient platform to ensure consumer health by efficiently monitoring the food quality and safety in the complete life cycle of the food products. Furthermore, current study stated that environmental impact is not necessarily traceable directly to the end product and suggested that an extensive investigation of environmental policy through company websites for specific quality labels should be implemented to complement the traceability systems.
Current IoT technologies virtualization can be used dynamically in the operational management of food supply chains. Previous studies utilized virtualization, which allows for simulation of food process using software instead of by conducting physical experiments [26,27]. Verdow et al. (2016) proposed the concept of virtual food supply chains from an Internet of Things perspective [26]. The virtualization model was tested on a case study of a fish supply chain and showed that the proposed model enables supply chain actors to monitor, control, and plan, as well as optimize, business processes remotely in real-time. In addition, Accorsi et al. (2017) studied the implementation of the IoT paradigm by proposing a simulation tool that can be applied to generic food supply chains [27]. The proposed simulation tool generalizes the main food supply chain stages that handle different products and varieties but share the processing and logistics chain, including processing and packaging, storage, and distribution to retailers.
2.2. Smartphone-Based Sensors
The smartphone may be used as gateway due to its mobility, low cost, and high computing power. First, the smartphone gathers the sensing data from the sensor device and sends it to the base station (server) at regular intervals. Moron et al. (2014) developed a mobile health system by utilizing the smartphone as a gateway. The smartphone gathers the sensing data from the sensors via Bluetooth and retransmits them to a remote server [4]. This system facilitated continuous, real-time patient tracking by utilizing three Bluetooth-enabled sensors: a pulse-oximeter, a single derivation ECG (electrocardiography) sensor, and a blood pulse monitor. The result of their study showed that modern commercial mobile smart terminals are capable of combining their normal operation as phones or multimedia reproducers and simultaneously performing as medical monitors.
Furthermore, by utilizing their embedded sensors, smartphones may be used as tools to assist in diverse agricultural tasks. Sharma et al. (2013) utilized smartphone-based sensors to gather work activity from farm employees [14]. The working pattern of the farmers and the frequency of visitation were gathered from GPS sensors. A machine-learning algorithm was created to automatically detect farm workers’ activities (e.g., harvesting, bed making, standing still, and walking) based on data collected from various sensors on smartphones. Jagyasi et al. (2011) utilized the built-in digital camera, as well as the temperature and humidity sensor, in the smartphone to collect agricultural events from rural farmers so that they could obtain better advice from the agriculture expert [12]. In addition, the smartphone-based sensors were used as soil color sensors. Soil color information was read from images taken by the built-in digital cameras on smartphones and processed using image processing techniques to transform the RGB color space into colors in XYZ and HVC spaces [13].
The smartphone application was also used to detect a tractor rollover and to report this emergency event [15]. The embedded sensors in the smartphone such as the accelerometer, gyroscope, and GPS sensor were utilized so that sensor data could be gathered. Next, the sensor data was analyzed using a mathematical model to calculate the stability index of the tractor. A warning message appeared on the phone’s screen once the stability index dropped below a certain threshold. In addition, the application sent an email with the date, time, and GPS coordinates of the accident to the emergency contacts.
2.3. NoSQL for Big Data
The IoT sensor applications commonly have storing and large data processing features. As the amount of sensor data and clients grows rapidly, it becomes a difficult task to scale these systems. The traditional SQL database has several limitations on processing large amounts of unstructured data, and to overcome this problem, NoSQL database technologies have been developed. Unstructured data can be stored easily by a NoSQL database because of its ability to modify the database schema. SQL databases use fixed table structures, while NoSQL databases typically use key value stores in which data is stored and retrieved by a key (no fixed data structured). As the result, the NoSQL database is often easier to scale horizontally by adding servers instead of concentrating on creating a greater capacity in a single server. NoSQL databases also have higher performances because they are easier to design and implement, and achieve stable and fast read/write operations with massive data [16].
MongoDB is an open source NoSQL database. MongoDB, unlike relational databases, stores its data in structured documents rather than the fixed tables required by relational databases. For instance, relational tables typically require each row-column intersection to contain a single, scalar value. MongoDB binary JSON (BSON) documents allow for a more complex structure by supporting arrays of values where each array itself may be composed of multiple subdocuments [28,29]. Various studies have evaluated the performance of MongoDB. Veen et al. (2012) compared the read and write performance of NoSQL databases with PostgreSQL for storing and querying sensor data [16]. The results showed that MongoDB is the best solution for storing small or medium sized sensor data, Casandra is best choice for large sensor data, and PostgreSQL has better query capability. Nyati et al. (2013) compared the insertion and searching performance of MongoDB and MySQL in a single machine. The result showed that MongoDB outperformed MySQL in terms of insertion and data searching [30]. Recently, a MongoDB-based repository to handle RFID/sensor big data has been developed [31]. The current study utilized an embedding scheme-based sensor and shard key in a MongoDB database. The result was that by implementing the proposed system, it improved the read performance in the large sensor data repository. In addition, the MongoDB outperformed MySQL for frequently used queries.
It is important to evaluate the performance of NoSQL database from the viewpoint of sensor big data processing. Kumar et al. (2017) proposed the performance comparison of NoSQL database [32]. The result showed that the MongoDB outperformed CouchDB in term of write, read, update and delete test. The performance comparison of MongoDB and OrientDB has been performed in terms of the insert, update, delete, and search tests [33]. The result showed that for the insert, update, and delete tests, the MongoDB showed less response time compared to OrientDB. However, for search test, in which the index setting is enabled, the OrientDB offers a better performance compared to the MongoDB. Li and Manoharan (2013) revealed that the Couchbase and MongoDB are the fastest for read, write, and delete operations [34]. The experiments have been performed by comparison with other NoSQL databases such as RavenDB, CouchDB, and Cassandra. Pereira, et al. (2017) studied the performance comparison of MongoDB, Couchbase, and RethinkDB for multiple thread scenarios [35]. The result showed that the MongoDB had better performance compared to RethinkDB and Couchbase. However, for update and delete test, the Counchbase showed less response time compared to MongoDB and RethinkDB.
Based on previous literatures, the MongoDB showed less response time in terms of the read and write tests compared to other NoSQL databases. In our study, the proposed real-time monitoring system is used to store the huge amount of unstructured sensor data from multiple sensor devices and to present the sensor data in real-time. Therefore, in this study the MongoDB is utilized for real-time monitoring system.
2.4. Outlier Detection
Outlier detection refers to the problem of finding patterns in data that do not conform to expected normal behavior. In the case of sensor data, outliers are generated due to imperfect sensing devices and the flimsy nature of the network, which cause some of the data collected to be incomplete [17]. Sensors easily generate outliers, which introduce errors into sensing queries and data analysis. Outlier detection may be conducted centrally after all the data is collected by the database in the server. In our study, statistical and clustering approaches were used to detect outliers in sensor data.
2.4.1. Statistical-Based Approach
In statistical-based outlier detection, a statistical model that captures the distribution of the data is estimated. After that, the data is evaluated with respect to how well it fits the model. In this technique, a statistical (probability distribution) model is created and used to evaluate whether the data fits the model or not. The data is declared an outlier if the probability of the data instance being generated by this model is very low.
In this study, the 3-Sigma Rule is used to detect outliers based on the statistical approach [36,37]. Given certain environmental conditions, each sensor data becomes a univariate variable (i = 1, …, n), where n is the amount of sensor data that assumes the data will follow a normal distribution. The 3-Sigma rule states that nearly all (99.7%) values lie within three standard deviations of the mean. Thus, if the sample data lies within it is classified as normal data. Otherwise, the data is considered as an outlier.
2.4.2. Clustering-Based Approach
Clustering is a popular approach in data mining that is used to group similar data points into clusters with similar behavior. Clustering may be used as a tool for outlier analysis, and several clustering-based outlier detection techniques have been developed. They rely on the key assumption that normal objects belong to large and dense clusters, while outliers form very small clusters or do not belong to any cluster at all [36].
In this study, Density-Based Spatial Clustering of Applications with Noise (DBSCAN) is used to detect the outliers [38]. The goal is to identify dense regions, which may be measured by the number of objects close to a given point. The points that do not belong to any cluster are treated as outliers. Two important parameters are required for DBSCAN: epsilon (eps) and minimum points (MinPts). The parameter eps defines the radius of neighborhood around a point x (ϵ-neighborhood of x), while MinPts is the minimum number of neighbors within the eps radius. Given the dataset D, which is marked as unvisited, DBSCAN works as follows:
- For each point unvisited in D, mark as visited and find that the ϵ-neighborhood of contains at least MinPts objects.
- If is not already assigned to a cluster, create a new cluster C. Add the objects in the ϵ-neighborhood of to a candidate set N. Add any objects in N (that do not belong to any cluster) to C .
- For each object p in N, mark p as visited and find that the ϵ-neighborhood of contains at least MinPts objects. Those objects in the ϵ-neighborhood of are then added to the candidate set N and assigned to cluster C.
- Iterate through the remaining objects in N and the unvisited points in the data set D.
At the end of the process, those points that do not belong to any cluster are treated as outliers.
3. Methodology
3.1. System Design
The real-time monitoring system is developed to ensure food quality for consumers in the perishable food supply chain. The proposed system utilizes smartphone-based sensors, a big data platform, and outlier detection methods. As may be seen in Figure 1a, the smartphone-based sensors are located in the cold storage of the producers, transporters, and distributors. The smartphone utilizes the temperature-humidity sensors, GPS, and camera. The sensor data that is collected by the sensors is sent by smartphone to the server side. The web-service receives the sensor data and stores it in the MongoDB database. Statistical-based and clustering-based outlier detection methods are used to classify and clean the outliers from the sensor data, which are stored in the MongoDB. Finally, the complete history of the sensor data such as the temperature, humidity, GPS, and image data is presented to the users in a web-based system. In addition, Figure 1b shows the process of outlier detection methods for sensor data in detail. The sensor data are stored in the MongoDB and the data preprocessing is applied for sensor data before passing data to the next phase of the system. Two outlier detection methods, 3-sigma rule and DBSCAN, are utilized to classify the outlier as separate from normal sensor data. Finally, the outliers are presented in the final system. The visualization is necessary for interpreting the result of these discoveries.
In this project, an Android app is developed, installed in every client smartphone, and placed inside of every cold storage in the supply chain. The smartphone utilizes additional temperature and humidity sensors, as well as the embedded sensors in the phone, such as the GPS and camera. During the development stage, the Socket.IO library is used in the Android app to send the sensor data server-side. Socket.IO is a transport protocol that enables real-time, bidirectional, event-based communication between clients (in our case, the smartphone app) and a server. The smartphone works as a gateway by gathering the information from the sensors and retransmitting it to a remote server through a Wi-Fi link. The server-side web-based system is developed based on Express, a flexible Node.js web application framework. The Socket.IO library is utilized server-side so that sensor data sent by gateway is received by the server in real-time. In addition, the MongoDB driver is used by the Node.js application to store the sensor data in the database. The details of the system’s design may be seen in Figure 2.
The IoT-generated sensor data from the gateway has a large, unstructured format and continuous generation characteristics. In this project, two sensor data schemas based on NoSQL and SQL databases are considered. Regarding the NoSQL database, Kang et al. (2016) utilized an embedding scheme-based sensor data repository because the sensor data is rarely modified (raw data) [31]. The current study found that the embedding scheme is appropriate for a large sensor data repository, which requires fast read and write performances. Thus, in this study, we utilize an embedding, scheme-based, sensor data repository, and an example of a sensor document may be seen in Figure 3a. This sensor document consists of the unique ID of the smartphone device, the recorded time, and the sensor data, which is embedded in a sub-document.
In addition, for a traditional SQL-based sensor data repository, two tables are created: the DeviceInfo and sensorData tables seen in Figure 3b. The DeviceInfo table stores the sensor device information and the column deviceID is defined as the primary key, while the sensorData is the relation table, which stores the details of the sensor data from each sensor device by its recorded time. The temperature, humidity, GPS (longitude and latitude), and image data for each sensor device is also stored in this table. In the sensorData table, the column deviceID is the foreign key referencing deviceID in the DeviceInfo table.
3.2. System Implementation
In this project, the sensor monitoring system is applied to the kimchi supply chain, including producers, transporters, distributors, and customers; the details are given in Figure 4. Kimchi is a traditional Korean food prepared by fermenting vegetables and adding spices with probiotic lactic acid bacteria (LAB). Kimchi is considered a vegetable probiotic food that confers health benefits in a similar manner as yogurt and other dairy probiotic foods. The major ingredients of kimchi are cruciferous vegetables, green onions, red pepper powder, garlic, ginger, and fermented seafood (jeotgal) [39]. In the Korean kimchi industry, consumer concerns over food quality and safety are increasing. Eom et al. (2013) suggested that a monitoring system is necessary to predict the changes in fermented food [40]. The current study utilized RFID tags, pH, and temperature sensors to monitor the fermented maturity and quality of kimchi.
Kimchi (the product) is produced in a kimchi factory (the producer) and kept in cold storage. There is a strict policy regarding how long the product may be kept in cold storage. When the product is ready to be delivered, the transporter brings the product to the distribution center, where the product is kept in cold storage again. The product is then delivered by transporter to customers. During storage and transportation, the product must be kept at less than 10 °C to reduce hazards and improve product quality.
The additional temperature and humidity sensors were used for a smartphone-based monitoring system. The commercial temperature and humidity sensor Smart Temp Checker FTC-001 (FTLab, Gyeonggi-do, Korea) was used in this study [41]. The Smart Temp Checker is a small semiconductor sensor that measures temperature and humidity and is designed for individual smartphone use. The Smart Temp Checker plugs into a smartphone’s headphone jack and is compatible with both Android and iOS. In this project, we developed an Android app using the supplied API to integrate the information from the sensor and the smartphone. The smartphone continuously receives temperature and humidity data from the sensor, and GPS data such as the longitude and latitude are gathered from the embedded GPS sensor in the smartphone. Images and data are collected from the front camera of the smartphone. The smartphone acts as an information gateway by gathering information from the sensor and retransmitting it to the remote server through a Wi-Fi link. The web service receives the sensor data and stores it in MongoDB. Figure 5 shows the assembled system with an example screen.
4. Results and Discussion
A real-time monitoring system was developed based on Express, a flexible Node.js web application framework. In addition, a Socket.IO library was utilized to receive sensor data sent from the gateway in real time. The sensor data was stored in MongoDB and presented in the web-based interface, as shown in Figure 6. The web-based system was installed server-side and may be accessed easily through a personal computer (PC), laptop, or mobile device by clients with an internet connection. Figure 6a shows the sensor data history of the temperature, humidity, longitude, latitude, and image. The sensor data is presented with its recorded time (when the sensor data is stored in MongoDB) and device ID (unique information on Android-based smartphones). In this example, the sensor data is collected every 5 seconds from one of the smartphone-based sensors inside the kimchi supply chain network.
The temperature and humidity data is very important to verify perishable agricultural food product quality. In this part, the temperature and humidity sensor data are presented in a graph so that users may easily understand the temperature-humidity history of the products in storage/during transportation in the upstream supply chain, as shown in Figure 6b,c, respectively. In addition, the longitude and latitude data reveals the location of the smartphone-based sensor (gateway). The image data will appear when the user moves the pointer (mouse cursor) over the preview link.
4.1. Performance of MongoDB-Based Real-Time Monitoring System
The proposed MongoDB-based real-time monitoring system should be scalable to accommodate the growing volume of data, queries, and clients without suffering noticeable performance loss. In this study, two performance evaluations were considered based on the capture response time and query response time. Capture response time is used for the write test and defined as the time needed by the sensor monitoring system to store the data in MongoDB. Query response time is used for the read test and defined as the time required by the server to present the data to clients. In this project, a single client computer ran a Java program to write and read sensor data. The client computer connected to a single server machine running a web application based on the Express and Node.js framework. Each test started with an empty database, and both tests (the write and read tests) were performed based on the amount of sensor data and the number of clients. The Java program used threads to simulate multiple clients. The detailed specifications of server and client computers are shown in Table 1.
For the write test, Figure 7a shows that as the amount of sensor data sent to the server increased, the capture response time of the server to store the data also increased. The number of clients also affected the capture response time, since it required more time to store sensor data sent by a high number of clients at the same time. The same pattern occurred for the read test and is presented in Figure 7b. As the number of clients simultaneously accessing the server increased, the query response time required by the server to satisfy requests also increased. The number of objects (sensor data) in the database also affected the query response time, since a large number of objects requires more time from the web application to find the specific records required to satisfy the request.
Node.js processes run on a single process by default. To take advantage of computers with multi-core systems, the Node.js provides a cluster module that allows users to split a single process into multiple processes or workers that run simultaneously and share the same server port [42]. In our experiment, an 8-core CPU was used as the server, and therefore, in order to maximize CPU usage, the cluster module was needed. Figure 7c shows the performance of the read test in a server with the workers setup. In this test, 250,000 sensor data were explored by a different number of clients. The result showed that the cluster module increased the system’s performance. As the number of workers in Node.js increased, less time was necessary to satisfy the requests from clients, especially when the number of clients was high. In addition, the results showed the same pattern as the system required more time to satisfy a high number of clients.
Figure 7d compares the write tests of MongoDB and MySQL. In this test, we used a single client and sent a different amount of sensor data to the server at the same time. The Java Program was developed client-side to send the sensor data to the Node.js web server. The result showed that MongoDB performed better when the amount of sensor data increased than MySQL did. When implemented, MongoDB required less time to store sensor data in the database.
4.2. The Performance of the Smartphone-Based Sensor Monitoring System
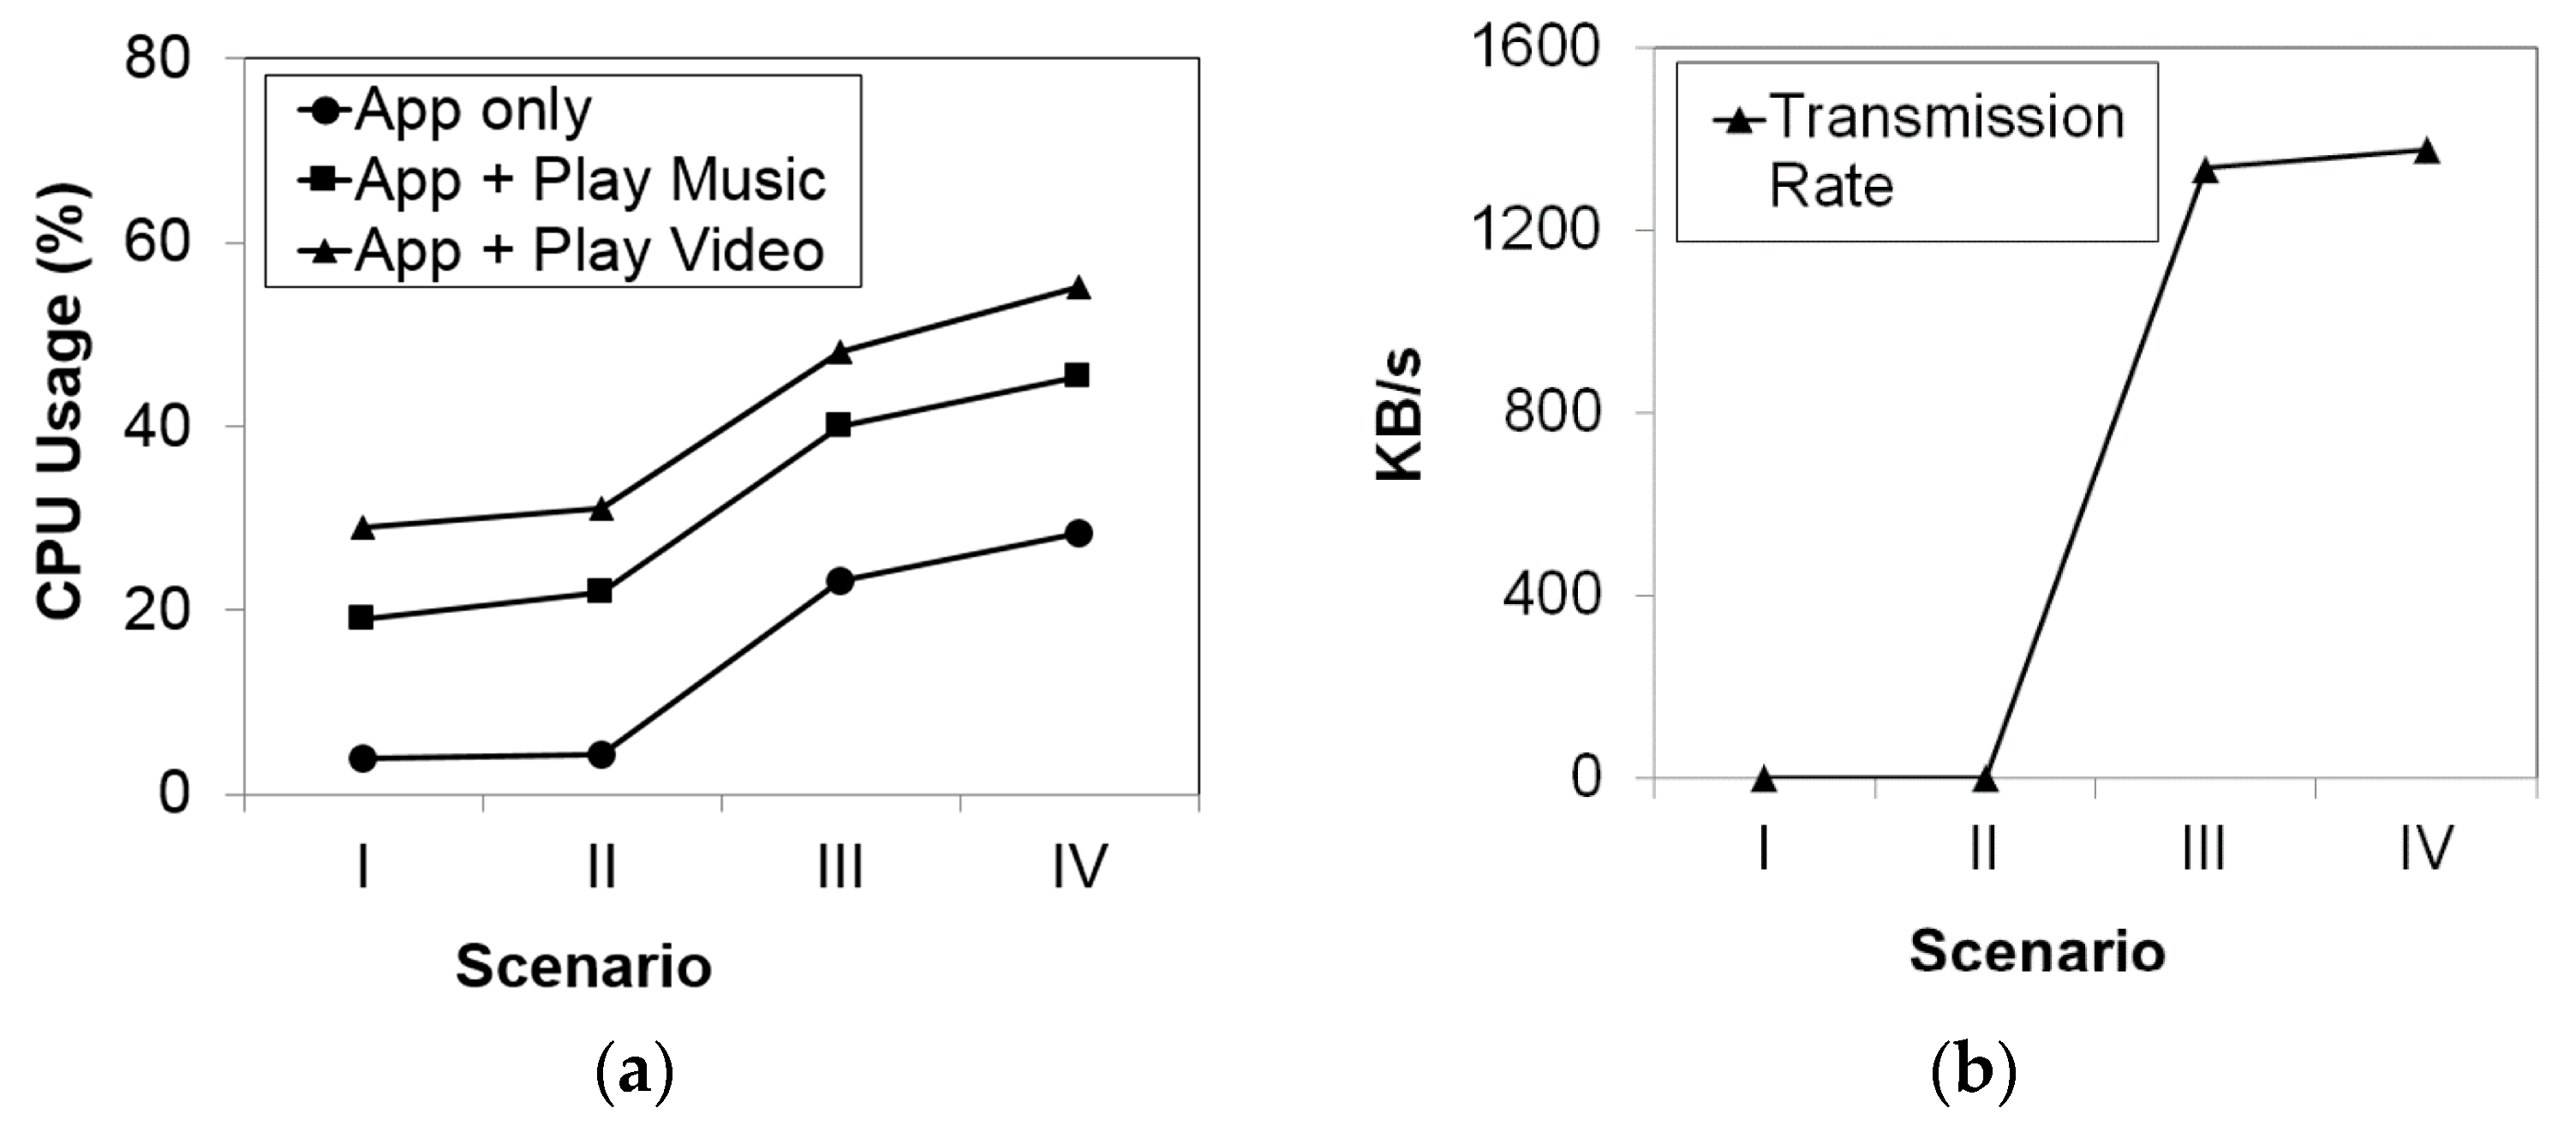
In this project, we defined the smartphone-based sensor monitoring system as an Android app running on an Android-based smartphone and gathering sensor data from a temperature and humidity sensor and the phone’s GPS sensor and camera. In this study, the smartphone app’s various dimensions were analyzed. The smartphone gateway performances were evaluated based on the CPU and transmission rate. Four scenarios were considered in this study. Scenario 1 had the smartphone send the temperature and humidity data to the server, while in scenario 2, the smartphone sent GPS data (longitude and latitude) to the server. In scenario 3, the smartphone sent image data captured by the smartphone’s front camera to the server. The last scenario had the smartphone send all of the sensor data (temperature, humidity, GPS, and image) to the server. For this experiment, a Samsung Galaxy Note 3 with Android OS V5 and 3 GB of RAM was used as the gateway.
The results showed that the CPU usage and transmission rate was affected by the type of sensor data being sent to the server. Figure 8a shows that the smartphone required high CPU usage to send the image data in scenarios 3 and 4 because the size of the image data was higher than any other type of sensor data. In addition, when the app was running alone, it required less CPU usage than it did when music and a video were simultaneously being played on the smartphone at the same time as the app was running. In addition, the transmission rate was also affected by the type of sensor data. Figure 8b confirms that the smartphone required the highest transmission rate to send the image data, which was larger (around 1 MB) than any other type of sensor data (temperature, humidity, or GPS).
4.3. Outlier Detection Methods for Sensor Data
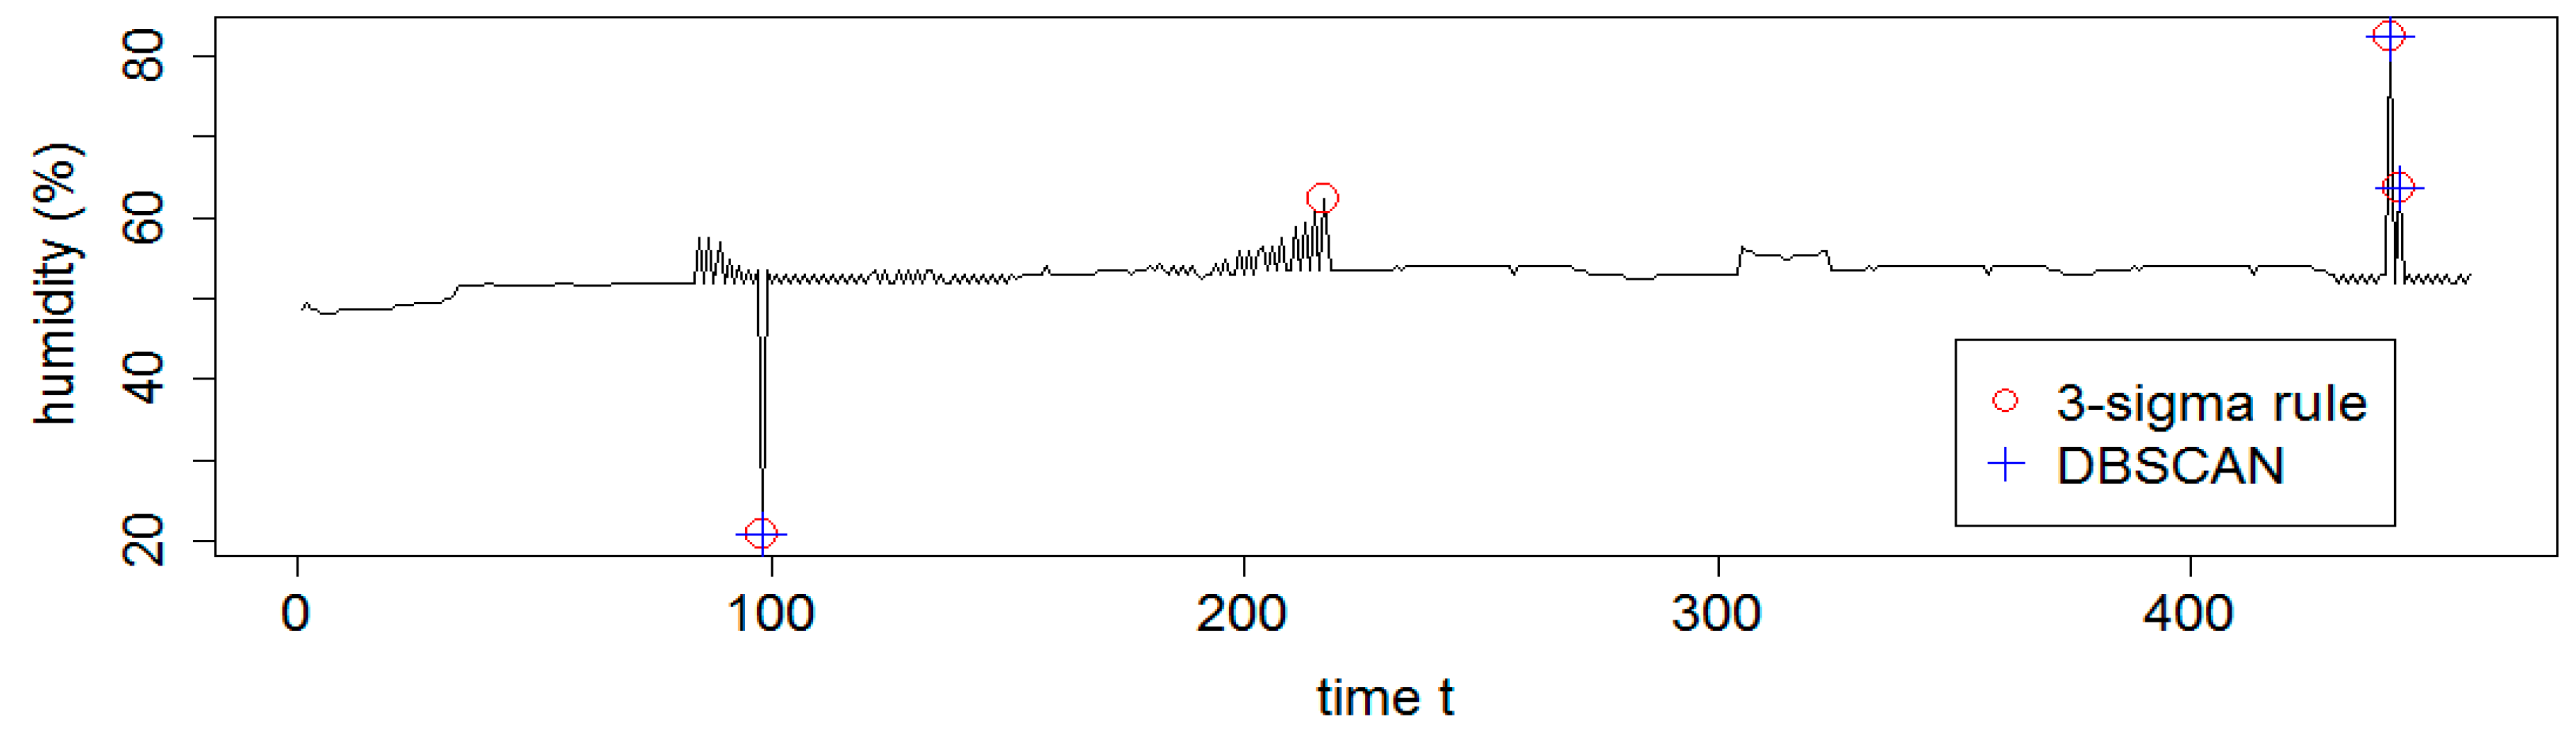
In this experiment, the humidity dataset was gathered from cold storages in the producer’s kimchi supply chain networks. In our dataset, objects are not labeled as ‘normal’ or ‘outlier’, and thus unsupervised outlier detection methods are applied in this study. The statistical method for outlier detection based on the 3-sigma rule is presented here. We assume that the humidity sensor dataset follows a normal distribution, which is determined by two parameters: the mean, µ, and the standard deviation, σ. The 3-sigma rule was applied, and the mean and standard deviation collected from the humidity dataset were 53.013 and 2.677, respectively. Under the assumption of a normal distribution, 99.7% of objects occurred in the µ ± 3σ region. As such, in our dataset, humidity sensor data that occurs above 61.045 (upper limit) or below 44.981 (lower limit) are detected as outliers; these were 62.2, 82.3, 63.7, and 20.7.
In addition, the outlier detection based on DBSCAN was also applied. Using this approach, we tried different setup parameters and found that the optimal parameters for MinPts and eps were 5 and 6, respectively. Using these, the DBSCAN detected 20.7, 82.3, and 63.7 as outliers. The normal humidity sensor data and the outliers detected by the 3-sigma rule and DBSCAN may be seen in detail in Figure 9.
In this study, the 3-sigma rule was applied based on the simple assumption that the temperature and humidity sensor data follow a normal distribution. In reality, the kimchi supply chains keep their products fresh during storage and transportation. The product is strictly controlled and always kept at less than 10 °C [43]. Thus, as may be expected, temperature/humidity sensor data tends to be close to the mean (µ). However, in reality, many other types of dataset have complex distributions, and so the 3-sigma rule may not find true outliers. In the case of DBSCAN, the result depends on the parameters of eps, which defines the radius of neighborhoods from any point in the cluster. A low value of eps will build more clusters and classify un-clustered normal data as outliers, while a high value of eps will generate a lower number of clusters and classify true outliers into clusters (normal data). As such, an appropriate value of eps should be determined first to detect true outliers correctly.
This study utilized existing outlier detection methods to detect/classify outliers as separate from normal sensor data. The evaluation of the 3-sigma rule and DBSCAN cannot be presented in this study, because in our dataset the objects are not labelled; thus, the accuracy for both methods cannot be presented. However, the previous studies [44,45] showed a good performance of DBSCAN for outlier detection (anomaly detection). Thang and Kim (2011) proposed DBSCAN-MP, which provides new way to use DBSCAN with multiple parameters [44]. The method was implemented for network intrusion detection, and the results showed higher detection rate as well as lower false positive rate compared to other algorithms. In addition, Chen and Li (2011) also showed that the intrusion detection based on enhanced DBSCAN algorithm achieved a higher degree of accuracy compared to other method [45].
5. Conclusions
Due to growing health awareness, an efficient solution that ensures food quality for consumers is needed in the perishable food supply chain. This study proposes a real-time monitoring system by utilizing IoT sensors, a big data platform, and data mining methods. The proposed system integrates smartphone-based sensors, MongoDB, and outlier detection methods to provide an efficient and economical platform for environment-sensitive agricultural food products.
The system scalability of the proposed system was presented, and the server performance was given following a write and read test. The results showed that the capture and query response time are affected by the amount of sensor data sent to the server, as well as by the number of clients. As the amount of sensor data and the number of clients increased, the server required more time to satisfy all of the requests. Furthermore, the cluster module in Node.js was utilized to maximize the CPU usage of the server. The result was that the cluster module in Node.js increased the system performance of the multi-core single server. Finally, the performance of MongoDB was compared with an SQL-based database and showed a significantly lower processing time when the amount of sensor data sent by the client increased.
In addition, a smartphone was used as a gateway to send temperature, humidity, GPS, and image data to the server. The result was that the CPU usage and transmission rate were affected by the type of sensor data sent to the server. The smartphone required a higher CPU usage and transmission rate when sending image data compared to other types of sensor data. Furthermore, since outliers occur in sensor data due to imperfections in sensing devices and network communication problems, this study utilized statistical and clustering based outlier detection. The 3-sigma rule and DBSCAN were used to successfully detect/classify outlier data as separate from normal sensor data.
Finally, this study concluded that as the number of sensor data and sensor devices increases, the proposed system is capable of processing the massive input/output of the sensor data efficiently. The current commercial smartphones are sufficiently capable of performing as gateways for transmitting sensor data to the server. This study is expected to help those who are responsible for developing real-time monitoring in the perishable supply chain. In addition, integration of these technologies (NoSQL database, Smartphone-based sensors, and outlier detection) for the real-time monitoring system will increase customer satisfaction, as it can monitor product freshness throughout the complete supply chain.
This study only used a small sensor dataset based on an initial system implementation. With larger datasets, a comparison with other outlier detection methods should be considered in the near future. The sensor dataset collected in this experiment was unlabeled, and thus the accuracy of the outlier detection methods cannot be presented. In addition, a further comparative study amongst the document-based NoSQL database (not only MongoDB) is necessary for sensor data processing.
Acknowledgments
This study was financially supported by the Ministry of Trade, Industry, and Energy (MOTIE) and Korea Institute for Advancement of Technology (KIAT) through the International Cooperative R&D program (Grant number: N053100005).
Author Contributions
Jongtae Rhee conceived and designed the experiments; Muhammad Syafrudin and Ganjar Alfian performed the experiments; Ganjar Alfian analyzed the result and wrote the paper.
Conflicts of Interest
The authors declare no conflict of interest.
References
- Sethi, P.; Sarangi, S.R. Internet of Things: Architectures, Protocols, and Applications. J. Electr. Comput. Eng. 2017. [Google Scholar] [CrossRef]
- Aloi, G.; Caliciuri, G.; Fortino, G.; Gravina, R.; Pace, P.; Russo, W.; Savaglio, C. Enabling IoT interoperability through opportunistic smartphone-based mobile gateways. J. Netw. Comput. Appl. 2017, 81, 74–84. [Google Scholar] [CrossRef]
- Lane, N.D.; Miluzzo, E.; Lu, H.; Peebles, D.; Choudhury, T.; Campbell, A.T. A survey of mobile phone sensing. IEEE Commun. Mag. 2010, 48, 140–150. [Google Scholar] [CrossRef]
- Morón, M.J.; Luque, R.; Casilari, E. On the Capability of Smartphones to Perform as Communication Gateways in Medical Wireless Personal Area Networks. Sensors 2014, 14, 575–594. [Google Scholar] [CrossRef] [PubMed]
- Yang, S.; Gerla, M. Personal Gateway in Mobile Health Monitoring. In Proceedings of the 2011 IEEE International Conference on Pervasive Computing and Communications Workshops (PERCOM Workshops), Seattle, WA, USA, 21–25 March 2011; pp. 636–641. [Google Scholar]
- Pongnumkul, S.; Chaovalit, P.; Surasvadi, N. Applications of Smartphone-Based Sensors in Agriculture: A Systematic Review of Research. J. Sens. 2015, 195308. [Google Scholar] [CrossRef]
- Thiagarajan, A.; Ravindranath, L.; LaCurts, K.; Madden, S.; Balakrishnan, H.; Toledo, S.; Eriksson, J. VTrack: Accurate, Energy-Aware Traffic Delay Estimation Using Mobile Phones. In Proceedings of the 7th ACM Conference on Embedded Networked Sensor Systems, Berkeley, CA, USA, 4–6 November 2009. [Google Scholar]
- Trieneken, J.; Zuurbier, P. Quality and Safety Standards in the food industry, developments and challenges. Int. J. Prod. Econ. 2008, 113, 107–122. [Google Scholar] [CrossRef]
- Aung, M.M.; Chang, Y.S. Temperature management for the quality assurance of a perishable food supply chain. Food Control 2014, 40, 198–207. [Google Scholar] [CrossRef]
- Thakur, M.; Foras, E. EPCIS based online temperature monitoring and traceability in a cold meat chain. Comput. Electron. Agric. 2015, 117, 22–30. [Google Scholar] [CrossRef]
- Ko, D.; Kwak, Y.; Song, S. Real Time Traceability and Monitoring System for Agricultural Products Based on Wireless Sensor Network. Int. J. Distrib. Sens. Netw. 2014. [Google Scholar] [CrossRef]
- Jagyasi, B.G.; Pande, A.K.; Jain, R. Event based experiential computing in agro-advisory system for rural farmers. In Proceedings of the IEEE 7th International Conference on Wireless and Mobile Computing, Networking and Communications (WiMob’11), Washington, DC, USA, 10–12 October 2011; pp. 439–444. [Google Scholar]
- Gómez-Robledo, L.; López-Ruiz, N.; Melgosa, M.; Palma, A.J.; Capitán-Vallvey, L.F.; Sánchez-Marañón, M. Using the mobile phone as munsell soil-colour sensor: An experiment under controlled illumination conditions. Comput. Electron. Agric. 2013, 99, 200–208. [Google Scholar] [CrossRef]
- Sharma, S.; Raval, J.; Jagyasi, B. Mobile sensing for agriculture activities detection. In Proceedings of the 3rd IEEE Global Humanitarian Technology Conference (GHTC 2013), San Jose/Silicon Valley, CA, USA, 20–23 October 2013; pp. 337–342. [Google Scholar]
- Liu, B.; Koc, A.B. Safe Driving: A mobile application for tractor rollover detection and emergency reporting. Comput. Electron. Agric. 2013, 98, 117–120. [Google Scholar] [CrossRef]
- Veen, J.S.; Waaij, B.; Meijer, R.J. Sensor data storage performance: SQL or NoSQL, Physical or Virtual. In Proceedings of the IEEE 5th International Conference on Cloud Computing (CLOUD), Honolulu, HI, USA, 24–29 June 2012; pp. 431–438. [Google Scholar]
- Zhuang, Y.; Chen, L. In-network Outlier Cleaning for Data Collection in Sensor Networks. In Proceedings of the CleanDB, Workshop VLDB, Seoul, Korea, 11 September 2006. [Google Scholar]
- Wang, L.; Kwok, S.K.; Ip, W.H. A radio frequency identification and sensor-based system for the transportation of food. J. Food Eng. 2010, 101, 120–129. [Google Scholar] [CrossRef]
- Aung, M.M.; Chang, Y.S. Traceability in a food supply chain: Safety and Quality perspective. Food Control 2014, 39, 172–184. [Google Scholar] [CrossRef]
- Dabbene, F.; Gay, P.; Tortia, C. Traceability issues in food supply chain management: A review. Biosyst. Eng. 2014, 120, 65–80. [Google Scholar] [CrossRef]
- Manzini, R.; Accorsi, R. The new conceptual framework for food supply chain assessment. J. Food Eng. 2013, 115, 251–263. [Google Scholar] [CrossRef]
- Pizzuti, T.; Mirabelli, G. The Global Track & Trace System for food: General framework and functioning principles. J. Food Eng. 2015, 159, 16–35. [Google Scholar]
- Bosona, B.; Gebresenbet, G. Food traceability as an integral part of logistics management in food and agricultural supply chain. Food Control 2013, 33, 32–48. [Google Scholar] [CrossRef]
- European Commission—Agriculture Directorate-General. A Framework for Indicators for the Economic and Social Dimensions of Sustainable Agriculture and Rural Development. Available online: http://ec.europa.eu/agriculture/publi/reports/sustain/index_en.pdf (accessed on 3 November 2017).
- Wognum, P.M.N.; Bremmers, H.; Trienekens, J.H.; van der Vorst, J.G.A.J.; Bloemhof, J.M. Systems for sustainability and transparency of food supply chains–Current status and challenges. Adv. Eng. Inform. 2011, 25, 65–76. [Google Scholar] [CrossRef]
- Verdouw, C.N.; Wolfert, J.; Beulens, A.J.M.; Rialland, A. Virtualization of food supply chains with the internet of things. J. Food Eng. 2016, 176, 128–136. [Google Scholar] [CrossRef] [Green Version]
- Accorsi, R.; Bortolini, M.; Baruffaldi, G.; Pilati, F.; Ferrari, E. Internet-of-things Paradigm in Food Supply Chains Control and Management. Procedia Manuf. 2017, 11, 889–895. [Google Scholar] [CrossRef]
- Copeland, R. MongoDB Applied Design Patterns; O‘Reilly Media, Inc.: Sebastopol, CA, USA, 2013. [Google Scholar]
- Chodorow, K. MongoDB: The Definitive Guide; O’Reilly Media, Inc.: Sebastopol, CA, USA, 2013. [Google Scholar]
- Nyati, S.S.; Pawar, S.; Ingle, R. Performance evaluation of unstructured NoSQL data over distributed framework. In Proceedings of the 2013 International Conference on Advances in Computing, Communications and Informatics (ICACCI), Mysore, India, 22–25 August 2013; pp. 1623–1627. [Google Scholar]
- Kang, Y.S.; Park, I.H.; Rhee, J.; Lee, Y.H. MongoDB-based repository design for IoT-generated RFID/sensor big data. IEEE Sens. J. 2015, 16, 485–497. [Google Scholar] [CrossRef]
- Kumar, K.B.S.; Srividya; Mohanavalli, S. A performance comparison of document oriented NoSQL databases. In Proceedings of the International Conference on Computer, Communication and Signal Processing (ICCCSP), Chennai, India, 10–11 January 2017. [Google Scholar] [CrossRef]
- Tavares, A.T.; Oliveira, M.I.S.; Lóscio, B.F. Data producer catalogs for the web of things: A study on NoSQL solutions. In Proceedings of the 31st Annual ACM Symposium on Applied Computing (SAC ’16), Pisa, Italy, 4–8 April 2016. [Google Scholar] [CrossRef]
- Li, Y.; Manoharan, S. A performance comparison of SQL and NoSQL databases. In Proceedings of the IEEE Pacific Rim Conference on Communications, Computers and Signal Processing (PACRIM), Victoria, BC, Canada, 27–29 August 2013. [Google Scholar] [CrossRef]
- Pereira, D.A.; de Morais, W.O.; de Freitas, E.P. NoSQL real-time database performance comparison. Int. J. Parallel, Emerg. Distrib. Syst. 2017. [Google Scholar] [CrossRef]
- Han, J.; Kamber, M.; Pei, J. Data Mining: Concepts and Techniques, 3rd ed.; Morgan Kaufmann Publishers: San Francisco, CA, USA, 2011. [Google Scholar]
- Zhao, Y.; Lehman, B.; Ball, R.; Mosesian, J.; de Palma, J.F. Outlier detection rules for fault detection in solar photovoltaic arrays. In Proceedings of the 2013 Twenty-Eighth Annual IEEE Applied Power Electronics Conference and Exposition (APEC), Long Beach, CA, USA, 17–21 March 2013; pp. 2913–2920. [Google Scholar]
- Ester, M.; Kriegel, H.; Sander, J.; Xu, X. A density-based algorithm for discovering clusters in large spatial databases with noise. In Proceedings of the KDD’96 Proceedings of the Second International Conference on Knowledge Discovery and Data Mining, Portland, OR, USA, 2–4 August 1996. [Google Scholar]
- Park, K.Y.; Jeong, J.K.; Lee, Y.E.; Daily, J.W., III. Health Benefits of Kimchi (Korean Fermented Vegetables) as a Probiotic Food. J. Med. Food 2014, 17, 6–20. [Google Scholar] [CrossRef] [PubMed]
- Eom, K.; Lee, C.H.; Park, S.Y.; Kim, J.W. Fermentation Food Monitoring System using the Smart RFID Sensor Tag. Int. J. Multimed. Ubiquitous Eng. 2013, 8, 55–66. [Google Scholar] [CrossRef]
- Smart Temp Checker. Available online: http://allsmartlab.com/eng/smart-temp-checker-ftc-001/ (accessed on 26 September 2017).
- Cluster Module. Available online: https://nodejs.org/api/cluster.html (accessed on 26 September 2017).
- Lee, G.I.; Lee, H.M.; Lee, C.H. Food safety issues in industrialization of traditional Korean foods. Food Control 2012, 24, 1–5. [Google Scholar] [CrossRef]
- Thang, T.M.; Kim, J. The Anomaly Detection by Using DBSCAN Clustering with Multiple Parameters. In Proceedings of the 2011 International Conference on Information Science and Applications, Jeju Island, Korea, 23 May 2011; pp. 1–5. [Google Scholar]
- Chen, Z.; Li, Y.F. Anomaly Detection Based on Enhanced DBScan Algorithm. Procedia Eng. 2011, 15, 178–182. [Google Scholar] [CrossRef]
Figure 1.
System architecture (a) and outlier detection for sensor data (b).
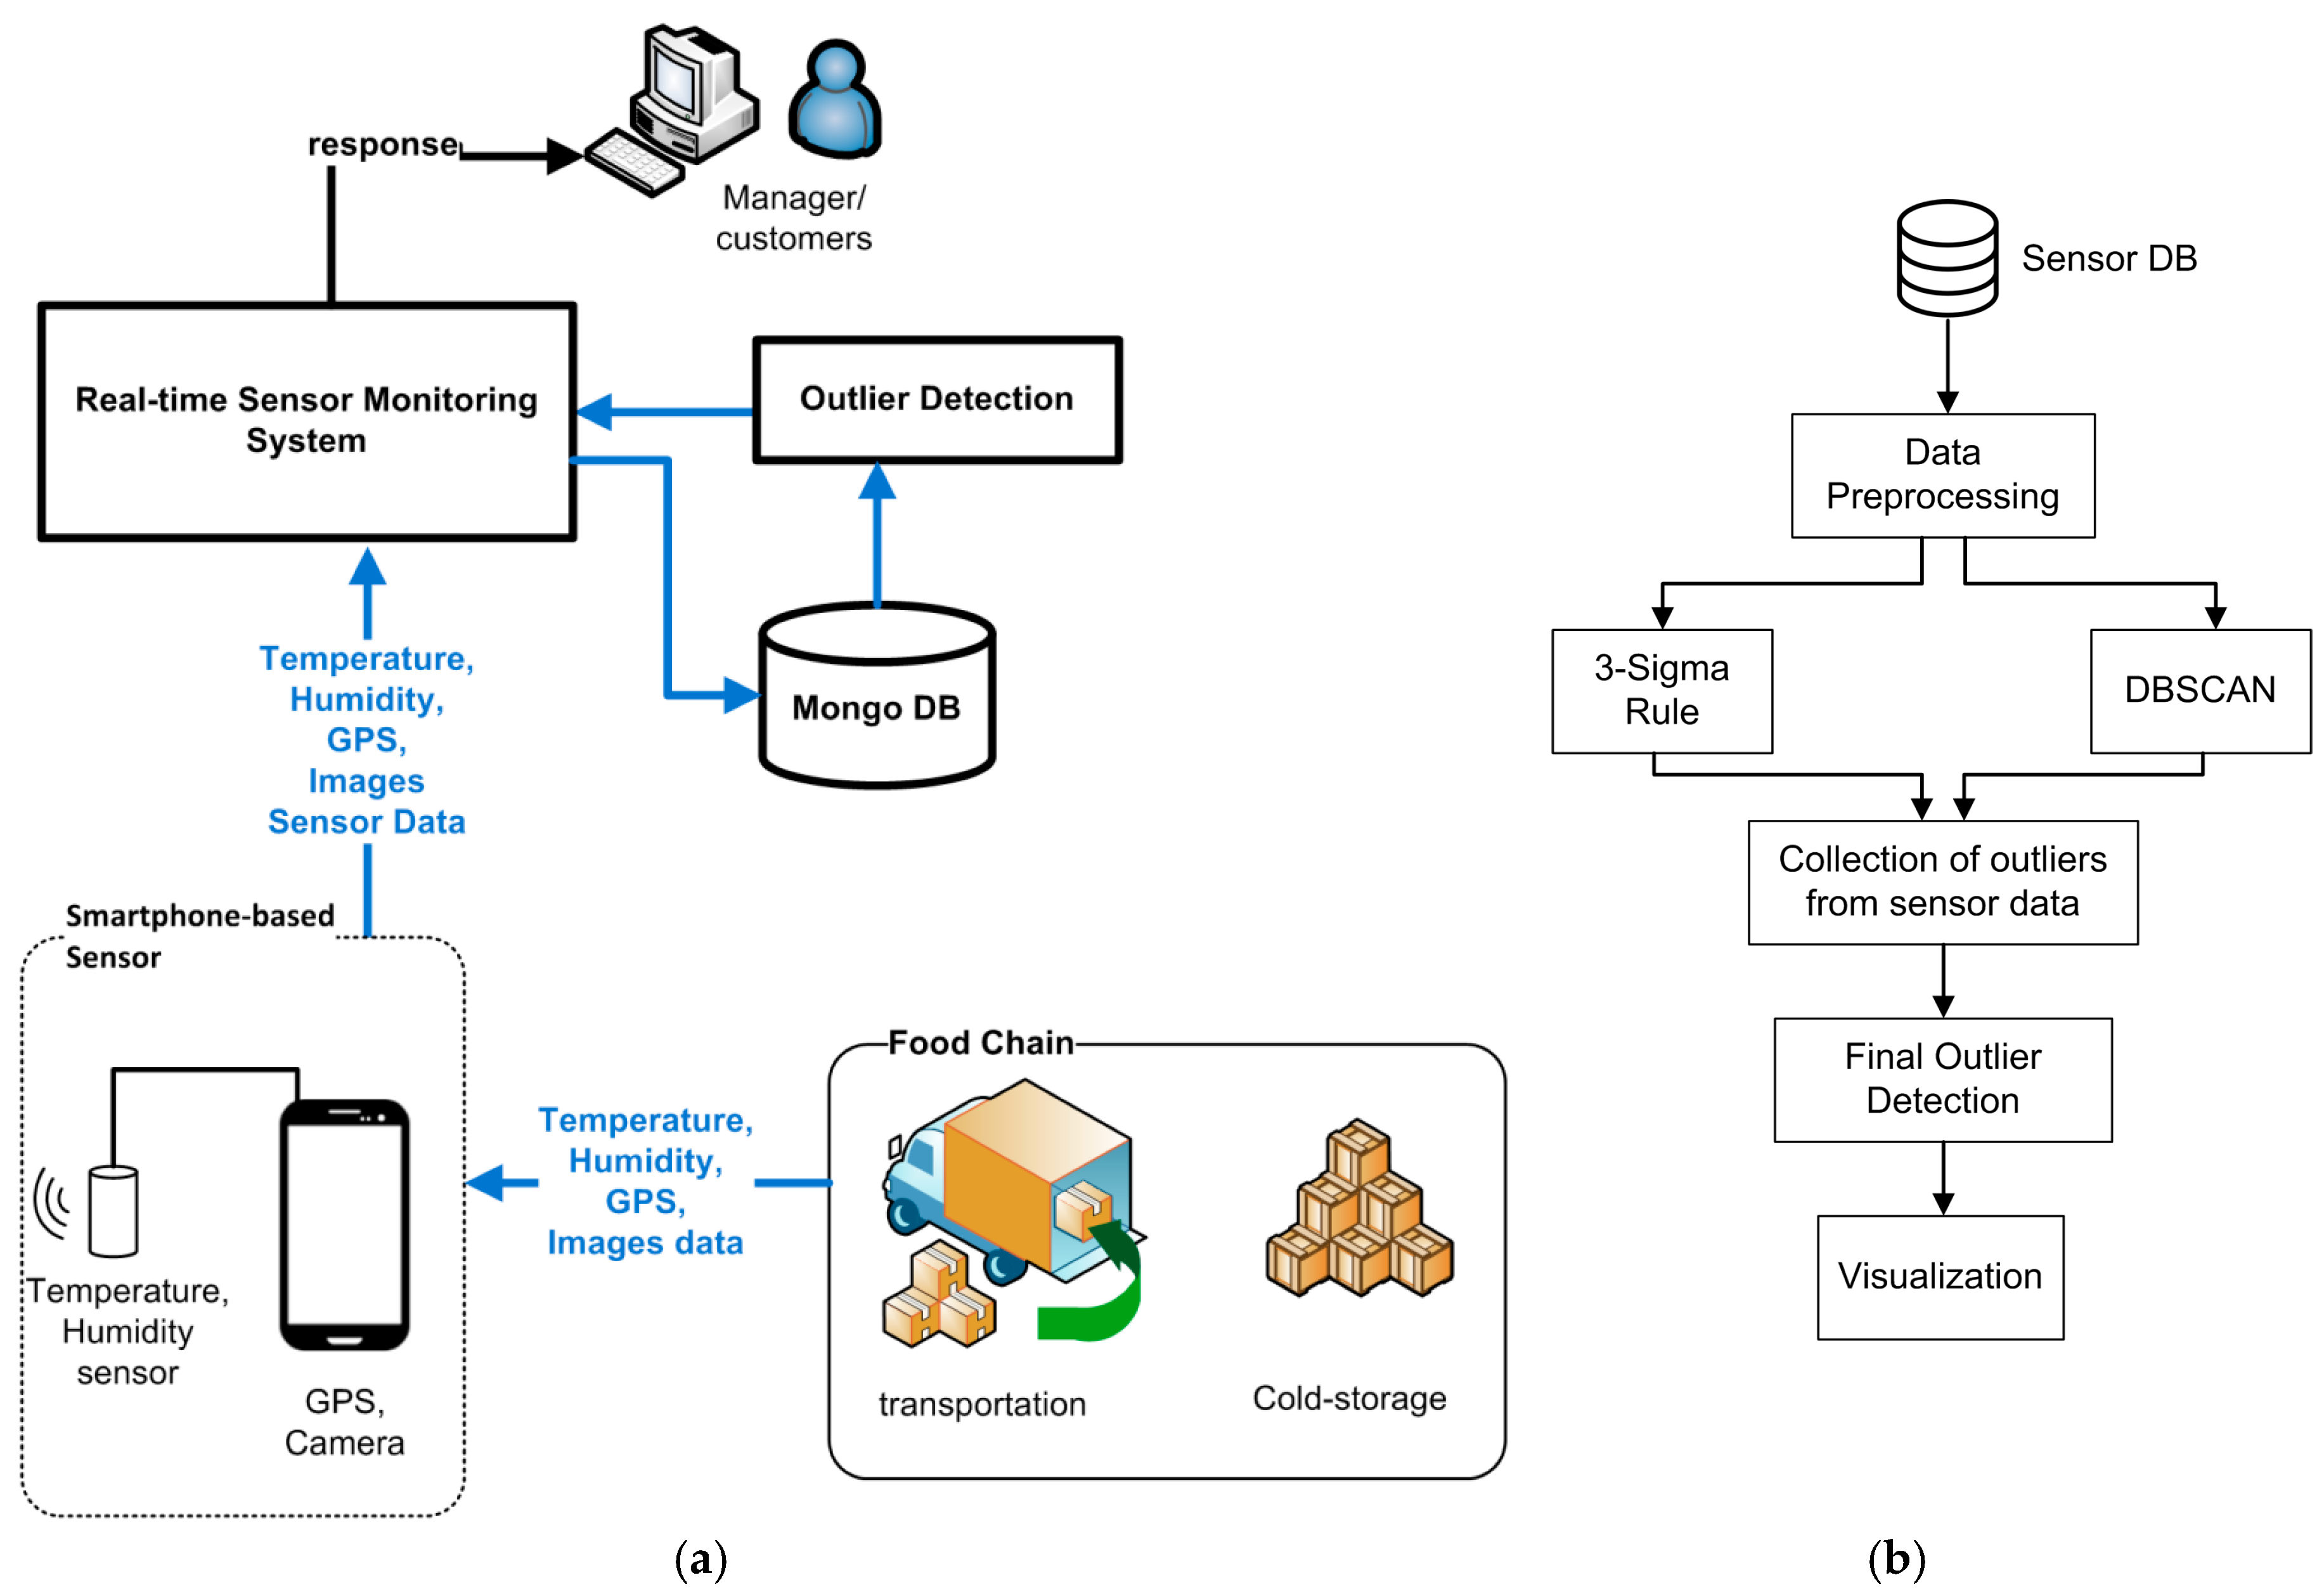
Figure 2.
System design.
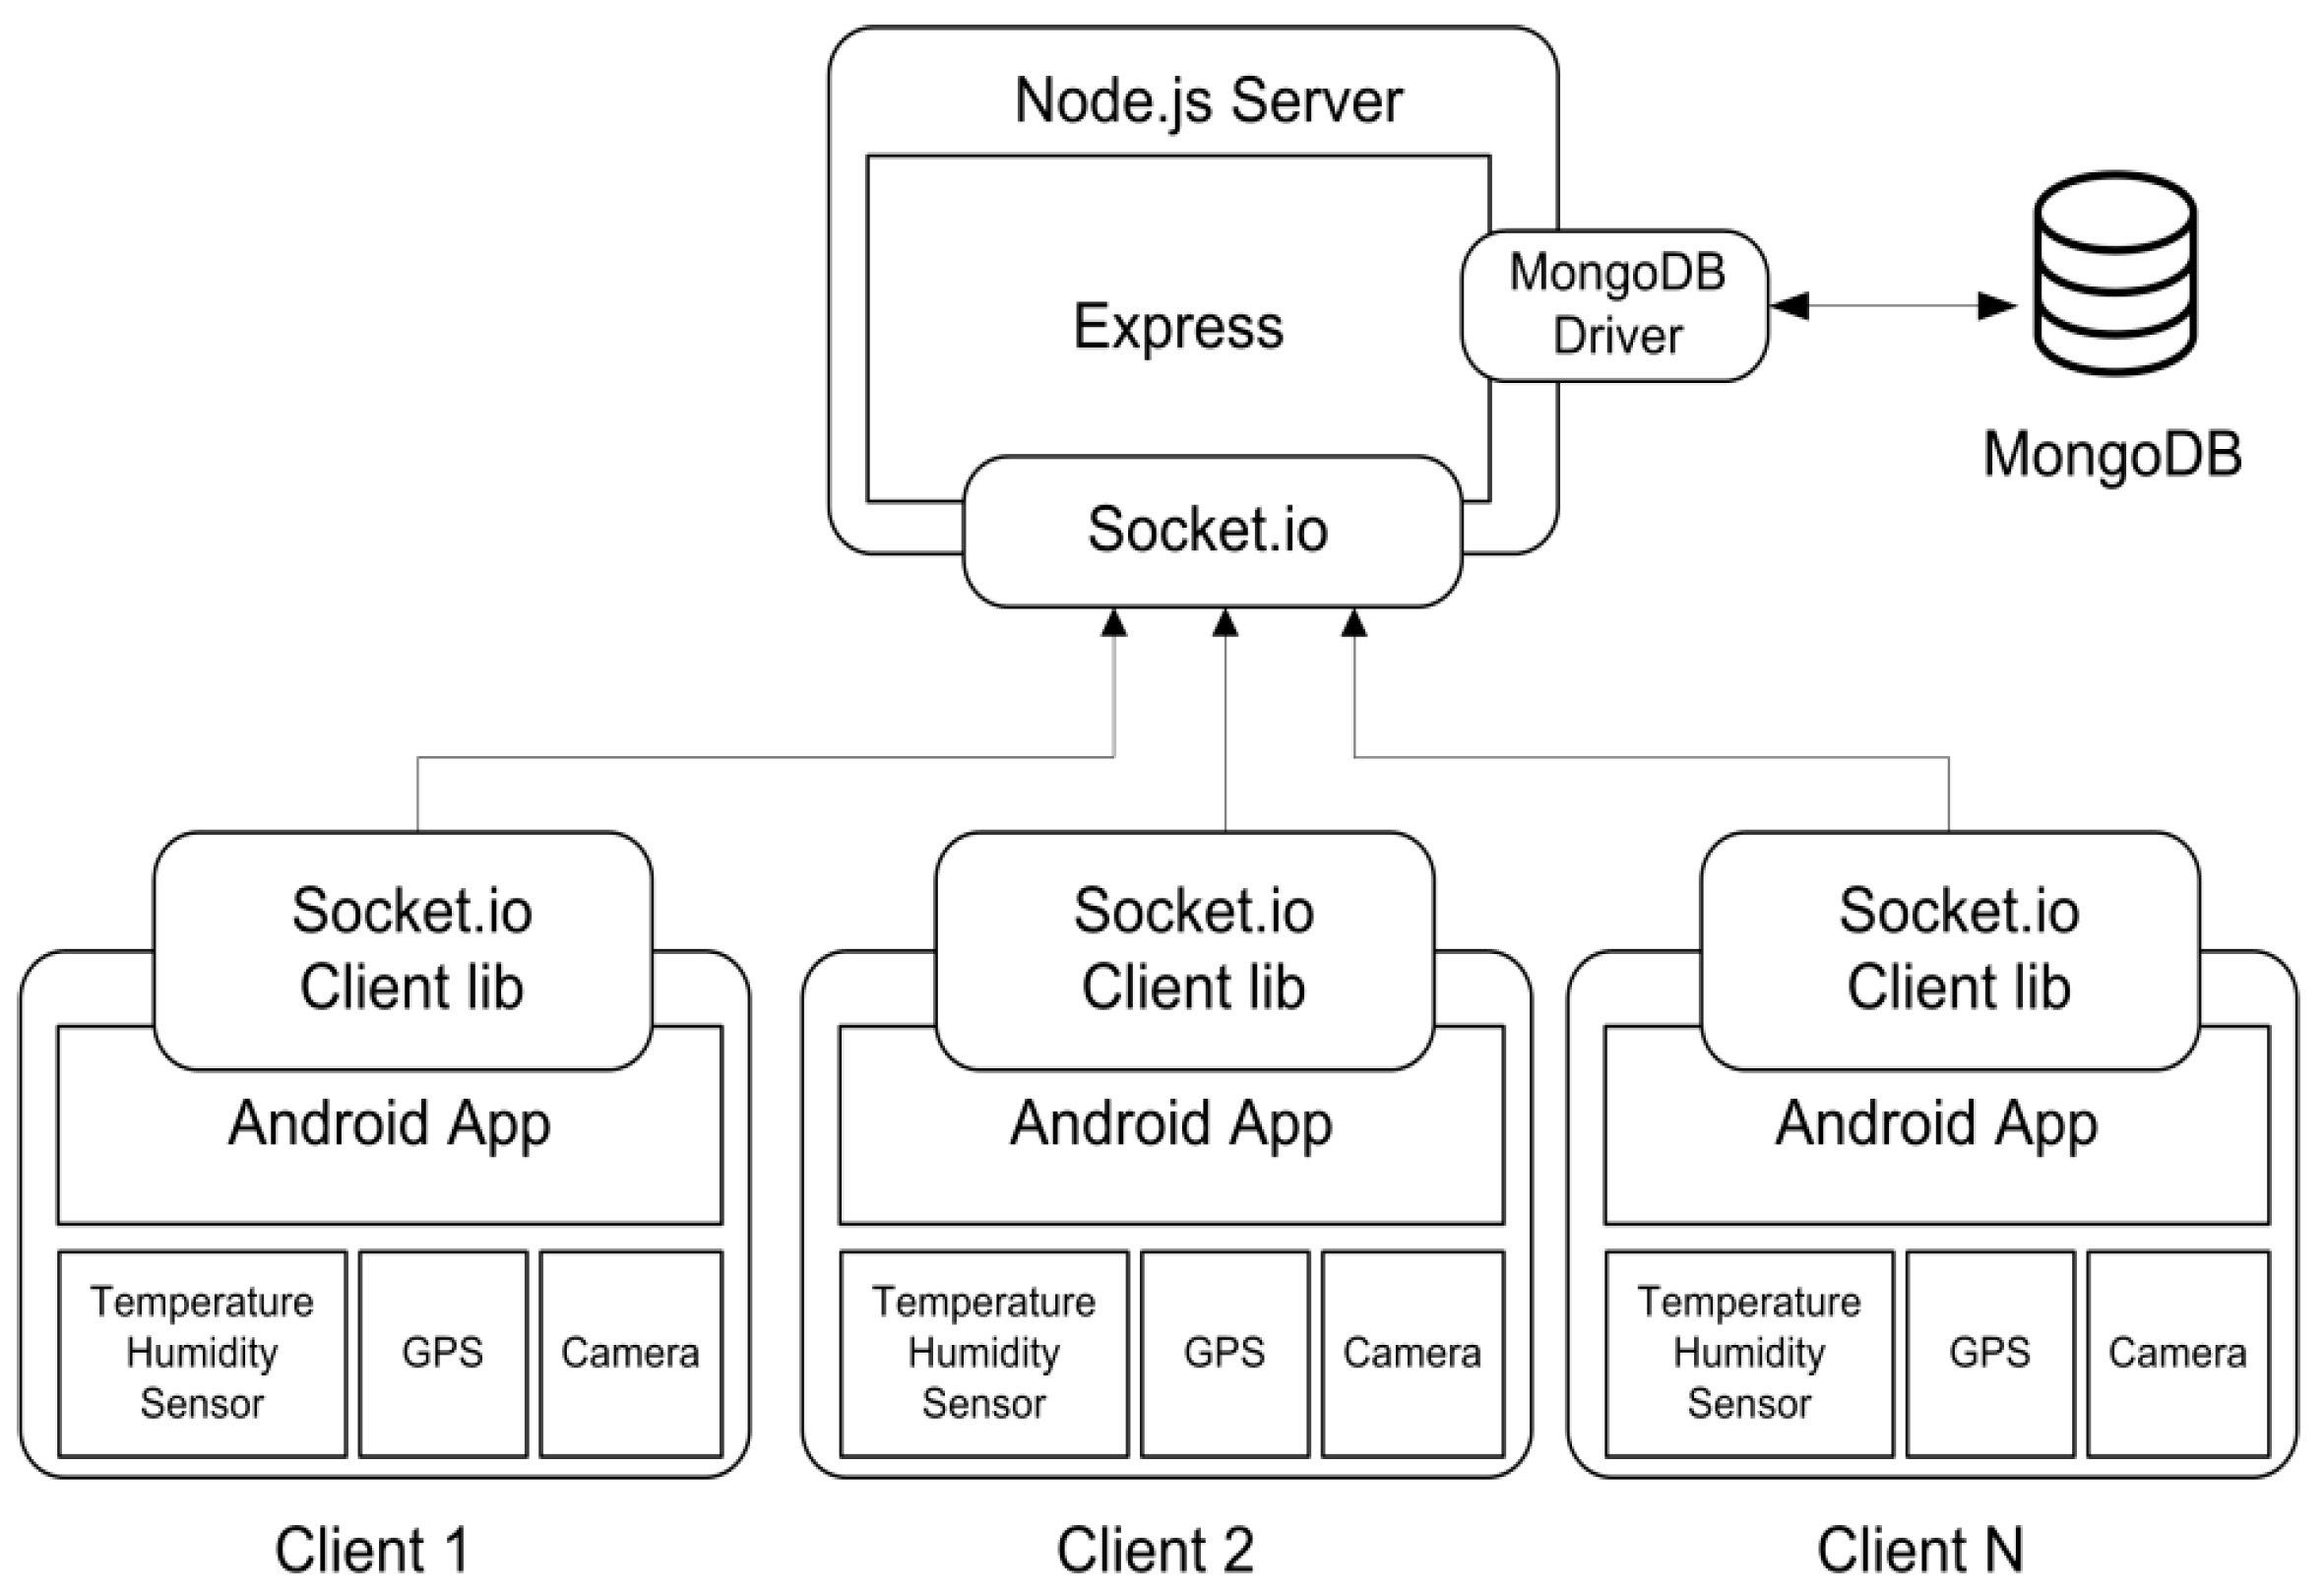
Figure 3.
An example of (a) a sensor document in a NoSQL-based database and (b) a sensor schema in a SQL-based database.
Figure 3.
An example of (a) a sensor document in a NoSQL-based database and (b) a sensor schema in a SQL-based database.
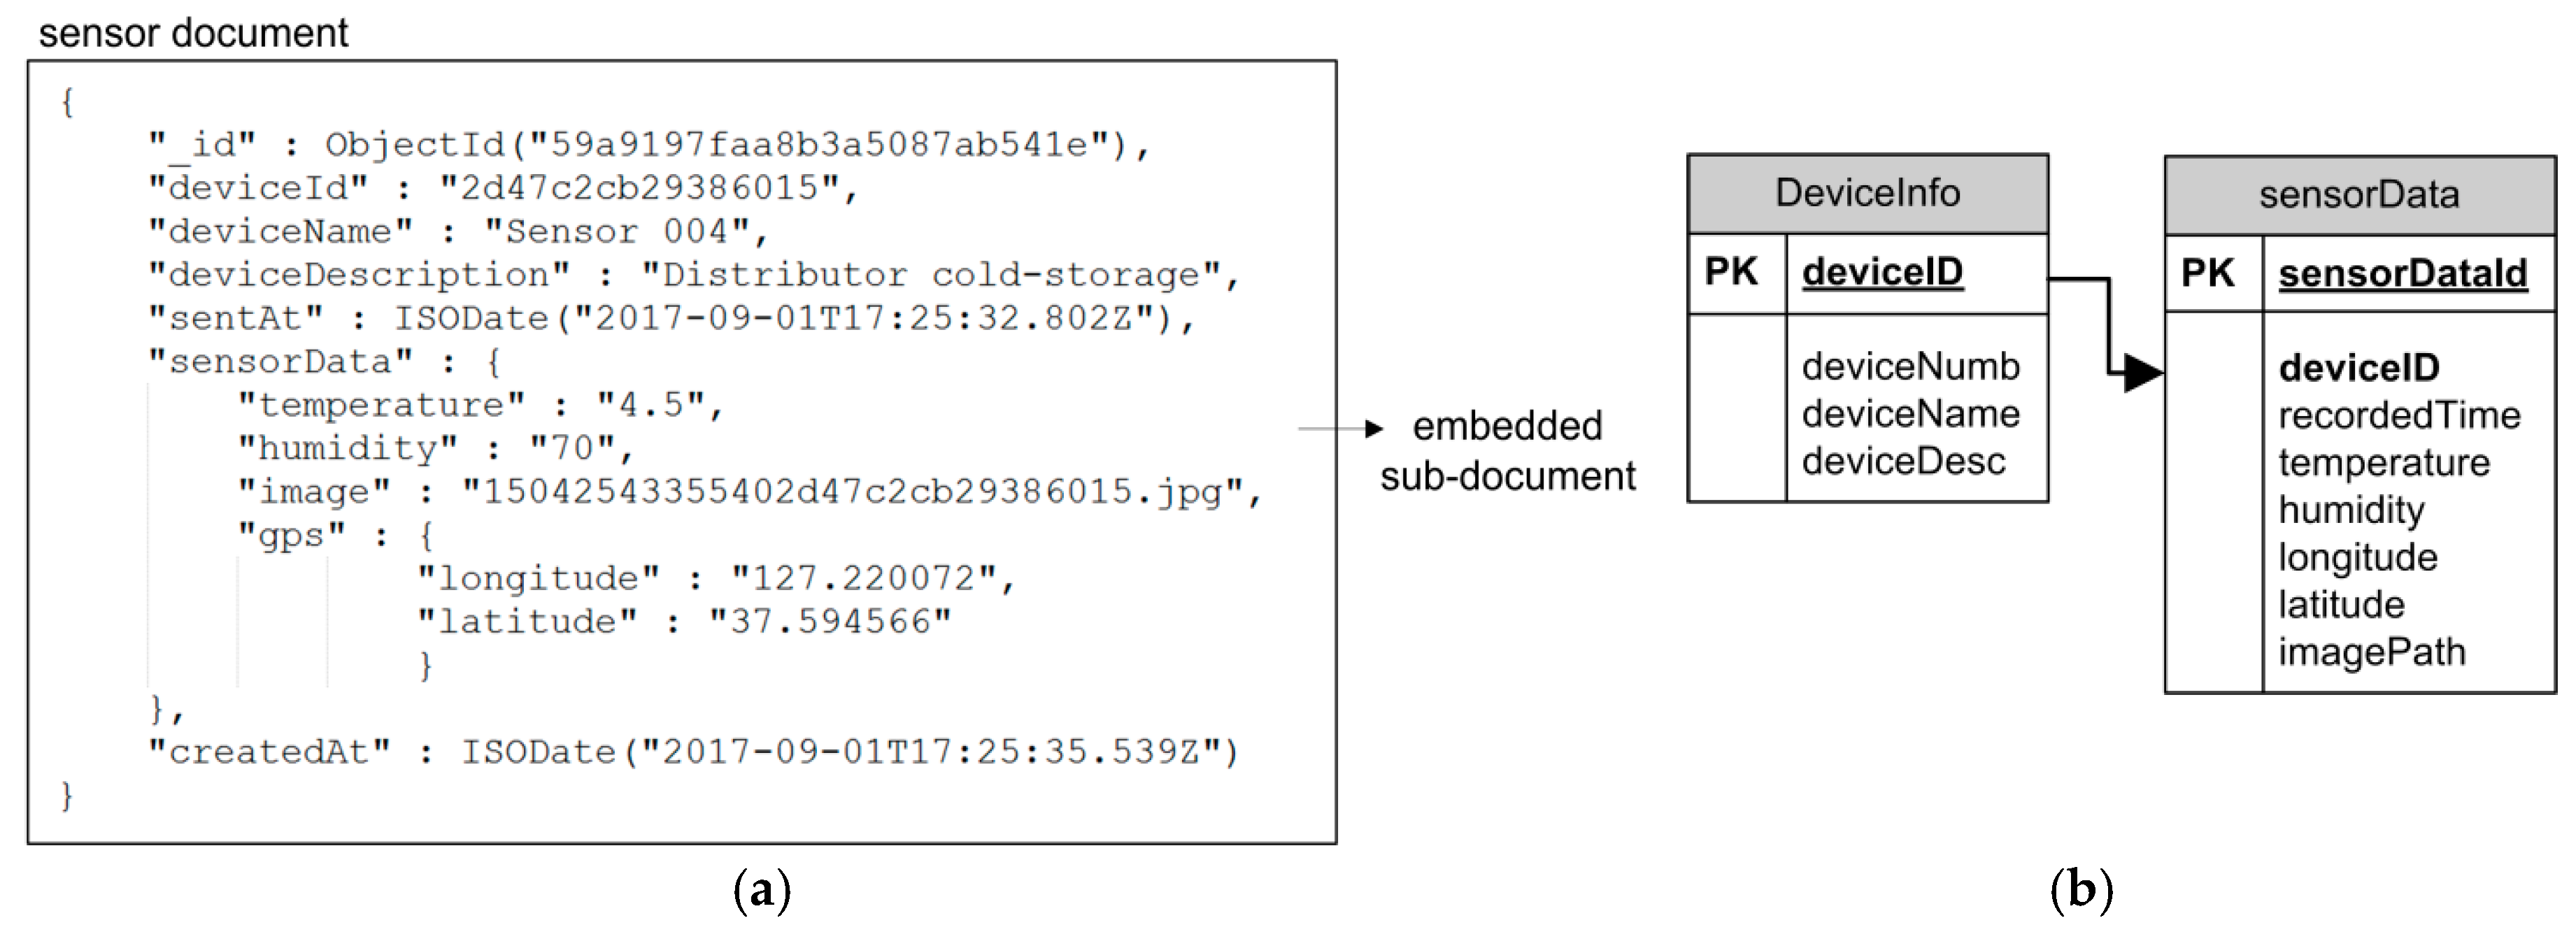
Figure 4.
Example of the food supply chain in the kimchi industry.
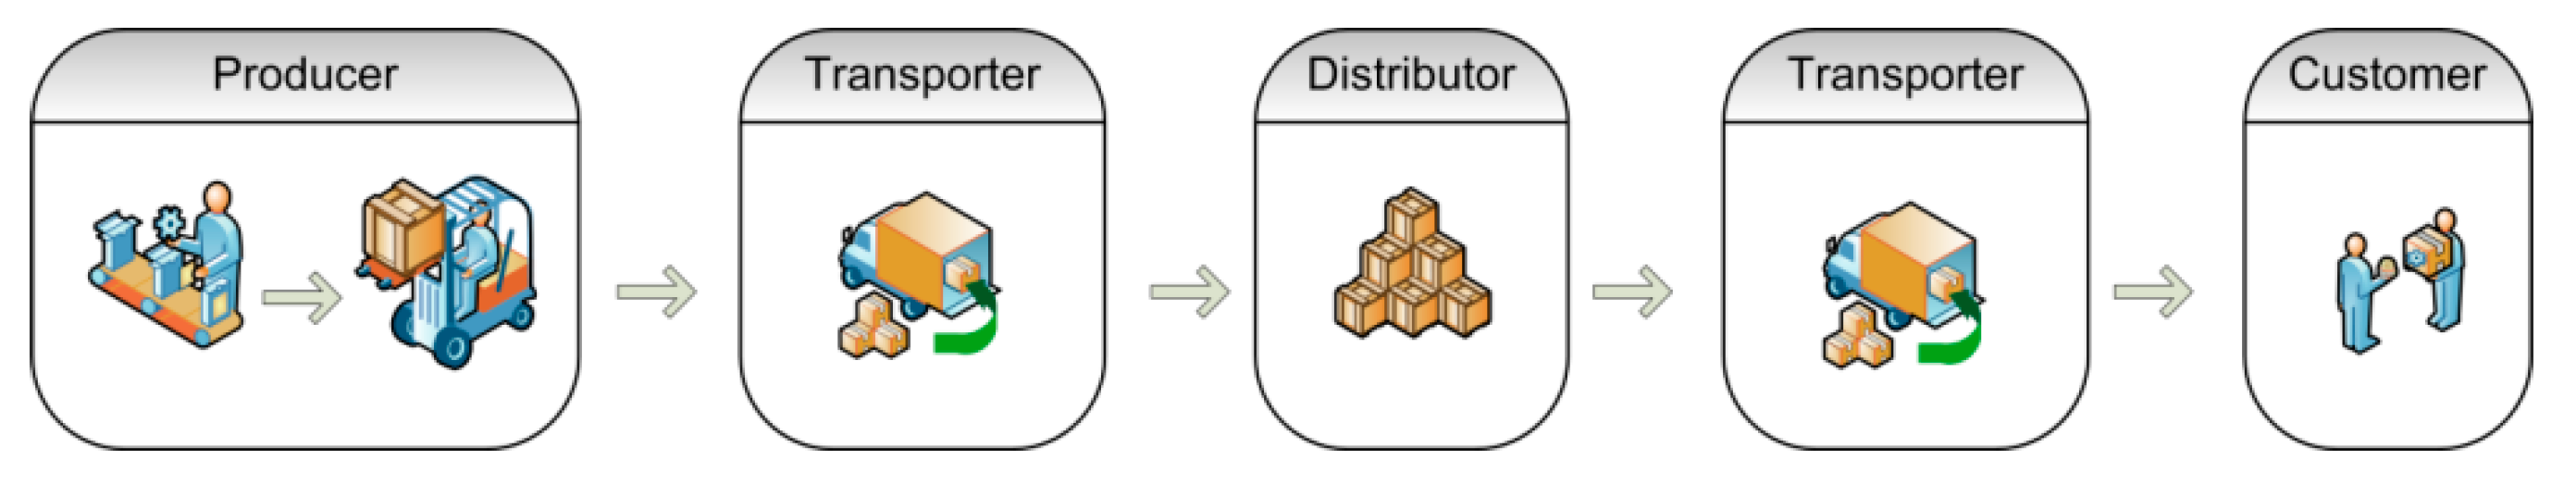
Figure 5.
A smartphone as a gateway to gather temperature, humidity, global positioning systems (GPS), and image data.
Figure 5.
A smartphone as a gateway to gather temperature, humidity, global positioning systems (GPS), and image data.

Figure 6.
The real-time monitoring system shows (a) the sensor data history, such as (b) temperature data, and (c) humidity data, presented in graphs.
Figure 6.
The real-time monitoring system shows (a) the sensor data history, such as (b) temperature data, and (c) humidity data, presented in graphs.
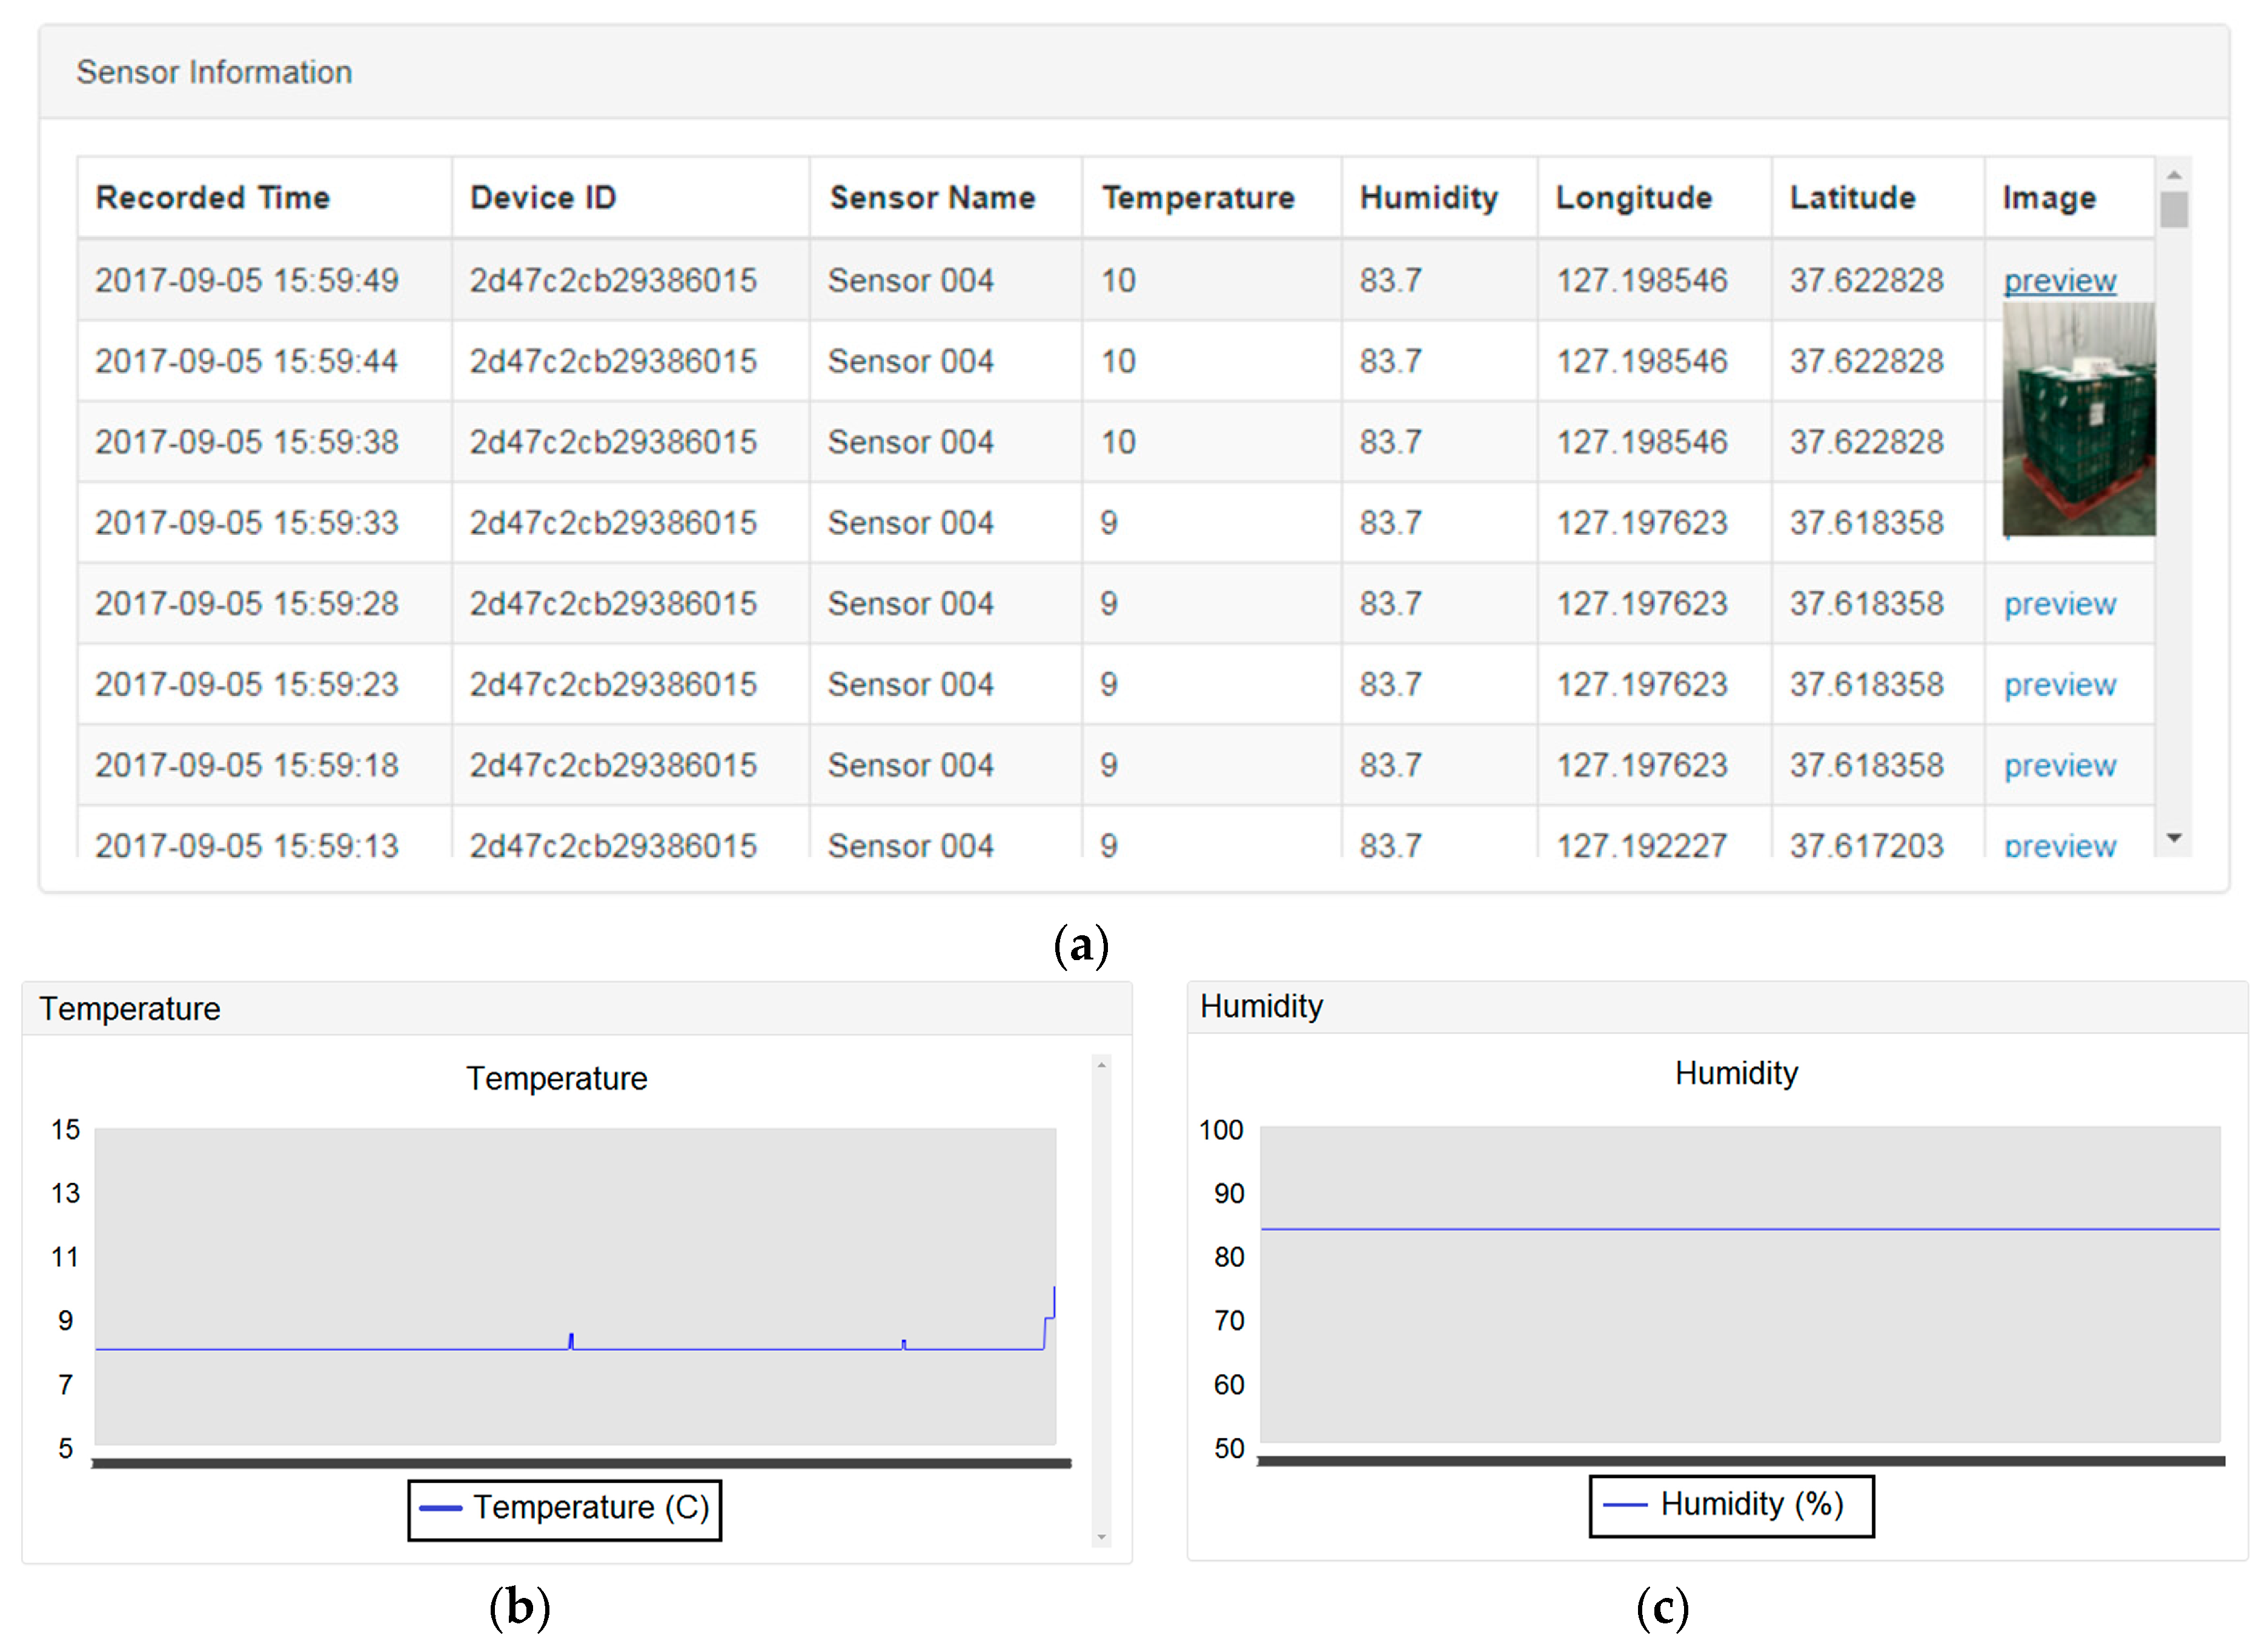
Figure 7.
System performance in terms of (a) capture response time, (b) query response time, and (c) query response time given a different number of workers, and (d) the comparison of capture response time between the MongoDB and MySQL databases.
Figure 7.
System performance in terms of (a) capture response time, (b) query response time, and (c) query response time given a different number of workers, and (d) the comparison of capture response time between the MongoDB and MySQL databases.

Figure 8.
The sensor monitoring smartphone app’s (a) CPU usage and (b) transmission rate.

Figure 9.
Outlier detection based on the 3-sigma rule and Density-Based Spatial Clustering of Applications with Noise (DBSCAN).
Figure 9.
Outlier detection based on the 3-sigma rule and Density-Based Spatial Clustering of Applications with Noise (DBSCAN).

Table 1.
Server and client specifications.
| Server | Client | ||
|---|---|---|---|
| Hardware | CPU | 4.20 GHz × 8 cores | 2.53 GHz × 8 cores |
| RAM | 16 GB | 16 GB | |
| HDD | 500 GB | SSD 250 GB | |
| Software | OS | Ubuntu Server 14.04 | Windows 10 Pro 64-bit |
| Node.js | 8.4.0 | - | |
| Express | 4.15.4 | - | |
| Socket.IO | 1.7.4 | - | |
| MongoDB | 3.4.7 | - | |
| JDK | - | 1.8.0_144 | |
| Eclipse | - | 4.7.0 | |
| HttpClient | - | 4.5.3 | |
© 2017 by the authors. Licensee MDPI, Basel, Switzerland. This article is an open access article distributed under the terms and conditions of the Creative Commons Attribution (CC BY) license (http://creativecommons.org/licenses/by/4.0/).
Share and Cite
MDPI and ACS Style
Alfian, G.; Syafrudin, M.; Rhee, J. Real-Time Monitoring System Using Smartphone-Based Sensors and NoSQL Database for Perishable Supply Chain. Sustainability 2017, 9, 2073. https://doi.org/10.3390/su9112073
AMA Style
Alfian G, Syafrudin M, Rhee J. Real-Time Monitoring System Using Smartphone-Based Sensors and NoSQL Database for Perishable Supply Chain. Sustainability. 2017; 9(11):2073. https://doi.org/10.3390/su9112073
Chicago/Turabian StyleAlfian, Ganjar, Muhammad Syafrudin, and Jongtae Rhee. 2017. "Real-Time Monitoring System Using Smartphone-Based Sensors and NoSQL Database for Perishable Supply Chain" Sustainability 9, no. 11: 2073. https://doi.org/10.3390/su9112073
Note that from the first issue of 2016, this journal uses article numbers instead of page numbers. See further details here.