What Makes Urban Transportation Efficient? Evidence from Subway Transfer Stations in Korea


1
College of Business Administration, Seoul National University, 1, Gwanak-ro, Gwanak-gu, Seoul 08826, Korea
2
Department of Child and Family Welfare, The University of Suwon, San 45, Wau-ri, Bongdam-eup, Hwasung, Kyunggi 18323, Korea
*
Author to whom correspondence should be addressed.
Sustainability 2017, 9(11), 2054; https://doi.org/10.3390/su9112054
Submission received: 17 September 2017
/
Revised: 26 October 2017
/
Accepted: 8 November 2017
/
Published: 9 November 2017
Abstract
:Subway stations have been proliferating underneath cosmopolitan metropolises with subway lines forming complex webs connected in strategic transfer stations. The efficiency of the subway system thus heavily weighs on the efficiency at these transfer stations. However, few studies have been conducted on transfer efficiency at transfer stations due to the complexities involved. As the first study of its kind in the subway context, we analyze the transfer efficiency of the subway transfer stations in Seoul, one of the megacities in the world, and demonstrate how transfer efficiency can be analyzed using bootstrap-based DEA technique. Based on the results, we discuss the reasons behind the inefficiency of subway transfer stations and possible ways to improve them into efficient decision-making units.
1. Introduction
Urban public transportation is vital to the livelihood and dwelling of residents and commuters, who rely on public transportation to provide cheap, efficient, and convenient methods of travel for their daily use [1,2,3]. Although highly costly to construct and operate, once established, the subway system shows the best performance as public transport in terms of passenger capacity, making them suitable for megacities [4]. Especially in large metropolitan areas such as Korea’s Seoul Capital Area that houses 20 million citizens, subways are a central method of public transportation, as its intricate network of lines allows passengers to travel across the city with punctuality [5]. Subways are not only valued in the urban setting as a preferred method of travel for commuters, thereby reducing private travel demand and promoting sustainable transportation development, but also as a “greener” method of travel compared to its alternatives such as buses and automobiles [6].
However, the high reliance on public transportation, including subways, also means that, when expectations are not met, it can be subject to the complaints and distrust from passengers and potential reduction in demand. Especially for public transportation, any policy directed towards raising fares can be an extremely delicate and sensitive matter to urban dwellers who often show fierce resistance to any such movement [3]. Thus, the operators of public transportation face not only the challenge to provide cheap and efficient service from the passenger’s standpoint but also to maximize operational efficiency as the means to secure the necessary profitability for maintaining the service. In the case of the subway system, as its extensive coverage depends on strategic transfer stations that connect subway lines, the operational efficiency of the system depends heavily on the safe, comfortable, and quick transfer of its passengers at these transfer stations. Therefore, the objective analysis of how optimal transfer efficiency can be realized at subway transfer stations becomes essential for understanding and improving the overall efficiency of the subway system.
Despite this, evaluating the transfer efficiency of the subway system has rarely been attempted in existing literature [7]. Previous studies have mainly focused on the operator as the subject of their studies, such as the corporation that runs or owns a subway or railway, when looking at the productivity or profitability of the subway system rather than looking at the transfer efficiency at the stations themselves [8,9]. There are a handful of studies on transfer efficiency in public transportation; however, Sun et al. [10] is the only work to our knowledge on transfer efficiency of transfer stations, yet, even this study, looks at transfers from subway to bus at multimodal terminals and not in the specific subway system context.
Investigating the efficiency of transfers within any public transportation system face obstacles in data collection and method of analysis that become exponential with the complexity of the transport system. Even when the scope is narrowed to transfer stations, the simultaneous involvement of different activities and movements in passenger transfers pose difficulties in setting the efficiency index for transfer efficiency. Furthermore, even after an adequate efficiency index is determined, more often than not, available data are limited and require extensive manipulation to be employed for analysis. What we attempt in this study, therefore, is to provide a framework for analyzing the transfer efficiency of subway transfer stations as the first of its kind.
Specifically, modifying the methodology proposed in Sun et al. [10], we propose an efficiency index that significantly diverts from the previous study to fit the subway context as well as apply the more advanced bootstrap-based data envelopment analysis (DEA) to strengthen the applicability of our research. Using the bootstrap technique, we compare the transfer efficiencies of Seoul’s subway transfer stations by their operating entities and demonstrate how the complexities involved in analyzing transfer efficiency can be narrowed in scope to derive meaningful implications. As subway systems in many cities are operated by multiple companies, we expect our study to become a basis for comparative multi-city research on this topic. The paper is structured as follows. In Section 2, we set the input and output factors based on a review of previous research, and then describe our research methodology in Section 3. Section 4 and Section 5 present the analysis results and discuss their meanings. Finally, the last section presents our conclusions, the contributions of our study, and suggestions for future research.
2. Literature Review
2.1. The Efficiency Analysis of Transportation Systems
Various research methodologies have been employed by scholars to evaluate the efficiency of public transportation; however, few studies have been conducted using the DEA method with the majority of those focusing on railways [1,3,8,11,12,13]. Notably, for example, Jain et al. [14] analyzed the relationship between the structure of ownership and technical efficiency among 15 urban railways in Europe based on 11 years of data using DEA. In addition, Yu [15] performed a multi-country analysis of the efficiency and performance of railways using network DEA (NDEA) and traditional DEA (TDEA) Azadeh et al. [16] conducted a computer simulation for railway system improvement and optimization that integrates DEA with Analytic Hierarchy Process (AHP).
Concerning the efficiency of subway systems, in most cases, Beijing has been the subject of the studies using DEA. In Beijing, currently 18 subway lines are in operation, with 318 subway stations and 527 km of tracks. Wang et al. [2] examined the operational and spatial efficiencies of the Beijing subway lines using the input variables of operation time, trip distance, and numbers of subway stations and the output variables of the daily average of passengers transported and the rate of a single fare. Yan et al. [17] analyzed the efficiency in the passenger flows of Beijing’s subway by focusing on subway passenger congestion and the risk of crowd crushing and trampling accidents.
In comparison to Beijing’s subway system, the Seoul subway system also has 18 subway lines but encompasses an overwhelming number of 663 subway stations connected by a total 1013.4 km of tracks. On a daily basis, Seoul’s subway system serves more than 7 million passengers, compared to Beijing’s 6.74 million, Tokyo’s 6.22 million, and New York City’s 5.47 million. Seoul also has the highest number of subway stations in operation, comparable to New York City (468 stations) and Paris (301 stations); and a significantly longer track length than Beijing, London (415 km), and New York City (368 km). Appendix A presents the maps of these cities’ subway systems, which visually shows the enormity of the Seoul subway system at a glance.
The complexity and size of the Seoul subway system make it an exciting and meaningful case to study the efficiency of subway networks. However, most studies on the efficiency of Seoul’s subway system have been conducted from the perspective of environmental sustainability (e.g., its effect on reducing greenhouse gas emissions) or from the viewpoint of urban construction. Some studies exist that investigate Seoul’s subway network and passenger flows, such as Lee et al. [18] which analyzed the statistical attributes and topological consequences of the network structure of Seoul’s subway and Kim et al. [19] that visualized diurnal subway passenger flows to examine the trip patterns at Seoul’s major central business districts. However, the efficiency of transfer stations has rarely been studied.
Amid the lack of research on this topic, Sun et al. [10] is the only work to our knowledge that examined the transfer efficiency at transfer stations. Here, they utilize DEA to measure the performance of 10 large-scale transportation terminals in Beijing using the transfer area, operating expense, the number of staff in the terminal and the capacity of buses as the input variables and the transfer safety and average transfer time of all the transfer passengers as the output variables. Based on the results from the DEA modeling, they rank the transfer efficiency of the transportation terminals and suggest strategies to improve their efficiencies in terms of each efficiency indicator. However, as this novel work examines multimodal terminals with a focus on transfers from or to buses, there are clear limitations to its direct application on the efficiency of transfer stations in the subway. Therefore, we propose to modify the research model of Sun et al. [10] to present a framework for observing the efficiency of subway transfer stations as the first study of its kind in this field of research.
2.2. The Subway System of Seoul, Korea
The subway has been a long-referred method of public transportation in the urban setting due to its accessibility, punctuality, and environmental sustainability compared to other methods of transportation, especially in densely populated areas such as Seoul. The demand for new subway lines in the Seoul Capital Area has been relentless, and has, in fact, led to the continual expansion of the subway system, with new stations and lines under construction even today. Historically, the sudden increase of urban laborers in Seoul since the late 1950s led the city to construct new methods of transportation. A tramline was installed and operated until November 1968 in downtown Seoul, and torn down to make room for the construction of the first stage of subway lines, which started between 1970 and 1985 and established Lines 1–4 of the Seoul subway system. Afterwards, beginning in 1990, the second group of subway lines, Lines 5–8, started their construction and came to operation by 1996. Since then, Seoul’s subway system continued its expansion to its current state, to serve 7,290,000 people on a daily basis by 2014.
For our paper, we focus on subway Lines 1–8 of the Seoul subway system. There are two operators managing these subway lines. The first group of subway lines (Lines 1–4) constructed are managed by Seoul Metro, while the second group (Lines 5–8) are operated by the Seoul Metropolitan Rapid Transit Corporation (SMRTC). Originally a single public enterprise, the Korean government divided Seoul Metro into two in the aftermath of Seoul Metro’s massive strike in early 1990 and placed the newly-established SMRTC in charge of the new subway lines. It is not uncommon for subway systems to have multiple operators, and many other metropolitan cities around the world have subway systems that consist of a network of subway lines provided and operated by multiple companies.
Therefore, we categorize the transfer stations into three types according to the operators of the subway lines that connect in the station: Type 1 stations are the transfer stations that connect among subway Lines 1–4; Type 2 are those that link among subway Lines 5–8; and Type 3 are where subway Lines 1–4 connect with Lines 5–8. Based on this categorization, we examine how having multiple operators running the subway system affects the transfer efficiency at transfer stations to draw out managerial and policy implications.
3. Research Methodology
3.1. Data Envelopment Analysis
Since its introduction by Charnes et al. [20], data envelopment analysis (DEA) has been utilized by a variety of studies as a linear programming method for analyzing efficiency using multiple input and output factors. Using DEA, it is possible to compute the relative efficiencies between the decision-making units (DMUs) set for analysis. DEA measures inefficient decision-making units (DMUs) based on their distance from the efficient frontier, which indicates which of their inputs or outputs need to be reduced by what amount to change the inefficient DMUs closer into efficient DMUs. There are two models of DEA, named after the authors that first developed the models: the Carnes, Cooper, and Rhodes (CCR) model [20] and the Banker, Charnes, and Cooper (BCC) model [21]. The CCR model calculates technical efficiency (TE) assuming constant returns to scale (CRS) whereas the BCC model analyzes pure technical efficiency (PTE) based on variable returns to scale (VRS).
Depending on the DMU, the computed efficiency may differ between the two models above, and this difference occurs due to the inefficiency in scale, that is, the scale efficiency (SE). In other words, by employing both the CCR and BCC models, it becomes possible to examine also the SE of the DMUs. If the DMU’s efficiency is the same under the CCR and BCC models, it is understood as having CRS; if it is different between the two models, as having VRS where IRS refers to increasing returns to scale whose efficiency can be improved by increasing the scale, and DRS refers to decreasing returns to scale where efficiency can become greater by reducing the scale.
Concerning the decision to focus on either input or output required in applying DEA modeling, our study adopts the input-oriented model. The input-oriented model maintains an output level and calculates TE by reducing the input, while the output-oriented model sets an input level and calculates TE by increasing the output. As will be illustrated below, the input variables of our study are more malleable for adjustment than the output variables.
3.2. Decision-Making Units
Passengers who transfer from one subway line to another arrive at the transfer station after riding one subway train, get off onto the platform for the subway line within the subway station, then walk to the platform of the subway line to which they wish to transfer, then wait for the train of the transferring subway line. The travel between one platform to the other may involve other activities such as actual departure from the station, ticketing, etc. depending on the structure of the subway system. In the case of Seoul’s subway system, passengers need only travel inside the transfer station and do not need a new ticketing process. In addition, the nature of any subway transfer station involves the movement of passengers in two directions, that is, if the subway transfer station connects Lines A and B, passengers will be able to transfer from Line A to Line B, as well as from Line B to Line A. For example, passengers transferring at Seoul’s Sadang station will be divided into two groups, those who transfer from subway Line 2 to Line 4 and those who transfer from subway Line 4 to Line 2; and in the case of Jongno 3 (sam)-ga Stationm where subway Lines 1, 3, and 5 intersect, there will be six groups in total. For a precise analysis, each group of transfer between connecting subway lines should be analyzed as an individual DMU as they will differ in their inflow and outflow of passengers and transfer time.
However, our study sets the transfer stations in Seoul’s subway Lines 1–8 as individual DMUs, rather than the individual passenger flows between subway lines for two reasons. First, Sun et al. [10] also set multimodal terminals as a single DMUs without separately measuring the individual flows of transfer. Second, the data on subway transfers often do not provide precise numbers for passenger flows by the direction of their transfer, as was the case with the data we received from Seoul Metro for Lines 1–4. Thus, setting the transfer stations as DMUs strengthens the general applicability of this study to other subway systems for further research on this topic. Exceptions were made, however, for Jongno 3 (sam)-ga and Dongdaemun History and Culture Park stations, where three subway lines interconnect. At these stations, it is possible to transfer from line A to B, A to C, and B to C, so each set of connecting subway lines was considered as individual DMUs, and the paired subway lines were noted in parentheses with the name of the station, e.g., Jongno 3 (sam)-ga station (1–5). Thirty-nine DMUs were set based on the considerations above, and its number satisfies the criteria of both Banker et al. [21] and Boussofinance et al. [22]. The list of DMUs is shown in Appendix B.
3.3. Input and Output Variables
Sun et al. [10], the only existing study to our knowledge that analyzed the efficiency of transfer stations, set the following input and output variables: as input, the transfer area, operating expense, the number of staff in the terminal and the capacity of buses; and output, the transfer safety and average transfer time of all the transfer passengers. Our study used Sun et al. [10] as the basis for setting its input and output variables, however, since the subject of the investigation by Sun et al. [10] was multimodal terminals in Beijing, some adjustments were made to fit the parameters of this study. In this study, we set the size of transfer stations, the number of operation staff, operation cost, and subway capacity as input variables and the total number of people transferred and the average transfer time as output variables. Here, our definitions for the size of transfer stations, the number of operation staff, operation cost were based on those used in Sun et al. [10] while we substituted bus capacity with subway capacity and excluded transfer safety to use the total number of people transferred instead to fit the subway system context. It should be pointed out that our calculation method for average transfer time also differs from that used by Sun et al. [10], the details of which are explained in the Section 3.4.
While our logic behind substituting bus capacity to subway capacity is quite intuitive, the exclusion of transfer safety needs some explanation. Sun et al. [10] applied the idea of transfer safety to account for interference among diversified transfer streamlines at a multimodal terminal as a measure for the level of organization in transfers at the terminals. However, since the subject of our research is subway transfer stations and the transfers between subway lines, a single mode of transport, there are no chances of interference between passengers and cars. Subway transfers, especially in Korea, are contained within the transfer station where passengers travel through guided routes within the station to ride another subway line. The risks of conflict in the passenger flow are also low for subway transfers in Korea since many transfer stations, by design, provide a separate transfer passage for each direction of the transfer. In addition, even when the same transfer hall is used for multi-directional transfers, passenger flow is quite clearly separated as passengers keep to the right according to public principles. For this reason, transfer safety is not a meaningful variable for analyzing the transfer efficiency of Seoul’s subway system.
The output and input variables set for our study are summarized in Table 1 below, and the details of how they differ from Sun et al. [10] and the methods we employ to measure each variable are elucidated in the section that follows.
As can be seen, the output variables of our study are resistant to changes, as the number of transferring passengers is not within the control of the transfer station and significant physical changes to the station necessary to reduce the average transfer time. Except for shortening the intervals in train schedules, there is practically no executable option for altering the values of the output variables. On the other hand, among the input variables, transfer station size is the only variable that disallows easy manipulation. Therefore, this study adopts the input-oriented model that maintains an output level and calculates efficiency by modulating inputs.
3.4. Data Collection
We obtained the raw data for the variables from the two operating corporations, Seoul Metro and SMRTC, for the subway lines they manage. This raw data included the week-day averages of the operation cost, number of operation staff, number of transferring passengers from the subway lines operating under the respective corporation at each transfer station for the year 2013. To use Jamsil station, which connects Lines 2 and 8, as an example, Seoul Metro provided the operation cost and the number of staff necessary to provide transfer services at Jamsil station to and from Line 2 and the number of passengers who used Line 2 to transfer to or from Line 8; and SMRTC did the same for Line 8.
Since any subway transfer involves two subway lines, the data for both lines involved in the transfer were used for the input and output variables. That is, the data for the two subway lines involved in the transfer were combined to gain the values of each variable for individual DMUs, with except for transfer station size whose values are already given in terms of the transfer station. For the size of the transfer station, which refers to the total area of the transfer station including all facilities such as the platform, waiting hall, transfer passage, etc., we used the most-updated data provided by the operators of the subway lines, which is from 2013 since there have not been any constructions for expanding the stations set as DMUs since that time.
The operation cost includes all costs involved in providing the transfer service. Personnel expenditures take up the most substantial portion of the operation cost, and other costs include maintenance fees for trains and rails, and the cleaning and maintenance fees for the portion of the transfer station used for the transfer service, etc. The data we used were for the year 2013 in Korean won for each subway line at the station, which we combined and converted to USD for our study. The number of operation staff refers to the total number of staff in place to provide the transfer service, and its data was also for the year 2013 and combined to match the DMUs.
Subway capacity was deduced based on the week-day timetable of each subway line and the capacities of the subway trains of the subway line. Unlike a bus which only slightly differs in type and size, the standard carriage that composes a subway train in Korea accommodates 160 passengers, but the number of carriages (units) per train differs significantly by subway line. Subway Lines 1–4 are comprised of ten-unit trains, Lines 5 and 7 of eight-unit trains, and Lines 6 and 8 of six-unit trains. Therefore, the daily capacity of a subway station, in terms of the number of train units, can be obtained by multiplying the number of trains passing through a transfer station per day and the number of units comprising each train. To find the passenger capacity of the subway station, all that is needed is simply multiplying the results by 160. In our study, we expressed subway capacity in terms of carriages instead of the number of passengers for simplicity, as it does not have any influence on the analysis.
The total number of people transferred refers to the daily number of passengers that transferred between subway lines at the corresponding transfer station. As explained above, each corporation provided the data for the subway lines they manage at the transfer station. For the transfer stations that also provide transfer services to subway lines outside our scope, the two operators provided data that excluded the values for that specific line. For instance, the data for the Express Bus Terminal station (which connects Lines 3, 7, and 9), the values for transfers between Lines 3 and 9, and Lines 7 and 9 were excluded from the data. Unlike the other data used in this study, the values for passengers transferred were autonomously estimated by the corporations based on the passenger flows compiled through the IC card technology at fare gates which is applied throughout Korea’s subway systems. As they are estimated values, some differences existed between the data from the two operators for several stations. However, the differences were minor for the majority of the stations and were minimized by taking the arithmetic average for our analysis.
Lastly, we defined the average transfer time as the sum of the average moving time and the average waiting time. Previous studies have defined the average transfer time as the sum of the average moving time, time spent in ticketing, and the average waiting time involved in a transfer. ([2,10]). However, as previously mentioned, there is no separate ticketing necessary for Seoul subway transfers, so the time spent in ticketing was excluded in our definition. To calculated the average moving time, we applied the transformation formula of Tw = 40.77D1.44 to the minimum distance of the transfer passage at each station, following Sun et al. [10]. The average waiting time is the average time it takes for the fastest-departing subway train for one line to arrive after the train of the other subway line arrives at the station. In our DEA model, average transfer time is an undesirable factor which requires treatment, that is, efficiency becomes higher when it is reduced. Therefore, in our analysis, we inverted the values for average transfer time following Sarkis [23], Scheel [24], Yaisawarng and Klein [25]. The details of the collected data are presented in Appendix B.
4. Analysis Results
4.1. Result of Efficiency Analysis
The results of the efficiency analysis are listed in Appendix C, and summarized into Types 1–3 based on the operators of the connecting subway lines in Table 2. The excess quantity of input that needs to be reduced for the DMUs to become efficient transfer stations are presented by type in Table 3 which follows, and its full details are given as Appendix D. Our results show that PTE assuming VRS is higher in the order of Type 2, 3, 1. That is, the transfer stations managed by SMRTC were more efficient on average than those managed by Seoul Metro, and the stations under Seoul Metro even lacked efficiency when compared to the transfer stations that connect SMRTC and Seoul Metro subway lines.
The SE, which is the ratio between the DMU’s efficiency assuming CRS and that assuming VRS, was higher in the order of Type 1, 3, 2. Type 1 showed a significantly higher SE than the other two types. The SE is 1 when the efficiencies assuming CRS and VRS are the same, and the ratio of transfer stations that show SE = 1 for Types 1, 2, and 3 were 20%, 0%, and 4.2%, respectively. When the SE is smaller than 1, inefficiency is caused by IRS or DRS, and results show that no transfer stations were inefficient due to DRS. All Type 2 transfer stations exhibited IRS, and the majority of Type 2 and 3 stations also showed IRS, implying that, apart from the few stations falling under CRS, most of the transfer stations can improve their efficiency by increasing their scale. That is, with a greater input of the input variables used in this study, the transfer stations will achieve higher efficiency through the economies of scale.
Table 2 and Table 3 also indicate that Type 1 transfer stations have a larger number of staff and subway station capacity compared to the other types, so for these stations to gain higher efficiency, they should focus on enlarging the area of transfer station and operation costs. Contrary to Type 1, Type 2 stations need to increase the number of staff and subway station capacity. Concerning individual transfer stations, apart from Sindorim, Chungmuro, Jongno 3-ga (1–5) stations whose efficiencies are 1 to show CRS and become the reference group for other stations, all stations showed IRS. Sadang station, which showed the lowest efficiency among these stations, had the second-largest input in terms of its area, the largest number of staffs, and the third-biggest subway station capacity, meaning that its inefficiency is caused by the excessive amount of input.
4.2. Bootstrap DEA
As DEA is a nonparametric method, the DEA efficiency values gained as outcomes are not appropriate for direct comparison [26]. Therefore, we employed the bootstrap DEA method proposed by Simar and Wilson [27,28] to convert the nonparametric DEA efficiency scores to compare the efficiencies of each type. The bootstrap scores were calculated following Simar and Wilson’s [26] method, while the confidence interval method based on percentiles was performed 2000 times following Kneip et al. [29]. The procedures for bootstrap DEA are illustrated below, and the results are summarized in Table 4. (The full table of results is given as Appendix E.)
- Obtain the score of the standard linear programming DEA model to gain the technical efficiency score of individual DMUs.
- Generate a random sample in the size L from { and apply kernel density estimation to obtain , , .
- Calculate {( as a pseudo data set to process Reference Bootstrap Technology.
- Calculate bootstrap efficiency estimation of the DMUs’ technical efficiency scores, from the values of a Bootstrap corresponding model.
The bootstrap mean values were calculated using the equation given by Kneip et al. [29], which is as follows:
The results of the bootstrap DEA gave a mean of 0.9234 for Type 1, 0.9574 for Type 2, and 0.9441 for Type 3, thus Type 2 had the highest mean value. From this, it is possible to observe that stations that allow transfers among subway Lines 5–8 have the highest efficiency, followed by those where passengers can transfer between Lines 5–8 and Lines 1–4, and those stations that provide transfers among Lines 1–4 have the lowest efficiency.
4.3. Discussion
Our analysis results showed that Type 3 transfer stations, which offer transfers between subway lines managed by different corporations, is less efficient than Type 2 stations offering transfers among the subway lines managed by one corporation, SMRTC. The easy assumption to make is that the inefficiency of Type 3 stations arises from the overlap in input due to being operated by two different firms. However, we found this to have low probability since the data we collected showed that, even if all subway lines passing the station are under the management of the same company, each subway line takes up a separate area in the station that is operated independently, thus requiring its own input of costs and staff.
Thus, our tentative conclusion for the cause of the Type 3 stations’ inefficiency is the “distance of the transfer passage”, that is, the distance passengers need to travel to make the transfer between subway lines. Although the three types of stations had relatively unvaried values for input variables, the values of the output variables were notably varied. In particular, the average transfer time was significantly longer at transfer stations with subway lines managed by two different companies than those under the same management, which primarily arise from the physically longer transfer passage at the stations. The reason the Type 3 stations have a more extended distance between platforms is that subway Lines 1–4 were designed and constructed without consideration for possible expansion in the 1980s, so when subway Lines 5–8 were added at these transfer stations later, the new platforms needed to be built far away from existing platforms. However, further studies will be necessary to confirm this conclusion.
In addition, the lowest efficiency of Type 1 stations, which are managed by Seoul Metro, suggests that the transfer stations under SMRTC are designed for the better use of space than those under Seoul Metro. The cause for the inefficient design of Seoul Metro’s transfer stations can also be found in history—subway Line 1 was constructed to share rail lines with railway trains, so many of subway Line 1 stations were built aboveground compared to other subway lines. Thus, when passengers transfer from or to subway Line 1 at a transfer station, they often need to travel between an aboveground platform and an underground platform, entailing longer travel distance and lower transfer efficiency.
5. Conclusions
This study analyzed the efficiencies of subway transfer stations among Seoul’s subway Lines 1–8 using bootstrap-based DEA. To do so, we categorized the subway transfer stations by the operating entities of the connecting subway lines to examine whether the transfer stations where passengers transfer from and to subway lines managed by the same firm are more efficient than those where transfers are made from and to subway lines under different firms. To compute the efficiencies of the stations, 39 transfer stations were set as DMUs, and the area of the transfer station, operation cost, the number of operation staff, and subway capacity were set as input variables and the total number of people transferred and the average transfer time were set as output variables.
Our results showed that Type 2 transfer stations, whose lines are solely under SMRTC, are more efficient than Type 3 stations, which connect subway lines managed by Seoul Metro and SMRTC. We examined the data to uncover the reason behind the difference and tentatively concluded that the inefficiency of Type 3 stations is caused by the lengthy distance between platforms (i.e., the long distance of transfer passage) that is often found in these stations due to the later addition of subway Lines 5–8 to subway Lines 1–4. In addition, Type 1 transfer stations, connecting Lines 1–4 managed by Seoul Metro, exhibited the lowest efficiency, which we suggest arises from the long distance between platforms as well. However, in their case, the extended transfer passage comes from the fact that subway Lines 1–4 are often built aboveground to accommodate railway trains, thereby increasing the distance to travel for transferring to underground lines.
The implications of our findings, theoretical, policy-wise and practical, are as follows. First, our study is the first of its kind to our knowledge to investigate the transfer efficiency of subway transfer stations. As mentioned in Sun et al. [10], transfer efficiency is difficult to measure due to the difficulties in setting an adequate efficiency index. Our attempt here presents a new guideline for establishing the framework and index for analyzing transfer efficiency in the subway context and demonstrate the usefulness of using the bootstrap-based DEA model for this analysis. Furthermore, our method of processing actual data from the operators of the Seoul subway system in defining and measuring the variables provide an example for future research to delve into this so-far inapproachable topic.
Second, we discovered that the transfer efficiency between subway lines managed by different corporations could be lower than that managed by the same firm. We suggest that the main reason for this difference is the length of the transfer passage, which, in the case of Seoul, is caused by the later addition of new subway lines that connect in existing transfer stations which were not designed for such expansion. In addition, transfer passages can become lengthy when a subway station is built aboveground to accommodate connections to railway trains. When transfer passages are lengthy, it can not only adversely affect the transfer efficiency at the subway transfer station but also become a deterrence for commuters to use the subway. Especially for sustainable urban development, this possibility underlines the importance of carefully designing subway stations from a long-term perspective, so that subways can sustain optimal performance and remain attractive as a mode of public transportation despite the changes of time.
Third, in the case of Korea’s subways, our findings suggest that there is insufficient infrastructure in place to match the enormous number of passengers served by the Seoul subway system, suggesting that it may be worthwhile to review possible expansion of subway transfer stations to improve their efficiency. However, once the station is constructed and in operation, it becomes very difficult to change the area of the transfer station or subway capacity. Again, this finding highlights the need for meticulous research and analysis in establishing the plans for urban infrastructure and public facilities.
Lastly, our calculation of the excess quantity of input factors, assuming the outputs are the same, for individual transfer stations present a practical insight into how each station can improve its efficiency. We expect that our analysis results may be utilized as a reference for reviewing possible expansion of subway lines or managing the transfer efficiency of existing transfer stations.
For future studies on this original topic, we suggest the following. Two areas in our research method leave room for enhancing the rigor of this study. First is the integration of data for objective analysis. As illustrated, Seoul’s subway lines are operated by different entities, as is the case for many other metropolitan cities. Especially when there are transfer stations that connect subway lines operated by multiple entities, a more rigorous analysis would be to set the DMUs at the level of individual subway lines, as opposed to the transfer stations as the DMUs.
The other area concerns the average transfer time, more specifically, the average waiting time. We calculated the average waiting times simply by finding their arithmetic means. However, this method assumes that passengers are evenly distributed during all hours of operation. In reality, there is higher congestion of passenger at specific times of the day, such as during commuting hours, which is reflected in train schedules to accommodate such congestion by operating more trains during those hours. Therefore, for a more rigorous analysis, the average waiting time should be weighted according to the time of day. Similarly, any incidents such as fires, accidents, and strikes should be considered when treating the data.
Finally, while we believe that our research methods present useful guidelines for application on other subway systems around the world, we suggest that future studies modify the methodology used in this study to fit the contexts of the specific subway system being analyzed. We incorporated certain characteristics that are unique to the Seoul subway system in our definition and measurement of variables. For instance, the computing methods we used for the number of people transferred and the average transfer time may need some adjustment before applying to other subway systems, as they contain specifics (such as no need for ticketing between transfers) unique to Seoul’s case. In addition, future studies may gain greater insight by utilizing other methods of analysis such as the Malmquist productivity index (MPI), which will provide information on the transfer efficiency changed over time.
Acknowledgments
We would like to thank Sunghyo Kim, alumnus of the college of business administration at Seoul National University, for his help in data collection for this study; Transdemics for their meticulous English editing; and the editor and reviewers for giving much needed feedback in “efficiently” improving the quality of this paper.
Author Contributions
Changhee Kim and Soo Wook Kim conceived and designed the experiments. Hee Jay Kang organized the data. The experiment was performed by all related authors. The paper was written by Changehee Kim and Hee Jay Kang. Seung-Min Song took the lead in revising the manuscript. All authors read and approved the final manuscript.
Conflicts of Interest
The authors declare no conflict of interest.
Appendix A
Figure A1.
Metro lines in Seoul.
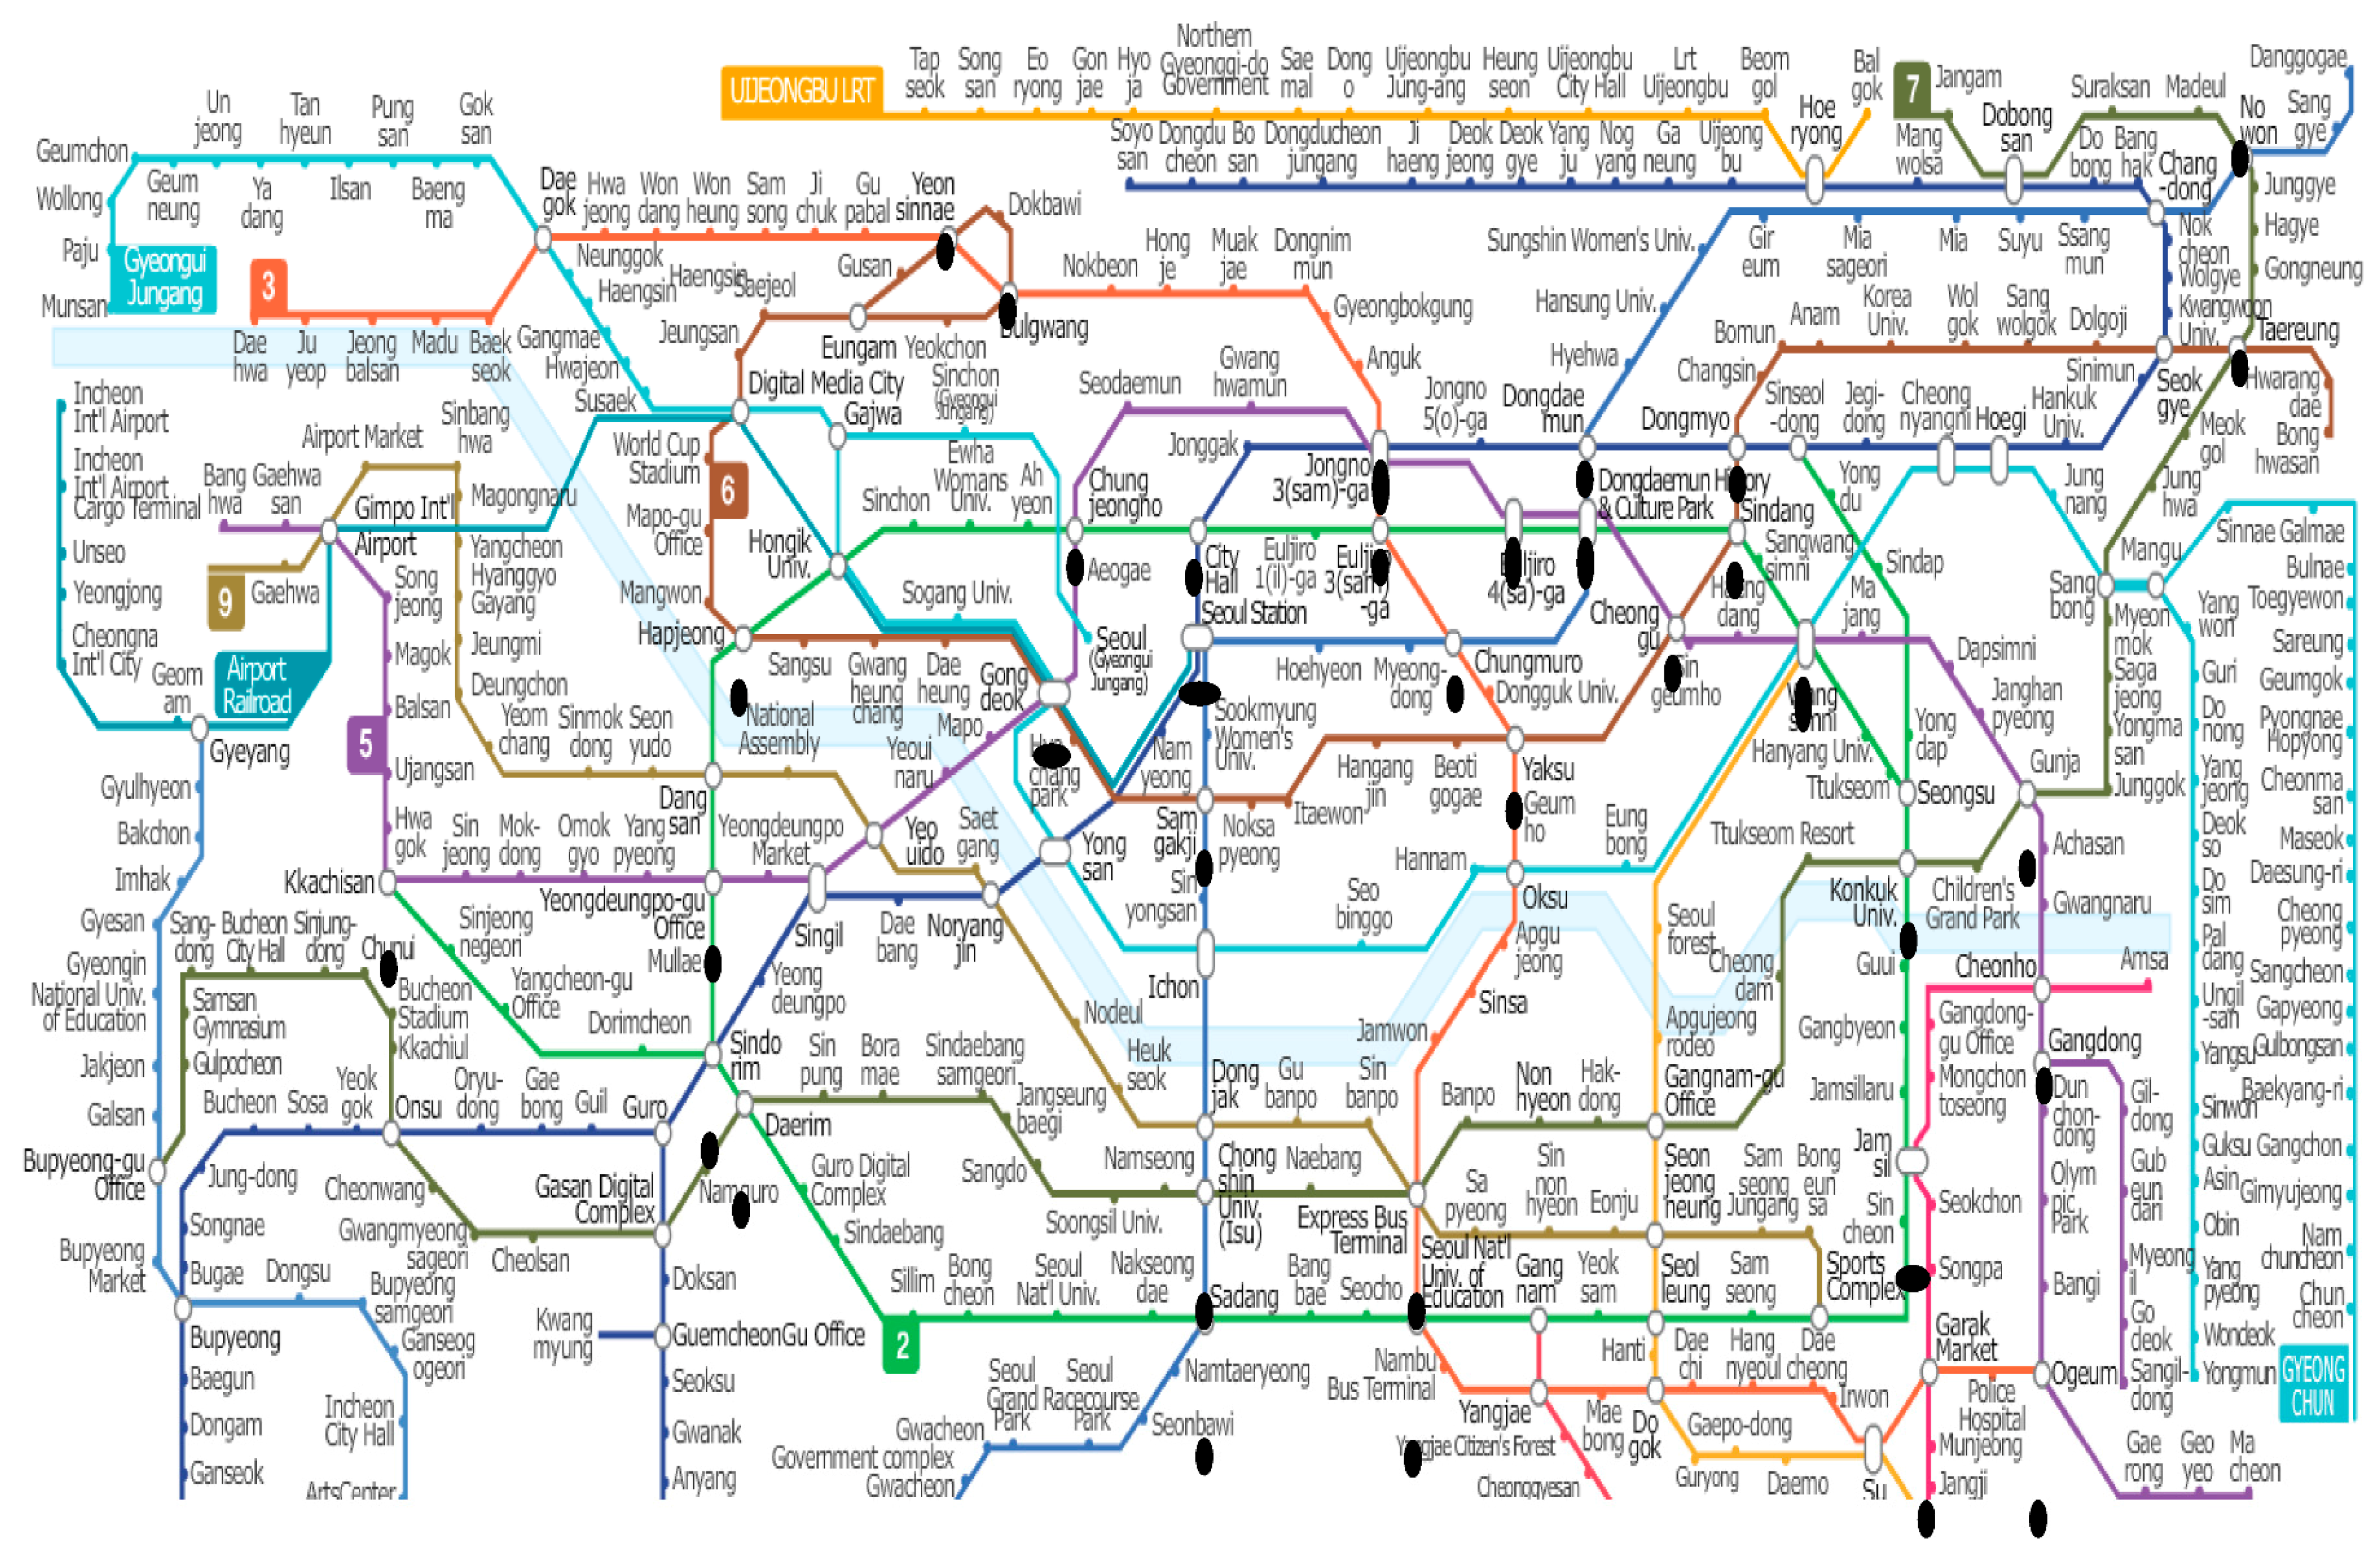
Figure A2.
Metro lines in Beijing.

Figure A3.
Metro lines in Paris.

Appendix B

Table A1.
Raw data set.
| Index | Station Name | Size of Transfer Station (m2) | Operation Cost (USD/Year) | Number of Staff | Subway Capacity (Carriage/Day) | Total Number of People Transferred (People/Day) | Average Transfer Time (Minutes) |
|---|---|---|---|---|---|---|---|
| 1 | Garak Market | 1,0139.07 | 3,743,959.20 | 13 | 2595 | 39,033.2 | 12.90539 |
| 2 | KonKuk Univ | 8524.505 | 4,817,610.30 | 14.5 | 3994 | 103,835 | 12.92585 |
| 3 | Express Bus Terminal | 1,2232.48 | 5,618,762.25 | 17 | 3524 | 157,139 | 11.01547 |
| 4 | Gongdeok | 11,239.52 | 12,568,657.41 | 14.5 | 2614 | 71,207.76 | 12.4943 |
| 5 | Seoul Nat’l Univ of Education | 9424 | 2,494,499.23 | 15 | 4430 | 182,104 | 13.28029 |
| 6 | Gunja | 9017.375 | 10,432,324.52 | 15 | 3168 | 221,031 | 13.28863 |
| 7 | Kkachisan | 7868.9 | 9,628,620.36 | 11 | 2724 | 53,667.51 | 12.62144 |
| 8 | Nowon | 10,042.56 | 5,748,872.46 | 13.5 | 3934 | 46,424.26 | 7.447112 |
| 9 | Daerim | 7917.765 | 4,404,188.03 | 14 | 3994 | 108,161.5 | 7.555524 |
| 10 | Dongdaemun | 7688 | 2,296,160.48 | 15 | 3760 | 168,978 | 9.438737 |
| 11 | Dongdaemun History and Culture Park (2–4) | 10,827 | 2,893,268.58 | 17 | 4840 | 86,907 | 13.44805 |
| 12 | Dongdaemun History and Culture Park (2–5) | 11,816.95 | 3,059,829.98 | 15 | 4487 | 79,372.5 | 9.140025 |
| 13 | Dongdaemun History and Culture Park (4–5) | 11,375.35 | 3,760,406.84 | 14.5 | 4014 | 101,335 | 12.55175 |
| 14 | Dongmyo | 11,587.13 | 5,786,553.00 | 13.5 | 2360 | 58,834 | 11.39607 |
| 15 | Bulgwang | 7532.77 | 2,957,291.19 | 13.5 | 2475 | 21,210 | 11.9549 |
| 16 | Sadang | 14248 | 3,223,893.66 | 21 | 4840 | 200,985 | 12.95735 |
| 17 | Samgakji | 11,810.72 | 4,033,211.25 | 13 | 3380 | 70,770.8 | 11.00111 |
| 18 | Seoul Station | 9949.5 | 2,760,328.34 | 15 | 3760 | 141,488 | 10.38046 |
| 19 | City Hall | 11,491 | 2,583,668.39 | 17 | 3820 | 120,866 | 11.68187 |
| 20 | Sindang | 6091.45 | 3,830,643.46 | 12.5 | 3440 | 51,078 | 8.508621 |
| 21 | Sindorim | 12,901 | 3,773,938.19 | 21 | 4900 | 333,873 | 11.55732 |
| 22 | Yaksu | 9620.15 | 2,891,139.14 | 12.5 | 2970 | 59,869 | 11.27534 |
| 23 | Yeonsinnae | 7663.27 | 3,063,420.76 | 19 | 2475 | 39,006.49 | 9.954953 |
| 24 | Yeongdeungpogu Office | 15,593.91 | 3,369,345.49 | 13 | 4074 | 71,838 | 12.47713 |
| 25 | Ogeum | 11,140.02 | 2,864,253.10 | 17 | 2685 | 32,695 | 11.44079 |
| 26 | Wangsimni | 12,741.81 | 4,016,161.27 | 13 | 4074 | 80,650 | 12.98387 |
| 27 | Euljiro 3-ga | 9280 | 2,413,837.54 | 14 | 4430 | 102,428 | 11.62987 |
| 28 | Euljiro 4-ga | 9057.365 | 3,498,515.96 | 12 | 4074 | 45,569.3 | 13.15918 |
| 29 | Isu | 13,204.33 | 4,967,915.44 | 12.5 | 3934 | 78,713 | 10.69496 |
| 30 | Jamsil | 13,013.67 | 4,900,514.68 | 16 | 3320 | 123,177 | 9.544846 |
| 31 | Jongno 3-ga (1–3) | 10,907 | 2,486,260.34 | 17.5 | 3350 | 224,539 | 11.12316 |
| 32 | Jongno 3-ga (1–5) | 9311 | 2,425,545.98 | 18 | 2740 | 224,539 | 5.482386 |
| 33 | Jongno 3-ga (3–5) | 10,845.51 | 4,398,927.42 | 14.5 | 3604 | 153,377.5 | 12.16104 |
| 34 | Cheonho | 9162.7 | 14,609,403.57 | 14 | 2494 | 134,640 | 13.11039 |
| 35 | Cheonggu | 12,061.83 | 5,487,224.93 | 11 | 2614 | 44,454 | 11.86389 |
| 36 | Chungmuro | 8296.5 | 1,935,932.56 | 21 | 4370 | 229,882 | 14.10144 |
| 37 | Chungjeongno | 11,076.87 | 3,191,938.57 | 12 | 4074 | 34,369.64 | 9.807348 |
| 38 | Teureung | 13,125.14 | 8,696,318.69 | 13 | 2534 | 96,796.16 | 12.95131 |
| 39 | Hapjeong | 12,069.78 | 4,326,210.73 | 14 | 3440 | 124,347.2 | 12.68117 |
Appendix C
Table A2.
Efficiency analysis.
| Type | DMU | CRS | VRS | SE | Return to Scale |
|---|---|---|---|---|---|
| 1 | Seoul Nat’l Univ of Education | 0.8221 | 1 | 0.8221 | IRS |
| 1 | Dongdaemun | 0.8817 | 1 | 0.8817 | IRS |
| 1 | Dongdaemun History and Culture Park (2–4) | 0.4317 | 0.8359 | 0.5164 | IRS |
| 1 | Sadang | 0.6739 | 0.774 | 0.8707 | IRS |
| 1 | Seoul Station | 0.7174 | 0.9518 | 0.7537 | IRS |
| 1 | City Hall | 0.5468 | 0.9127 | 0.5991 | IRS |
| 1 | Sindorim | 1 | 1 | 1 | CRS |
| 1 | Euljiro 3-ga | 0.6061 | 1 | 0.6061 | IRS |
| 1 | Jongno 3-ga (1–3) | 0.9598 | 1 | 0.9598 | IRS |
| 1 | Chungmuro | 1 | 1 | 1 | CRS |
| 2 | Gongdeok | 0.5447 | 0.9273 | 0.5874 | IRS |
| 2 | Gunja | 0.9847 | 1 | 0.9847 | IRS |
| 2 | Cheonho | 0.7088 | 1 | 0.7088 | IRS |
| 2 | Cheonggu | 0.7562 | 1 | 0.7562 | IRS |
| 2 | Teureung | 0.5935 | 1 | 0.5935 | IRS |
| 3 | Garak Market | 0.5882 | 0.988 | 0.5953 | IRS |
| 3 | KonKuk Univ | 0.559 | 0.9097 | 0.6145 | IRS |
| 3 | Express Bus Terminal | 0.6733 | 0.8604 | 0.7825 | IRS |
| 3 | Kkachisan | 0.7108 | 1 | 0.7108 | IRS |
| 3 | Nowon | 0.9816 | 1 | 0.9816 | IRS |
| 3 | Daerim | 0.9329 | 1 | 0.9329 | IRS |
| 3 | Dongdaemun History and Culture Park (2–5) | 0.7198 | 0.9086 | 0.7922 | IRS |
| 3 | Dongdaemun History and Culture Park (4–5) | 0.5545 | 0.9004 | 0.6158 | IRS |
| 3 | Dongmyo | 0.6414 | 1 | 0.6414 | IRS |
| 3 | Bulgwang | 0.6115 | 1 | 0.6115 | IRS |
| 3 | Samgakji | 0.69 | 0.947 | 0.7286 | IRS |
| 3 | Sindang | 0.9849 | 1 | 0.9849 | IRS |
| 3 | Yaksu | 0.7002 | 1 | 0.7002 | IRS |
| 3 | Yeonsinnae | 0.6691 | 1 | 0.6691 | IRS |
| 3 | Yeongdeungpogu Office | 0.6084 | 0.966 | 0.6298 | IRS |
| 3 | Ogeum | 0.5074 | 0.9602 | 0.5284 | IRS |
| 3 | Wangsimni | 0.5846 | 0.9576 | 0.6105 | IRS |
| 3 | Euljiro 4-ga | 0.6249 | 1 | 0.6249 | IRS |
| 3 | Isu | 0.7382 | 0.9717 | 0.7597 | IRS |
| 3 | Jamsil | 0.6462 | 0.8636 | 0.7483 | IRS |
| 3 | Jongno 3-ga (1–5) | 1 | 1 | 1 | CRS |
| 3 | Jongno 3-ga (3–5) | 0.7568 | 0.9772 | 0.7745 | IRS |
| 3 | Chungjeongno | 0.8385 | 1 | 0.8385 | IRS |
| 3 | Hapjeong | 0.6626 | 0.9589 | 0.691 | IRS |
Appendix D
Table A3.
Excess quantity of input factors.
| Type | DMU | X1 | X2 | X3 | X4 |
|---|---|---|---|---|---|
| 1 | Seoul Nat’l Univ of Education | 9424 | 2.81 × 10⁹ | 15 | 4430 |
| 1 | Dongdaemun | 7688 | 2.59 × 10⁹ | 15 | 3760 |
| 1 | Dongdaemun History and Culture Park (2–4) | 10,827 | 3.26 × 10⁹ | 17 | 4840 |
| 1 | Sadang | 14,248 | 3.63 × 10⁹ | 21 | 4840 |
| 1 | Seoul Station | 9949.5 | 3.11 × 10⁹ | 15 | 3760 |
| 1 | City Hall | 11,491 | 2.91 × 10⁹ | 17 | 3820 |
| 1 | Sindorim | 12,901 | 4.26 × 10⁹ | 21 | 4900 |
| 1 | Euljiro 3-ga | 9280 | 2.72 × 10⁹ | 14 | 4430 |
| 1 | Jongno 3-ga(1–3) | 10,907 | 2.8 × 10⁹ | 17.5 | 3350 |
| 1 | Chungmuro | 8296.5 | 2.18 × 10⁹ | 21 | 4370 |
| 2 | Gongdeok | 11,239.52 | 1.42 × 10¹⁰ | 14.5 | 2614 |
| 2 | Gunja | 9017.375 | 1.18 × 10¹⁰ | 15 | 3168 |
| 2 | Cheonho | 9162.7 | 1.65 × 10¹⁰ | 14 | 2494 |
| 2 | Cheonggu | 12,061.83 | 6.19 × 10⁹ | 11 | 2614 |
| 2 | Teureung | 13,125.14 | 9.81 × 10⁹ | 13 | 2534 |
| 3 | Garak Market | 10,139.07 | 4.22 × 10⁹ | 13 | 2595 |
| 3 | KonKuk Univ | 8524.505 | 5.43 × 10⁹ | 14.5 | 3994 |
| 3 | Express Bus Terminal | 12,232.48 | 6.34 × 10⁹ | 17 | 3524 |
| 3 | Kkachisan | 7868.9 | 1.09 × 10¹⁰ | 11 | 2724 |
| 3 | Nowon | 10,042.56 | 6.48 × 10⁹ | 13.5 | 3934 |
| 3 | Daerim | 7917.765 | 4.97 × 10⁹ | 14 | 3994 |
| 3 | Dongdaemun History and Culture Park (2–5) | 11,816.95 | 3.45 × 10⁹ | 15 | 4487 |
| 3 | Dongdaemun History and Culture Park (4–5) | 11,375.35 | 4.24 × 10⁹ | 14.5 | 4014 |
| 3 | Dongmyo | 11,587.13 | 6.52 × 10⁹ | 13.5 | 2360 |
| 3 | Bulgwang | 7532.77 | 3.33 × 10⁹ | 13.5 | 2475 |
| 3 | Samgakji | 11,810.72 | 4.55 × 10⁹ | 13 | 3380 |
| 3 | Sindang | 6091.45 | 4.32 × 10⁹ | 12.5 | 3440 |
| 3 | Yaksu | 9620.15 | 3.26 × 10⁹ | 12.5 | 2970 |
| 3 | Yeonsinnae | 7663.27 | 3.45 × 10⁹ | 19 | 2475 |
| 3 | Yeongdeungpogu Office | 15,593.91 | 3.8 × 10⁹ | 13 | 4074 |
| 3 | Ogeum | 11,140.02 | 3.23 × 10⁹ | 17 | 2685 |
| 3 | Wangsimni | 12,741.81 | 4.53 × 10⁹ | 13 | 4074 |
| 3 | Euljiro 4-ga | 9057.365 | 3.94 × 10⁹ | 12 | 4074 |
| 3 | Isu | 13,204.33 | 5.6 × 10⁹ | 12.5 | 3934 |
| 3 | Jamsil | 13,013.67 | 5.53 × 10⁹ | 16 | 3320 |
| 3 | Jongno 3-ga (1–5) | 9311 | 2.73 × 10⁹ | 18 | 2740 |
| 3 | Jongno 3-ga (3–5) | 10,845.51 | 4.96 × 10⁹ | 14.5 | 3604 |
| 3 | Chungjeongno | 11,076.87 | 3.6 × 10⁹ | 12 | 4074 |
| 3 | Hapjeong | 12,069.78 | 4.88 × 10⁹ | 14 | 3440 |
Appendix E
Table A4.
Result of Bootstrap DEA.
| Type | DMU | Bias | Mean | Median | Standard Deviation |
|---|---|---|---|---|---|
| 1 | Seoul Nat’l Univ of Education | 0.025472 | 0.975562 | 0.981825 | 0.019612 |
| 1 | Dongdaemun | 0.041387 | 0.962039 | 0.981344 | 0.040333 |
| 1 | Dongdaemun History and Culture Park (2–4) | 0.013465 | 0.822815 | 0.825107 | 0.009963 |
| 1 | Sadang | 0.010127 | 0.764115 | 0.766182 | 0.007695 |
| 1 | Seoul Station | 0.01412 | 0.938022 | 0.941181 | 0.011299 |
| 1 | City Hall | 0.01467 | 0.898401 | 0.901835 | 0.011376 |
| 1 | Sindorim | 0.048057 | 0.957282 | 0.980942 | 0.051968 |
| 1 | Euljiro 3-ga | 0.021528 | 0.979144 | 0.980701 | 0.014546 |
| 1 | Jongno 3-ga (1–3) | 0.023031 | 0.977908 | 0.982615 | 0.019836 |
| 1 | Chungmuro | 0.045723 | 0.958963 | 0.981016 | 0.048391 |
| 2 | Gongdeok | 0.015634 | 0.912074 | 0.91548 | 0.011685 |
| 2 | Gunja | 0.04432 | 0.959637 | 0.979897 | 0.043363 |
| 2 | Cheonho | 0.033369 | 0.968562 | 0.980694 | 0.028387 |
| 2 | Cheonggu | 0.036864 | 0.965694 | 0.981725 | 0.034056 |
| 2 | Teureung | 0.019745 | 0.98082 | 0.983663 | 0.0133 |
| 3 | Garak Market | 0.017817 | 0.97075 | 0.975863 | 0.015558 |
| 3 | KonKuk Univ | 0.014119 | 0.895938 | 0.89836 | 0.010206 |
| 3 | Express Bus Terminal | 0.011629 | 0.849028 | 0.850726 | 0.007682 |
| 3 | Kkachisan | 0.042663 | 0.960807 | 0.978959 | 0.039781 |
| 3 | Nowon | 0.028162 | 0.973134 | 0.980368 | 0.022324 |
| 3 | Daerim | 0.021921 | 0.978954 | 0.985806 | 0.019536 |
| 3 | Dongdaemun History and Culture Park (2–5) | 0.013471 | 0.895449 | 0.897907 | 0.009911 |
| 3 | Dongdaemun History and Culture Park (4–5) | 0.00992 | 0.890588 | 0.891063 | 0.005378 |
| 3 | Dongmyo | 0.032068 | 0.969626 | 0.980398 | 0.025787 |
| 3 | Bulgwang | 0.041221 | 0.96223 | 0.982075 | 0.040709 |
| 3 | Samgakji | 0.014216 | 0.93304 | 0.934961 | 0.009399 |
| 3 | Sindang | 0.048424 | 0.956914 | 0.981113 | 0.051767 |
| 3 | Yaksu | 0.032359 | 0.969468 | 0.981754 | 0.027752 |
| 3 | Yeonsinnae | 0.026587 | 0.974728 | 0.981457 | 0.02407 |
| 3 | Yeongdeungpogu Office | 0.009426 | 0.956669 | 0.957766 | 0.005977 |
| 3 | Ogeum | 0.017506 | 0.943267 | 0.948547 | 0.015144 |
| 3 | Wangsimni | 0.009199 | 0.948556 | 0.949319 | 0.005111 |
| 3 | Euljiro 4-ga | 0.021719 | 0.978971 | 0.98105 | 0.014859 |
| 3 | Isu | 0.014571 | 0.957496 | 0.960577 | 0.010544 |
| 3 | Jamsil | 0.013689 | 0.850258 | 0.853782 | 0.01103 |
| 3 | Jongno 3-ga (1–5) | 0.045869 | 0.959031 | 0.981769 | 0.049874 |
| 3 | Jongno 3-ga (3–5) | 0.012125 | 0.965277 | 0.966292 | 0.00724 |
| 3 | Chungjeongno | 0.031619 | 0.970029 | 0.979783 | 0.025406 |
| 3 | Hapjeong | 0.011352 | 0.947775 | 0.948829 | 0.00649 |
References
- Movahedi, M.M.; Abtahi, S.Y.; Motamedi, M. Iran railway efficiency analysis, using DEA: An international comparison. Int. J. Appl. Oper. Res. 2011, 1, 1–7. [Google Scholar]
- Wang, Y.; Hayashi, Y.; Kato, H. Performance Evaluation of Subway Lines with Data Envelopment Analysis and Geographic Information Systems. A Case Study of Beijing. J. Hum. Resour. Adult Learn. 2009, 3, 115–129. [Google Scholar]
- Yu, M.M.; Lin, E.T. Efficiency and effectiveness in railway performance using a multi-activity network DEA model. Omega 2008, 36, 1005–1017. [Google Scholar] [CrossRef]
- Pojani, D.; Stead, D. Sustainable urban transport in the developing world: Beyond megacities. Sustainability 2015, 7, 7784–7805. [Google Scholar] [CrossRef]
- Schuetze, T.; Chelleri, L. Urban sustainability versus green-washing—Fallacy and reality of urban regeneration in downtown Seoul. Sustainability 2015, 8, 33. [Google Scholar] [CrossRef]
- Liu, X.; Gong, L.; Gong, Y.; Liu, Y. Revealing travel patterns and city structure with taxi trip data. J. Transp. Geogr. 2015, 43, 78–90. [Google Scholar] [CrossRef]
- Li, M.; Dong, L.; Shen, Z.; Lang, W.; Ye, X. Examining the Interaction of Taxi and Subway Ridership for Sustainable Urbanization. Sustainability 2017, 9, 242. [Google Scholar] [CrossRef]
- Adolphson, D.L.; Cornia, G.C.; Walters, L.C. Railroad property valuation using data envelopment analysis. Interfaces 1989, 19, 18–26. [Google Scholar] [CrossRef]
- Zhou, G.; Min, H.; Xu, C.; Cao, Z. Evaluating the comparative efficiency of Chinese third-party logistics providers using data envelopment analysis. Int. J. Phys. Distrib. Logist. Manag. 2008, 38, 262–279. [Google Scholar] [CrossRef]
- Sun, L.; Rong, J.; Yao, L. Measuring transfer efficiency of urban public transportation terminals by data envelopment analysis. J. Urban Plan. Dev. 2010, 136, 314–319. [Google Scholar] [CrossRef]
- Criado, R.; Hernandez-Bermejo, B.; Romance, M. Efficiency, vulnerability and cost: An overview with applications to subway networks worldwide. Int. J. Bifurc. Chaos 2007, 17, 2289–2301. [Google Scholar] [CrossRef]
- Growitsch, C.; Wetzel, H. Testing for economies of scope in European railways: An efficiency analysis. J. Trans. Econ. Policy 2009, 43, 1–24. [Google Scholar]
- Ohnell, S.; Woxenius, J. An industry analysis of express freight from a European railway perspective. Int. J. Phys. Distrib. Logist. Manag. 2003, 33, 735–751. [Google Scholar] [CrossRef]
- Jain, P.; Cullinane, S.; Cullinane, K. The impact of governance development models on urban rail efficiency. Transp. Res. Part A Policy Pract. 2008, 42, 1238–1250. [Google Scholar] [CrossRef]
- Yu, M.M. Assessing the technical efficiency, service effectiveness, and technical effectiveness of the world’s railways through NDEA analysis. Transp. Res. Part A Policy Pract. 2008, 42, 1283–1294. [Google Scholar] [CrossRef]
- Azadeh, A.; Ghaderi, S.F.; Izadbakhsh, H. Integration of DEA and AHP with computer simulation for railway system improvement and optimization. Appl. Math. Comput. 2008, 195, 775–785. [Google Scholar] [CrossRef]
- Yan, L.; Tong, W.; Hui, D.; Zongzhi, W. Research and application on risk assessment DEA model of crowd crushing and trampling accidents in subway stations. Procedia Eng. 2012, 43, 494–498. [Google Scholar] [CrossRef]
- Lee, K.; Jung, W.S.; Park, J.S.; Choi, M.Y. Statistical analysis of the Metropolitan Seoul Subway System: Network structure and passenger flows. Phys. A Stat. Mech. Its Appl. 2008, 387, 6231–6234. [Google Scholar] [CrossRef]
- Kim, H.S.; Park, J.S.; Lee, K.S. Visualization of passenger flows of the metropolitan Seoul subway system. J. Korea Contents Assoc. 2010, 10, 397–405. [Google Scholar] [CrossRef]
- Charnes, A.; Cooper, W.W.; Rhodes, E. Measuring the efficiency of decision making units. Eur. J. Oper. Res. 1978, 2, 429–444. [Google Scholar] [CrossRef]
- Banker, R.D.; Charnes, A.; Cooper, W.W. Some models for estimating technical and scale inefficiencies in data envelopment analysis. Manag. Sci. 1984, 30, 1078–1092. [Google Scholar] [CrossRef]
- Boussofiane, A.; Dyson, R.G.; Thanassoulis, E. Applied data envelopment analysis. Eur. J. Oper. Res. 1991, 52, 1–15. [Google Scholar] [CrossRef]
- Sarkis, J. Preparing your data for DEA. In Modeling Data Irregularities and Structural Complexities in Data Envelopment Analysis; Springer: Berlin, Germany, 2007; pp. 305–320. [Google Scholar]
- Scheel, H. Undesirable outputs in efficiency valuations. Eur. J. Oper. Res. 2001, 132, 400–410. [Google Scholar] [CrossRef]
- Yaisawarng, S.; Klein, J.D. The effects of sulfur dioxide controls on productivity change in the U.S. electric power industry. Rev. Econ. Stat. 1994, 76, 447–460. [Google Scholar] [CrossRef]
- Simar, L.; Wilson, P.W. Sensitivity analysis of efficiency scores: How to bootstrap in nonparametric frontier models. Manag. Sci. 1998, 44, 49–61. [Google Scholar] [CrossRef]
- Simar, L.; Wilson, P.W. Of course we can bootstrap DEA scores! But does it mean anything? Logic trumps wishful thinking. J. Product. Anal. 1999, 11, 93–97. [Google Scholar] [CrossRef]
- Simar, L.; Wilson, P.W. A general methodology for bootstrapping in non-parametric frontier models. J. Appl. Stat. 2000, 27, 779–802. [Google Scholar] [CrossRef]
- Kneip, A.; Simar, L.; Wilson, P.W. Asymptotics and consistent bootstraps for DEA estimators in nonparametric frontier models. Econ. Theory 2008, 24, 1663–1697. [Google Scholar] [CrossRef]
- Hall, P. On the bootstrap and confidence intervals. Ann. Stat. 1986, 14, 1431–1452. [Google Scholar] [CrossRef]
Table 1.
Input and output variables.
| Input variables |
|
| Output variables |
|
Table 2.
Results of the efficiency analysis.
| Type | Efficiency (CRS) | Efficiency (VRS) | CRS (%) | IRS (%) | DRS (%) |
|---|---|---|---|---|---|
| 1 | 0.76395 | 0.94744 | 20 | 80 | 0 |
| 2 | 0.71758 | 0.98546 | 0 | 100 | 0 |
| 3 | 0.7077 | 0.965388 | 4.2 | 95.8 | 0 |
Table 3.
Excess quantity of input.
| Type | Area of Transfer Station (m2) | Operation Cost (USD/Year) | Number of Staff | Subway Capacity (Car/Day) |
|---|---|---|---|---|
| 1 | 10,501.2 | 2,686,178.73 | 17.35 | 4250 |
| 2 | 10,921.31 | 10,358,785.80 | 13.5 | 2684.8 |
| 3 | 10,511.56 | 4,220,993.20 | 14.10417 | 3432.708 |
Table 4.
Bootstrap DEA results.
| Type | Bias | Mean | Median | Standard Deviation |
|---|---|---|---|---|
| 1 | 0.025758 | 0.923425 | 0.9322748 | 0.023502 |
| 2 | 0.0299864 | 0.957357 | 0.9682918 | 0.026158 |
| 3 | 0.0225688 | 0.944083 | 0.9511885 | 0.019231 |
© 2017 by the authors. Licensee MDPI, Basel, Switzerland. This article is an open access article distributed under the terms and conditions of the Creative Commons Attribution (CC BY) license (http://creativecommons.org/licenses/by/4.0/).
Share and Cite
MDPI and ACS Style
Kim, C.; Kim, S.W.; Kang, H.J.; Song, S.-M. What Makes Urban Transportation Efficient? Evidence from Subway Transfer Stations in Korea. Sustainability 2017, 9, 2054. https://doi.org/10.3390/su9112054
AMA Style
Kim C, Kim SW, Kang HJ, Song S-M. What Makes Urban Transportation Efficient? Evidence from Subway Transfer Stations in Korea. Sustainability. 2017; 9(11):2054. https://doi.org/10.3390/su9112054
Chicago/Turabian StyleKim, Changhee, Soo Wook Kim, Hee Jay Kang, and Seung-Min Song. 2017. "What Makes Urban Transportation Efficient? Evidence from Subway Transfer Stations in Korea" Sustainability 9, no. 11: 2054. https://doi.org/10.3390/su9112054
Note that from the first issue of 2016, this journal uses article numbers instead of page numbers. See further details here.