Article

Assessing the Rebound Hammer Test for Rammed Earth Material

Sustainable Developments in Civil Engineering Research Group, Faculty of Civil Engineering, Ton Duc Thang University, Ho Chi Minh City 70000, Vietnam
Sustainability 2017, 9(10), 1904; https://doi.org/10.3390/su9101904
Submission received: 21 July 2017 / Revised: 11 September 2017 / Accepted: 13 September 2017 / Published: 21 October 2017

Abstract

:
Rammed-earth (RE) is a construction material manufactured from the soil. The soil is compacted at its optimum water content, inside a formwork to build a monolithic wall. RE material is attracting renewed interest throughout the world thanks to its sustainable characteristics: low embodied energy, substantial thermal inertia, and natural regulator of moisture; on the other hand, the existing historic RE buildings is still numerous. This is why several research studies have been carried out recently to study different aspects of this material. However, few investigations have been carried out to explore the possibility of applying the nondestructive techniques on RE walls. This paper presents an assessment of the well-known rebound hammer test on RE walls. The calibration curves of the rebound hammer test have been established for conventional concrete where the rebound number is more than 20. For RE material with lower compressive strengths, a new calibration curve must be established. In the present study, two soils were used and different homogenized specimens with different dry densities were manufactured and tested, to plot a general calibration curve. Then, this calibration curve was applied to RE specimens; different results at different positions in an earthen layer were observed, due to the inhomogeneity of the material. The final results showed an acceptable accuracy of the calibration curve in the prediction of the compressive strength of RE material.

1. Introduction

Rammed-earth (RE) is a construction material which is manufactured from sandy-clayey gravel soils that are compacted inside a formwork to build a monolithic wall. The soil composition varies greatly but should not include any organic components. The soil is compacted at its optimum water content, which provides the highest dry density for the given compaction energy [1]. The RE wall is composed of several layers. For each layer, the soil is put into a formwork and then compacted with a rammer (manual or pneumatic). After compaction, the thickness of each layer is typically about 10–15 cm [2,3]. The procedure is repeated until the wall is completed. Figure 1 presents an example of a school built with RE in France.
Recent studies have focused on RE because it is a sustainable material having very low embodied energy [4,5]; the earth material can act as a natural moisture buffering for indoor environments [6,7,8]. Furthermore, the number of historic RE buildings in Europe, and in the world, remains high [9,10]; maintaining this heritage requires scientific approaches to have appropriate renovations.
Several research investigations have recently been conducted to study the properties of RE: mechanical characteristics [1,11,12,13,14,15,16,17], durability [9,18], hygrothermal behavior [6,19,20,21], and earthquake performance [22,23,24,25]. However, using nondestructive techniques to determine the in-situ characteristics of RE walls is less reported, although several studies can be cited. Lombillo et al. [26] used minor-destructive techniques such as flat jack, hole-drilling, and mini-pressure meter. Bui et al. [27] developed an analytical procedure to determine the Young’s modulus of RE walls from the non-destructive vibrational measurements.
In the present paper, the author explores the possibility of using the well-known rebound hammer test to determine rapidly the compressive strength of in-situ RE walls. It is worth noting that this technique has been tried by Khadka & Shakya [28] and Liang et al. [29]; however, the empiric curves of the rebound hammers were established for conventional concretes where the rebound number was more than 20 (corresponding to the compressive strengths more than 10 MPa); for RE material with lower compressive strengths, the calibration curve was not available, so these authors could not predict the compressive strength of the RE specimens measured. That was the reason why in the present study, a new calibration curve was investigated and proposed for RE material. Two soils were used; different specimens with different dry densities were manufactured and tested. Then, this calibration curve was assessed by applying the method on RE specimens.

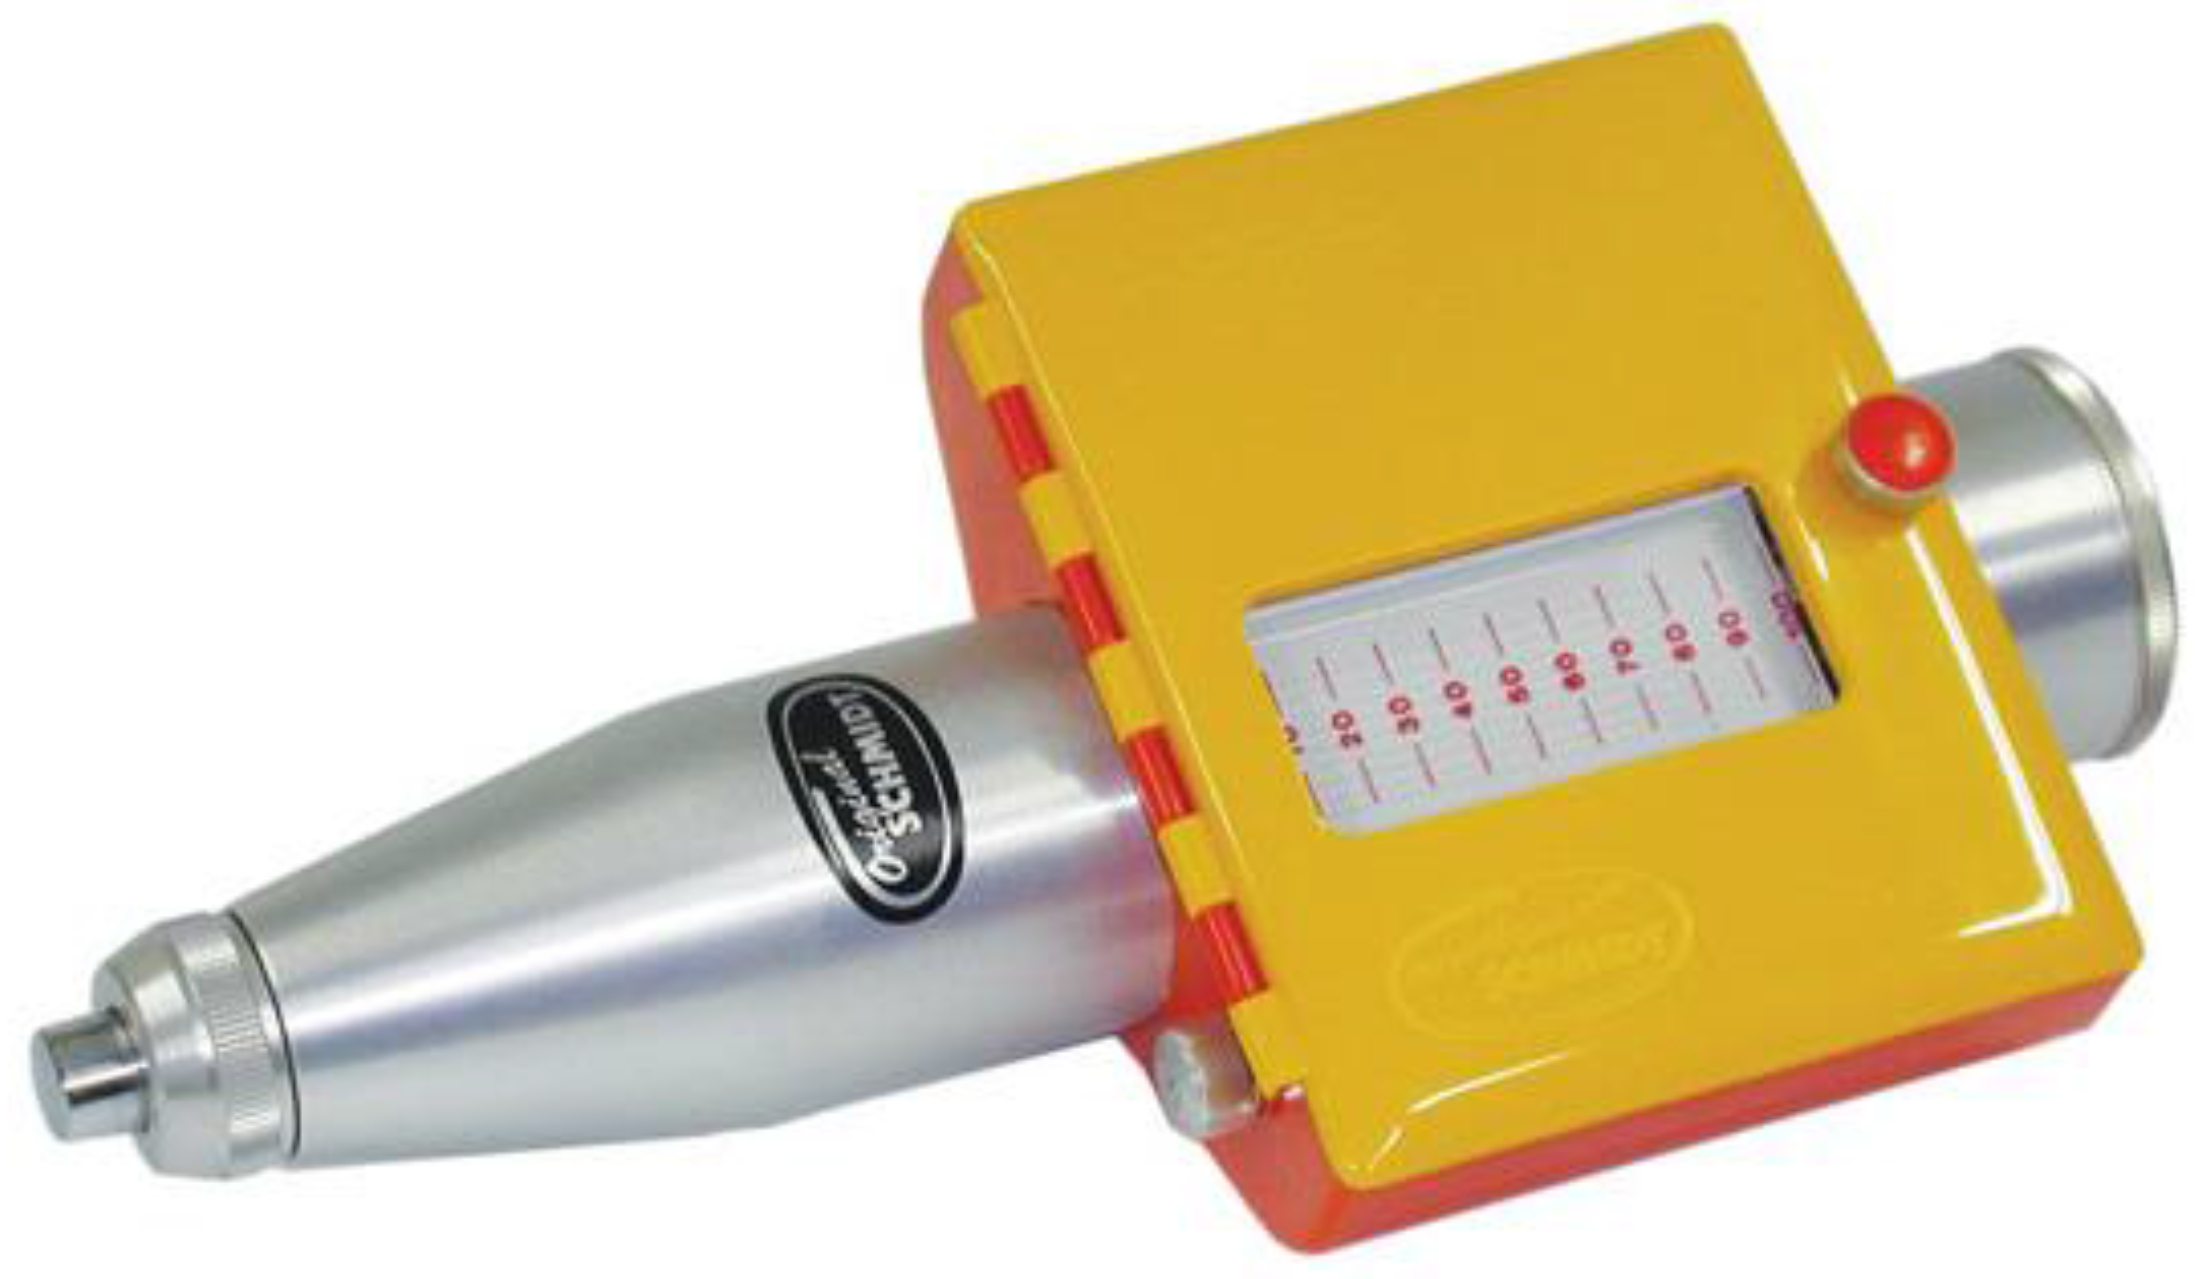
2. Schmidt Rebound Hammer Test

The rebound hammer (or Schmidt hammer) test is a nondestructive test widely used for concrete, due to its simplicity, speed, and low cost [30]. The rebound hammer is intended to measure the surface hardness of concrete [31]. From the empirical relationship between the concrete compressive strength and the rebound number, the compressive strength of the tested concrete can be estimated. The hammer has an approximate mass of 1.8 kg and is suitable for laboratory tests and in-situ tests.
Several different types of rebound hammers exist: the original Schmidt series N/L, NR/LR; the Digi-Schmidt series ND/LD; Silver Schmidt series (ST/PC) N/L. However, the main differences are the mode of display (on paper/digital) and whether there is any internal memory for the result saving. The basic principle does not change. The most important element is the empirical relationship between the compressive strength and the rebound number.
The rebound hammer used in the present study was a classical Schmidt series NR/LR (Figure 2). Several factors can influence the rebound hammer test results: smoothness of the surface under test; size and shape of the specimens; type of coarse aggregate; moisture content. Due to these influencing factors, the potential error of this method is ±15%, which is why the scope of this study was not to consider the Schmidt hammer as a substitute for uniaxial compression tests. I aim only to assess the possibility of using this nondestructive technique for a quick control of in-situ RE walls, since, due to the fragility of this material, taking RE specimens from in-situ walls is a delicate operation [32].

3. Specimen Manufacturing and the Homogeneity of RE Specimens

3.1. Material Used

Two soils, called Soil A and Soil B, were used for the present study. These soils were taken from two RE construction sites, which were selected by RE constructors. The compositions of these two soils are commonly used in RE constructions [2]. Soil A represented a fine soil with a relatively high clay concentration and without gravel; Soil B represented a coarse soil with a relatively low clay content and contains gravels. The objective was to take the influences of the soil composition into account. See Table 1.

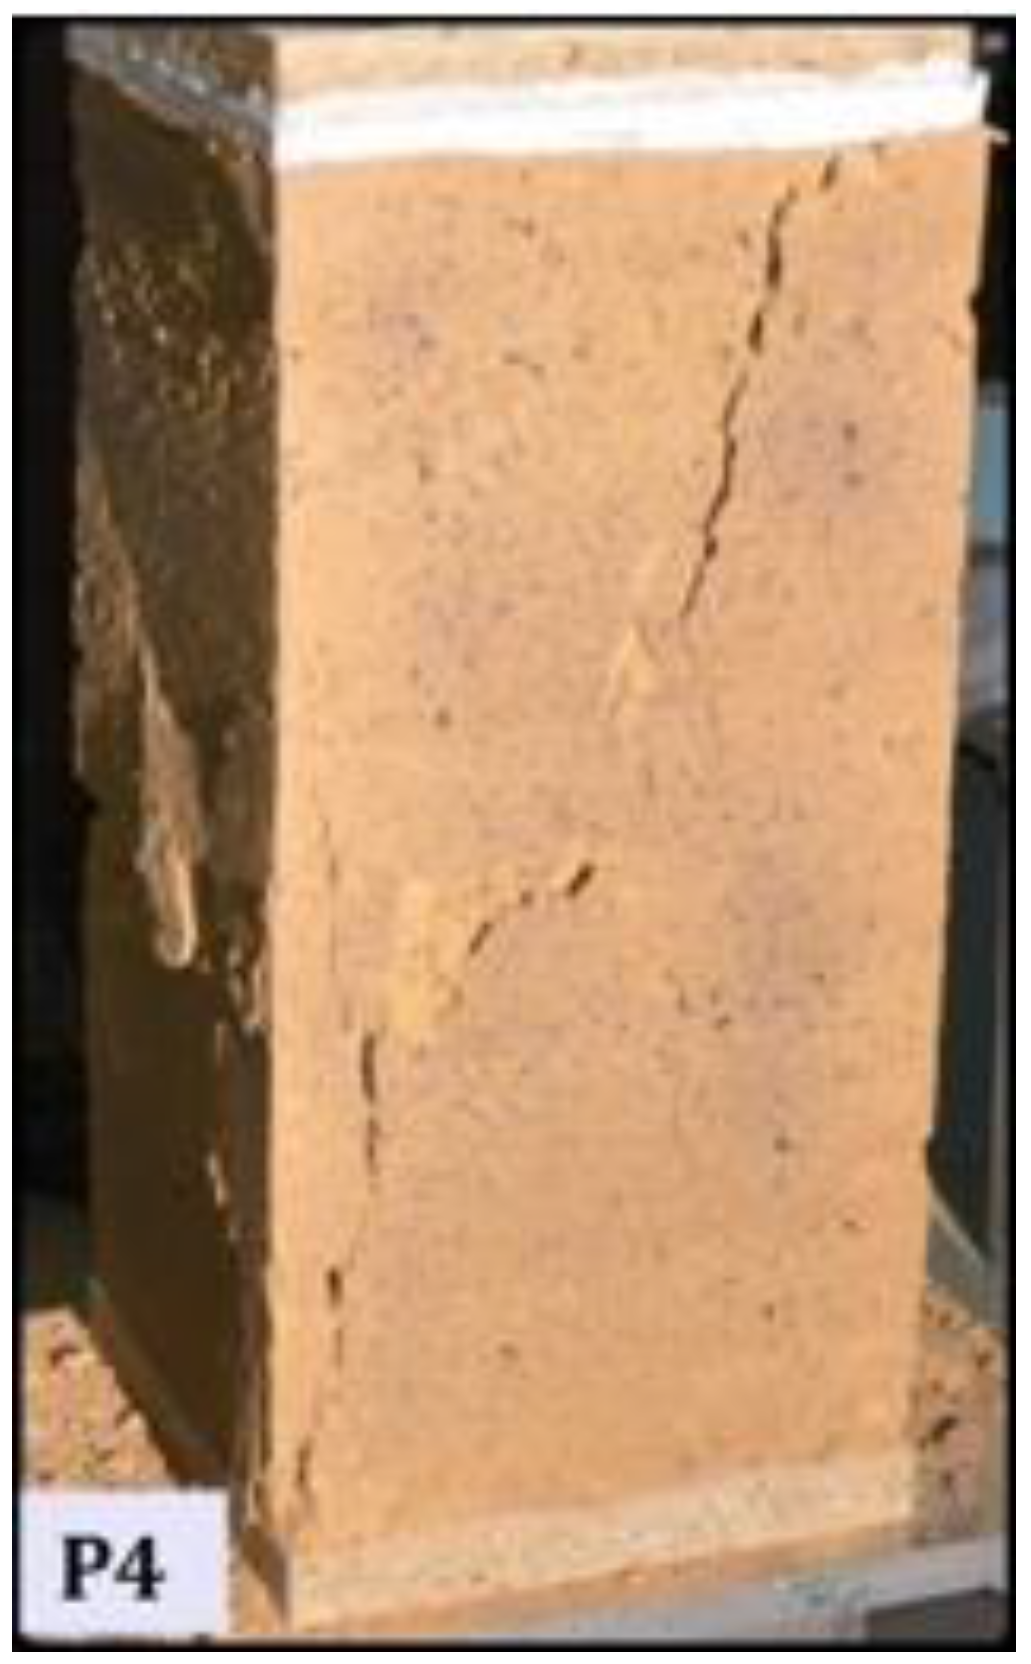
3.2. Inhomogeneity of RE Specimens

The inhomogeneity of an RE wall is visibly observed with the superposition of earthen layers (Figure 3). It is well known that the upper part of an earthen layer—which directly receives the compaction energy during the manufacture—is denser than the lower part [1,33]. Therefore, a calibration curve should take into account the inhomogeneity of RE material. Therefore, different homogeneous specimens with different dry densities were manufactured to reproduce the difference in density in an earthen layer.

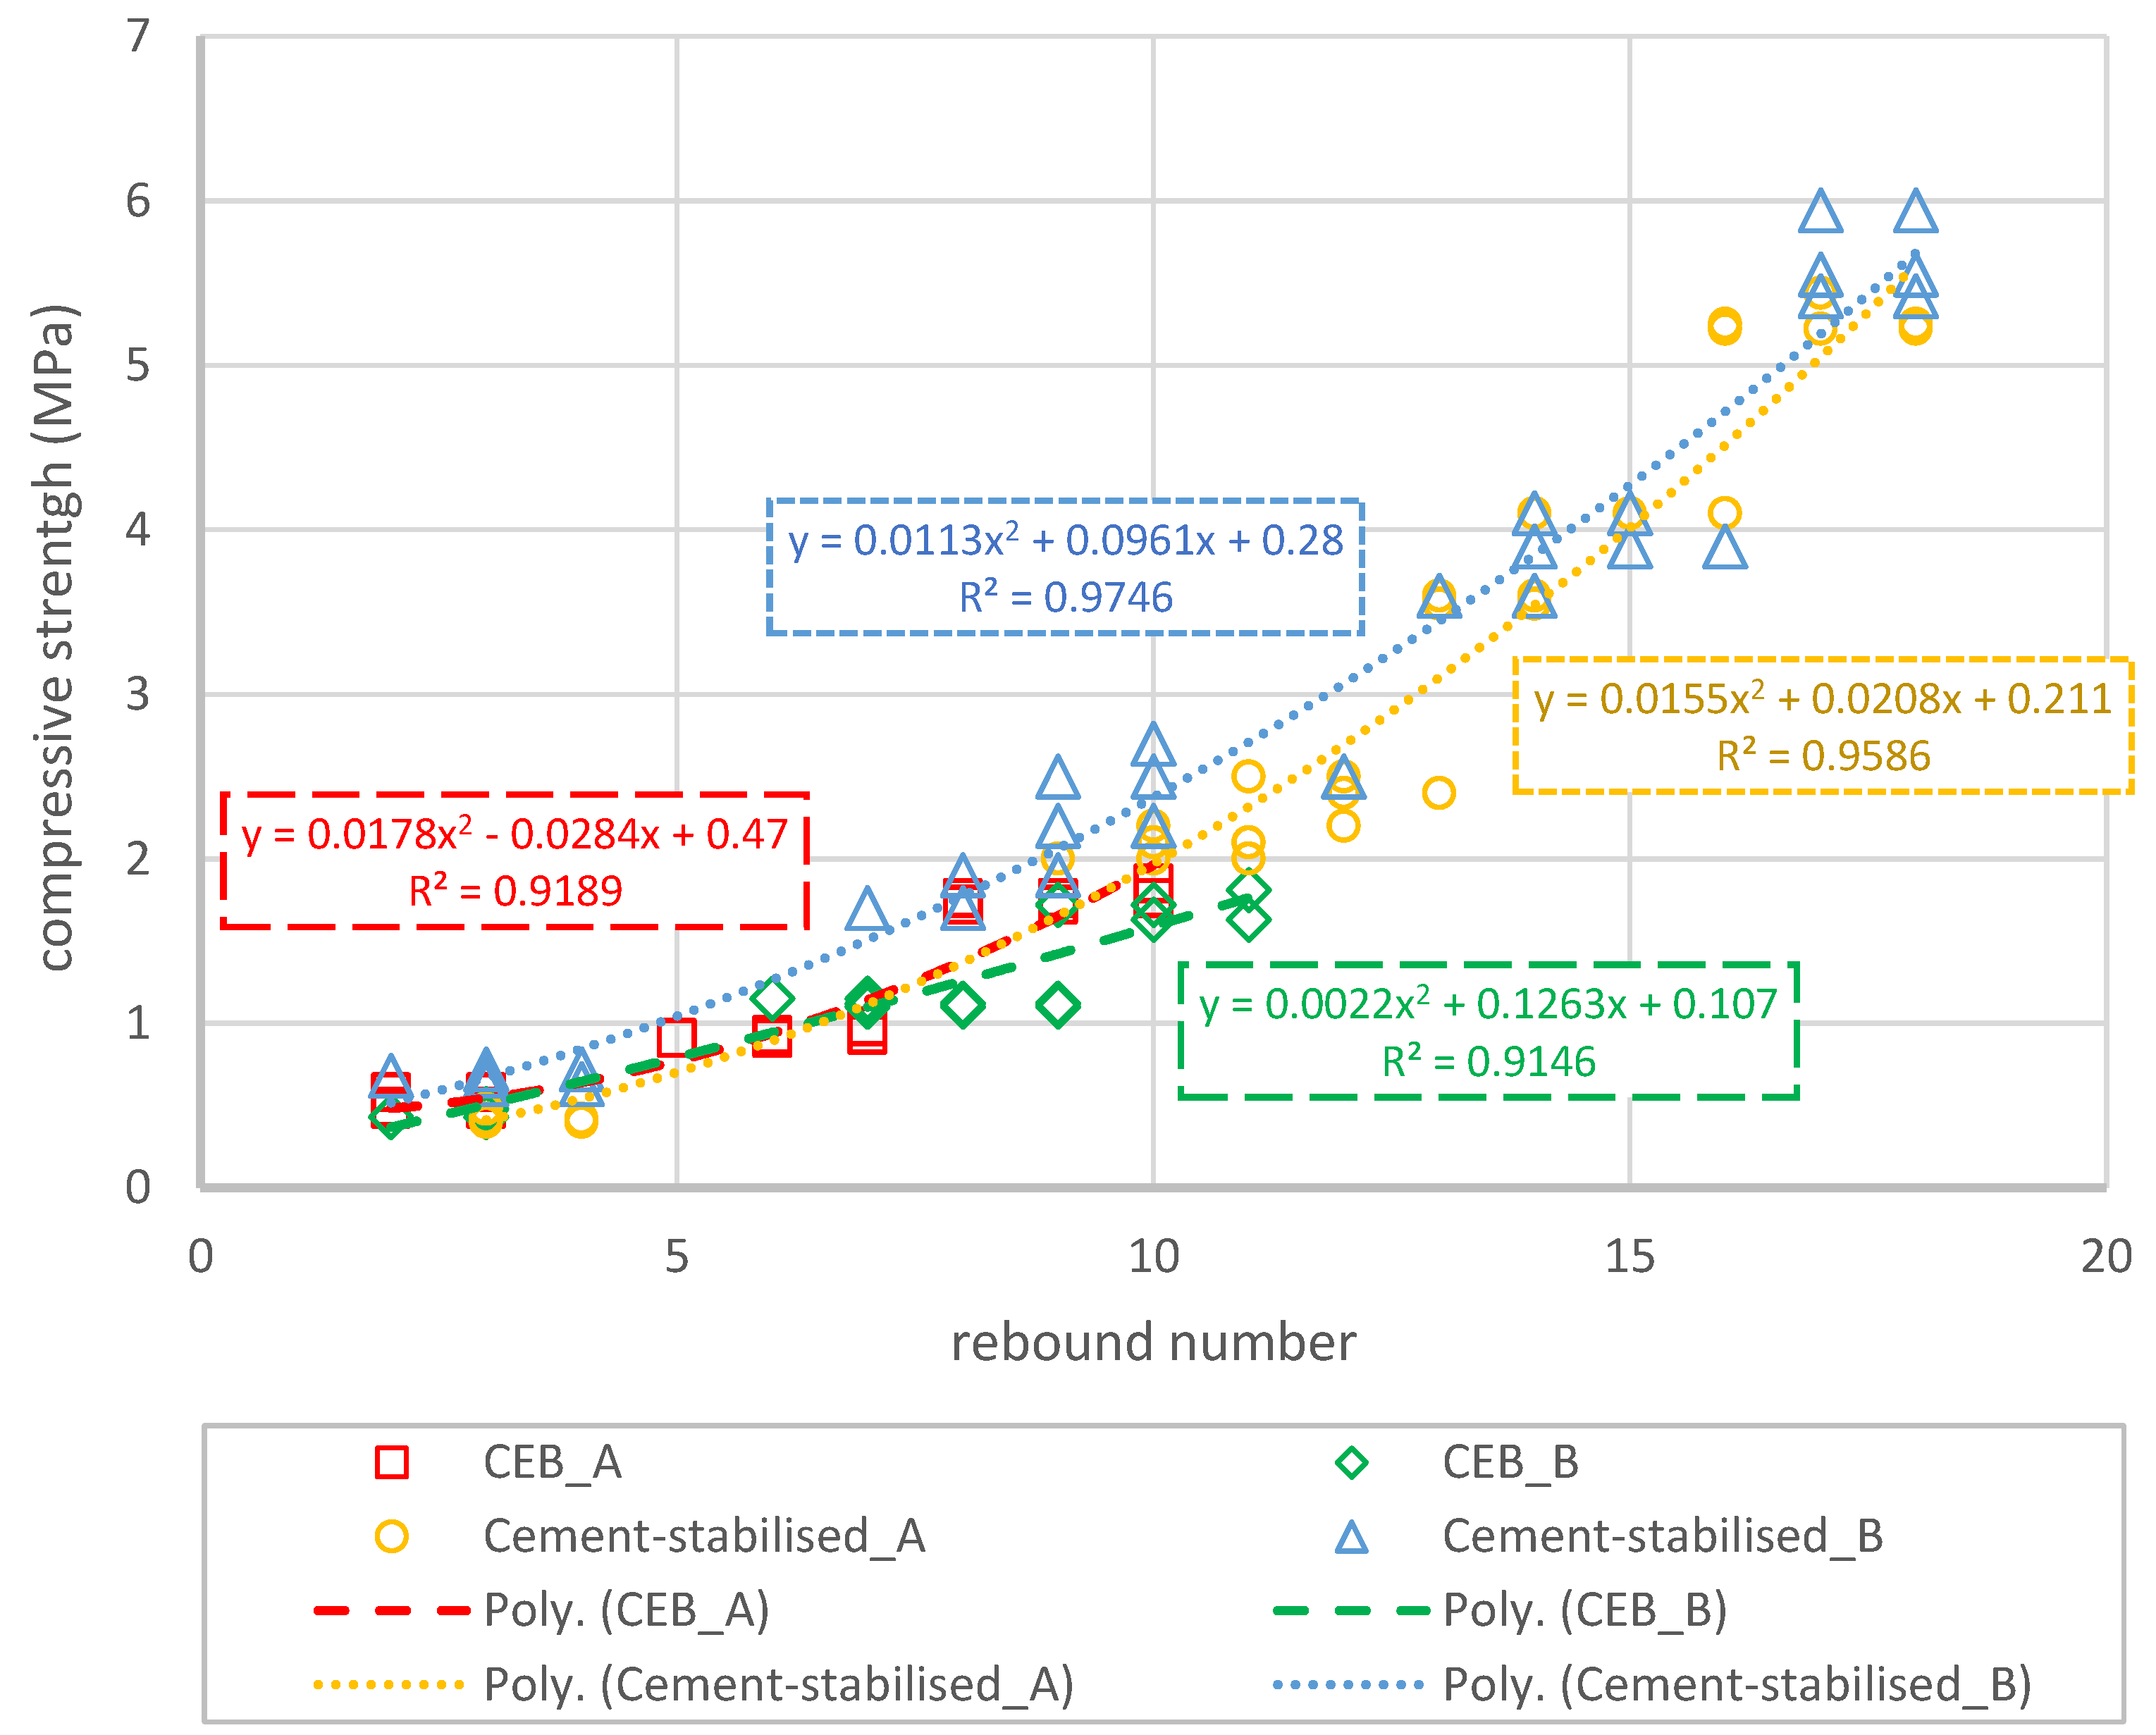
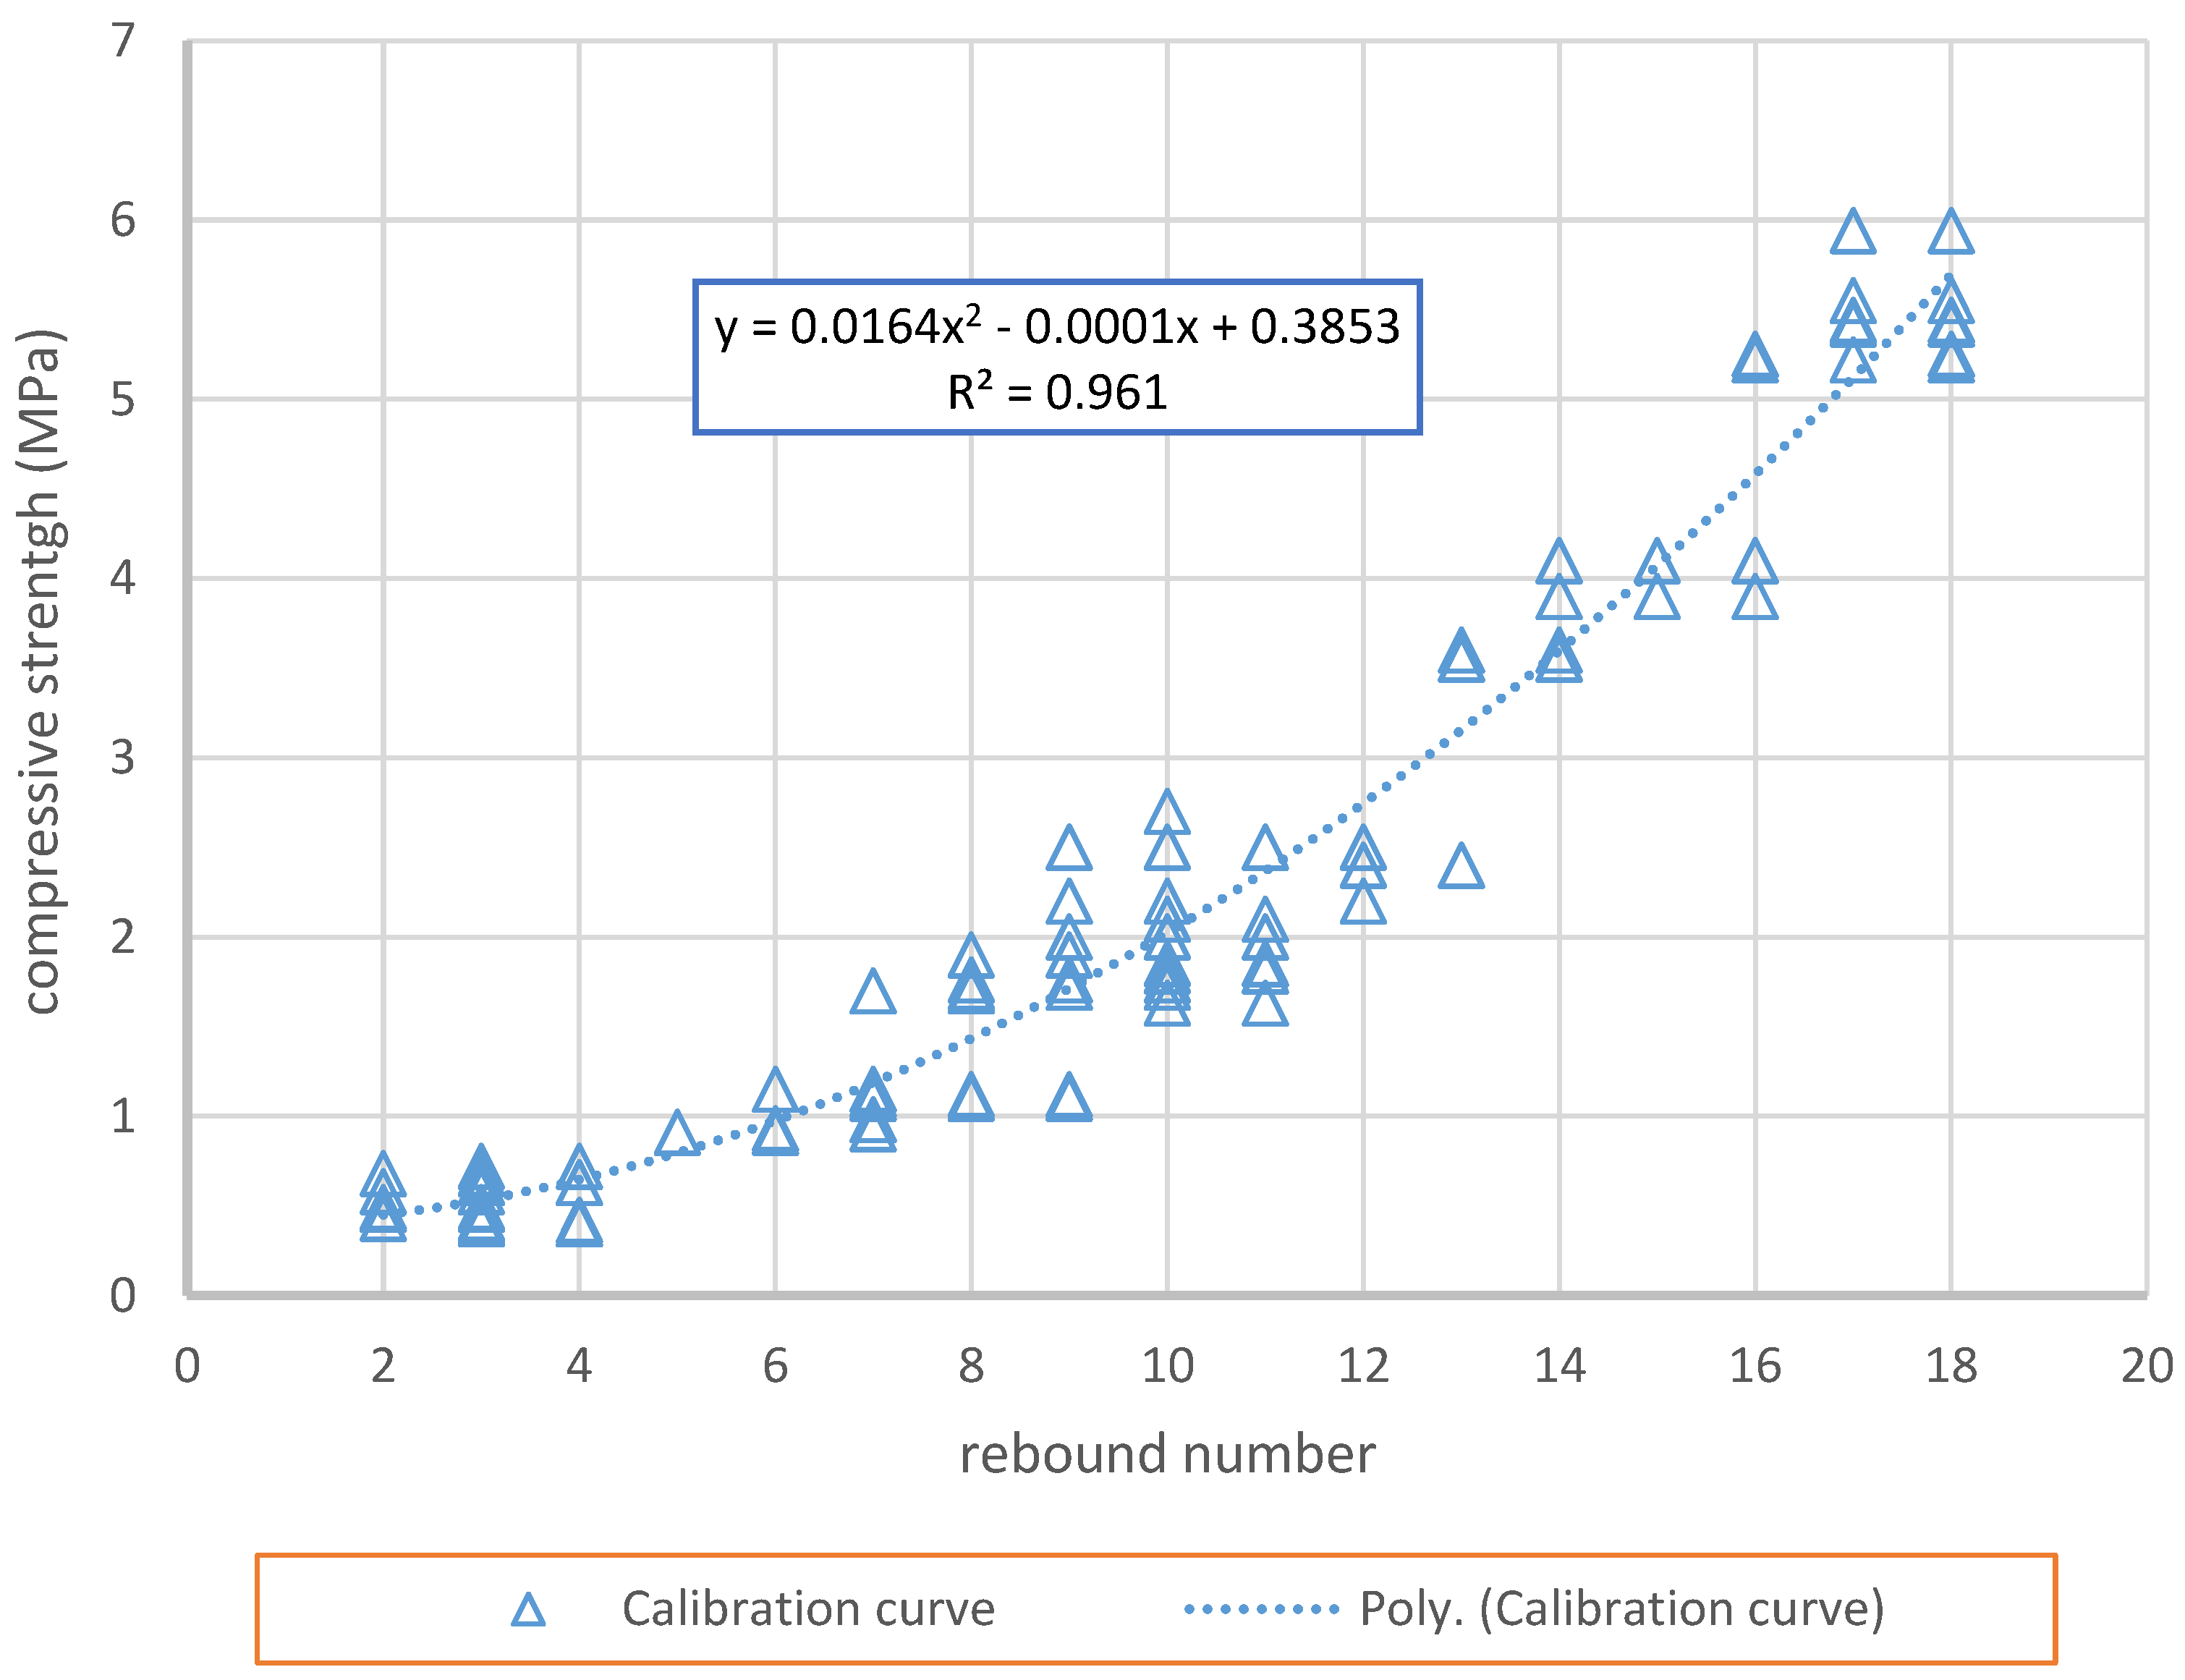
4. Calibration Curve

As mentioned above, due to the inhomogeneity of RE material, equivalent homogeneous specimens are necessary for the establishment of a calibration curve. In this study, two equivalent specimens were used:
  • Compressed earth blocks (CEBs): different CEBs with different densities were manufactured to represent the different zones in an RE layer. The dimensions of earthen blocks were 9.5 × 14 × 29.4 cm3. When the CEBs were tested in the longitudinal direction, the corresponding slenderness ratio was 3.1. Three different dry densities were targeted to produce: 1650, 1800, and 1950 kg/m3. The manufacturing water content was 12%, which corresponded to the Proctor optimum. The targeted dry densities were reached by calculating the amount of soil put in the mold. For each dry density expected, three specimens were manufactured. Before the manufacturing, the soil was sieved at 2 cm to take out the big gravels that provided a certain homogeneity for CEBs. The representativeness of earthen blocks for RE material has been discussed in a previous study (Bui et al. [1]). The specimens were unmolded after the manufacture and cured in ambient conditions (25 °C and 60% RH).
  • Cement stabilized soil technique: different amounts of cement CEM II were tried to produce different compressive strengths. Five compositions were used: the specimens stabilized by cement at 0, 2, 4, 6, and 8% of the weight of the total mix, respectively. In order to consider specimens as homogenous, the soil was sieved at 1 cm before manufacturing. The moisture content and the Atterberg’s plastic limit of the soil corresponded to 2% and 17% (in weight), respectively. The manufacturing water content for all mixtures was chosen at 18% (including the residual moisture content in the soil), which was slightly superior to the plastic limit. It was observed that this water content enabled an acceptable workability for the molding. First, the soil and the cement were mixed without water; then, the water was added until the target water content. The standard molds for mortar specimens (4 cm × 4 cm × 16 cm) were used. For each composition, three specimens were manufactured in the same way a classical mortar is manufactured. The specimens were unmolded after one day and then cured in ambient conditions (25 °C and 60% RH). When the specimens were tested under uniaxial compression tests, the corresponding slenderness ratio was 1, so a corrector ratio was applied to calculate the compressive strength, following European standards and recent investigations ([34,35,36]). The specimens were tested after 28 days of curing. The dry densities of cement-stabilized soil specimens were 1810 ± 34 kg/m3.
The specimens were first tested with a Schmidt hammer and then tested under uniaxial compression tests to determine the relationship between the rebound number and the compressive strength. The moisture contents of the specimens at the moments of the test were about 2%. For each specimen, three rebound hammer tests were performed at three different positions, along the length of the specimen. The specimen was put on a support and held by clamps at two ends to avoid displacements when the rebound hammer test was performed.
The trend curves were plotted for each specimen type by using the second-degree functions and the least squares method for the regression analysis (Figure 4), as the case of the conventional curve for concrete material [30]. The results from Figure 4 shows that the soil mortar without cement (0%) had lowest compressive strength due to a high manufacturing water content and without compaction. The specimens stabilized with 2% cement had compressive strengths of about 2 ± 0.2 MPa, which are comparable to those of the unstabilized CEBs with high dry density. For higher cement amount used (4, 6 and 8%), the compressive strengths of soil–concrete specimens increased with the increase in cement and higher than that of the unstabilized CEBs.
In Figure 4, although there are slight differences in the trend curves of the different specimen types, a general tendency of the relationship between the compressive strength and the rebound number can also be observed. Therefore, a general trend curve was then plotted for all obtained results, by using also a second degree function (Figure 5). The correlation factor (R2 value) was 0.96, which shows an acceptability of the trend curve obtained.

5. The Application of the Obtained Calibration Curve on RE Material

To verify the relevancy of the calibration curve, three unstabilized RE prismatic specimens (0.25 × 0.25 × 0.50 m3) were manufactured to be tested with hammer tests. The width of the specimens (0.25 m) was chosen to take into account several factors during the manufacturing: confinement effects, and frictions between the earth and the formwork during the compaction [1]. The height of the specimens (0.5 m) was chosen to have a slenderness ratio (height/width) of 2, which, as is well-known, was necessary to neglect the influences of the friction between the specimen and the press’s plates during the compression test. For this validation step, only Soil A was used.

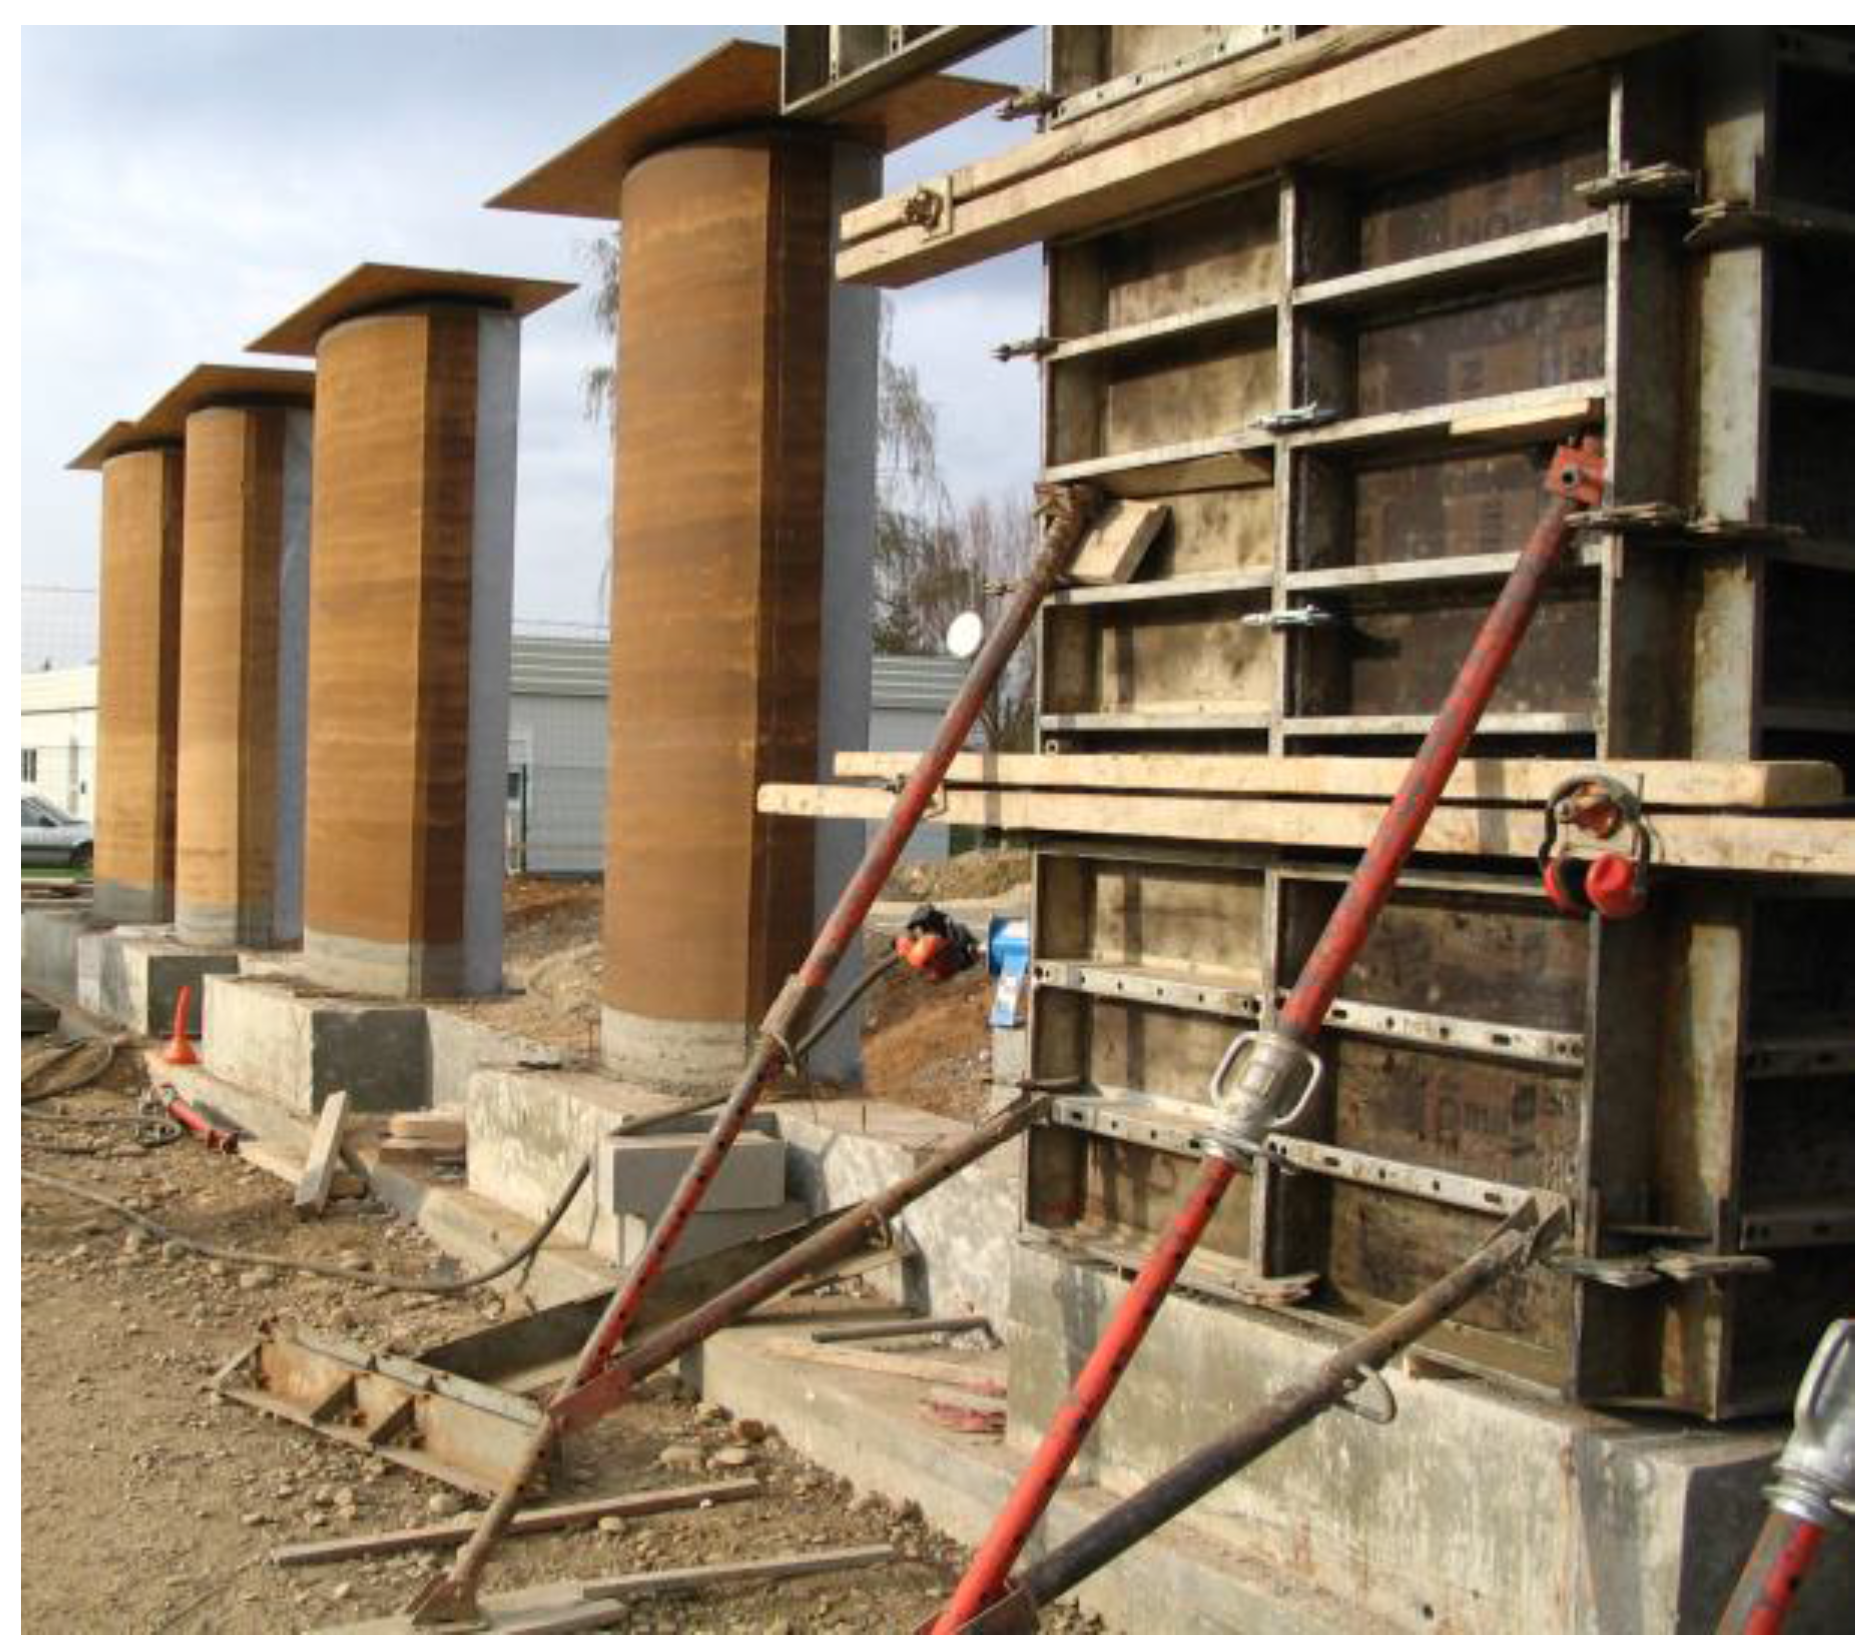
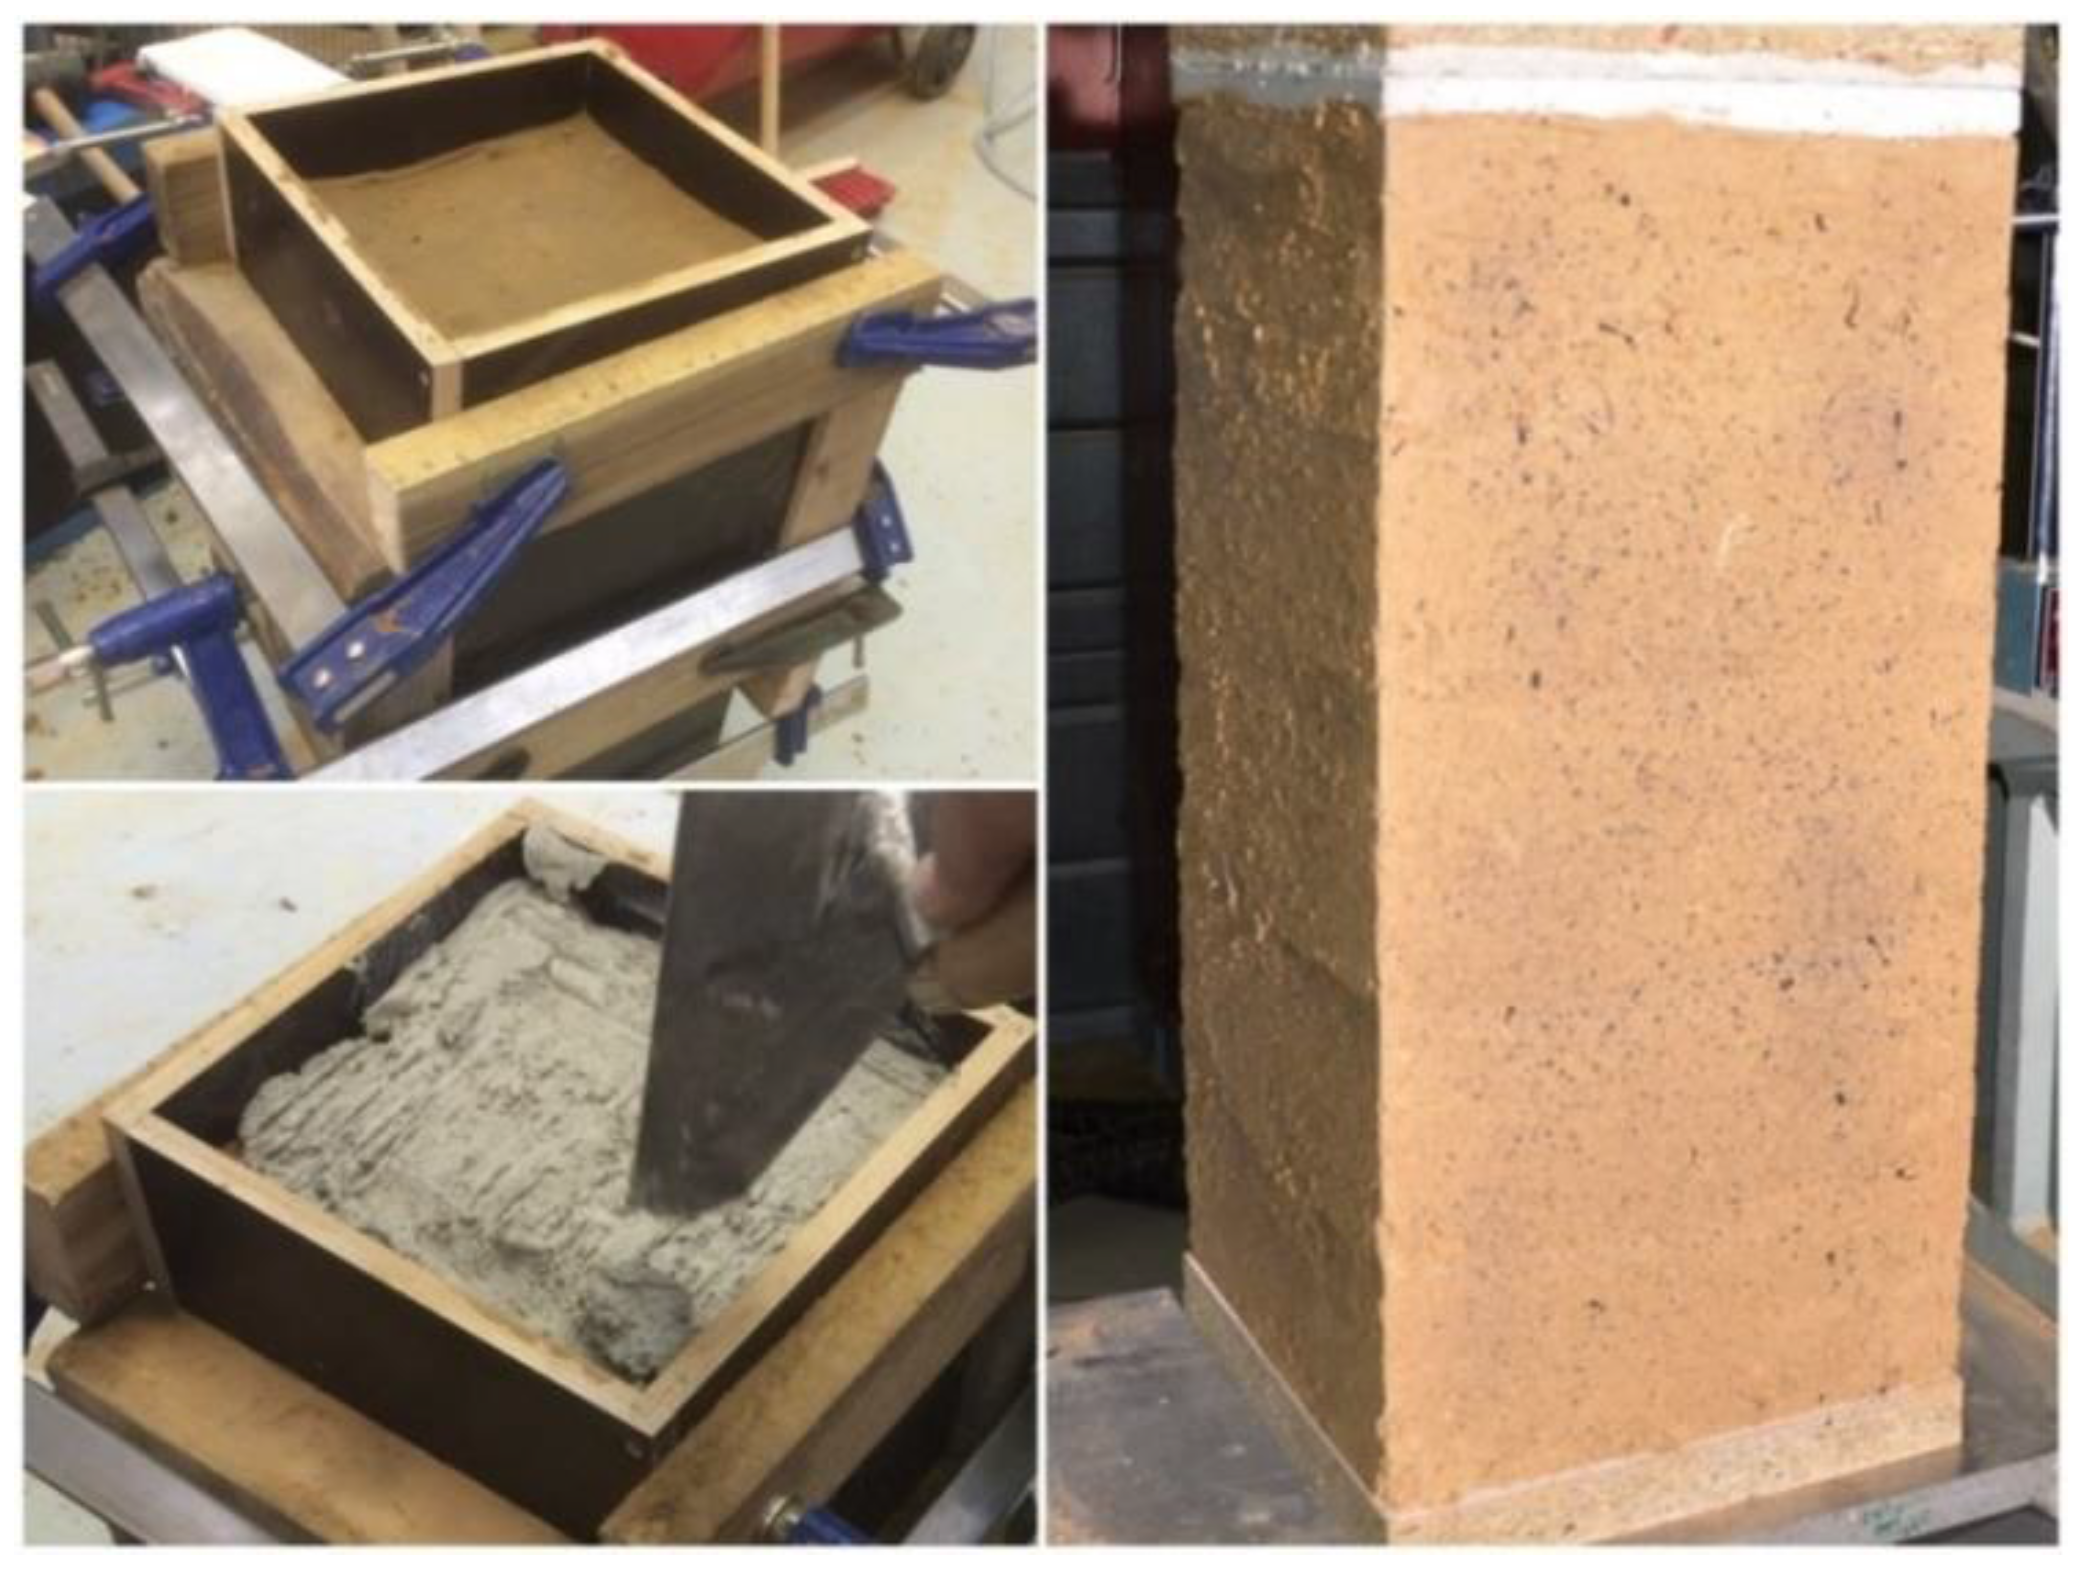
5.1. RE Specimen Manufacturing

To determine the optimum water content that corresponded to the maximum dry density, a preliminary study was carried out, in the same manner of a Proctor’s test, but the compaction energy was directly applied using the pneumatic rammer: five different water concentrations were tested and the corresponding dry densities were determined. Finally, the maximum dry density corresponded to a water concentration of 12%, and this is why the water concentration for the manufacturing of specimens was chosen to be 12%.
Prior to the unconfined compression tests, the specimens (0.25 × 0.25 × 0.50) m3 were surfaced at the upper face with a lime mortar to obtain a plane surface (Figure 6). The lime mortar was a mix of lime and sand in a 1:3 ratio by volume, which has been applied to show suitability in a previous study [13].

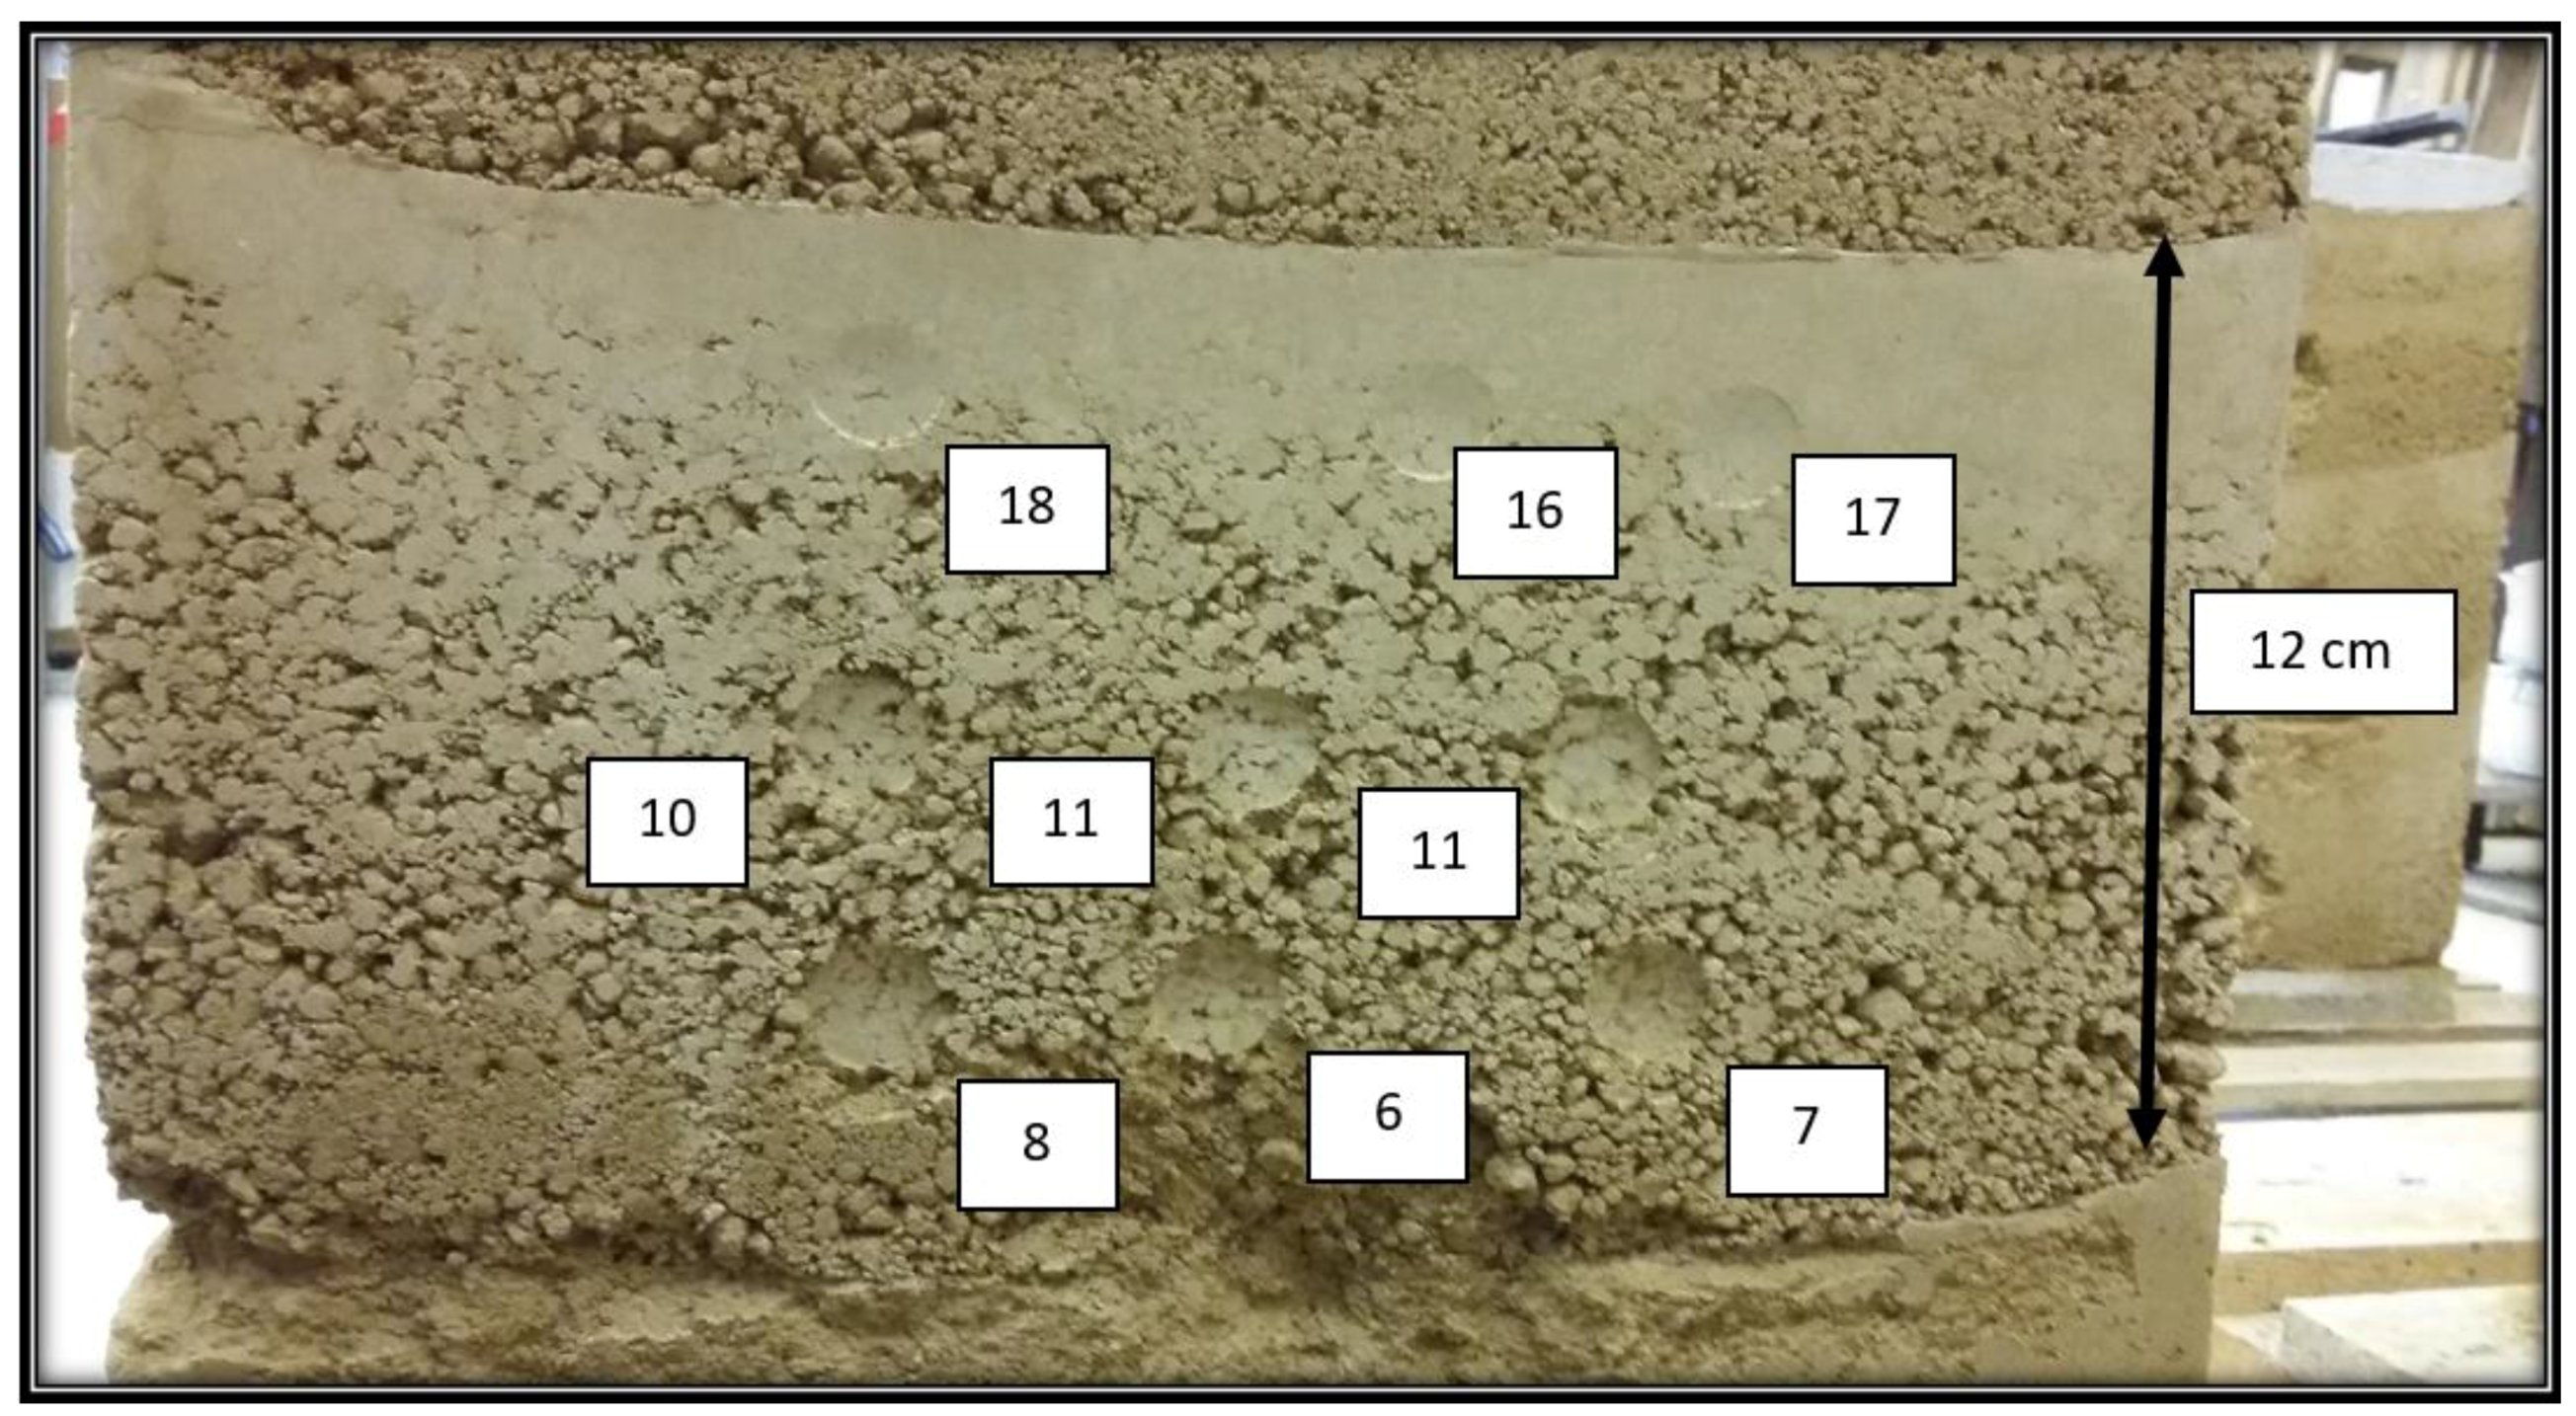
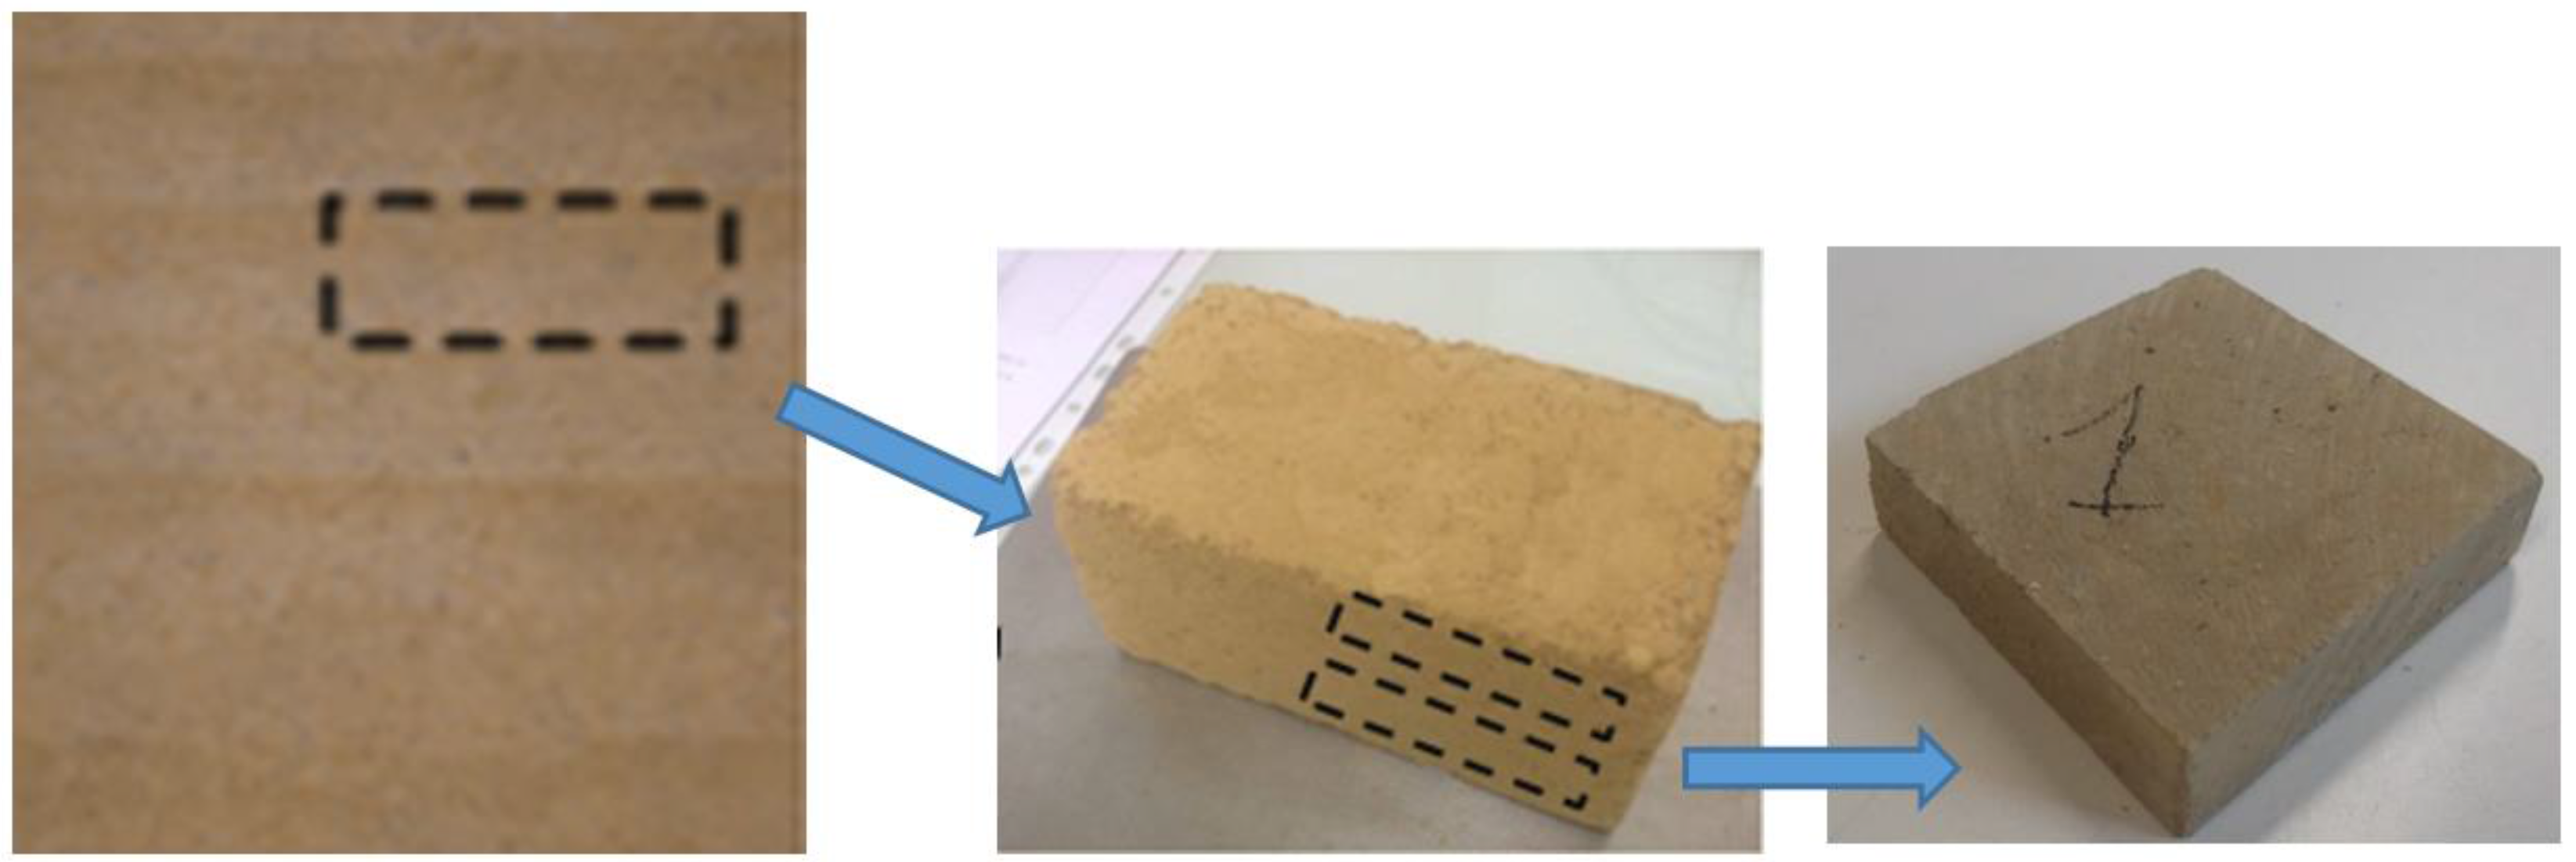
5.2. Rebound Hammer Tests on RE Specimens

Due to the difference in density within an earthen layer, different rebound hammer tests were carried out at three different heights of an earthen layer. For each height, three tests were performed (Figure 7). Therefore, there were nine results for a layer. Three layers were tested. The hammer was in a horizontal position during the test, similar to the way of the control on a real wall. The moisture content at the moment of the tests was about 2%, which was determined after the tests.
Figure 7 shows that the classical Schmidt hammer was too strong for a low strength material such as rammed earth: impacts by the hammer caused visible marks on the RE specimen. Indeed, nowadays, special impact devices can be used for low strength concrete (about 5 MPa [30]), but this was not used for the present study because the scope was to use a current apparatus that could be easily applied in practice.

5.3. Predicting the Compressive Strength Following the Calibration Curve

Following the above calibration curve (Figure 5), the compressive strengths of the upper, middle, and bottom parts of an earthen layer were of 5.1 ± 0.4, 2.2 ± 0.1, and 1.2 ± 0.2 MPa, respectively.
Following the theory of strength of materials, if the above specimens are tested under a uniaxial compression test, the compressive strength will be equal to the lowest value of the layers [1]. Therefore, it is expected that the compressive strength of the specimens is 1.2 ± 0.1 MPa. This value will be verified by experiments presented in the next section.
On the other hand, the density variation in RE was also evaluated by taken specimens (10 cm × 10 cm × 3.5 cm) at several positions of an earthen layer: upper part, middle part, and lower part. However, the specimens at the bottom, close to the interface, could not be extracted because they were too brittle [33]; that was why only the dry densities of the specimens taken at the upper and middle parts were determined (Figure 8). To extract the specimens from an RE wall, firstly big earthen blocks (about of 36 cm × 36 cm × 25 cm, at the middle of Figure 8) were taken by using a saw; then, a specific saw was used to cut the big block into small earthen blocks (Figure 8 on the right).
The specimens from the upper part were taken at 1 cm from the top of the earthen layer (Figure 8), where the compaction was greater during the manufacturing compared to that of the bottom parts; the mean dry density measured on four specimens was of 1864 ± 51 kg/m3. The mean dry density measured on three specimens taken at the middle of the layer was of 1703 ± 45 kg/m3.
By comparing qualitatively the rebound numbers obtained on the compressive earth blocks tested for the calibration curve, which had dry density (1800 kg/m3) similar to that of the upper and middle parts, the rebound numbers were comparable, which showed that the density is an important factor on the result of the rebound number. This remark is logical because the density has an important role on the surface hardness, which is dominant for the rebound number results. Furthermore, this result showed the first validation of the approach proposed and the calibration curve obtained.

5.4. The Compressive Strength of RE Specimens Following Uniaxial Compression Tests

Three prismatic specimens were tested in uniaxial compression tests (Figure 9) after one month cured under ambient conditions (25 °C and 60% RH). The moisture content at the moment of the test was 2–3%. The mean compressive strength obtained was 1.15 ± 0.10 MPa. This result was close to that predicted by rebound hammer tests (1.2 ± 0.1 MPa), the difference was less than 5%, which showed the relevancy of the prediction.

6. Conclusions and Prospects

This paper presents an exploratory study that used the well-known rebound hammer test to estimate the compressive strength of RE material. Due to the unavailability of a calibration curve for RE material, the first part of the study was dedicated to the establishment of a calibration curve, by using two different soils and two different types of specimen. The obtained calibration curve was applied to predict the compressive strength of prismatic RE specimens. These RE specimens were then tested under uniaxial compression tests. The compressive strength obtained by uniaxial compressive tests was close to that obtained in rebound hammer tests on lower parts of the earthen layer. This result is logical when the inhomogeneity of RE material is taken into account. Therefore, by using the calibration curve obtained in the present study, the rebound hammer test may be a simple way to predict the compressive strength of in-situ RE walls. In further studies, it will be interesting to confirm the results obtained in the present study with a higher number of specimens and on other soils.

Acknowledgments

The author wishes to thank L. Teitu, M. Jaffre, R. El-Nabouch, and T. Goldin for their assistance during the experiments. This work was financially supported by Vietnam’s National Foundation for Science and Technology Development (NAFOSTED) with Project code 107.01-2017.21.

Conflicts of Interest

The author declares no conflict of interest.

References

  1. Bui, Q.B.; Morel, J.C.; Hans, S.; Meunier, N. Compression behaviour of nonindustrial materials in civil engineering by three scale experiments: the case of rammed earth. Mater. Struct. 2009, 42, 1101–1116. [Google Scholar] [CrossRef]
  2. Walker, P.; Keable, R.; Martin, J.; Maniatidis, V. Rammed Earth-Design and Construction Guidelines; BRE Bookshop, IHS BRE Press: Watford, UK, 2005. [Google Scholar]
  3. Minke, G. Building with Earth: Design and Technology of a Sustainable Architecture; Birkhäuser Architecture: Basel, Switzerland, 2012. [Google Scholar]
  4. Morel, J.C.; Mesbah, A.; Oggero, M.; Walker, P. Building houses with local materials: Means to drastically reduce the environmental impact of construction. Build. Environ. 2001, 36, 1119–1126. [Google Scholar] [CrossRef]
  5. Reddy, B.V.V.; Kumar, P.P. Embodied energy in cement stabilised rammed earth walls. Energy Build. 2010, 42, 380–385. [Google Scholar] [CrossRef]
  6. Soudani, L.; Fabbri, A.; Morel, J.C.; Woloszyn, M.; Chabriac, P.A.; Wong, H.; Grillet, A.C. Assessment of the validity of some common assumptions in hygrothermal modelling of earth based materials. Energy Build. 2016, 116, 498–511. [Google Scholar] [CrossRef]
  7. Paul, W.L.; Taylor, P.A. A comparison of occupant comfort and satisfaction between a green building and a conventional building. Building Environ. 2008, 43, 1858–1870. [Google Scholar] [CrossRef]
  8. Taylor, P.; Luther, M.B. Evaluating rammed earth walls: A case study. Sol. Energy 2004, 76, 79–84. [Google Scholar] [CrossRef]
  9. Bui, Q.B.; Morel, J.C.; Reddy, B.V.V.; Ghayad, W. Durability of rammed earth walls exposed for 20 years to natural weathering. Build. Environ. 2009, 44, 912–919. [Google Scholar] [CrossRef]
  10. Jaquin, P. Influence of Arabic and Chinese Rammed Earth Techniques in the Himalayan Region. Sustainability 2012, 4, 2650–2660. [Google Scholar] [CrossRef]
  11. Maniatidis, V.; Walker, P. Structural capacity of rammed earth in compression. J. Mater. Civ. Eng. 2008, 20, 230–238. [Google Scholar] [CrossRef]
  12. Bui, Q.B.; Morel, J.C. Assessing the anisotropy of rammed earth. Constr. Build. Mater. 2009, 23, 3005–3011. [Google Scholar] [CrossRef]
  13. Bui, Q.B.; Morel, J.C.; Hans, S.; Walker, P. Effect of moisture content on the mechanical characteristics of rammed earth. Constr. Build. Mater. 2014, 54, 163–169. [Google Scholar] [CrossRef]
  14. Cheah, J.S.J.; Walker, P.; Heath, A.; Morgan, T.K.K.B. Evaluating shear test methods for stabilised rammed earth. Constr. Mater. 2012, 165, 325–334. [Google Scholar] [CrossRef] [Green Version]
  15. Jaquin, P.A.; Augarde, C.E.; Gallipoli, D.; Toll, D.G. The strength of unstabilised rammed earth materials. Géotechnique 2009, 59, 487–490. [Google Scholar] [CrossRef] [Green Version]
  16. Champiré, F.; Fabbri, A.; Morel, J.C.; Wong, H.; McGregor, F. Impact of relative humidity on the mechanical behavior of compacted earth as a building material. Constr. Build. Mater. 2016, 110, 70–78. [Google Scholar] [CrossRef]
  17. Hall, M.; Djerbib, Y. Rammed earth sample production: context, recommendations and consistency. Constr. Build. Mater. 2004, 18, 281–286. [Google Scholar] [CrossRef]
  18. Arrigoni, A.; Beckett, C.; Ciancio, D.; Dotelli, G. Life cycle analysis of environmental impact vs. durability of stabilised rammed earth. Constr. Build. Mater. 2017, 142, 128–136. [Google Scholar] [CrossRef]
  19. Allinson, D.; Hall, M. Hygrothermal analysis of a stabilised rammed earth test building in the UK. Energy Build. 2010, 42, 845–852. [Google Scholar] [CrossRef]
  20. McGregor, F.; Heath, A.; Maskell, D.; Fabbri, A.; Morel, J.C. A review on the buffering capacity of earth building materials. Constr. Mater. 2015, 169, 241–251. [Google Scholar] [CrossRef] [Green Version]
  21. Taylor, P.; Fuller, R.J.; Luther, M.B. Energy use and thermal comfort in a rammed earth office building. Energy Build. 2008, 40, 793–800. [Google Scholar] [CrossRef]
  22. El-Nabouch, R.; Bui, Q.B.; Plé, O.; Perrotin, P. Assessing the in-plane seismic performance of rammed earth walls by using horizontal loading tests. Eng. Struct. 2017, 145, 153–161. [Google Scholar] [CrossRef]
  23. Bui, Q.B.; Bui, T.T.; Limam, A. Seismic assessment of rammed earth walls using pushover tests. Cogent Eng. 2016, 3, 1200835. [Google Scholar] [CrossRef]
  24. Bui, Q.B.; Morel, J.C.; Hans, S.; Do, A.-P. First exploratory study on dynamic characteristics of rammed earth buildings. Eng. Struct. 2011, 33, 3690–3695. [Google Scholar] [CrossRef]
  25. Miccoli, L.; Drougkas, A.; Müller, U. In-plane behaviour of rammed earth under cyclic loading: Experimental testing and finite element modelling. Eng. Struct. 2016, 125, 144–152. [Google Scholar] [CrossRef]
  26. Lombillo, I.; Villegas, L.; Fodde, E.; Thomas, C. In situ mechanical investigation of rammed earth: Calibration of minor destructive testing. Constr. Build. Mater. 2014, 51, 451–460. [Google Scholar] [CrossRef]
  27. Bui, Q.B.; El-Nabouch, R.; Perrotin, P.; Plé, O. Assessing a nondestructive method to determine the Young’s modulus of rammed earth material. In Proceedings of the 6th BIOT Conference on Poromechanics, Paris, France, 10–13 July 2017; ASCE: Reston, VA, USA, 2017. [Google Scholar]
  28. Khadka, B.; Shakya, M. Comparative compressive strength of stabilized and un-stabilized rammed earth. Mater. Struct. 2016, 49, 3945–3955. [Google Scholar] [CrossRef]
  29. Liang, R.; Hota, G.; Lei, Y.; Li, Y.; Stanislawski, D.; Jiang, Y. Nondestructive Evaluation of Historic Hakka Rammed Earth Structures. Sustainability 2013, 5, 298–315. [Google Scholar] [CrossRef]
  30. Proceq. Silver Schmidt Operating Instructions; Proceq: Schwerzenbach, Switzerland, 2017; p. 32. [Google Scholar]
  31. Szilagyi, K.; Borosnyoi, A.; Zsigovics, I. Understanding the rebound surface hardness of concrete. J. Civ. Eng. Manag. 2015, 21, 185–192. [Google Scholar] [CrossRef]
  32. Bui, Q.B.; Hans, S.; Morel, J.C. The compressive strength and pseudo elastic modulus of rammed earth. In Proceedings of the International Symposium on Earthen Structures, Bangalore, India, 22–24 August 2007; Interline Publishers: Bengaluru, India, 2007; pp. 217–223. [Google Scholar]
  33. El-Nabouch, R.; Bui, Q.B.; Perrotin, P.; Plé, O. Experimental and numerical studies on cohesion and friction angle of rammed earth material. In Proceedings of the 6th BIOT Conference on Poromechanics, Paris, France, 10–13 July 2017; ASCE: Reston, VA, USA, 2017. [Google Scholar]
  34. Eurocode 2. EN 1992: Design of Concrete Structures; European Committee for Standardization: Brussels, Belgium, 2004. [Google Scholar]
  35. Aubert, J.E.; Maillard, P.; Morel, J.C.; Al Rafii, M. Towards a simple compressive strength test for earth bricks? Mater. Struct. 2016, 49, 1641–1654. [Google Scholar] [CrossRef]
  36. European Standard. EN 772-1: Methods of Test for Masonry Units—Part 1: Determination of Compressive Strength; European Committee for Standardization: Brussels, Belgium, 2000. [Google Scholar]
Figure 1. A school with RE walls, recently constructed in France, Architect: V. Rigassi.
Sustainability 09 01904 g001
Figure 2. The original Schmidt series NR/LR (photo: Gilson company).
Sustainability 09 01904 g002
Figure 3. Inhomogeneity of a rammed-earth (RE) wall.
Sustainability 09 01904 g003
Figure 4. The relationship between compressive strength and rebound number for CEBs and soil–concrete specimens, from Soils A and B.
Sustainability 09 01904 g004
Figure 5. Calibration curve for the relationship between compressive strength and rebound number.
Sustainability 09 01904 g005
Figure 6. Prismatic specimen manufactured from Soil A, surfaced with a lime mortar.
Sustainability 09 01904 g006
Figure 7. Number of horizontal rebounds with a Schmidt hammer.
Sustainability 09 01904 g007
Figure 8. A specimen taken from the upper part of an earthen layer [33].
Sustainability 09 01904 g008
Figure 9. A specimen after the uniaxial compression test.
Sustainability 09 01904 g009
Table 1. Composition of the soil used in this study (in weight).
SoilClaySiltSandGravel
Soil A19%65%16%0%
Soil B5%51%33%11%

