Article

Energy Performance Indicators in the Swedish Building Procurement Process

Department of Applied Physics and Electronics, Umeå University, 901 87 Umeå, Sweden
*
Author to whom correspondence should be addressed.
Sustainability 2017, 9(10), 1877; https://doi.org/10.3390/su9101877
Submission received: 15 September 2017 / Revised: 12 October 2017 / Accepted: 13 October 2017 / Published: 19 October 2017
(This article belongs to the Section Energy Sustainability)

Abstract

:
In Sweden, all new buildings need to comply with the National Board of Housing, Building and Planning’s requirement on specific purchased energy (kWh/m2). Accordingly, this indicator is often used to set design criteria in the building procurement process. However, when energy use is measured in finished buildings, the measurements often deviate significantly from the design calculations. The measured specific purchased energy does not necessarily reflect the responsibility of the building contractor, as it is influenced by the building operation, user behavior and climate. Therefore, Swedish building practitioners may prefer other indicators for setting design criteria in the building procurement process. The aim of this study was twofold: (i) to understand the Swedish building practitioners’ perspectives and opinions on seven building energy performance indicators (envelope air leakage, U-values for different building parts, average U-value, specific heat loss, heat loss coefficient, specific net energy, and specific purchased energy); and (ii) to understand the consequences for the energy performance of multi-family buildings of using the studied indicators to set criteria in the procurement process. The study involved a Delphi approach and simulations of a multi-family case study building. The studied indicators were discussed in terms of how they may meet the needs of the building practitioners when used to set building energy performance criteria in the procurement process.

1. Introduction

Global energy use is continuously increasing, causing concerns for the future in terms of climate impacts and resource depletion [1]. Building energy consumption represents about 24% of the global final energy use, while its share is even higher in USA and EU (40% and 37%, respectively) [1]. National building energy performance criteria are used to limit building energy use and ensure a certain energy performance in new buildings. Energy performance criteria in national building regulations have been the topic of many recent studies [2,3,4,5,6]. Casals [7] found that the indicator implemented to assess building energy performance is an important factor in reaching the objectives of building regulation and certification schemes in Europe. Many building codes and criteria for low-energy buildings in the European countries use an indicator of energy use to set criteria on energy performance [8,9,10,11,12]. From a macro perspective, energy use may be a useful indicator for monitoring building energy performance and assessing whether national energy use reduction targets are achieved. However, measurements of energy use in occupied buildings often deviate significantly from design calculations [13,14,15,16]. These deviations may be due to uncertainties in the design calculations, since calculations rely on a mathematical representation of the buildings based on assumptions, approximations, and simplifications [17]. However, the deviations may also be due to uncertainties in the measured data. Besides the uncertainties of the measurement method itself, unintended operation or unexpected user behavior and climate during the measurement period may cause measurements to deviate from the design calculations [17,18,19,20,21]. Due to the many possible causes for deviations in the follow up measurements from design criteria, it may be challenging to identify the origin of the deviations and fix the responsibility between the building entrepreneur and the client in the building procurement process. Thus, the building contractor may be forced to take responsibility for deviations caused by unintended building operation or unexpected user behavior during the measurement period.
In Sweden, the National Board of Housing, Building and Planning (Boverket) is the government organization responsible for regulating the energy performance of buildings. The building regulation document (BBR) [22] is Boverket’s most important tool for this purpose. BBR contains several building performance criteria, applicable to new buildings and major renovations of existing buildings. The main indicator used to set energy performance criteria in BBR is the specific purchased energy (kWh/m2) [22]. The specific purchased energy is defined as the energy supplied to the building’s technical installations for building services and energy system, normalized by the floor area heated above 10 °C. Supplied energy use for space heating, domestic hot water, and facility appliances is included, but not the energy for household appliances. Additionally, only the supplied energy that the building owner has to pay for is included (not “free” energy such as solar or geothermal). According to BBR, final compliance with the specific purchased energy criteria should be verified through measurements [22]. For design phase verifications, BBR recommends the use of standardized input data (average values based on surveys and measurements) for climate, building operation, and user behavior from the Swedish program for standardizing and verifying energy performance in buildings (SVEBY) [23]. However, uncertainty and lack of detail in the standardized input data may lead to arbitrary calculation results [24] and deviations from the average values for building operation and user behavior during the measurements may cause deviating results. Therefore, verifying compliance with criteria on the specific purchased energy may pose methodological challenges [25]. For this reason, Swedish building practitioners may prefer to use alternative indicators to the specific purchased energy for setting design criteria on energy performance in the building procurement process [26,27].
In this paper, we study the possibilities of using seven indicators (envelope air leakage, U-values for different building parts, average U-value, specific heat loss, heat loss coefficient, specific net energy, and specific purchased energy) to set energy performance criteria in the Swedish building procurement process. The objective was to determine if the studied indicators may meet the needs of the Swedish building practitioners in the procurement process of multi-family buildings. The “building practitioners” in this context was defined as people with practical experience of working with building energy performance criteria in the procurement process, employed either within construction companies, property management companies or within municipalities. The aim of this study was twofold: (i) to understand the Swedish building practitioners’ perspectives and opinions on the studied indicators; and (ii) to understand the consequences for the energy performance of multi-family buildings of using the studied indicators to set criteria in the procurement process.

2. Method

The study was conducted in two parts. In the first part, the perspectives and opinions of Swedish building practitioners on energy performance design criteria in the building procurement process was studied. For questions requiring expert judgment, individual opinions (studied, e.g., through interviews) have been found inferior to expert opinions developed in a group process [28]. The Delphi approach is an established and well used group process approach [29,30,31,32,33,34], developed by Olaf Helmer and Norman Dalkey in 1963 [35]. Therefore, the Delphi approach was used to conduct the first part of the study, discerning the collective opinion of the building practitioners instead of studying their individual opinions. Although a few issues have been identified with the Delphi method [36,37], it has an advantage compared to other group process approaches of not requiring the experts to meet physically [28]. The Delphi method also promotes learning among the panel members [38], which is beneficial when the panel members have different experiences on the topic. A further description of the Delphi methodology can be found in Section 2.1.
In the second part of the study, the indicators sensitivity to changes in 15 input parameters was studied. To understand the consequences for the energy performance of multi-family buildings of using the studied indicators in the Swedish procurement process, a four-story multifamily case study building was used. Since the input data for the parameters needed to be easy to vary, the performance of the case study building was evaluated through calculations and not through measurements. A further description of the method used for the case study simulations can be found in Section 2.2. Finally, the studied indicators were discussed in terms of how they met the building practitioners’ needs when used to set energy performance criteria in the Swedish building procurement process. A flowchart describing the method used in this paper is presented in Figure 1.

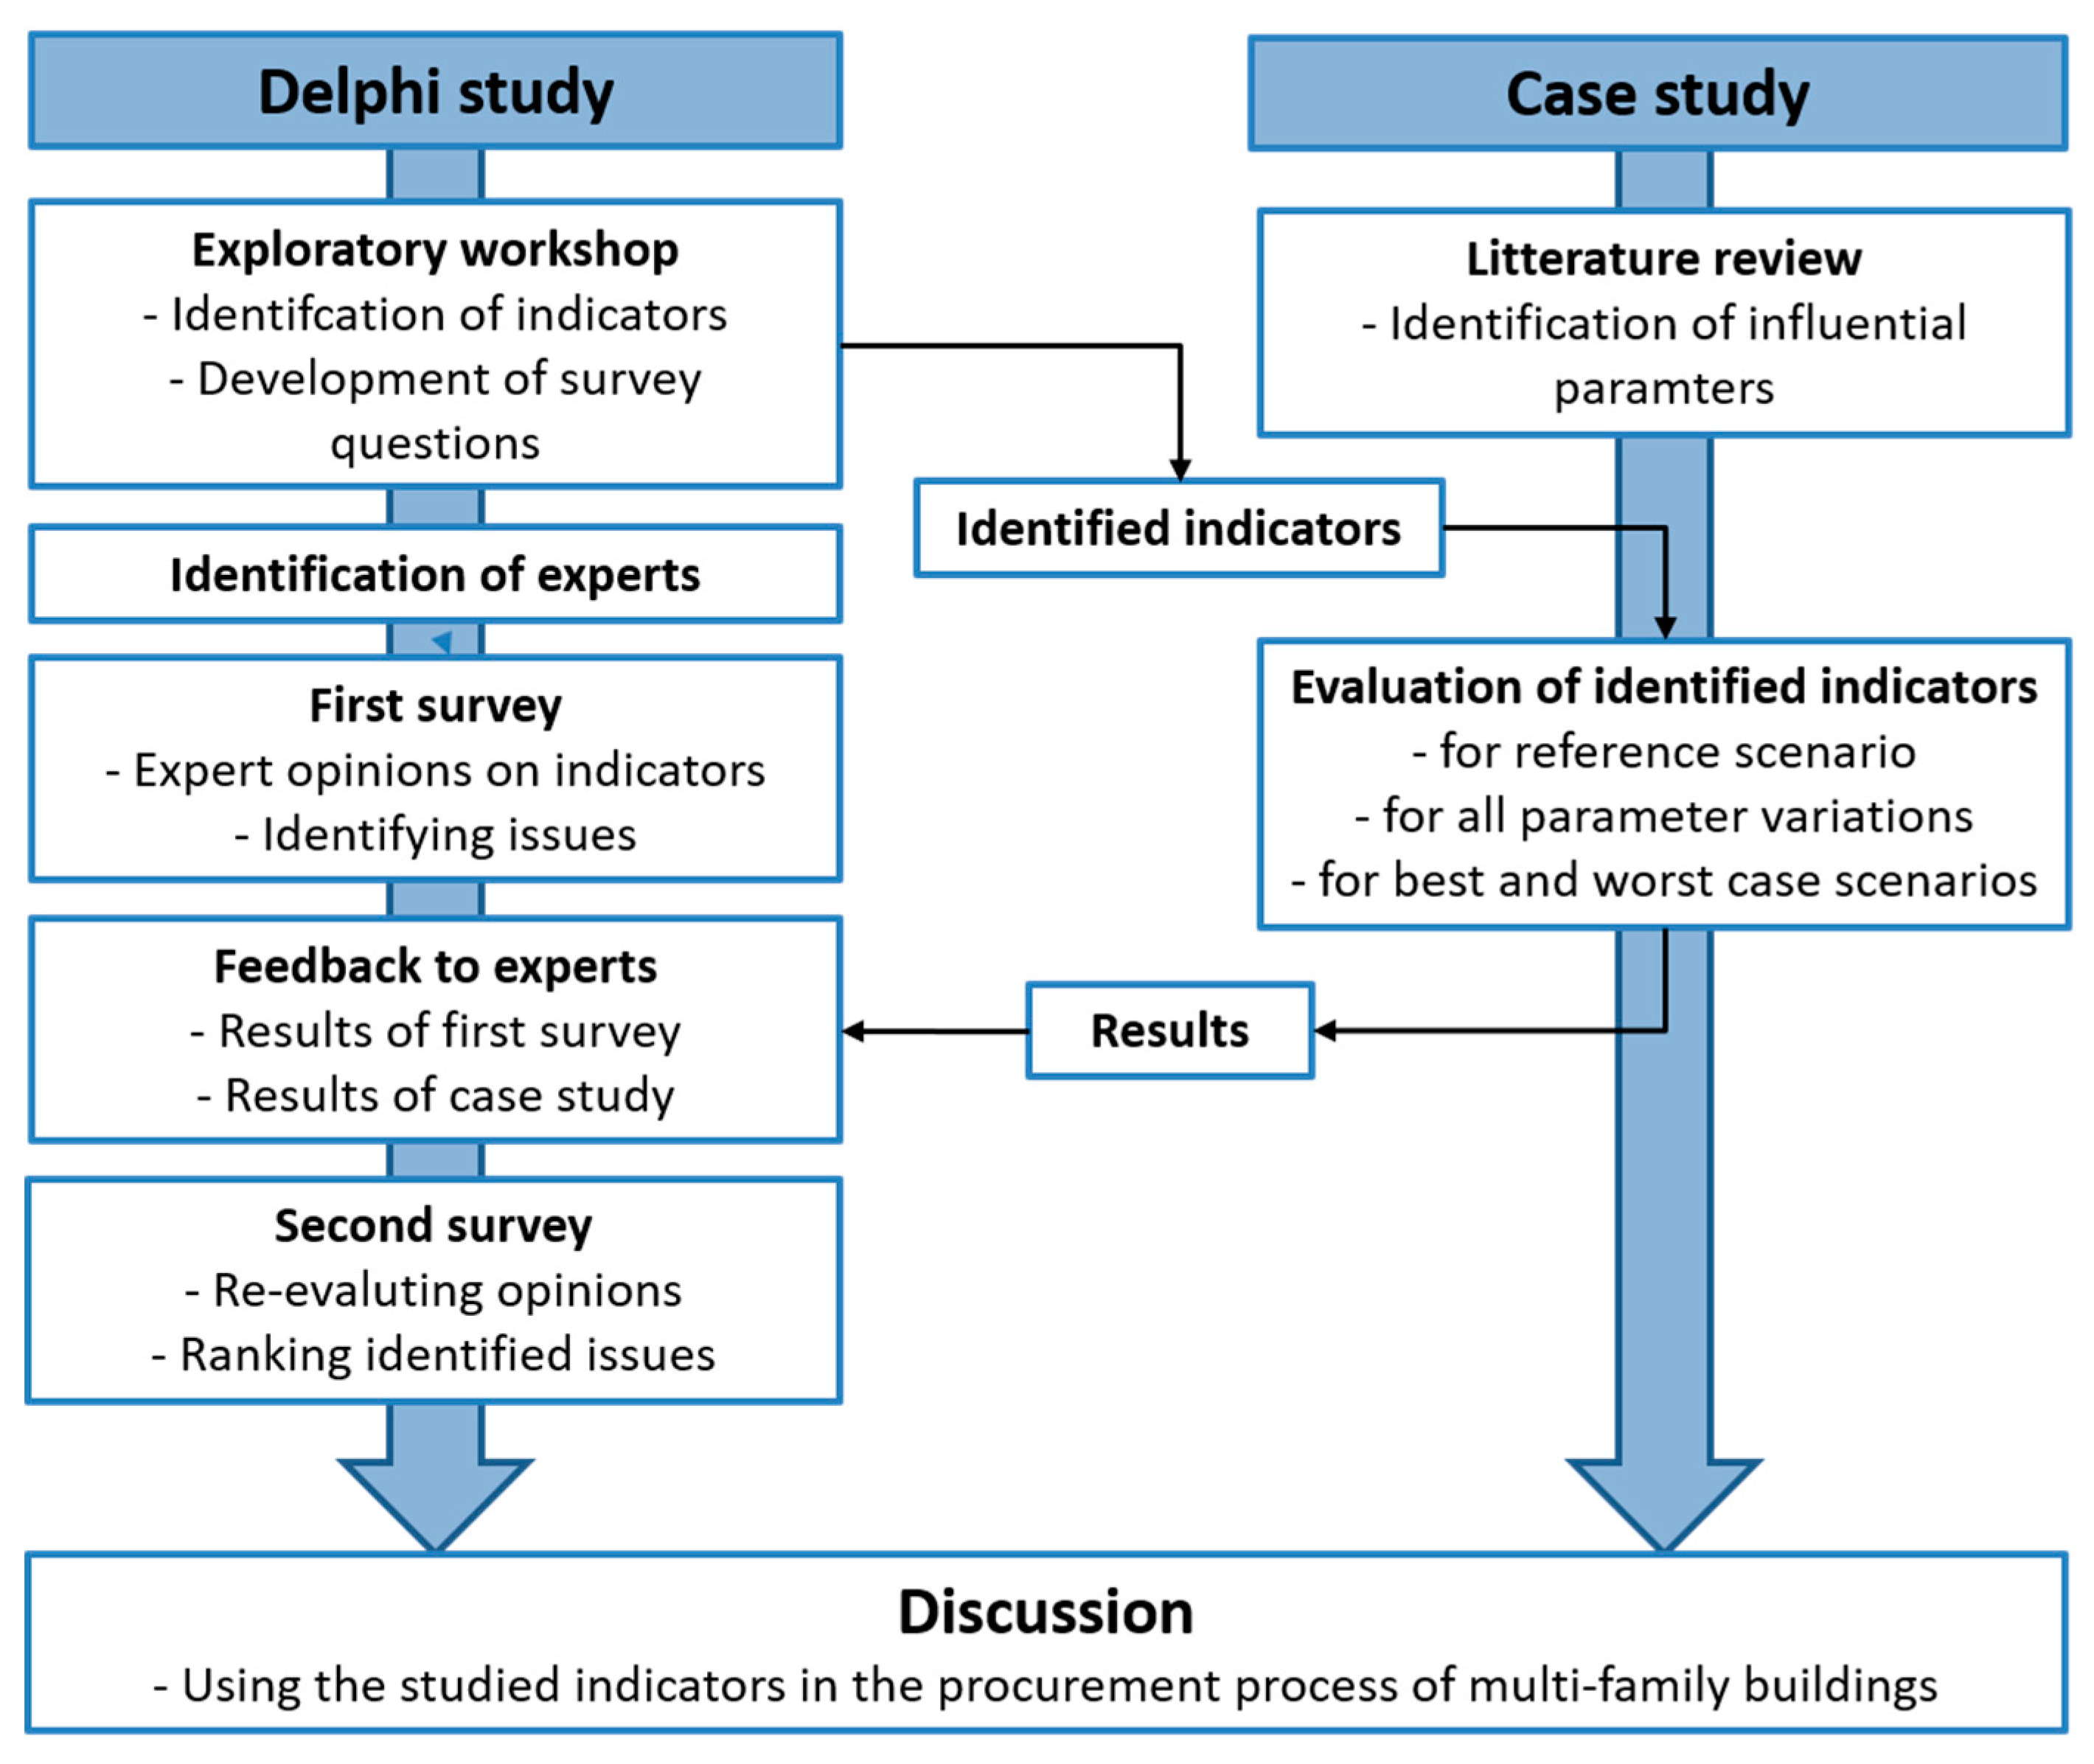
2.1. Delphi Methodology

The generic aim of the Delphi method is “to determine, predict and explore group attitudes, needs and priorities” [37]. The results of a Delphi study may provide a “snapshot of expert opinion, for that group, at a particular time, which can be used to inform thinking, practice and theory” [37]. Limstone and Turoff [39] define the Delphi method as “a method for structuring a group communication process so that the process is effective in allowing a group of individuals, as a whole, to deal with a complex problem.” They also point out that the method requires “some feedback of individual contributions of information and knowledge; some assessment of the group judgment or view; some opportunity for individuals to revise views; and some degree of anonymity for the individual responses”. However, the specifics of these elements should be tailored to the application and the participating group [33]. The procedure of a Delphi study can be summarized as the following. Researchers (1) design a survey soliciting data which can be both qualitative and quantitative; (2) select the appropriate group of experts to answer the questions; (3) administer the survey; (4) analyze the results and provide feedback to the expert panel; and (5) design another survey based on the results and administer it, giving the experts an opportunity to change their responses and/or answer new questions [28]. The feedback and re-administration of surveys can be reiterated with different goals, e.g. until no further insights are gained or until a satisfactory degree of consensus is reached. A more detailed description of the Delphi method can be found in [39].
In Delphi studies, results are arrived at based on group dynamics and knowledge transfer between the participants, rather than on statistical power [28]. Although the uncertainty in the results can be reduced and the reliability improved with increased size of the expert group [33], Johnson reports that [40] “...it has been found that average group error drops rapidly as the number in the Delphi group is increased to about eight to twelve. After reaching a number of about thirteen to fifteen, the average group error decreases very little with each additional member.” Because of the relatively small number of subjects in Delphi studies, a low response rate can affect the validity of the study [41]. Sacrificing questions and survey rounds is generally necessary in order to guarantee panel participation and continuity in Delphi studies [42]. Using primarily quantitative questions (with numerical answers) may also improve the response rate by reducing the time commitment [34], and the use of closed-ended questions has been recommended for the first round of Delphi studies [41]. Frewer et al. [34] recommend an exploratory workshop to refine the questions in round one, involving a few key stakeholder or experts in the area of consideration. Such pilot application studies may improve the precision and comprehension of the questionnaire [42]. Any difficulties in managing and motivating the panel of experts, as well as in administrating the study may also be calibrated [42].

Application of the Delphi Methodology in this Study

In this study, a modified Delphi method as defined by Keeney [43] was used in combination with some characteristic of a ranking type Delphi method [44]. As suggested by Frewer et al. [34], an exploratory workshop was held with a few of the identified building practitioners to determine the focus of the first survey round of the Delphi study, test a possible set of questions, and identify relevant indicators to study. Based on the discussion and feedback at the exploratory workshop, the questions for the first survey were formulated and the following seven indicators that may be used to set energy performance design criteria in the building procurement process were identified:
I1.
the envelope air leakage @ 50 Pa (L/sm2);
I2.
U-values for different building parts (W/m2K);
I3.
the average U-value of the building envelope (W/m2K);
I4.
the specific heat loss through heat transfer, ventilation, and air leakage at the winter outdoor design temperature as defined by the Swedish Centre for Zero-energy [45] (henceforth SHLWDT) (W/m2K);
I5.
the heat loss coefficient including heat loss through ventilation, air leakage, and heat transfer towards the outdoor air, but not towards the ground (henceforth L) (kWh/°C);
I6.
the specific net energy need for space heating, domestic hot water, and facility appliances per heated floor area (not including any energy production conversion losses or heat losses within the house premise) (kWh/m2); and
I7.
the specific purchased energy for space heating, domestic hot water, and facility appliances supplied to the building’s technical installations for building services and energy system, per heated floor area (not including “free” energy such as solar or geothermal) [22] [kWh/m2].
To identify the experts for the Delphi panel, a “cascade” methodology was used, which has been reported to increase the response rate [34]. This means that the researchers first identified building practitioners within their personal contacts and then asked them to nominate additional experts. Initially, 18 building practitioners were identified and invited to participate in the Delphi study. The number of participants who completed the first and second survey rounds was 16 and 15, respectively. Of these, 10 were employed at construction companies or associated organizations for construction companies, 3 were employed at property management companies and 2 were employed at a municipality. All respondents had more than 1 year of experience in the field of energy and buildings, and approximately 55% had more than 10 years of experience. Since Delphi studies may require a big time-commitment from the participants, employees at construction and property management companies may be discouraged from participating. To reduce the time commitment required of the participants, thereby increasing the response rate, the study was limited to two rounds conducted during 2016. The organizational affiliation of the experts may influence the results of the Delphi study. The final distribution of experts between construction company employees, property management company employees, and municipality employees is therefore a possible restriction of this study.
The first survey consisted of 17 questions. A set of close-ended questions was used to study how the building practitioners preferred energy performance criteria to be set and verified in the building procurement process (including ranking the 7 indicators). For these close-ended questions, a seven-point Likert scale, multiple choices, and ranking ratings from 1 to 3 were used. A set of open ended questions were used to identify issues when the specific purchased energy (I7) was used to set energy performance criteria in the building procurement process, experienced by the building practitioners. The open-ended questions were particularly requested by a few of the participants of the initial workshop, but were limited to 5 in order to increase the response rate. The respondents’ answers were kept anonymous to the other panel group members. As requested in the exploratory workshop, the first round of the Delphi study was performed through personal visits to the panel members’ organizations by the researchers. The survey questions were sent out in advance to the participating building practitioners and discussed in “mini focus groups” during the researchers visit to each organization, providing clarifications of the questions if needed. The surveys were then answered individually. The first survey identified several issues experienced by the building practitioners when the specific purchased energy was used to set energy performance criteria in the building procurement process. The identified issues were divided into four categories: (i) requirements on specific purchased energy; (ii) uncertainty and responsibility; (iii) the verification method; and (iv) parameters influencing the specific purchased energy.
For the second round of the Delphi study, the respondents were provided with average values for the Likert scales and the distribution of answers for the multiple-choice questions and rankings in the first survey. The identified issues when specific purchased energy was used to set criteria in the building procurement process were also provided, along with representative comments for each question from the participants of the mini focus group discussions. As additional information, preliminary results from the case study were also presented (Section 3.2). In the second survey, the building practitioners were then asked to re-evaluate their opinions as well as rank the identified issues when specific purchased energy was used to set criteria in the building procurement process according to relevance/importance. The identified issues were ranked both within each of the four categories described above and by selecting the 5 overall most important/relevant issues. In the second survey, only closed ended questions were used. The building professionals were encouraged to comment on and/or motivate their response to each question. The comments presented in the results (Section 3.1) were translated by the authors from Swedish to English.

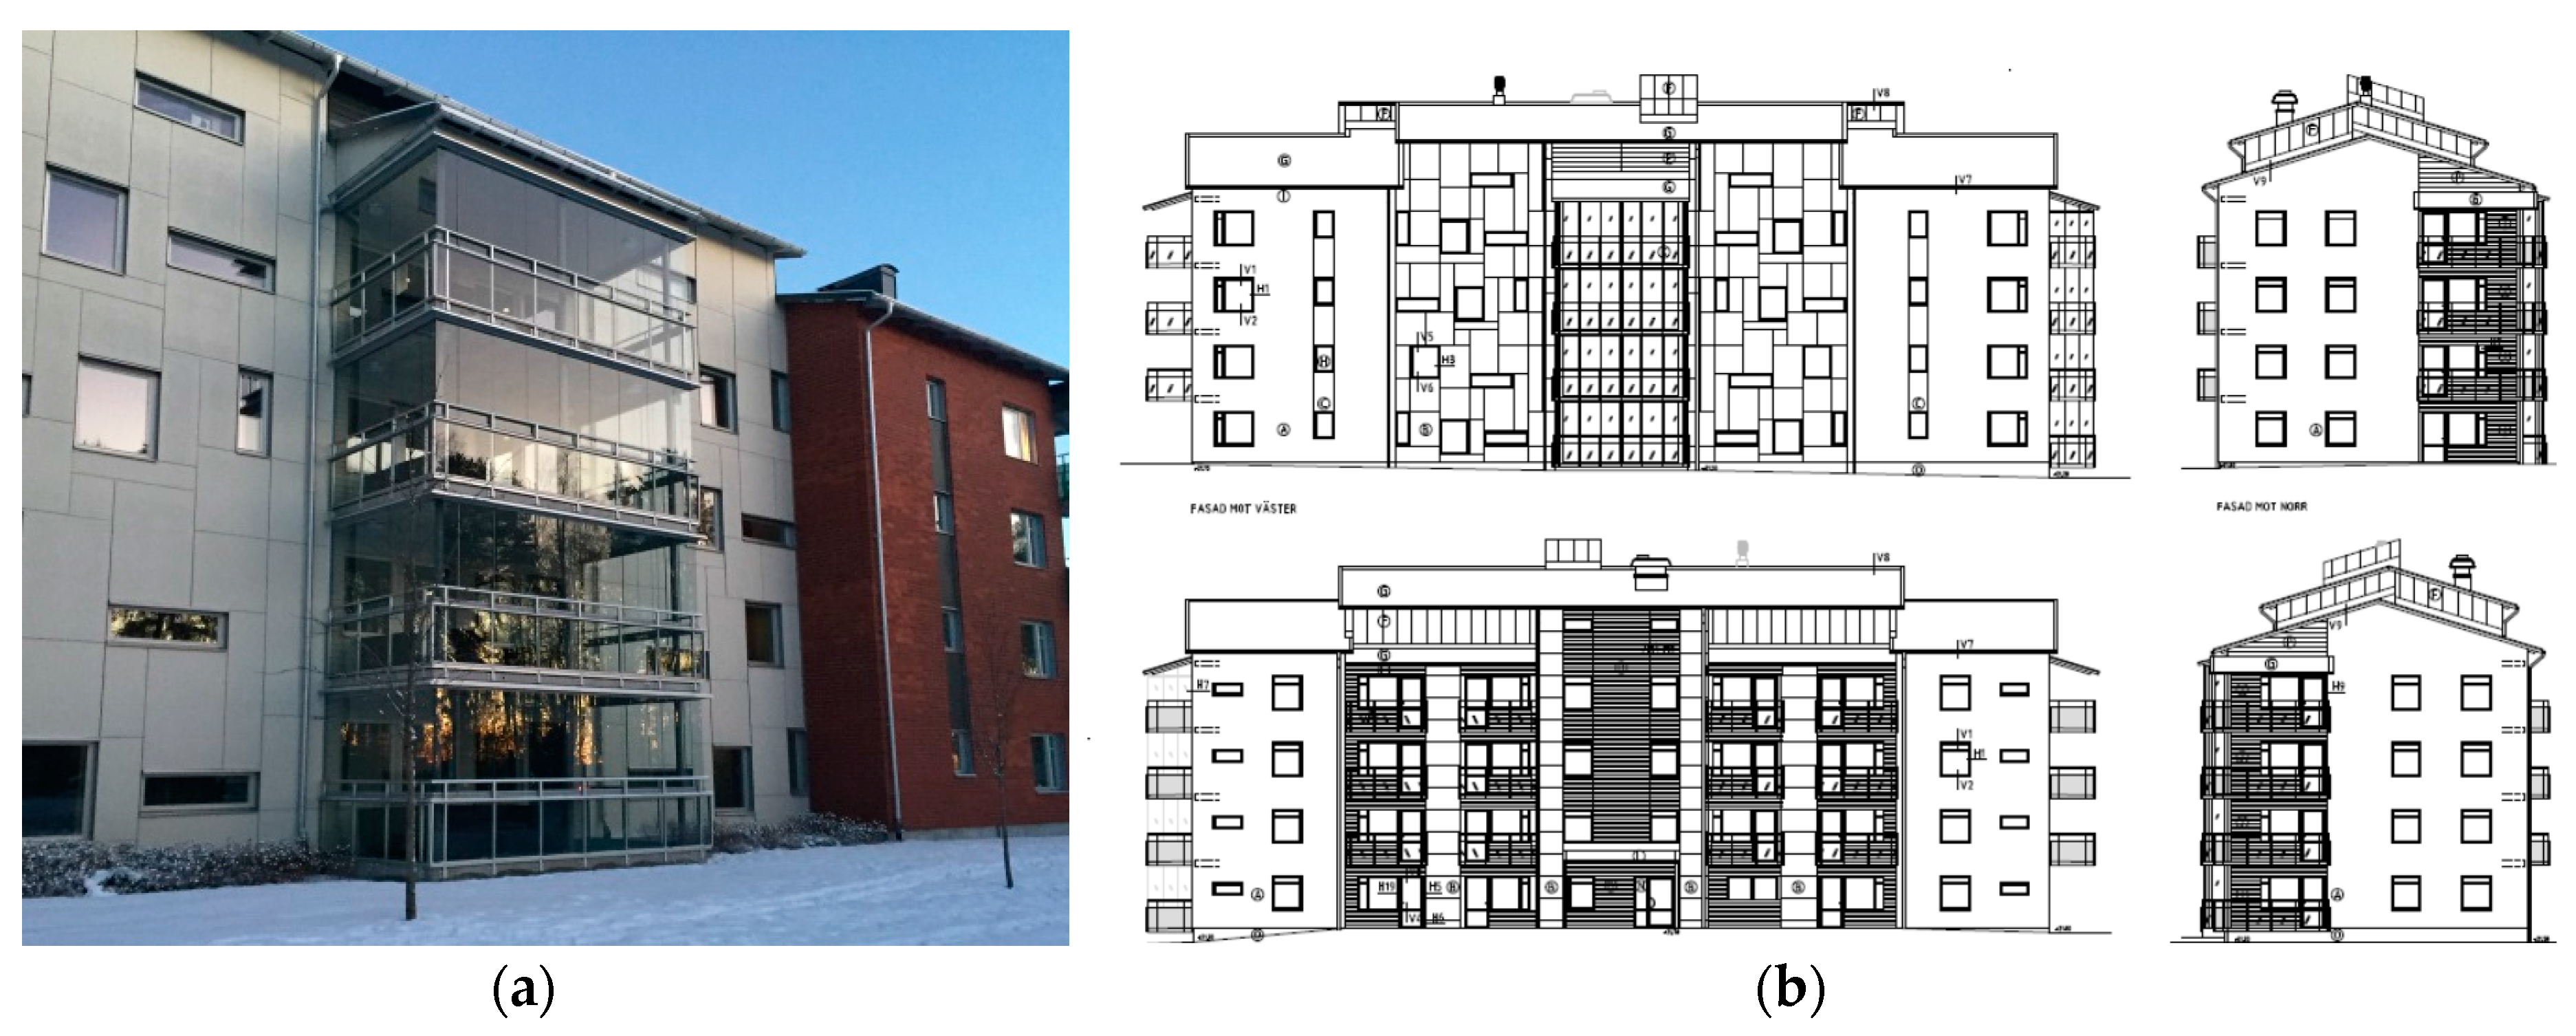
2.2. Case Study Methodology

A case study building was used to study the average U-value (I3), specific net energy (I6), specific purchased energy (I7), SHLWDT (I4), and L (I5). The U-values for different building parts (I2) and the average U-value (I3) were assumed to be influenced by the studied parameters in the same way. Therefore, only one of them was investigated in the case study. The envelope air leakage @ 50 Pa (I1) can only be verified through measurements and was therefore not included in the case study analysis. The indicators’ sensitivity to changes in 15 parameters (Table 1) was compared. The 15 parameters in Table 1 were related to five factors identified to influence building energy use: (i) external conditions (climate); (ii) the building envelope; (iii) technical installations for building services and energy system; (iv) building operation; and (v) user behavior [19]. The 15 parameters were chosen based on a literature review identifying them as the most influential parameters for the energy performance of residential buildings in cold climate. Accordingly, most of the parameters influencing the building energy performance were included in the analysis. Nevertheless, there could be other parameters that influence a building’s energy performance that are not included in the study, constituting a possible restriction of this study. The sensitivity of the studied energy performance indicators to the parameters in Table 1 was compared by varying the input data for the parameters individually from a reference scenario. The input data used for the reference scenario and the parameter variations are presented in Section 2.2.1 and Section 2.2.2, respectively.
Specific purchased energy (I7), specific net energy (I6), and average U-value (I3) were evaluated using the dynamic simulation tool IDA ICE [53]. IDA ICA has been validated with respect to both CEN and ASHRAE standards [54,55] and found to perform well in functional aspects compared to other building simulation programs [56]. A detailed description of IDA ICE can be found in [57].
The SHLWDT (I4) was evaluated according to Equation (1) by the Swedish Centre for Zero-energy buildings [45].
S H L W D T = H ( 21 W D T ) A f l o o r
where Afloor is the floor area heated above 10 °C (m2) and WDT is the winter outdoor design temperature as defined by the Swedish Centre for Zero-energy buildings [44], used to dimension the heating system for the building in its location (°C). H is the heat loss coefficient of the building envelope in W/K, calculated according to:
H = U a A e n c l + ρ c q l e a k + ρ c d q v e n t ( 1 ν )
where Ua is the average U-value of the building envelope (W/m2K), Aencl is the enclosing area of the building envelope (m2), ρ is the air density (kg/m3), c is the air heat capacity (kJ/kgK), qleak is the envelope air leakage calculated according to EN ISO 13789 [58] (L/s), d is the operation time ratio, and qvent is the system efficiency of the ventilation (which includes the temperature efficiency of ventilation heat exchangers, and unbalanced ventilation flows). The heat losses in the ventilation ducts were neglected. However, since they were neglected in all calculation of SHLWDT, this did not influence the comparison of the studied indicators.
L (I5) was evaluated using the energy signature method, an established and previously well studied linear regression approach to analyze measured daily energy data [59,60,61,62,63,64,65]. A detailed description of the energy signature method can be found in [66]. The measured data used for the linear regression should be from at least 1.5 months, but extending the measurement period to 3–4 months increases the robustness of the evaluation method [67]. If the envelope heat losses through heat transfer, ventilation, and air leakage are assumed to follow a linear regression, the heat balance for a building in cold climate can be expressed according to:
L ( T i T o ) + G + Q D H S = α Q S H + β Q H A + γ Q D H W + δ Q F A + Q S + Q O
where L is the heat loss coefficient of the building envelope excluding the foundation (kWh/°C). T i and T o are the indoor and outdoor temperatures (°C), respectively. G is the heat transfer from the foundation to the ground (kWh) and Q D H S is the dynamic heat storage in the building (kWh). Q S H is the net energy use of the space heating system (kWh), Q H A is the energy use for household appliances (kWh), Q D H W for domestic hot water preparation (kWh), and Q F A the energy use for facility appliances used for the buildings technical systems (kWh). α ,   β ,   γ and δ are gain factors, indicating the proportion of Q S H ,   Q H A , Q D H W and Q F A , respectively, contributing to the space heating.   Q S is the contribution to the space heating from solar radiation and Q O from the occupants.
In this study, L (I5) was evaluated by matching simulated energy data to the linear regression instead of measured data. For the simulated data, moving average values over eight days, a time period longer than the buildings’ time constant (ratio of the total heat that can be stored in the building to its heat transmittance), were used in the regression. Thus, the influence of the dynamic heat storage was eliminated. The influence of the solar heat gains was eliminated by using data from a three-month period around the winter solstice, when the solar radiation is negligible at the location of the case study building (Figure 2). However, for periods or climates with substantial solar radiation, the influence of the solar heat gains on L (I5) may be eliminated through additional pre-processing of the data used for the linear regression [67,68]. By pairing data points with high solar radiation with data points with low solar radiation [67,68], the variation in solar radiation may be significantly reduced and the solar heat gains considered constant (thus eliminating the influence of the solar heat gains on the gradient of the linear regression, L).
In the simulations, β Q H A , γ Q D H W , δ Q F A were evenly distributed for all outdoor temperatures. Thus, the internal heat gains from household appliances, domestic hot water, and facility appliances did not depend on the outdoor temperature. Therefore, they did not influence the gradient of the linear regression (L). Q O was evenly distributed throughout the year, but not throughout the day (since the occupants were simulated to be absent during working hours). However, any dependence of Q O on the outdoor temperature due to this variation was assumed to be negligible. Any heat losses from the heating system were assumed to contribute to the space heating, so that α = 1.
Thus, L (I5) could be determined by fitting the simulated energy and temperature data to a linear regression according to Equation (4):
L ( T i T o ) + m = Q S H
where m (kWh) is an offset determined by the heat loss to the ground and the temperature constant internal heat gains ( β Q H A , γ Q D H W , δ Q F A . and Q O ).
In practice, it may be easier to base the energy signature method’s linear regression on purchased energy than on net energy use, since measurements of purchased energy are required for billing purposes and therefore generally more available. To study the consequences of evaluating L based on purchased energy, the linear regression according to Equation (4) was therefore based on simulated data for the buildings purchased energy use instead of the simulated net energy need.

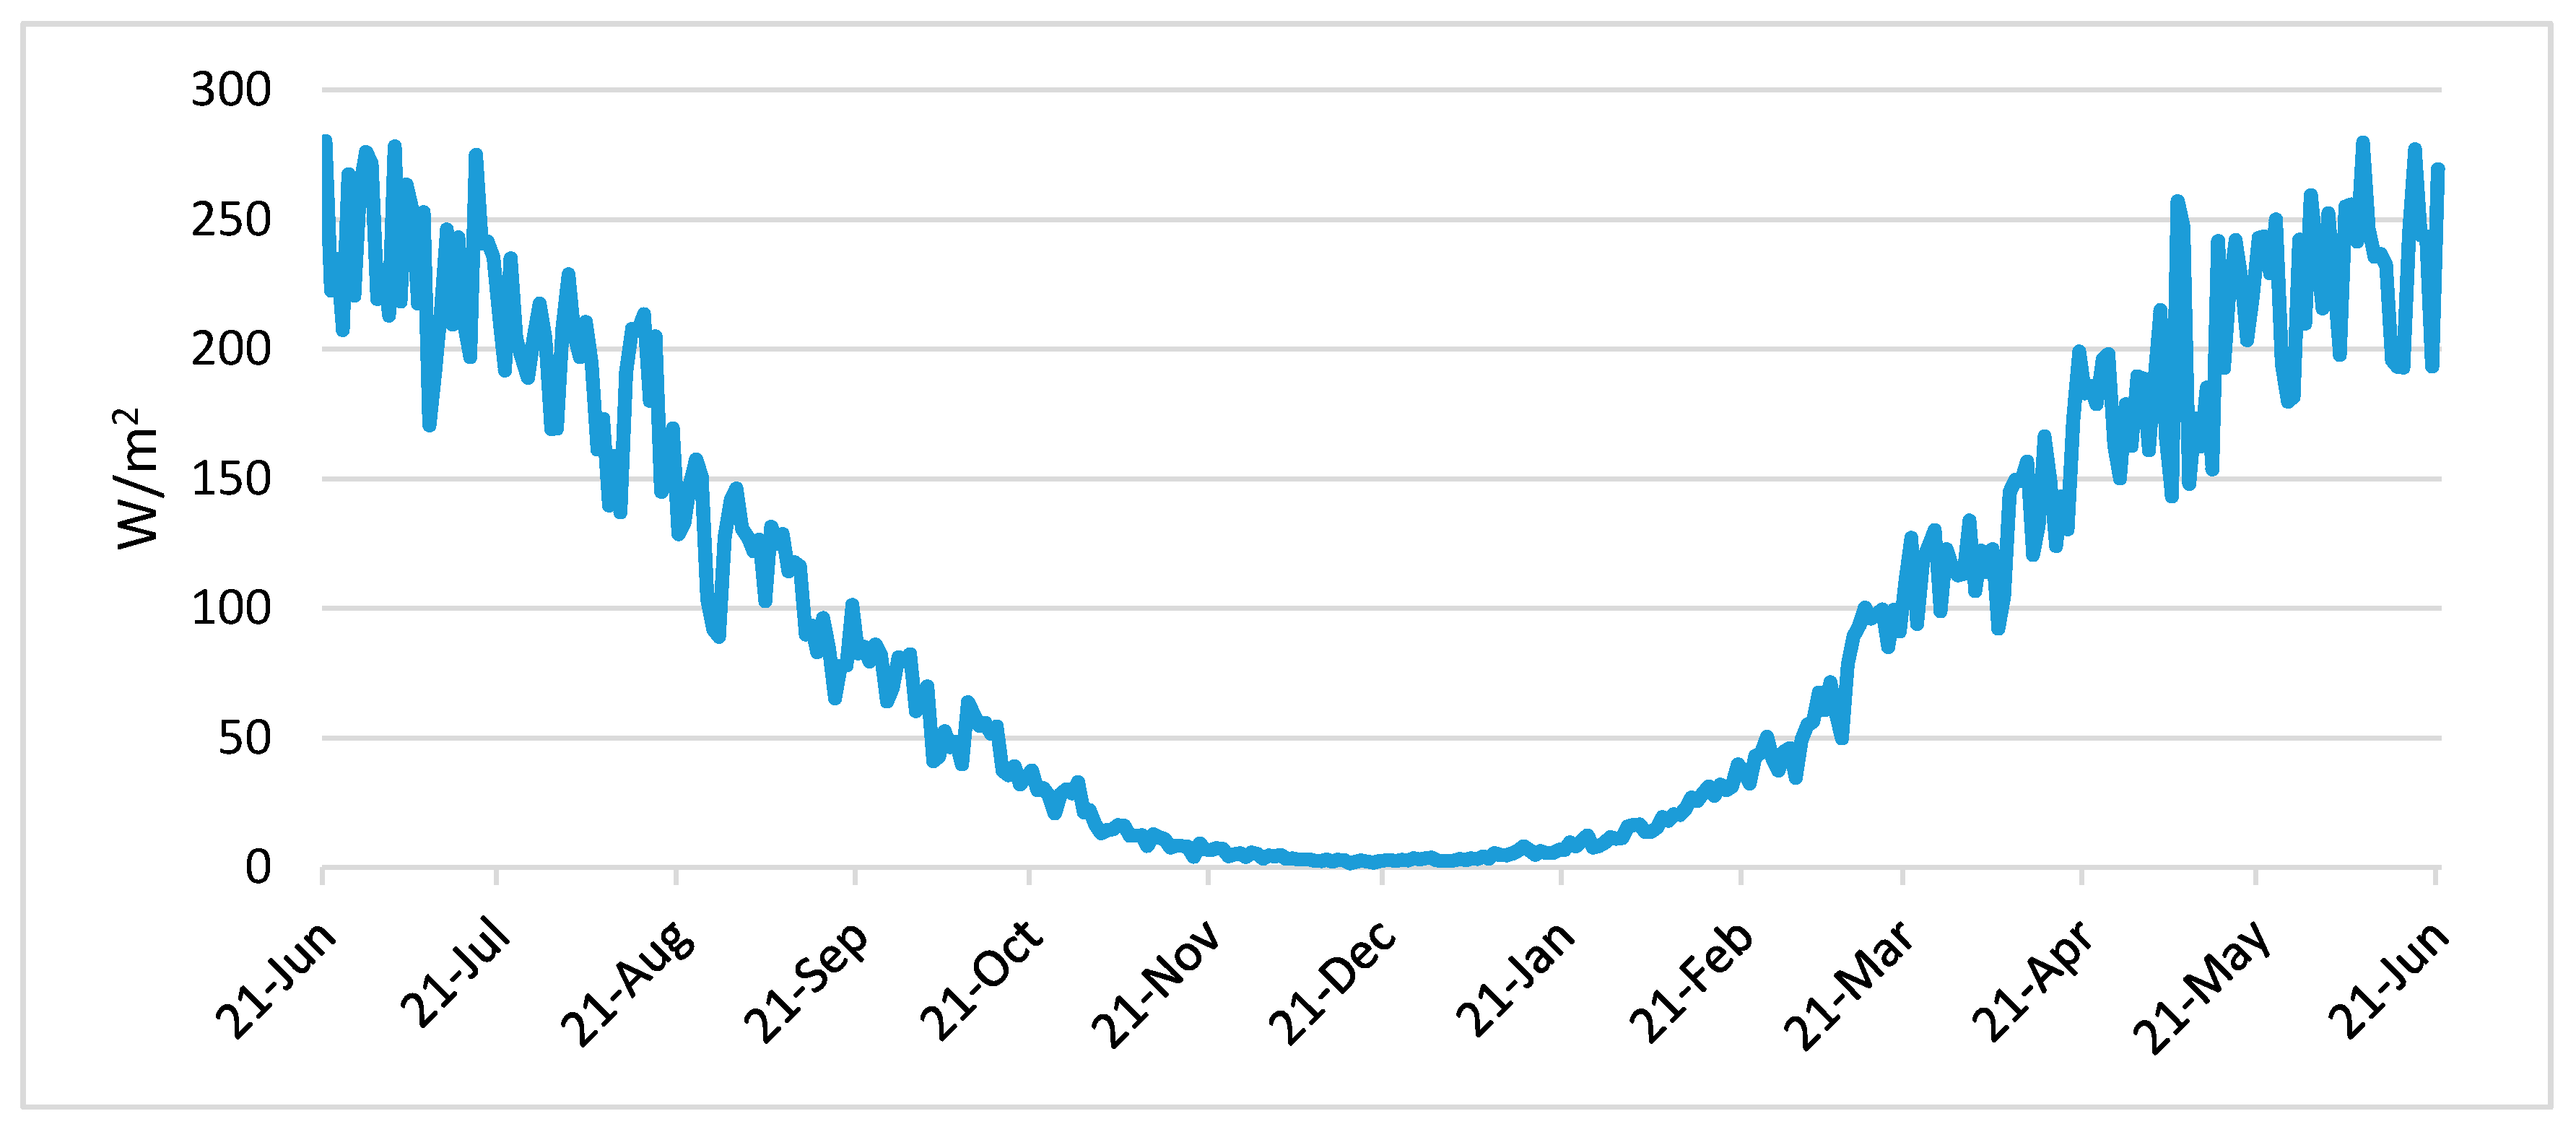
2.2.1 Reference Scenario

The case study building was a multi-family residential building with four floors and a heated attic with storage (Figure 3a,b). The building was located in Umeå, Sweden, at latitude 63°82’N. The input data used in the reference scenario were based on blueprints and product specifications, standardized values for climate, building operation and user behavior, and some assumptions (Table 2).

2.2.2 Parameter Variations

The influence of the climate (P1) on the average U-value (I3), SHLWDT (I4), L (I5), specific net energy (I6), and specific purchased energy (I7) was studied using average values for the climate data from the period 2002–2009 [69], instead of the average values for 1961–1990 used in the baseline scenario. The yearly mean temperature of the period 2002–2009 was 1.4 °C warmer than for the period 1961–1990 (5.4 °C). The studied parameter variations for the other 14 parameters are presented in Table 3. Best- and worst-case scenarios were studied for the groups of parameters related to the building envelope (P2–P5), the technical installations (P6–P8), the building operation (P9–P11), and the user behavior (P12–P15), separately (Table 3). In these four best- and worst-case scenarios, the groups of parameters were varied according to Table 3. Finally, a best- and worst-case scenario was created for a combination of the parameters related to both building operation and user behavior (P9–P15). In this scenario, P9–P15 were varied to their best/worst case values in Table 3.
In addition to the variations for the best- and worst-case scenarios in Table 3, two extra variations of the heating system (P6) and one extra variation of the supply to exhaust air rate ratio (P11) were studied. The studied variations of P6 were: (1) a combination of district heating and 60 m2 solar collectors located on the house property (DH + S); (2) a heat pump (HP); (3) a pellet boiler (PB); and (4) a natural gas boiler (NGB). The first variation was chosen to study the influence of solar panels on the studied indicators since energy produced by solar panels located on the house property can be excluded from the specific purchased energy (I7) according to BBR [22]. The second variation was chosen since heat pumps are frequently used in Sweden, as it can cause significant reduction of I7. The third variation was studied since pellet boilers are commonly used in Sweden. The fourth variation was studied as an alternative boiler, since natural gas is commonly used in many European countries. The additional variation of the supply to exhaust air rate ratio (P11) studied was a supply air rate 95% of the exhaust air rate (ratio = 0.95), creating a small under pressure to avoid moisture problems. It is also worth noting that the form factor (P2) was varied by adding and subtracting floors from the building instead of changing the building design (Table 3). Thus, the variations in the form factor parameter could simultaneously be used to study the influence of the number of building floors on the studied indicators.

3. Results

In this section, the results of the Delphi study are presented, followed by the results of the case study.

3.1. Results from the Delphi Study

The results of the Delphi study showed that the building practitioners valued robustness of criteria compliance verifications (i.e., low influence from user behavior, operation, and climate) higher than a low cost of carrying them out or being able to carry them out quickly. Some of the respondents stated:
“(the cost) matters less, within reasonable limits”
“(the timeframe) matters less, but it may be difficult to enforce requirements (on building energy performance) if the verification process takes too long.”
Fourteen out of the 15 respondents agreed that compliance with building energy performance criteria should be verified through measurements. Of these, about 40% preferred only using component measurements (e.g., airtightness, thermography, or heat exchanger efficiency measurements), about 15% preferred only using system measurements (e.g., energy use), and about 40% preferred using both. Forty percent of the respondents wanted compliance with building energy performance criteria to be verified through simulations in addition to measurements. One respondent stated:
“(You should) agree upon a calculation (procedure) in the procurement process and measure air tightness, heat exchanger function, and room air temperatures.”
A majority of the respondents (approximately 75%) agreed that compliance with building energy performance criteria should be verified in the design stage. Of these, about 80% agreed that compliance additionally should be verified at a later phase. However, the opinions were divided equally as to when at a later phase this additional verification should take place: during the construction, at the final inspection/handover of the building, in the operational phase, or at more than one of these occasions. In total, about 50% of the respondents wanted to verify building energy performance criteria in the operational phase, 40% at the final inspection/handover of the building, and about 30% during the construction. Some of the respondents stated:
“(You should verify building energy performance) in the design phase to show the theoretical level; (then) follow up in the finished building (at the final inspection) to ensure this level.”
“(You may use) a mix of both (evaluations in the design phase and operational phase) as long as you do not measure things we cannot influence (e.g., user behavior).”
“The building envelope may be verified in the final inspection, but the (technical) installations should be adapted to the function of the building and its residents.”
The need for alternative indicators to the specific purchased energy (I7), when setting criteria on building energy performance in the procurement process, was rated high (average value of 5.87 on a Likert scale of 1–7). Some of the respondents stated:
“…. (the specific purchased energy) says nothing about the performance of the building envelope, you can e.g., compensate for a bad envelope by putting solar panels on the roof.”
“Although you have to measure the energy use since there is an interest (from the client) to know the cost for heating the building, the energy performance (of the building) is of course something else.”
“… (the specific purchased energy) is difficult to verify. It is difficult to determine if any deviations depend on the building or on the users.”
Among the studied indicators, the building practitioners preferred, in descending order, the SHLWDT (I4), the average U-value (I3), U-values for different building parts (I2), and envelope air leakage (I1). The building practitioners considered it important to be able to verify building energy performance independent of the user behavior (average value of 6.27 on a Likert scale of 1–7). With respect to independence of the user behavior, the indicators preferred by the building practitioners were in descending order: the average U-value (I3), U-values for different building parts (I2), envelope air leakage (I1), and SHLWDT (I4). The building professionals also considered it important to be able to verify energy performance independent of the building operation (rated 5.4 in a Likert scale of 1–7). To be able to verify building energy performance independent of the technical installation was rated relatively lower (4.4 in a Likert scale of 1–7). Some of the respondents stated:
“The stricter the requirements get the higher percentage of the energy consumption will be influenced by user behavior and operation. This leads to a need (for the construction companies) to keep very good track of the energy consumption in order to avoid disputes.”
”The building envelope should stand for 100 years, the installations are exchanged more often. It should therefore be more important to measure parameters connected to the building envelope.”
”…the contractor has more control over the installations than over the operation and user behavior.”
The building practitioners identified several issues when specific purchased energy (I7) was used to set energy performance criteria in the building procurement process. Table 4 presents the issues ranked as most important within each category of issues (Section 2.1.1) by three or more respondents and the issues ranked as most important among all issues in the four categories by three or more respondents.

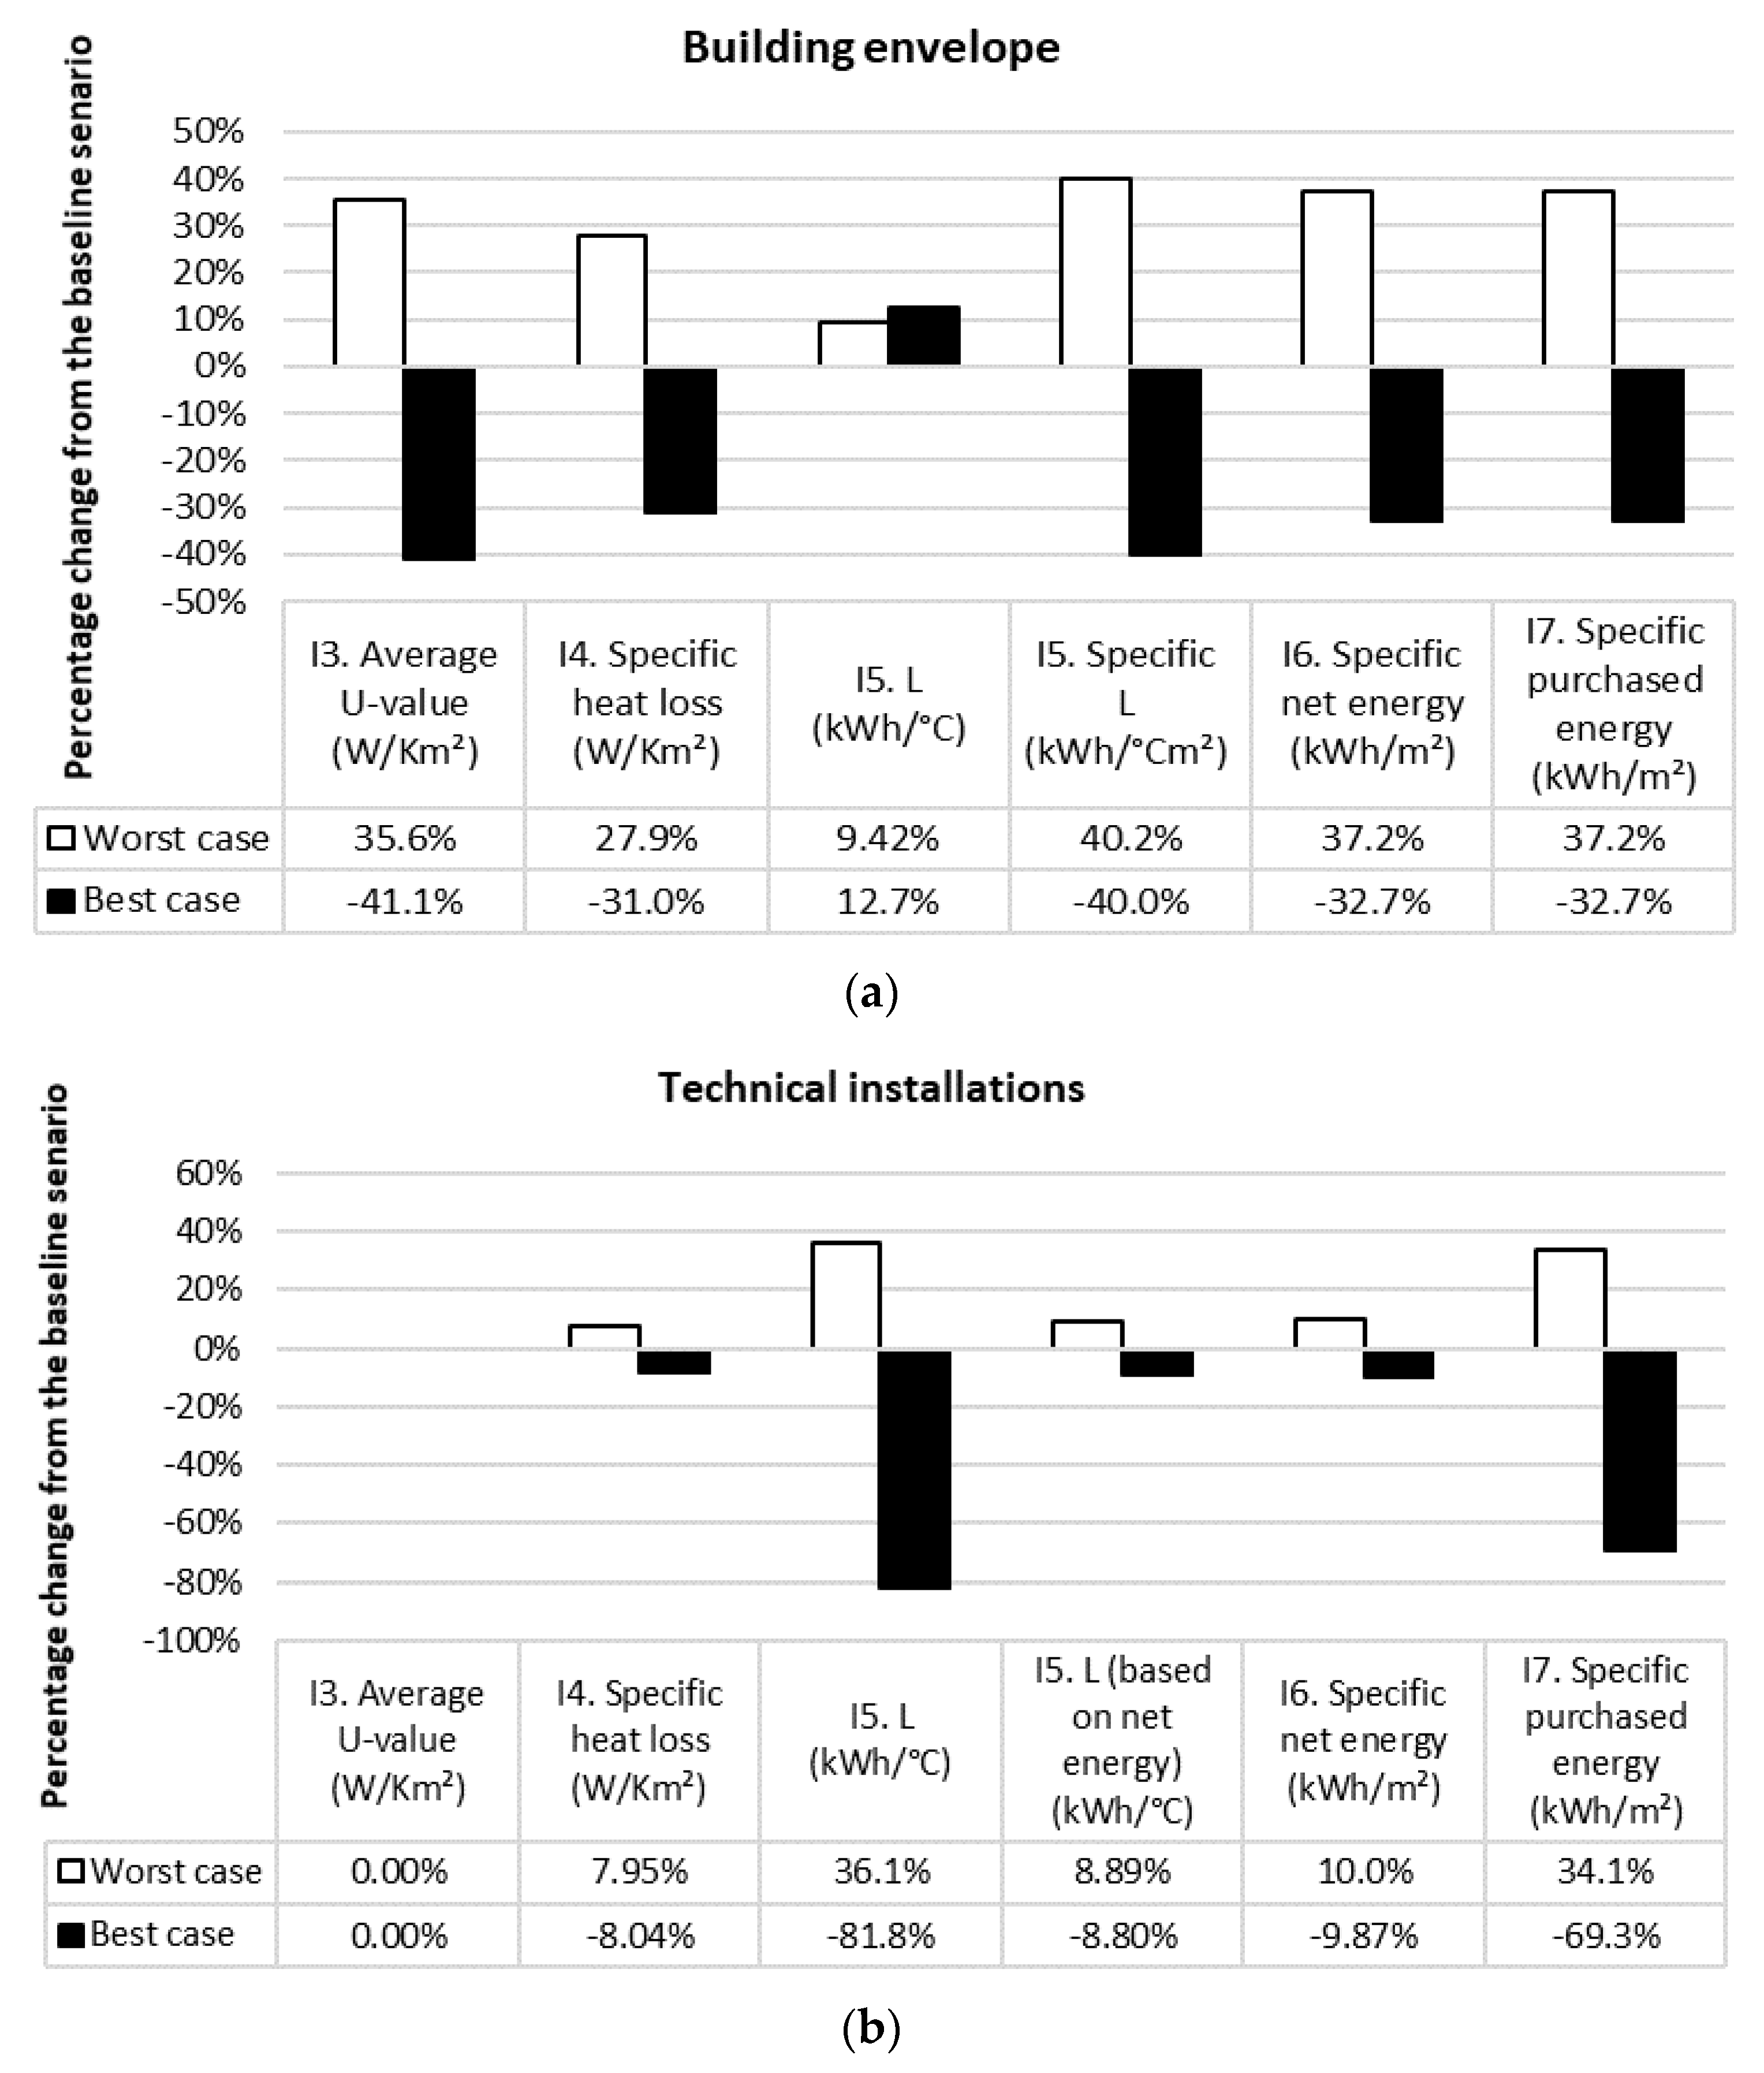
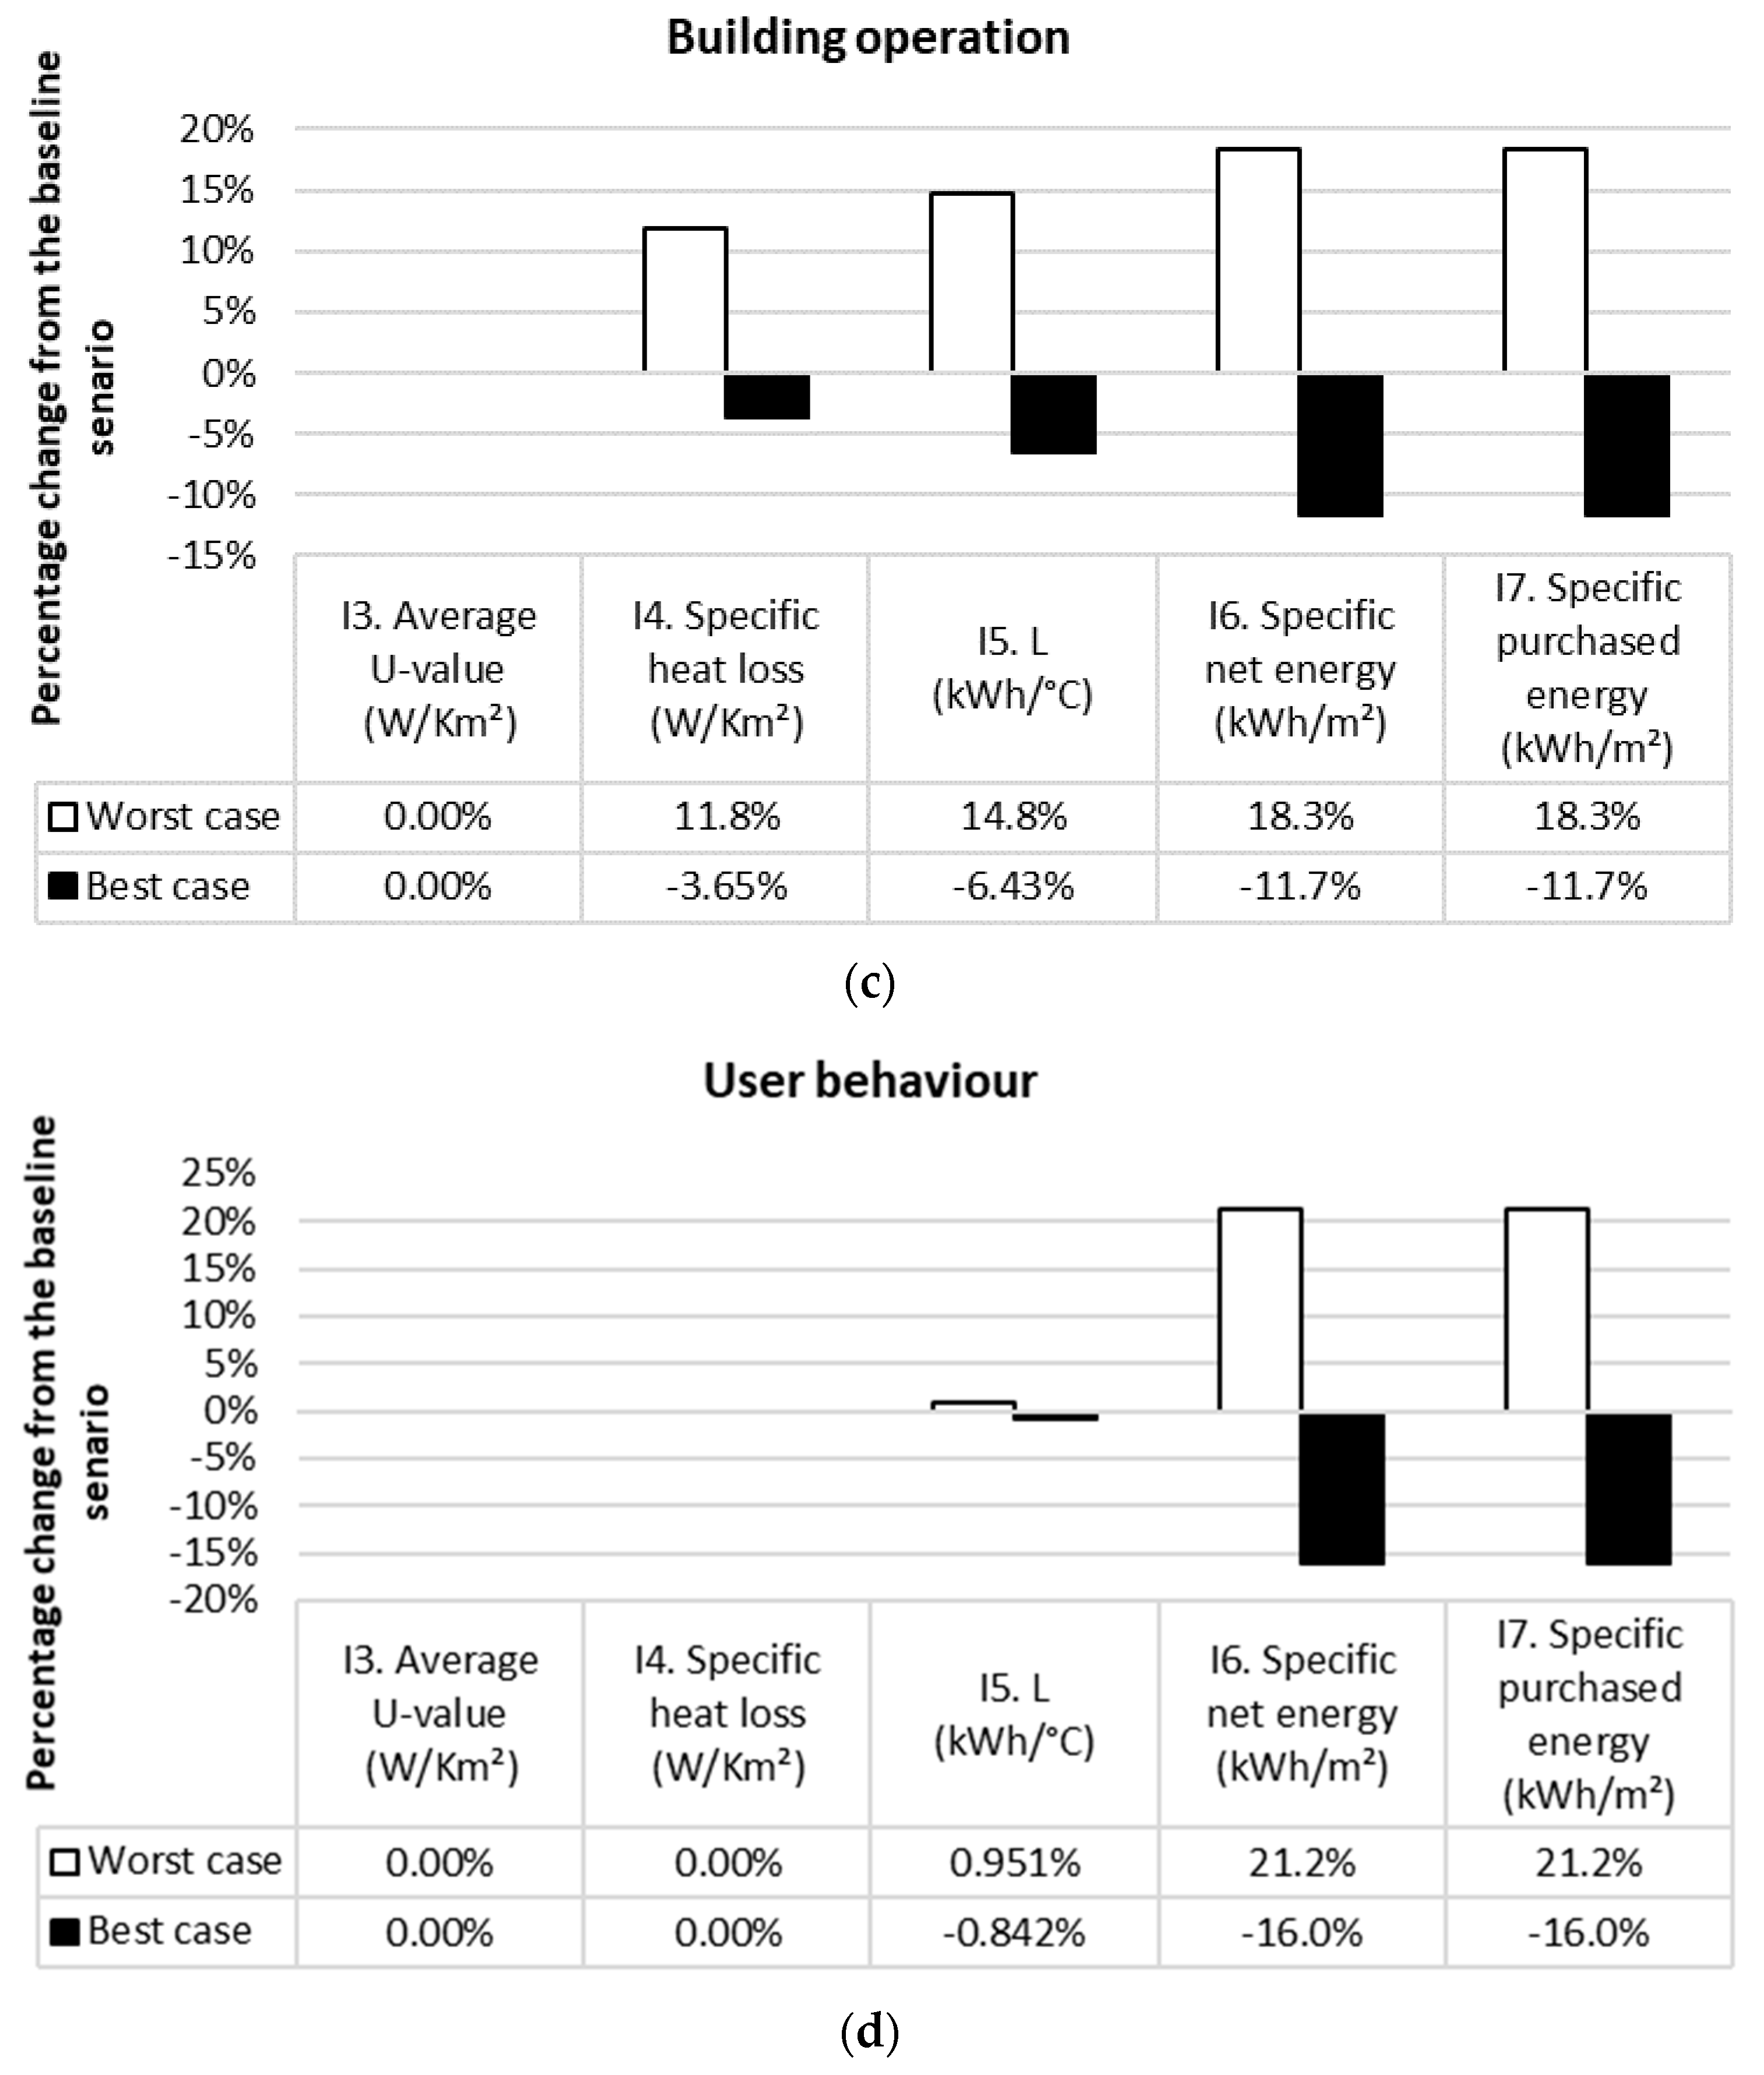
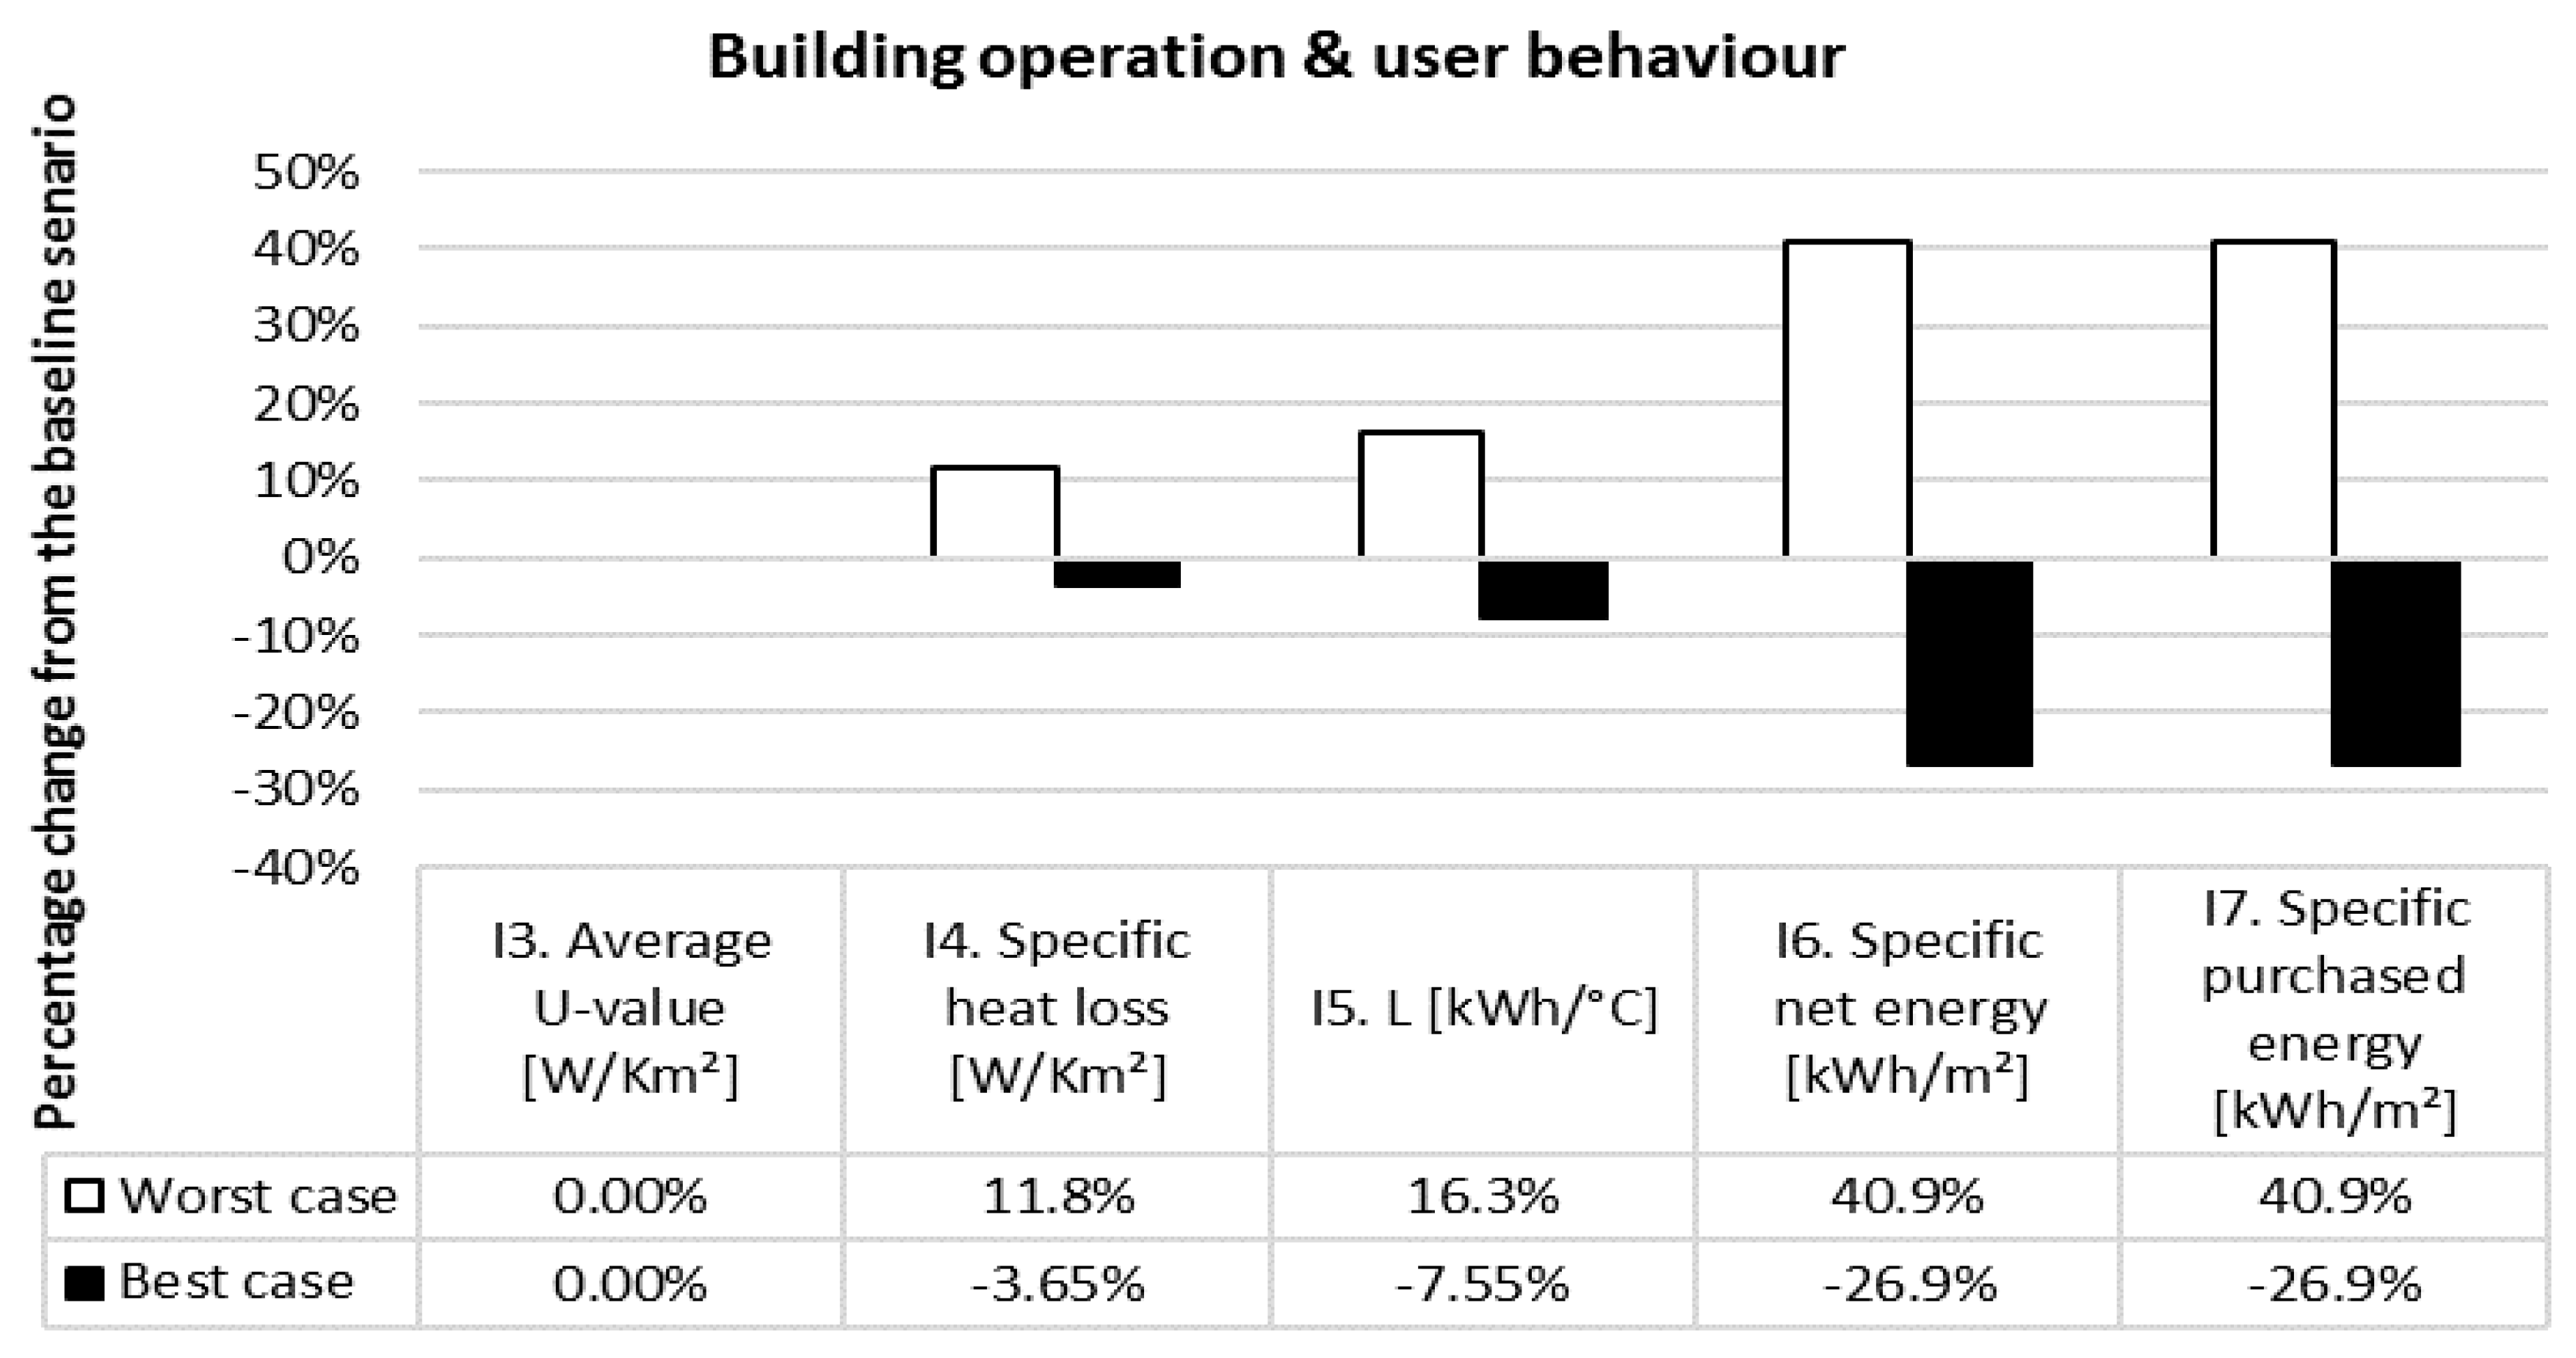
3.2. Results from the Case Study

In the reference scenario, the average U-value (I3) for the case study building was 0.307 W/m2K. The specific purchased energy (I7) and specific net energy (I6) were both evaluated to 61.8 kWh/m2, since the efficiency of the district heating was assumed to be 100%. The SHLWDT (I4) was evaluated to 21.8 W/m2K and L to 15.6 kWh/°C. The results for the studied energy performance indicators when the 15 parameters were varied individually are presented in Table 5, as the percentage deviation from the reference scenario. The results in Table 5 follow the best- and worst-case parameter variations presented in Table 3, but also include results for the climate (P1) variation and the additional variations studied for the heating system (P6) and supply to exhaust air rate ratio (P11).
The smaller form factor (P2) in the best-case scenario resulted in an increased L (I5) of +84% due to a larger envelope area of the 8-story building. Thus, in the best-case scenario the larger envelope area counteracted the higher building envelope performance in the evaluation of L (I5), and vice versa in the worst-case scenario. This may explain why L (I5) was less sensitive to the studied parameters related to the building envelope (P2—P5) than the other indicators, and increased both in the worst and best-case scenario. However, if L (I5) was normalized by heated floor area (representing only changing the building’s form factor and not the number of building floors), a larger form factor (P2) instead resulted in an increased L (I5). A form factor (P2) of 0.52 then resulted in an increase of L (I5) by +1.32% and a P2 of 0.39 in a decrease of −1.94%. Thus, unless normalized e.g., by floor area, adding building floors would increase L (I5) since the total envelope heat losses would increase.
The results of the best- and worst-case scenarios for each indicator are presented in Figure 4 and Figure 5, as the percentage deviation from the results in the reference scenario. Due to the influence of the form factor discussed above, L (I5) was less sensitive to the parameters related to the performance of the building envelope (P2–P5) compared to the other indicators. However, when normalized by heated floor area, L was more sensitive to the parameters related to the performance of the building envelope (P2–P5) than the other studied indicators (referred to as “Specific L” in Figure 4a).
The specific purchased energy (I7) was significantly influenced by the heating system variations (Table 5). Since the purchased energy is the energy supplied to the building’s technical installations for building services and energy system, it was influenced by the heating system variations because of their different heating system efficiencies. Since the purchased energy does not include “free” energy from the sun, it was also influenced by the use of solar panels in one of the studied variations. When the linear regression was based on the building’s simulated purchased energy use, L (I5) was also influenced by the heating system variations. This may explain why L (I5) was more sensitive to the parameters related to the technical installations (P6–P8) than the other studied indicators (Figure 4b). However, if the linear regression was based on simulated net energy (which is not influenced by the heating system efficiency and includes the energy produced by solar panels) the influence of the heating system variations on L (I5) was eliminated. When evaluated based on net energy, L (I5) was less sensitive to the parameters related to the technical installations (P6–P8) than the specific net energy (I6) and specific purchased energy (I7) indicators was (Figure 4b).
The Delphi study indicated that the building practitioners found it more important for energy performance indicators to be independent of user behavior and building operation than of the performance of the technical installations. Therefore, best- and worst-case scenarios that included the sets of parameters related to both user behavior and the building operation (P9–P15) were studied. The simulation results for these scenarios (Figure 5) showed that the specific net energy (I6) and specific purchased energy (I7) indicators were more sensitive than L (I5) and SHLWDT (I4) to parameters P9–P15.

4. Discussion

The building contractors need to prove that they have delivered a building that meets the energy performance criteria agreed upon when the contract was awarded. Therefore, the evaluated indicators need to measure the energy performance which the building contractor can influence (i.e., the performance of the building envelope and the technical installations). The Delphi study indicated that the building practitioners considered it important that such energy performance indicators are independent of the user behavior. Thus, the building practitioners suggested making a distinction between the energy performance of the building itself and how it is used by the occupants. They also considered it desirable to separate the energy performance of the building itself from the building operation (e.g., settings for indoor temperature and ventilation rate).
The Delphi study showed that the building practitioners were not in favor of using specific purchased energy (I7) as an indicator for energy performance criteria in the building procurement process. They believed this indicator could be significantly affected by the user behavior. This was confirmed by the case study, where the parameters related to user behavior (P12–P15) influenced the specific purchased energy (I7) by more than 20% in the studied worst-case scenario. Since it is impossible for construction companies to control the user behavior and building operation, the building practitioners considered it risky to agree to stringent criteria on the specific purchased energy (I7) with possible fines for non-compliance. The case study confirmed that the combination of operation and user behavior may have a significant influence on the specific purchased energy (I7). The parameters related to user behavior and building operation (P9–P15) influenced the specific purchased energy (I7) 40% in the studied worst-case scenario. Thus, it could be argued that the specific purchased energy indicator is not an appropriate indicator to determine the building contractors’ responsibility for a delivered building’s energy performance.
The building practitioners were of the opinion that they have more control over the performance of the technical installations than over the building operation and user behavior. Thus, they considered it less important to separate the energy performance of the building from the performance of the technical installation. However, the case study showed that the specific purchased energy (I7) was significantly influenced by the heating system. The system boundary of the specific purchased energy indicator includes the efficiency of the heating system and the energy produced by solar panels is excluded. Therefore, requirements on the specific purchased energy indicator may promote buildings with highly efficient heating systems or solar panels. The building practitioners expressed concerns on this subject; that requirements on specific purchased energy (I7) may lead to more focus on technical installations such as heat pumps and solar panels and less focus on energy efficient building envelopes. Separating the energy performance of the building and of its technical installations may help to determine the deviations from the energy performance criteria due to the technical installations. The case study showed that the specific net energy indicator (I6), as well as L (I5) evaluated based on net energy, was less influenced by the parameters related to the technical installations (P6–P8) than the specific purchased energy (I7). The specific net energy (I6) and L (I5) evaluated based on net energy may therefore be used to separate the energy performance of the building from the performance of the technical installations.
One way to avoid influence from the building operation and user behavior is to verify compliance with building energy performance criteria in the design phase, based on design specifications and standardized values for normal operation and user behavior. Accordingly, a majority of the practitioners wanted to verify compliance with energy performance criteria set in the procurement process, during the building’s design phase. However, several respondents also pointed out that such verifications may invite “tampering” with the input parameters in the calculations to achieve the specified energy criteria instead of actually improving the building. Therefore, the building practitioners considered it important for energy performance indicators to be independent of user behavior and building operation, even if compliance with the criteria on them are verified in the design phase. Almost all building practitioners agreed that the energy performance additionally should be verified at a later phase through some sort of measurements. They expressed an interest in cross-checking whether the energy performance verified in the design phase was achieved in the finished building.
The building practitioners expressed most confidence in the following indicators for setting energy performance criteria in the building procurement process, in descending order: the SHLWDT (I4), average U-value (I3), U-values for different building parts (I2), and envelope air leakage (I1). The indicators I1, I2 and I3 are all inherently independent of the technical installations, building operation, and user behavior U-values for different building parts (I2) may be difficult to measure outside of a lab environment and compliance with requirements on the average U-value (I3) are generally verified based on calculations. The case study showed that the SHLWDT (I4) was independent of the various parameters related to the user behavior (P12–P15). The SHLWDT (I4) was also influenced less by the parameters related to the building operation (P9–P11) and technical installations (P6–P8) than the other studied indicators. Requirements on the SHLWDT (I4) are verified through calculation [22]. U-values for different building parts (I2), the average U-value (I3), and the SHLWDT (I4) may therefore be used as alternative indicators for calculation based verifications of building energy performance criteria in the procurement process (in the design phase). However, these indicators may not be appropriate for measurement based verifications.
The building practitioners in general did not prefer to measure energy use, but rather indicators independent of user behavior and operation such as envelope air leakage (I1). Since L (I5) is evaluated by linear regression of measured energy data, the building practitioners’ low confidence in L (I5) may be due to their negative experiences of measuring energy use. However, the case study showed that L was less influenced by the studied parameters related to user behavior (P12–P15), building operation (P9–P11), and climate data (P1) than the specific purchased energy indicator (I7) and the specific net energy indicator (I6). L (I5) was more influenced by studied parameters related to user behavior (P12–P15), building operation (P9–P11), and climate data (P1) than the SHLWDT (I4). However, L (I5) may be evaluated both based on measured and simulated data (Section 2.2). Thus, as opposed to the SHLWDT (I4), L (I5) may be used for both calculation and measurement based verifications. Hence, any differences from the performance evaluated in the design phase in the finished building may therefore more easily be identified. Additionally, since L (I5) may be evaluated based on data for a few months of the year, measurement based verifications of criteria compliance does not require measurements for a full year. Table 6 presents a summary of the main results of the Delphi study and case study.

Future Research

This study indicated the L (I5) as a possible alternative to the specific purchased energy indicator (I7) for setting energy performance criteria in the Swedish building procurement process. However, the practical application of L (I5) needs to be studied further. For example, the case study indicated that using purchased energy instead of net energy for the linear regression may influence L (I5) (due to the heating system efficiency). The extent of this influence, and if it may be limited, needs further study. The climate, airing (by opening windows), and the number of occupants was indicated to have a limited influence on L (I5) in the case study. L (I5) is theoretically independent of the climate and user behavior. However, L may be influenced by these parameters due to uncertainties in the energy signature method. Variations in the user behavior (e.g., airing and occupant attendance) and climate parameters (e.g., wind and solar radiation) for different outdoor temperatures may cause such uncertainties. Further studies may be needed to understand how these uncertainties in the energy signature method may be reduced.
Similar studies may be carried out in other countries where energy performance criteria in the building procurement process are based on indicators that could be influenced by user behavior and building operation.

5. Conclusions

The study showed that the building practitioners experienced many issues with using specific purchased energy (I7) for energy performance criteria in the procurement process. They expressed a need for alternative or additional indicators to be used in the building procurement process in Sweden. The building practitioners preferred to verify compliance with energy performance criteria in the design phase, with additional measurement based verification at a later stage. They preferred the energy performance criteria to be independent of user behavior and building operation.
For calculation based compliance verifications of energy performance criteria, the results of this study indicated that SHLWDT (I4), L (I5), the average U-value (I3) and U-values for different building parts (I2) may be used to separate the performance of the building itself from the user behavior and building operation. For measurement based compliance verifications of building energy performance criteria, the study indicated that the envelope air leakage (I1) and L (I5) may be used to separate the performance of the building itself from the user behavior and building operation. Additionally, the study indicated that the specific net energy (I6) and L (I5) evaluated based on net energy may be used to separate the performance of the technical installations from the building performance. Although the building practitioners expressed less confidence in L, it offers the advantage of being able to verify compliance with energy performance criteria based on both calculations and measurements using the same indicator. The indicators suggested above may be considered as alternatives to the specific purchased energy indicator or to set additional energy performance criteria in the Swedish building procurement process.

Acknowledgments

This study was conducted during the project “Metodik för byggentreprenören att kvalitetssäkra byggnadens energiprestanda”, funded by SBUF (the construction industry’s organization for research and development in Sweden). The authors would like to thank Anders Åstrand, Umeå University, Department of Applied Physics and Electronics, for his contributions in the distribution of surveys and compiling the Delphi study results, as well as preliminary evaluations of the SHLWDT for the case study building.

Author Contributions

Ingrid Allard and Thomas Olofsson conceived and designed the study; Gireesh Nair contributed with consultations on the Delphi study survey questions; Ingrid Allard and Thomas Olofsson performed the Delphi study and Ingrid Allard the case study; Ingrid Allard analyzed the data; and Ingrid Allard wrote the paper, with continuous feed-back from Thomas Olofsson and Gireesh Nair.

Conflicts of Interest

The authors declare no conflict of interest.

References

  1. Pérez-Lombard, L.; Ortiz, J.; Pout, C. A review on buildings energy consumption information. Energy Build. 2008, 40, 394–398. [Google Scholar] [CrossRef]
  2. Wang, N.; Chang, Y.-C.; Dauber, V. Carbon print studies for the energy conservation regulations of the UK and China. Energy Build. 2010, 42, 695–698. [Google Scholar] [CrossRef]
  3. Annunziata, E.; Frey, M.; Rizzi, F. Towards nearly zero-energy buildings: The state-of-art of national regulations in Europe. Energy 2013, 57, 125–133. [Google Scholar] [CrossRef]
  4. Lee, W.L.; Chen, H. Benchmarking Hong Kong and China energy codes for residential buildings. Energy Build. 2008, 40, 1628–1636. [Google Scholar] [CrossRef]
  5. Melo, A.; Sorgato, M.; Lamberts, R. Building energy performance assessment: Comparison between ASHRAE standard 90.1 and Brazilian regulation. Energy Build. 2014, 70, 372–383. [Google Scholar] [CrossRef]
  6. Iwaro, J.; Mwasha, A. A review of building energy regulation and policy for energy conservation in developing countries. Energy Policy 2010, 38, 7744–7755. [Google Scholar] [CrossRef]
  7. Garcia Casals, X. Analysis of building energy regulation and certification in Europe: Their role, limitations and differences. Energy Build. 2006, 38, 381–392. [Google Scholar] [CrossRef]
  8. Application of the Local Criteria/Standards and Their Differences for Very Low-Energy and Low Energy Houses in the Participating Countries. Available online: http://www.enerhaus.ch/files/Dateien/NorthPass_D2_Application_of_local_criteria.pdf (accessed on 18 October 2017).
  9. Thuller, K. Low-Energy Buildings in Europe—Standards, Criteria and Consequences; Lund university: Lund, Sweden, 2010. [Google Scholar]
  10. Allard, I.; Olofsson, T.; Hassan, O. Methods for energy analysis of residential buildings in Nordic countries. Renew. Sustionable Energy Rev. 2013, 22, 306–318. [Google Scholar] [CrossRef]
  11. Asdrubali, F.; Bonaut, M.; Battisti, M.; Venegas, M. Comparative study of energy regulations for buildings in Italy and Spain. Energy Build. 2008, 40, 1805–1815. [Google Scholar] [CrossRef]
  12. Fayaz, R.; Kari, B.M. Comparison of energy conservation building codes of Iran, Turkey, Germany, China, ISO 9164 and EN 832. Appl. Energy 2009, 86, 1949–1955. [Google Scholar] [CrossRef]
  13. Kunz, J.; Maile, T.; Bazjanac, V. Summary of the Energy Analysis of the First Year of the Stanford Jerry Yang & Akiko Yamazaki Environment & Energy (Y2E2) Building; Stanford University: Stanford, CA, USA, 2009. [Google Scholar]
  14. Wall, M. Energy-efficient terrace houses in Sweden—Simulations and measurements. Energy Build. 2006, 38, 627–634. [Google Scholar] [CrossRef]
  15. Piette, M.A.; Kinney, S.K.; Haves, P. Analysis of an information monitoring and diagnostic system to improve building operations. Energy Build. 2001, 33, 783–791. [Google Scholar] [CrossRef]
  16. Scofield, J.H. Early Performance of a Green Academic Building. ASHRAE Trans. Symp. 2002, 108, 1214. [Google Scholar]
  17. Maile, T.; Bazjanac, V.; Fischer, M. A method to compare simulated and measured data to assess building energy performance. Build. Environ. 2012, 56, 241–251. [Google Scholar] [CrossRef]
  18. Hens, H.; Parijs, W.; Deurinck, M. Energy consumption for heating and rebound effects. Energy Build. 2010, 42, 105–110. [Google Scholar] [CrossRef]
  19. Yoshino, H.; Hong, T.; Nord, N. IEA EBC annex 53: Total energy use in buildings—Analysis and evaluation methods. Energy Build. 2017, 152, 124–136. [Google Scholar] [CrossRef]
  20. Burman, E.; Mumovic, D.; Kimpian, J. Towards measurement and verification of energy performance under the framework of the European directive for energy performance of buildings. Energy 2014, 77, 153–163. [Google Scholar] [CrossRef]
  21. Yousefi, F.; Gholipour, Y.; Yan, W. A study of the impact of occupant behaviors on energy performance of building envelopes using occupants’ data. Energy Build. 2017, 148, 182–198. [Google Scholar] [CrossRef]
  22. The Swedish National Board of Housing, Building, and Planning. BBR 22—Boverkets Föreskrifter om Ändring i Verkets Byggregler (2011:6)—Föreskrifter och Allmänna Råd; The Swedish National Board of Housing, Building, and Planning: Karlskrona, Sweden, 2015. [Google Scholar]
  23. The Swedish Program for Standardizing and Verifying Energy Performance in Buildings (SVEBY). Brukarindata bostäder; The Swedish Program for Standardizing and Verifying Energy Performance in Buildings (SVEBY): Stockholm, Sweden, 2012. [Google Scholar]
  24. Jensen, L. Analys av Osäkerhet i Beräkning av Energianvändning i hus och Utveckling av Säkerhetsfaktorer; Lunds Universitet: Lunds, Sweden, 2010. [Google Scholar]
  25. The Swedish National Board of Housing, Building, and Planning. Konsekvensutredning BEN 1—Boverkets Föreskrifter och Allmänna Råd (2016:12) om Fastställande av Byggnadens Energianvändning vid Normalt Brukande och ett Normalår. Available online: https://www.boverket.se/contentassets/f3bf0ac62dc148438a007c987aeaea21/konsekvensutredning-ben-1.pdf (accessed on 13 October 2017).
  26. Byggindustrin. Förenkla Byggreglernas Energikrav. Available online: http://byggindustrin.se/artikel/debatt/forenkla-byggreglernas-energikrav-25138 (accessed on 17 October 2017).
  27. Svenska Dagbladet. Boverket Tänker fel om Bostäder och Energi. Available online: https://www.svd.se/boverket-tanker-fel-om-bostader-och-energi (accessed on 17 October 2017).
  28. Okoli, C.; Pawlowski, S.D. The Delphi method as a research tool: an example, design considerations and applications. Inf. Manag. 2004, 42, 15–29. [Google Scholar] [CrossRef] [Green Version]
  29. Kauko, K.; Palmroos, P. The Delphi method in forecasting financial markets—An experimental study. Int. J. Forecast. 2014, 30, 313–327. [Google Scholar] [CrossRef]
  30. Förster, B.; von der Gracht, H. Assessing Delphi panel composition for strategic foresight—A comparison of panels based on company-internal and external participants. Technol. Forecast. Soc. Chang. 2014, 84, 214–229. [Google Scholar] [CrossRef]
  31. Linstone, H.; Turoff, M. The Delphi Method: Techniques and Applications; Addison-Wesley: Boston, MA, USA, 1975. [Google Scholar]
  32. Barnes, S.J.; Mattsson, J. Understanding current and future issues in collaborative consumption: A four-stage Delphi study. Technol. Forecast. Soc. Chang. 2016, 104, 200–211. [Google Scholar] [CrossRef]
  33. Osborne, J.; Collins, S.; Ratcliffe, M.; Millar, R.; Duschl, R. What ideas-about-science should be taught in school science? A Delphi study of the Expert community. J. Res. Sci. Teach. 2013, 40, 692–720. [Google Scholar] [CrossRef]
  34. Frewer, L.; Fisher, A.; Wentholt, M.; Marvin, H.; Ooms, B. The use of Delphi methodology in agrifood policy development: Some lessons learned. Tehnol. Forecast. Soc. Chang. 2011, 78, 1514–1525. [Google Scholar] [CrossRef]
  35. Norman, D.; Olaf, H. An experimental application of the Delphi method to the use of experts. Manag. Sci. 1963, 9, 458–467. [Google Scholar]
  36. Day, J.; Bobeva, M. A Generic Toolkit for the Successful Management of Delphi Studies. Electron. J. Bus. Res. Methods 2005, 3, 103–116. [Google Scholar]
  37. Hansson, F.; Sinead, K. Enhancing rigour in the Delphi technique research. Technol. Forecasting Soc. Chang. 2011, 78, 1695–1704. [Google Scholar] [CrossRef]
  38. Van Djik, J. Delphi Method, Developing an Instrument to Control Technological Change for Employees. Qual. Quant. 1989, 23, 189–203. [Google Scholar] [CrossRef]
  39. Linstone, H.; Turoff, M. Delphi: A brief look backward and forward. Technol. Forecast. Soc. Chang. 2011, 78, 1712–1719. [Google Scholar] [CrossRef]
  40. Johnson, J. A Ten Year Forecast in the Electronics Industry. Ind. Market. Manag. 1976, 5, 45–55. [Google Scholar] [CrossRef]
  41. Hsu, C.-C.; Sandford, B.A. The Delphi Tehnique: Making Sense of Consensus. Pract. Assess. Res. Eval. 2007, 12, 1–8. [Google Scholar]
  42. Landeta, J. Current validityof the Delphi method in social sciences. Technol. Forecast. Soc. Chang. 2006, 73, 467–482. [Google Scholar] [CrossRef]
  43. Keeney, S. The Delphi technique. In The Research Process in Nursing; Blackwell publishing: London, UK, 2009; pp. 227–236. [Google Scholar]
  44. Schmidt, R. Managing Delphi surveys using nonparametric statistical techniques. Decis. Sci. 1997, 28, 3. [Google Scholar] [CrossRef]
  45. Sveriges Centrum för Nollenergihus. Kravspecifikation för Nollenergihus, Passivhus och Minienergihus—Bostäder (FEBY 12); Sveriges Centrum för Nollenergihus: Stockholm, Sweden, 2012. [Google Scholar]
  46. Capozzoli, A.; Mechri, H.E.; Corrado, V. Impacts of architectural design choices on building energy performance applicaitons of uncertainty and sensitiivty techniques. In Proceedings of the Eleventh International IBPSA Conference, Glasgow, UK, 27–30 July 2009. [Google Scholar]
  47. Zhao, M.; Kunzel, H.M.; Antretter, F. Parameters influencing the energy performance of residential buildings in different Chinese climate zones. Energy Build. 2015, 96, 64–75. [Google Scholar] [CrossRef]
  48. Ioannou, A.; Itard, L. Energy performance and comfort in residential buildings: Sensitivity for building parameters and occupancy. Energy Build. 2015, 92, 216–233. [Google Scholar] [CrossRef]
  49. El Fouih, Y.; Stabat, P.; Rivière, P.; Hoang, P.; Archambault, V. Adequacy of air-to-air heat recovery ventilation system applied in low energy buildings. Energy Build. 2012, 54, 29–39. [Google Scholar] [CrossRef]
  50. Merzkirch, A.; Maas, S.; Scholzen, F.; Waldmann, D. Energy efficiency of centralized and decentralized ventilation units in residential buildigs—Specific fan power, heat recovery efficiency, shortcuts and volume flow unbalances. Energy Build. 2016, 116, 376–383. [Google Scholar] [CrossRef]
  51. Berg, F.; Flyen, A.-C.; Lund Godbolt, Å.; Brorström, T. User-driven energy efficiency in historic buildings: A review. J. Cult. Heritage 2017. [Google Scholar] [CrossRef]
  52. Torcellini, P.; Pless, S.; Deru, M.; Crawley, D. Zero Energy Buildings: A Critical Look at the Definition. In ACEEE Summer Study; National Renewable Energy Laboratory and Department of Energy: Pacific Grove, CA, USA, 2006. [Google Scholar]
  53. EQUA Simulation AB. IDA Indoor Climate and Energy. Available online: http://www.equa.se/en/ida-ice (accessed on 14 June 2015).
  54. EQUA Simulation AB. Validation of IDA Indoor Climate and Energy 4.0 with Respect to CEN Standard EN 15255-2007 and 15265-2007; EQUA Simulation AB: Solna, Sweden, 2010. [Google Scholar]
  55. EQUA Simulation AB. Validation of IDA Indoor Climate and Energy 4.0 Build 4 with Respect to ANSI/ASHRAE Standard 140-2004; EQUA Simulation AB: Solna, Sweden, 2010. [Google Scholar]
  56. Bergsten, B. Energiberäkningsprogram för Byggnader—En Jämförelse Utifrån Funktions- och Användaraspekter; Effektiv: Borås, Sweden, 2001. [Google Scholar]
  57. Sahlin, P.; Bring, A. IDA Solver—A tool for building and energy systems simulation. In Proceedings of the Building Simulation Conference, Nice, France, 20–22 August 1991. [Google Scholar]
  58. International Organization for Standardization (ISO). ISO 13789:2007 Thermal Performance of Buildings; International Organization for Standardization (ISO): Geneva, Switzerland, 2007. [Google Scholar]
  59. Sjögren, J.-U.; Andersson, S.; Olofsson, T. An approach to evaluate the energy performance of buildings based on incomplete monthly data. Energy Build. 2007, 39, 945–953. [Google Scholar] [CrossRef]
  60. Sjögren, J.-U.; Andresson, S.; Olofsson, T. Sensitivity of the total heat loss coefficient determined by the energy signature approach to different time periods and gained energy. Energy Build. 2009, 41, 801–808. [Google Scholar] [CrossRef]
  61. Belussi, L.; Danca, L. Method for the prediction of malfunctions of buildings through real energy consumption analysis: Holistic and multidisciplinary approach of Energy Signature. Energy Build. 2012, 55, 715–720. [Google Scholar] [CrossRef]
  62. Ghiaus, C. Experimental estimation of building energy performance by robust regression. Energy Build. 2006, 38, 582–587. [Google Scholar] [CrossRef]
  63. Danov, S.; Carbonell, J.; Cipriano, J.; Marti-Herrero, J. Approaches to evaluate building energy performance from daily consumption data considering dynamic and solar gain effects. Energy Build. 2013, 57, 110–118. [Google Scholar] [CrossRef]
  64. Westergren, K.-E.; Högberg, H.; Norlén, U. Monitoring energy consumption in single-family houses. Energy Build. 1999, 29, 247–257. [Google Scholar] [CrossRef]
  65. Wei, G.; Liu, M.; Claridge, E. Signatures of heating and cooling energy consumption for typical AHUs. In Proceedings of the Eleventh Symposium on Improving Building Systems in Hot and Humid Climates, Fort Worth, TX, USA, 1–2 June 1998. [Google Scholar]
  66. Hammarsten, S. A critical appraisal of energy-signature models. Appl. Energy 1987, 26, 97–110. [Google Scholar] [CrossRef]
  67. Lidelöw, S.; Munck, K.F. Byggentreprenörens Energisignatur; NCC Construction Sverige och Luleå Tekniska Universitet: Luleå and Malmö, Sweden, 2015. [Google Scholar]
  68. Vesterberg, J.; Andersson, S.; Olofsson, T. A single-variate building energy signature approach for periods with substantial solar gain. Energy Build. 2016, 122, 185–191. [Google Scholar] [CrossRef]
  69. Meteonorm. METEOTEST. Available online: http://meteonorm.com/ (accessed on 15 February 2017).
  70. EQUA Simulation AB. User Manual—IDA Indoor Climate and Energy—Version 4.5; Solna, Sweden, 2013. [Google Scholar]
  71. Schild, P.; Mysen, M. Technical Note AIVC 65—Recommendations on Specific Fan Power and Fan System Efficiency; Air Infiltration and Ventilation Centre: Sint-Stevens-Woluwe, Belgium, 2009. [Google Scholar]
  72. LIP kansliet. Tekniktävling—Teknikupphandling av Energiberäkningsmodell för Energieffektivt Sunda Flerbostadshus (MEBY); LIP kansliet: Stockholm, Sweden, 2002. [Google Scholar]
  73. Energimyndigheten. Available online: http://www.energimyndigheten.se/tester/tester-a-o/pelletspannor/ (accessed on 15 February 2017).
  74. Che, D.; Liu, Y.; Gao, C. Evaluation of retrofitting a conventional natural gas fired boiler into a condensing boiler. Energy Convers. Manag. 2004, 45, 3251–3266. [Google Scholar] [CrossRef]
Figure 1. The main phases of the method used.
Sustainability 09 01877 g001
Figure 2. Daily global solar irradiance (W/m2) in Umeå, average for the time period 2008–2016.
Sustainability 09 01877 g002
Figure 3. (a) View of the multi-family building; and (b) elevation drawing of the multi-family building.
Sustainability 09 01877 g003
Figure 4. Best- and worst-case scenarios for the groups of parameters related to the: (a) building envelope; (b) technical installations; (c) building operation; and (d) user behavior.
Sustainability 09 01877 g004aSustainability 09 01877 g004b
Figure 5. Variations from the reference scenario for the five indicators, when all studied parameters related to operation and user behavior were varied to their extremes at the same time.
Sustainability 09 01877 g005
Table 1. The 15 parameters found to influence the energy performance of residential buildings in cold climate.
External ConditionsBuilding EnvelopeTechnical InstallationsBuilding OperationUser Behavior
P1. Climate [24]P2. Form factor (envelope area/volume) [46]
P3. Window to floor area ratio [46]
P4. Average U-value [47,48]
P5. Envelope air leakage @ 50 Pa [47]
P6. Heating system a
P7. Ventilation heat recovery efficiency [49]
P8. Specific fan power [49]
P9. Indoor temperature [48]
P10. Ventilation rate [21,48]
P11. Supply to exhaust air rate ratio [50]
P12. Energy use for household appliances [21]
P13. Energy use for domestic hot water [51]
P14. Number of occupants [21]
P15. Airing (by opening windows) [51]
a For space heating and domestic hot water. The system boundary of energy performance indicators may include the performance of the heating system [52], which then would influence the building energy performance.
Table 2. Input data used in the reference scenario.
ParameterValueSource/Comment
External conditions
Climate dataUmeå1961–1990Average values 1961–1990 [69]. Yearly average temperature 4.00 °C.
Wind profileSuburban[70]
Building envelope
Envelope area1847 m2From blueprints.
Heated floor area1495 m2Heated above 10 °C. From blueprints.
Volume3952 m3From blueprints.
Form factor0.47Envelope area to volume ratio.
Window to floor area ratio16.3%From blueprints.
Average U-value0.307 W/m2KExternal walls 0.127 W/m2K. Roof 0.0810 W/m2K. Foundation 0.238 W/m2K. Windows 1.20 W/m2K. From blueprints. Thermal bridges assumed to 72.4 W/K, representing typical values [70].
Envelope air leakage at 50 Pa0.6 L/smenv2Highest allowed for buildings with less than 100 m2 floor area, with a window area smaller than 20% of the heated floor area and with no space cooling according to BBR [22].
Technical installations
Heating systemDistrict heatingFor space heating and domestic hot water. From tender documents. Assumed to have 100% efficiency, since the heat not transferred to the buildings heating system returns to the district heating system. Heat losses from the internal heating system assumed to 4% of the delivered space heating energy, 50% contributing to space heating, representing typical values [70].
Ventilation systemA supply- and exhaust system with heat recovery. A rotary heat exchanger with 80% temperature efficiency.From tender documents. Supply air duct heat loss assumed to be 1.16 W/m2 at a 7 °C temperature difference between duct and zone, 50% contributing to space heating, representing typical values [70].
Specific fan power2 kW/(m3/s)Requirement for heat recovery ventilation systems (HRV) in BBR [22] Ventilation fan efficiency assumed to 60%, representing typical values [71].
ElevatorGearless traction elevatorFrom tender documents. Using 50 kWh per apartment and year [72].
Lighting in common areas11 fluorescent lamps, each emitting 25 W
16 h/day
Assumption.
Building operation
Indoor temperature22 °C[22] Used as supply air temperature set-point for the ventilation heat exchanger, to allow for maximum heat recovery.
Ventilation rate0.35 L/sm2[22]
Supply to exhaust air rate ratio1Supply air rate = exhaust air rate. Assumption.
User behavior
Energy for household appliances3.42 W/m270% becomes internal heat gains [23].
Energy for domestic hot water25 kWh/m2 year20% becomes internal heat gains [23].
Number of occupants40Emitting 80 W each 14 h/day [23].
Airing0.5 L/smenv2By opening windows [23].
Table 3. Studied parameter variations in the best- and worst-case scenarios, additionally studied parameter variations listed in the footnotes.
ParametersBest-Case ScenarioWorst-Case Scenario
Building envelope
P2. Form factor (nr. of floors)0.39 (8 floors, 47 apartments, 82 occupants, 2807 m2 heated floor area, and an average U-value of 0.35 W/m2K.)0.52 (3 floors, 17 apartments, 30 occupants, 1167 m2 heated floor area, and an average U-value of 0.29 W/m2K.)
P3. Window to floor area ratio (%)10 (the recommended minimum in BBR [22].)20
P4. Average U-value (W/m2K)0.200.40 (maximum allowed in BBR [22].)
P5. Envelope air leakage @ 50 Pa a (L/smenv2)0.3 (required in the Swedish passive house criteria [44].)0.9
Technical installations
P6. Heating system bHP (with a COP factor of 5 for heating and 3 for domestic hot water.)PB (with an efficiency of 80%, the average of 11 pellet boilers used in Sweden [73].)
P7. Ventilation heat recovery efficiency a (%)9070 (recommended minimum in BBR [22].)
P8. Specific fan power a (kW/(m3/s))1.52.5)
Building operation
P9. Indoor temperature a (°C)2123
P10. Ventilation rate a (L/sm2)0.25 (representing a lower ventilation need e.g., due to demand control).0.45 (representing a higher ventilation need e.g., due to air contaminants.)
P11. Supply to exhaust air rate ratio a,c-1.05 (supply air rate 105% of exhaust air rate.)
User behavior
P12. Energy use for household appliances a,d (W/m2)4.42.4
P13. Energy use for domestic hot water a (kWh/m2 year)2030
P14. Number of occupants a,d6020
P15. Airing a (L/smenv2)0.250.75
a Varied symmetrically around the reference value. b DH + S (60 m2 solar collectors with a conversion factor of 75%), and NGB (with an efficiency of 90% representing a condensing boiler [74]) was also studied. c A supply to exhaust air rate ratio of 0.95 (supply air rate 95% of exhaust air rate), creating a small under pressure to avoid moisture problems, was also studied. d More internal heat gains result in less space heating being required.
Table 4. The most important issues identified when specific purchased energy (I7) was used to set criteria in the building procurement process.
Category of IssuesIssuesNumber of Respondents
1st rank within Each Category1st Rank Overall
Requirements on specific purchased energyTough requirements on purchased energy requirements and possible fines are risky, since it is not possible to control all factors that influence building’s energy performance.85
To ensure compliance with the energy efficiency requirements, a substantial safety margin is required due to the various factors that may cause uncertainty.41
Uncertainties and
responsibility
Purchased energy is significantly affected by the users’ behavior46
Fixing the liability/responsibility is ambiguous in situations when the energy requirement is not met34
Operating times, ventilation, and indoor temperatures as well as envelope air leakage and airing are factors that have a major impact on the purchased energy.35
Verification methodWith improper follow-up, competition in procurement can be distorted when accounting for the promised performance and the one stickler for the rules may find it difficult to win projects against unscrupulous competitors.86
It is problematic to do the follow-up during the first years when the building is not dried out properly and control of the installations have not been optimized.53
Parameters influencing the purchased energyThe heating source and heating system efficiency affects the amount of purchased energy (heat pumps and solar panels are favored).65
Hot water usage is increasing with more people/m2, despite better installations.43
Table 5. The indicator deviations from the reference scenario in percent, for each parameter variation.
ParametersReferenceVariationsIndicators
I3.I4.I5.I6.I7.
Average U-ValueSHLWDTLSpecific Net EnergySpecific Purchased Energy
(W/m2K)(W/m2K)(kWh/°C)(kWh/m2)(kWh/m2)
External conditions
P1. Climate dataUmeå1961-1990Umeå2000-2009±0%±0%−0.94%−1.6%−1.6%
Building envelope
P2. Form factor (no. of0.470.39+13%−16%+84%−4.9%−4.85%
floors) 0.52−6.6%+1.3%−21%+3.1%+3.1%
P3. Window to floor16.310−19%−9.2%−16%−10%−10%
area ratio (%) 20+11%+8.0%+9.9%+5.7%+5.7%
P4. Average U-value0.310.2−34%−25%−25%−22%−22%
(W/m2K) 0.4+32%+22%+25%+24%+24%
P5. Envelope air leakage @ 50 Pa0.60.3±0%−5.9%−0.75%−1.8%−1.8%
(L/smenv2) 0.9±0%+6.0%+0.71%+1.8%+1.8%
Technical installations
P6. Heating systemDHHP±0%±0%−80%±0%−67%
DH + S±0%±0%+0.64%±0%−15%
NGB±0%±0%+9.9%±0%+6.5%
PB±0%±0%+25%±0%+22%
P7. Ventilation heat recovery efficiency (%)8090±0%−8.0%−8.8%−7.4%−7.4%
70±0%+8.0%+9.1%+7.6%+7.6%
P8. Specific fan power21.5±0%±0%−0.12%−2.4%−2.4%
(kW/(m3/s)) 2.5±0%±0%+0.084%+2.4%+2.4%
Building operation
P9. Indoor temperature2221±0%−2.4%±0%−4.7%−4.7%
(°C) 23±0%+2.4%±0%+4.9%+4.9%
P10. Ventilation rate0.350.25±0%−4.6%−6.4%−7.3%−7.3%
(L/sm2) 0.45±0%+4.6%+6.5%+7.3%+7.23%
P11. Supply to exhaust10.95±0%−5.3%−0.42%−0.49%−0.49%
air rate ratio 1.05±0%+1.9%+5.2%+3.4%+3.4%
User behavior
P12. Energy for household appliances3.424.4±0%±0%±0%−5.7%−5.7%
(W/m2) 2.4±0%±0%±0%+6.0%+6.0%
P13. Energy for domestic hot water2520±0%±0%±0%−8.1%−8.1%
(kWh/m2) 30±0%±0%±0%+7.7%+7.7%
P14. Number of4060±0%±0%−0.19%−1.1%−1.1%
occupants 20±0%±0%+0.30%+5.4%+5.4%
P15. Airing (L/sm2)0.50.25±0%±0%−0.60%−1.5%−1.5%
0.75±0%±0%+0.60%+1.5%+1.5%
Table 6. The studied indicators potential to meet the needs of the Swedish building practitioners in the procurement process of multi-family buildings.
Studied IndicatorsPreferred by the Building PractitionersLess Dependent of Building Operation and User Behavior Compared to the Specific Purchased Energy (I7)Less Dependent of the Technical Installations Compared to the Specific Purchased Energy (I7)
For calculation based evaluations
U-values for different building parts (I2)XX aX b
Average U-value (I3)XX acX b
SHLWDT (I4)XX cX c
L (I5)-X cX c,d
Specific net energy (I6)--X c
Specific purchased energy (I7)---
For measurement based evaluations
Envelope air leakage (I1)XX aX b
L (I5)-X cX c,d
Specific net energy (I6)--X c
Specific purchased energy (I7)---
a Inherently independent of the building operation and user behavior. b Inherently independent of the building operation and buildings technical installations. c Based on case study. d If evaluated based on net energy data.

