Article

Assessment of Phosphorus Recovery from Swine Wastewater in Beijing, China

Beijing Key Laboratory of Farmland Soil Pollution Prevention and Remediation, Key Laboratory of Plant-Soil Interactions of Ministry of Education, Biomass Engineering Center, College of Resources and Environmental Sciences, China Agricultural University, Beijing 100193, China
*
Author to whom correspondence should be addressed.
These authors contributed equally to this work.
Sustainability 2017, 9(10), 1845; https://doi.org/10.3390/su9101845
Submission received: 6 October 2017 / Revised: 10 October 2017 / Accepted: 11 October 2017 / Published: 13 October 2017

Abstract

:
The nutrient management of phosphorus (P) contained in swine wastewater is an important challenge to enhance P use efficiency. In the present study, assessment of P recovery from swine wastewater in Beijing was performed. P amounts of swine wastewater increased from 11,687 tons in 1980 to 16,237 tons in 2014. Without treatment of swine wastewater, P concentration will reach a maximum 1.20 mg/L. The maximum P recovery was 99.36% under the condition of crystallization coupled BPR (biological phosphorus removal) when the operating conditions were 60.6 mg/L for Cp (initial P concentration (mg/L)), 1.2 for Mg/P (magnesium-to-P molar ratio), 9.7 for pH of crystallization process, and 8.0 for pH, 1.6 h for anaerobic stage time, 15 days for sludge retention time of BPR. The P concentration for water quality was 0.03 mg/L to meet the water regulation standard. Under this situation, if the target P concentration were set as Grade II and III, pig breeding numbers reached 42.07 and 95.90 million heads. Construction investments for the crystallization, BRP, and coupled methods are 411 (104 Yuan, 604,307 USD), 301 (104 Yuan, 442,580 USD), and 551 (104 Yuan, 810,170 USD), respectively. The running costs are 15.205 (104 Yuan/year, 22,360 USD/year), 28.907 (104 Yuan/year, 42,500 USD/year) and 44.112 (104 Yuan/year, 64,860 USD/year). To manage non-point pollution, swine wastewater treatment facilities should be used and pig breeding numbers should be managed within reasonable ranges.

1. Introduction

Phosphorus (P) is an essential element that makes a major contribution to energy transport and the growth of organisms. It plays an especially critical role in global food production. To fulfill the enormous demand of food, P consumption derived from phosphate rock has greatly increased [1]. Ironically, wasting of P occurs all over the world because of low phosphorus use efficiency (PUE), which is believed to be one of the main reasons for water eutrophication [2]. In recent years, various studies have focused on identifying low PUE sectors, controlling of P losses, or recoveries [3]. It has been reported that the global livestock sector is considered one of the main contributors to serious global environmental problems [4]. PUE of the livestock sector is low [5], and causes a high risk of losing P to the environment. Cordell et al. [6] even found that P discharge by livestock production is 60 times that of people in Australia.
PUE of the livestock sector in China was only 7% [4]. One important reason for this low PUE is that since modern market-oriented farming gradually replaced traditional self-efficient farming, the increasing need for pork and use of animal feed promoted the development of intensive farming, particularly around large cities such as Beijing, Shanghai and Guangzhou. The popular peri-urban “industrial” livestock system relies on outside supplies, such as feed, energy and other inputs. This led to the supply of nutrients in livestock manure frequently exceeding crop needs [7]. Further, a lack of waste disposal land and absence of regulation led to disordered discharge of manure waste into the environment. In particular, owing to surface runoff and leaching, swine wastewater discharge to water bodies causes serious eutrophication in China. At present, the construction of China’s environmental laws, regulations and techniques is always dominated by cities. The discharge and treatment of manure wastewater need a variety of more mature technology and to meet the basic national conditions of China. To prevent environmental contamination from affecting social life, agricultural pollution around the cities must be controlled. The China First National Pollution Source Census Bulletin showed that 67.4% of total P discharge into the water environment in 2007 owed to agricultural source pollution. A key challenge is sustainable use of the liquid fraction of manure waste [8], such as swine wastewater. Therefore, there is a pressing need for treatment of that wastewater and P recovery.
Generally, pollution related to agricultural sources is often of the non-point type. Nonetheless, intensive livestock production can be regarded as a point source, and actions to reduce total P emission may be cost-effective and urgent [8,9]. Different treatment technologies including biological, physical, and chemical or a combination of these methods have been employed to treat swine wastewaters and P recovery [1,10,11]. Among these processes, biological phosphorus removal (BPR) is used to fix phosphorus into sludge and recommended for its less energy and cost [12]. The sequencing batch reactor (SBR) has been proven to be a very flexible tool for the treatment of swine wastewater, which performs in the removal of organic carbon, nitrogen and phosphate [13]. Deng et al. [14] investigated the performance of SBR during treatment of swine wastewater and promoted the removal rate of total phosphorus. Struvite (MgNH4PO4) crystallization, unlike most other methods (e.g., chemical precipitation and adsorption), can immobilize the sludge, and does not produce secondary waste requiring further management. Liu et al. [15] used a newly designed unit process of struvite crystallization to recover 65% and 67% of total P and total nitrogen in the sediment from swine wastewater. Crystal products, struvite, can be used as an effective slow-release fertilizer, and not only recovers P but also reduces its loss to water bodies, and is therefore definitely a sustainable technique [16]. Both BRP and struvite crystallization transfer the phosphorus from the liquid phase to the solid phase.
There are many related studies of struvite crystallization or biological nutrient removal processes for P removal from swine wastewater. Few studies have focused on the relationship between P removal efficiency and controlling parameters, and the environmental benefits of macroscopic swine wastewater treatment. Thus, water environmental capacity is chosen to evaluate environmental effects. However, accurate assessment of water quality in a certain region needs abundant data, including long-term hydrologic and water quality data, for most watersheds. This is often complicated, representing a complex data-mining and time-consuming task. Besides, long-term hydrologic and water quality data for most watersheds is difficult for water quality assessment in China. Therefore, to simplify assessment, one-dimensional water quality models have been used to evaluate water quality [17]. It is also important to measure some other parameters when assessing the water environment. For example, some mathematical models (Nutrient flows in food chains, environment and resources use (NUFER) model, Phosphorus recovery efficiency (PRE) model, and so on) could be used to calculate the emissions of P in different pig production systems [18,19]. The use of mathematical models can predict scientific facts and help people grasp the whole features or structures of the problem more comprehensively and systematically. In addition, it is possible to avoid or reduce experiments that are expensive or impossible for specific real-world problems. Zhang et al. [20] fitted a quadratic equation to evaluate different scenarios for the sustainable production of algal biomass and biofuels in swine wastewater in North Carolina. However, there are some limitations. For example, it is difficult to incorporate all the influencing factors into the calculation, which may result in statistical deviation.
In this paper, we first analyze P produced from swine wastewater trends and predict future amounts. Then, P removal efficiency models and a water quality model are used to evaluate effects on the environment by discharged P from swine wastewater. Finally, the cost of swine wastewater treatment is evaluated. The aim was to evaluate technical feasibility, economic and environmental benefits of P removal from the wastewater.

2. Materials and Methods

2.1. Basic Data Collection and Phosphorus Estimation

The amount of manure produced by pigs in Beijing was calculated by the coefficient method, using Equation (1). Pig number data for Beijing were collected from the China Statistical Yearbook and Yearbook of Chinese Animal Husbandry (Supplementary Materials, Section 1). Coefficients were obtained from related research [21] and are shown in Table 1. As the Chinese feed ratio, feeding technology and situation are different from Europe and other regions, the coefficients are different.
Q = NTM
where Q stands for manure amount (kg), N represents the pig breeding number (head), T is the breeding cycle (day), and M is the manure amount produced by one pig per day (kg/day).
The P amount contained in manure was calculated by
A = Nα
where A is the P amount produced by pigs in the Beijing area (kg), N represents the pig breeding number (head), and α is a coefficient represents the total P produced by one pig over an entire breeding cycle.
To successfully achieve P recovery/removal by crystallization or BPR, it is necessary to perform solid–liquid separation and enhance total solid removal efficiency [22]. After separation, the solid fraction can be used for animal feed, compost production, energy generation, or as a high-value product for soil amelioration [23]. According to previous studies, mechanical separation together with chemical additives can have a strong separation effect, and 20% of total P remains in the liquid fraction [24]. Treatment of the liquid fraction of swine wastewater is important because the pollutants such as P often exceed legal limit. The P discharge amount was calculated by the coefficient method (Table 1). Coefficients were assumed to remain constant. Amounts of both P discharge and pig feed were predicted. Four mathematical models were used to estimate P in swine wastewater in the near future, i.e., the average growth rate, linear fit, logistic, and G.M. (1.1) gray models, respectively (Supplementary Materials, Section 2). The average growth rate model assumes that pig demand in Beijing will continuously increase at the average rate of the past. The linear fit model simply regards the pig increase in Beijing as linear. The logistic model is different: it consists of many factors and assumes a limitation on pig demand in Beijing. The G.M. (1.1) model assumes that predicted variables are complicated and that there are many uncertainties.

2.2. Phosphorus Recovery Potential Analysis

Treatments such as crystallization, BPR and BPR-coupled crystallization have been used in scenario analysis of potential P recovery in swine wastewater management. Phosphorus recovery efficiency (PRE) was selected as an indicator for identifying the treatment. PRE is defined as the P removal rate of a certain technique and equals the recovered P to total P ratio. Here, JMP software version 10.0.0 was used to establish PRE models. A core function of JMP is to establish fitting models. This can help construct model variables and various calculation methods. In the present work, principal component analysis (PCA), least squares method (LSM), and statistical analysis system (SAS) were used by JMP to establish potential PRE models.
For the struvite crystallization, three dominant factors, the magnesium-to-P ratio, pH and initial P concentration [25], were used to evaluate PRE based on literature data (Supplementary Materials, Section 4). The model is expressed as follows.
R = 118.89 + 18.95 × pH + 18.97 × Mg / P + 0.14 × C p 9.92 × ( pH 8.90 ) 2 + 2.73 × ( pH 8.90 ) ( Mg / P 1.31 ) 12.89 × ( Mg / P 1.31 ) 2 0.03 × ( pH 8.90 ) ( C p 101.36 ) 0.09 × ( Mg / P 1.31 ) ( pH 8.90 ) 2 22.36 × ( pH 8.90 ) ( Mg / P 1.31 ) 2 0.23 × ( C p 101.36 ) ( Mg / P 1.31 ) 2
where R represents PRE (%), Mg/P stands for the magnesium-to-P molar ratio, and Cp is the initial P concentration (mg/L). R2 was 0.778 in the model.
For BPR, i.e., the sequencing batch reactor, many factors have been reported to affect P removal such as wastewater composition, influent COD:N:P ratio, pH, temperature, SRT, etc.. Here, pH, AST and SRT [26] were chosen as the three dominant factors to establish the PRE model based on literature (Supplementary Materials, Section 4). The model is expressed as follows.
R = 87.11 + 1.42 × pH + 4.04 × AS T 0.65 × SRT 22.59 × ( pH 7.77 ) 2 20.29 × ( pH 7.77 ) × ( AS T 2.41 ) 8.49 × ( AS T 2.41 ) 2
where R represents PRE (%), pH is the solution pH value during reaction; AST stands for the anaerobic stage time (hour); and SRT represents the sludge retention time (day). R2 was 0.998 in this model.

2.3. Water Environment Capacity Analysis

A one-dimensional water quality model selected from “code of practice for computation on allowable permitted assimilative capacity of water bodies (GB/T 25173-2010)” was used to evaluate the water environment capacity in the Beijing area. Generally, the pollutant concentration in control section cx is derived from the Streeter–Phelps model and is expressed as
c x = c 0 exp ( kx u )
where cx stands for pollutant concentration of the control section (mg/L), x is the distance between the control and background sections (km), k is the pollutant attenuation coefficient (L/day), and u is the flow speed of the river (m/s).
Generally, pollutants are discharged along the river and there are uncertainties in the number of drain outlets. Therefore, during calculation, these outlets were simplified as one outlet in the middle of the river, so the length of self-purification of pollutants is half the river length. If that length is L, then the pollutant concentration along it is expressed as
c = c 0 exp ( k L u ) + w q r exp ( k L 2 u )
After derivation of the previous equation, water environment capacity is expressed as
w = [ c c 0 exp ( k L u ) ] exp ( k L 2 u ) q r
where w indicates water environment capacity (kg/d), c is the final pollutant concentration (mg/L), and qr is the design flow of a given river (m3/s).
During the calculation, the Beijing river system was simplified to five rivers, i.e., the Chaobai, Jiyun, Beiyun, Yongding and Daqing (Supplementary Materials, Section 3). Then, the Beijing water environment capacity was assumed to be the total such capacity of those five rivers. Lengths of various rivers in the Beijing area were measured using Google Earth and their flow data were acquired from the Beijing Water Affairs Bureau [27]. The calculation was based on the following assumptions. Beijing was considered an entire calculation unit and no more detailed water function zones were determined. The municipal and industrial wastewater discharge amount was assumed the same in 2030 as in 2010 under the assumption that the development of the city will depend less and less on population increase. The attenuation coefficient of P for the five rivers was 0.12–1/day and their flow speed was 0.9 m/s [28,29]. Basic parameters and coefficients remained constant between 2010 and 2030.

3. Results and Discussion

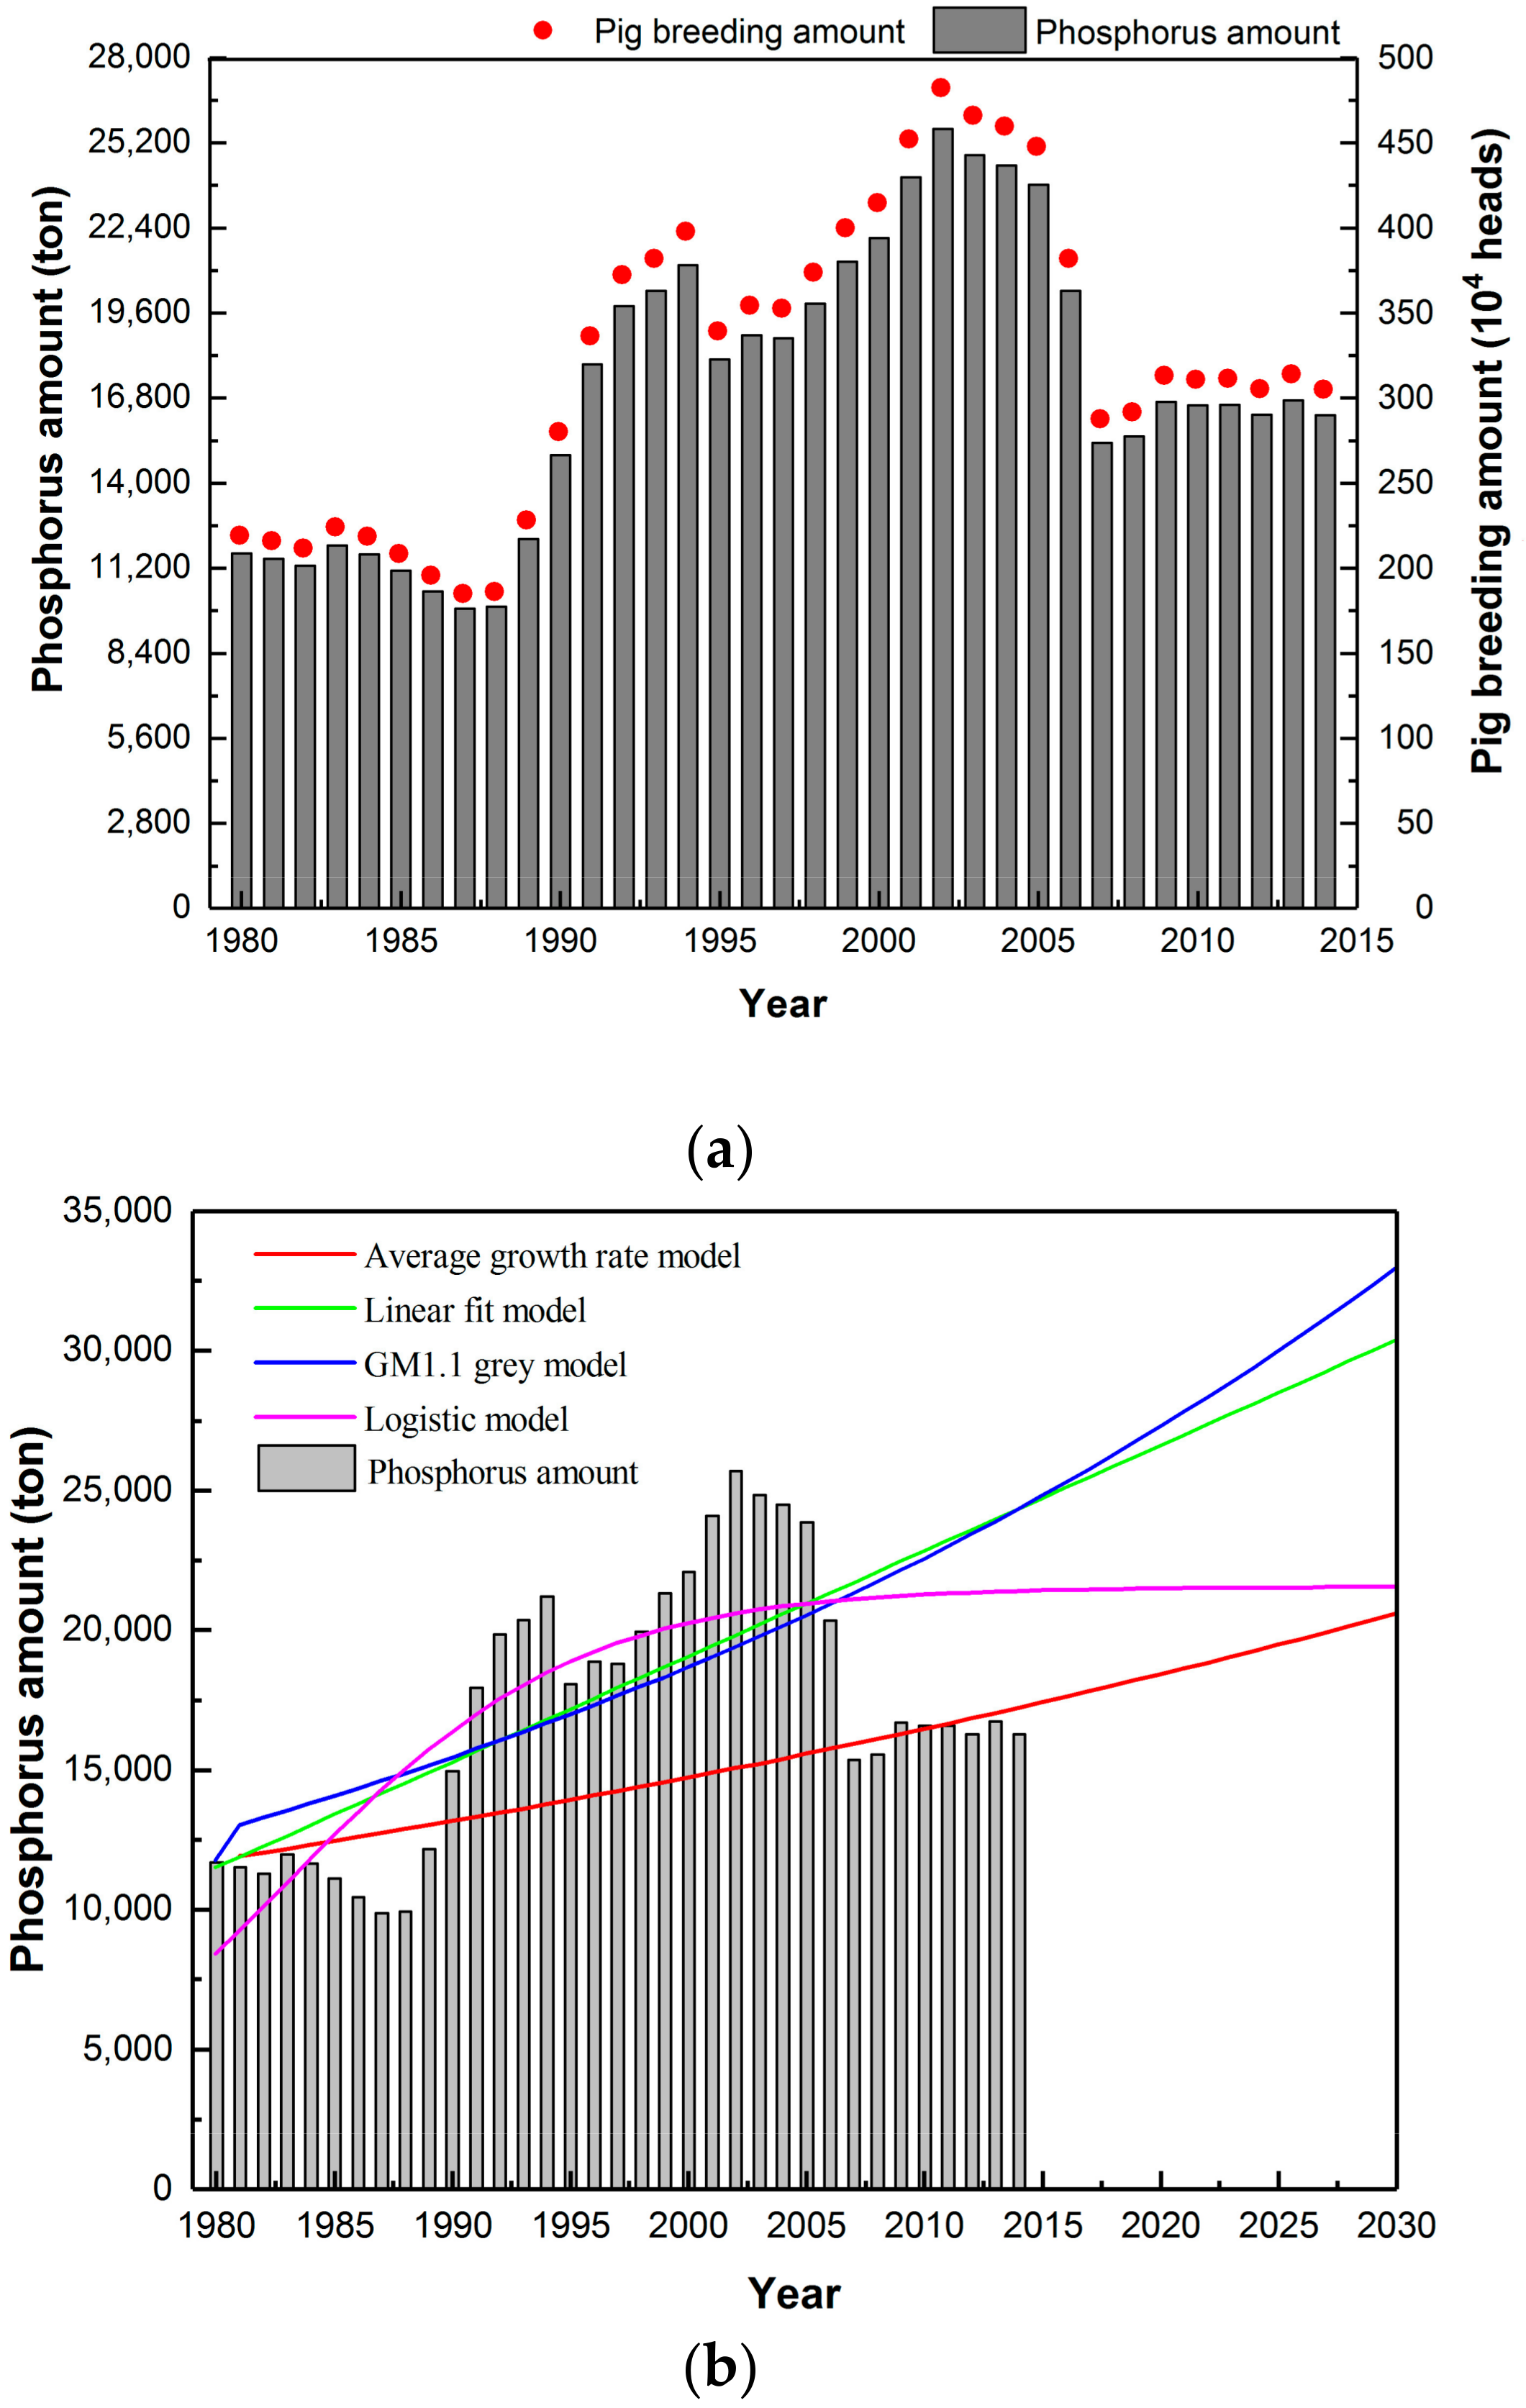
3.1. Phosphorus Estimation

The P amount contained in swine wastewater in Beijing from 1980 to 2014 was calculated. The calculation used the coefficients method. The discharge coefficients were kept constant from 1980 to 2014. As a result, the trend of P in the wastewater was the same as that of the pig breeding number.
As shown in Figure 1a, the pig breeding number increased from 220.1 × 10⁴ heads in 1980 to 305.80 × 10⁴ heads in 2014, resulting about 38.9% increase. Under conditions of the market economy, the fluctuation of that number conformed to market rules and benefits from industry adjustment [30]. Because pork prices were controlled by the government and undeveloped economy of the 1980s, the pig breeding number and P amount remained steady. The opening of a meat market in 1985 together with the “Shopping Basket Program” in 1988 promoted the animal protein market, increasing the pig breeding number and thereby strongly increasing the P amount. A sharp increase in pork prices during 1995 (from 16 to 28 Yuan/kg) and the 2003 outbreak of Severe Acute Respiratory Syndromes disease in China had enormous impacts on the animal protein market, accompanied by a decrease in pig breeding number. Thus, the P amount also decreased dramatically. It should be noted that, since 2007, the way in which statistical livestock data have been collected has changed with some differences in definitions of livestock categories; hence, the apparent “dip” in numbers in that year [8]. In general, the need for pork will increase but the pig breeding industry can be affected by factors such as policy, price, feed and sudden events. Therefore, the pig breeding number and P amount in swine wastewater has a volatile growth trend.
Swine wastewater produced by intensive pig farms contributes substantially to water eutrophication [8]. In recent years, most swine pollution treatment focuses on COD and NH4+-N removal [31]. However, P is also an important factor for swine wastewater that relates to water environment security. Therefore, the prediction of future P amounts contained in swine wastewater is important for potential P recovery estimation. With an increase in the population of China and change of dietary preferences toward livestock products, the consumption of such products per capita will increase [21]. This will require greater livestock production and generate more swine wastewater. This has broad and long-term implications for human health, economic development, and environmental protection [8].
According to Figure 1b, the four mathematical models, G.M (1.1) gray model, linear fit model, average growth model, and logistic model, were used to predict P amount in the near future. The G.M (1.1) gray model indicated a pig breeding number 6.18 million and 32,907 ton of swine wastewater P amount by 2030. The linear fit model is one of simple linear regression. It predicted a breeding number of 5.70 million and swine wastewater P amount of 30,322 ton by 2030. Both the G.M (1.1) gray model and linear fit model predicted that the P discharge amount would continue to increase. The average growth model shows a continual increase of pig breeding number. The average growth rate was 1.011%, so there would be 3.86 million head by 2030, with corresponding swine wastewater P amount of 20,535 ton. The results from the logistic model are 4.04 million head and 21,481 ton of P amount in swine wastewater. A rapid increase in the gross national income and population of China has elevated the demand for livestock products [4].
According to a report by IIASA [32], meat demand in the country will increase to 99.7 Mt by 2030, a nearly 30% increase over the year 2010. UN Food and Agriculture Organization statistics also suggest that the demand for meat will continue to increase through 2030, after which it will remain steady because of a stabilized population [8]. Therefore, there are larger deviations of predicted results of the G.M (1.1) gray and linear fit models than those of the average growth and logistic models. To find more a reliable model, the predictions were compared with statistics. Table 2 shows parameters of the G.M (1.1) gray, linear fit, average growth and logistic models, whose deviations were 22%, 21.39%, 18.27% and 16.80%, respectively. The deviation of the logistic model was smallest and its result is considered more reliable.

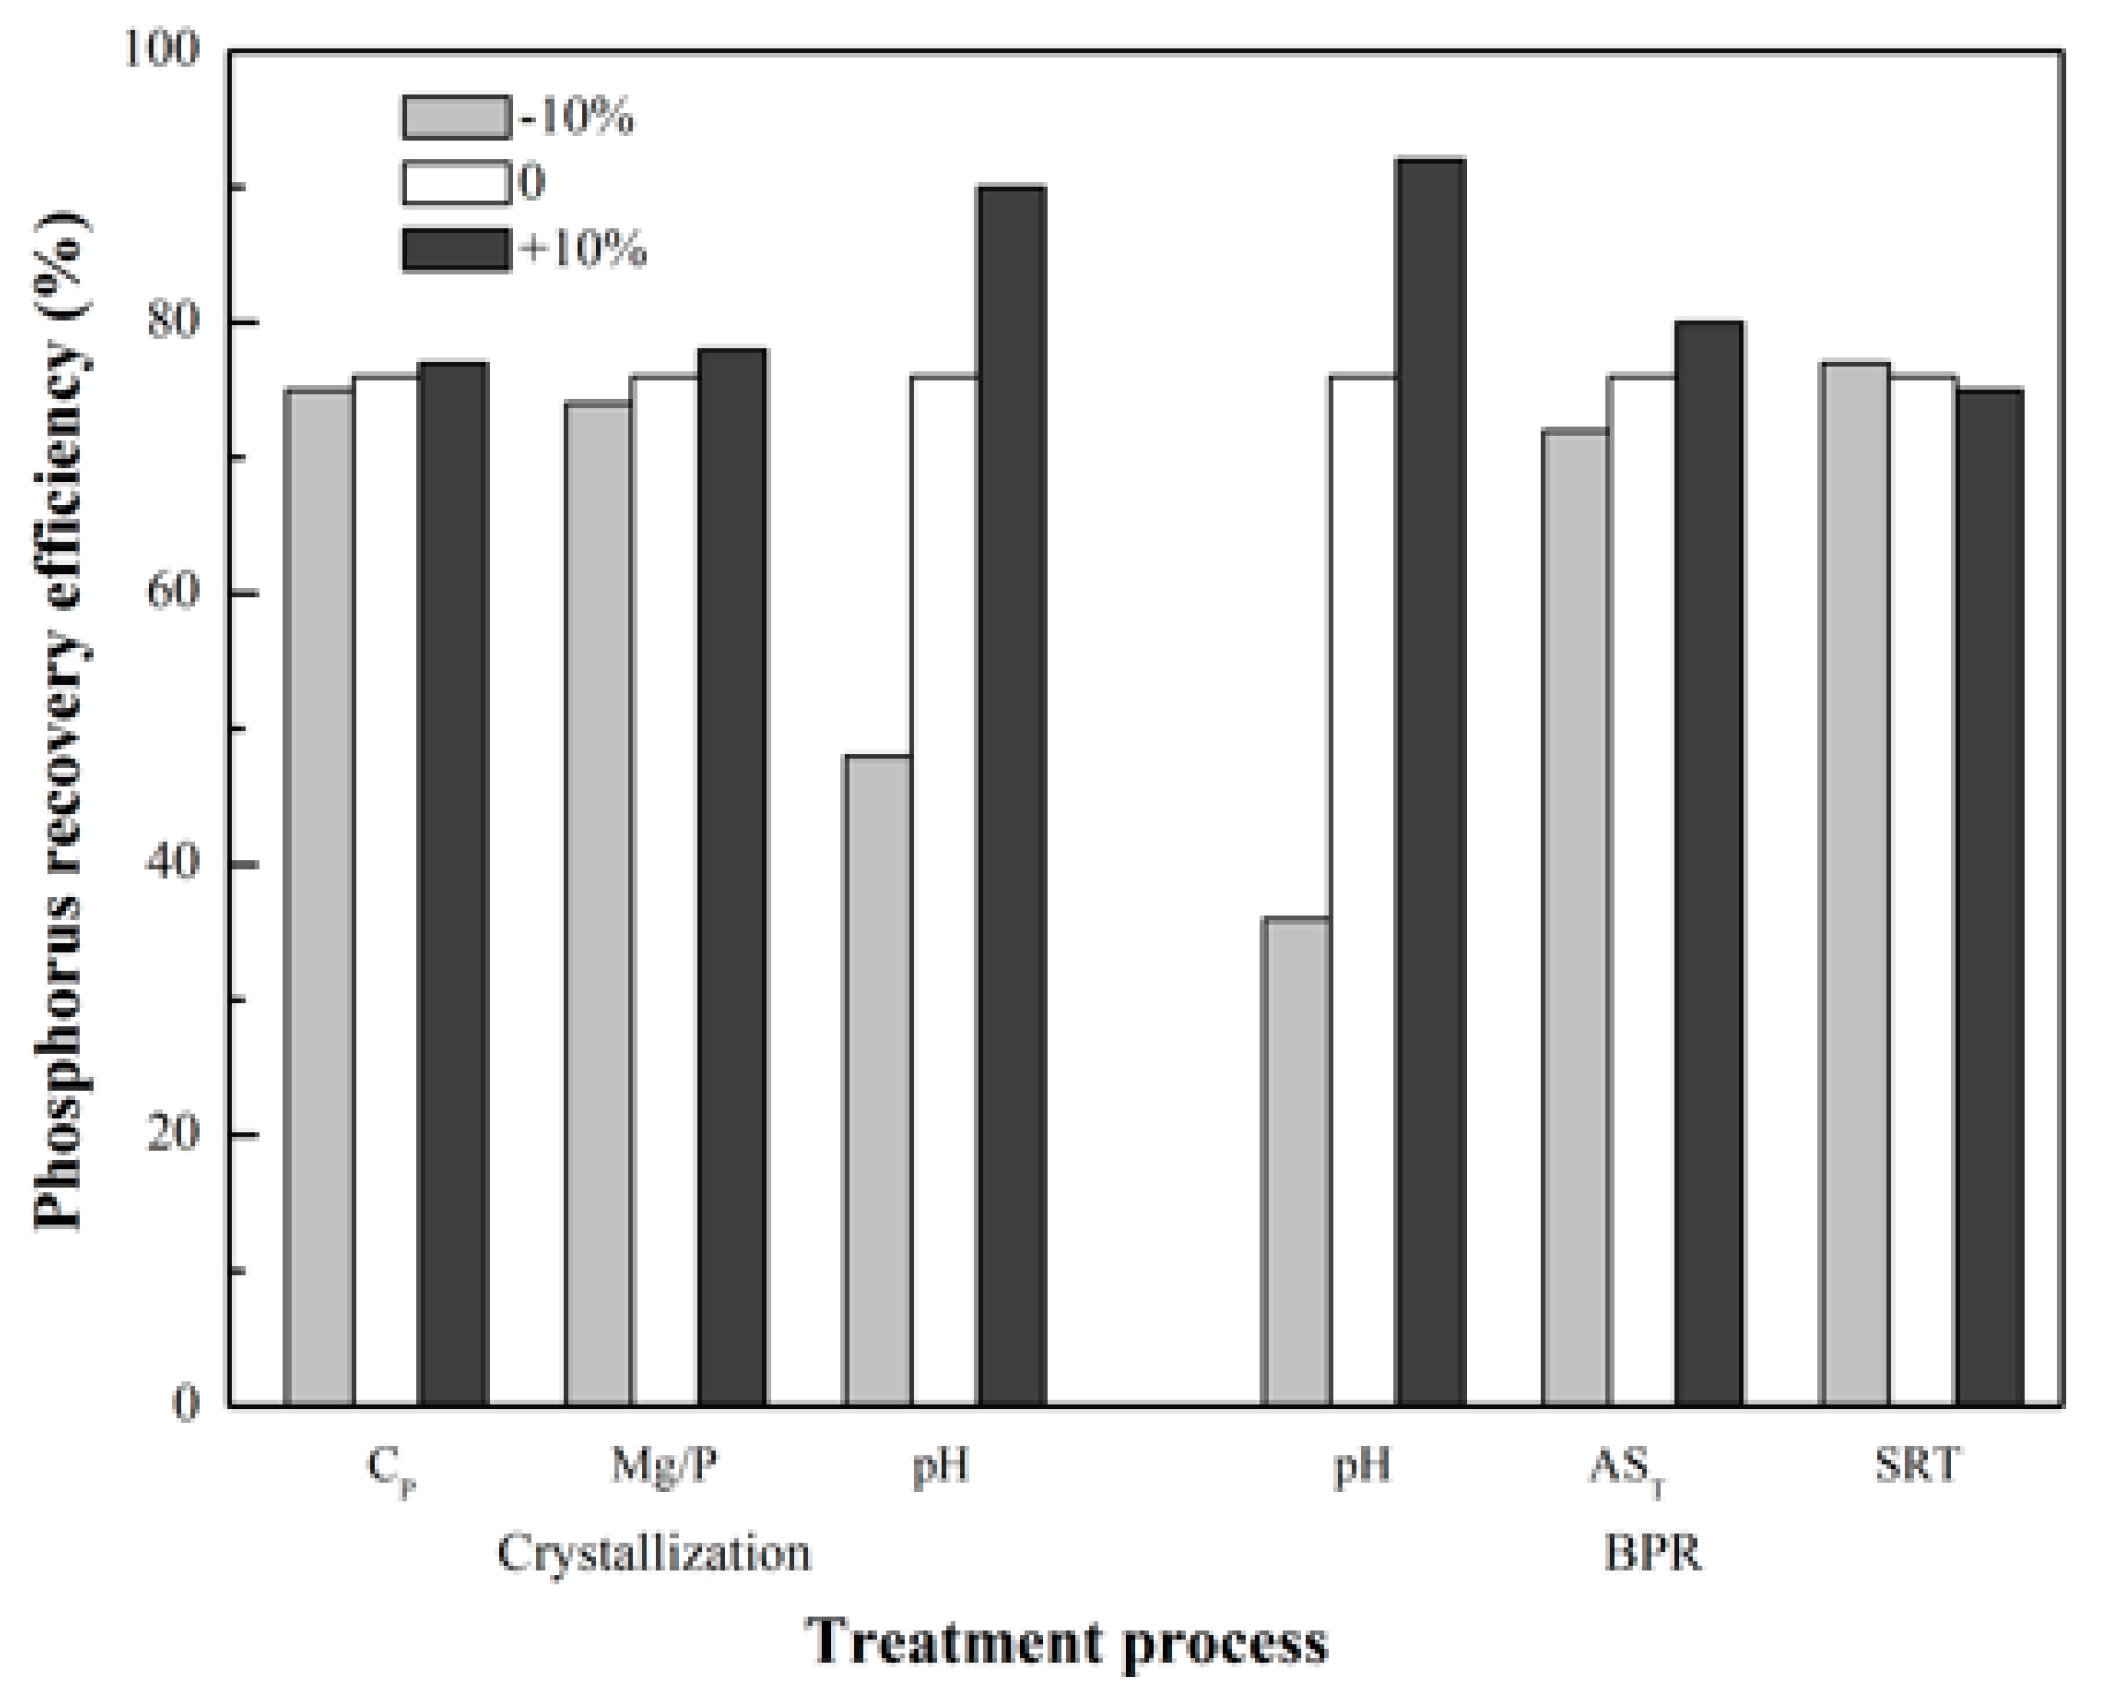
3.2. P Recovery Potential

Growing environmental awareness in China has promoted the introduction of a number of policies and laws [21]. For example, the Intensive Livestock and Poultry Breeding Pollution Control ordinance and Prevention and Control of National Livestock and Poultry Breeding Pollution in the 12th Five-year Plan emphasize the importance of agricultural waste management. It is believed that implementation of these policies and laws will impose greater obligations on future management of agricultural waste. Therefore, the potential P recovery estimation for swine wastewater management is important.
For struvite crystallization model analysis of PRE, the base case was set to 76% (for the liquid fraction of swine wastewater after mechanical separation), which is considered to be in accordance with engineering practice. Base-case factors of struvite crystallization were established as Cp = 60.6 mg/L, Mg/P = 1.2 and pH = 8.7. As shown in Figure 2, if two factors were assumed invariant, the other factor caused a ±10% deviation from the base-case PRE. With a 10% increase of swine wastewater Cp, PRE increased. An increase of Mg/P raised PRE. Although under suitable conditions, Mg/P = 1 can theoretically form struvite, numerous studies have demonstrated that a slight excess of Mg benefits the precipitation of P as struvite. Therefore, an increase of 10% Mg would promote struvite crystallization potential. There is an optimal pH for struvite crystallization [33]. Generally, struvite solubility decreases with increasing pH. However, as pH rises above 9, struvite solubility begins to increase, because the ammonium ion concentration declines and phosphate ion concentration increases. The base-case pH (8.7) was in the optimal range, and a 10% pH increase aided the crystallization of struvite. A 10% decrease of pH greatly reduced PRE.
In the BPR modeling of PRE, the base-case BPR factors were set to pH = 7.31, AST = 1.6 h, and SRT = 15 day. The base-case PRE was set to 76% according to certain literature data (Supplementary Materials, Section 4). As shown in Figure 2, when AST and SRT were controlled, as in the base case, a 10% decrease of pH reduced PRE from 76% to 36%. This was because microorganisms for P removal are sensitive to pH value of the environment, and they grow well at pH range of 7.0–8.0. Thus, when pH dropped to 6.58, the growth of P removal microorganism would be significantly restrained, thus PRE reduced [34]. Generally, P release under anaerobic stage is the precondition for P uptake under aerobic condition, and little P is released after 2 h of anaerobic stage. The selected AST time is 1.6 h, so a 10% increase would only lead to 1.76 h P releasing, which is considered to be beneficial for the P removal. Research by Kuba et al. [35] showed that poly-P bacteria have shorter sludge age, which means reducing SRT would increase the PRE. Thus, when the SRT decreased from 15 days to 13.5 days, the PRE increased from 76% to 77%.
In a coupled process, the struvite crystallization and BPR processes are used in series. The PRE modeling results are shown in Table 3. The PRE model output was higher than that of BPR or struvite crystallization individually. When reaction conditions for crystallization were set to 60.6 mg/L for Cp 1.2 for Mg/P and 7.8 for pH, and 6.6 for pH 1.6 h for AST and 15 days for SRT, the lowest total PRE was 59.04%. The highest total PRE was 99.35% when the reaction conditions for crystallization were set to 60.6 mg/L for Cp, 1.2 for Mg/P, and 9.7 for pH, and 8.0 for pH, 1.6 h for AST, and 15 days for SRT. Mostly, the coupled process could easily achieve a high PRE (>90%), which would definitely remove substantial P in swine wastewater.

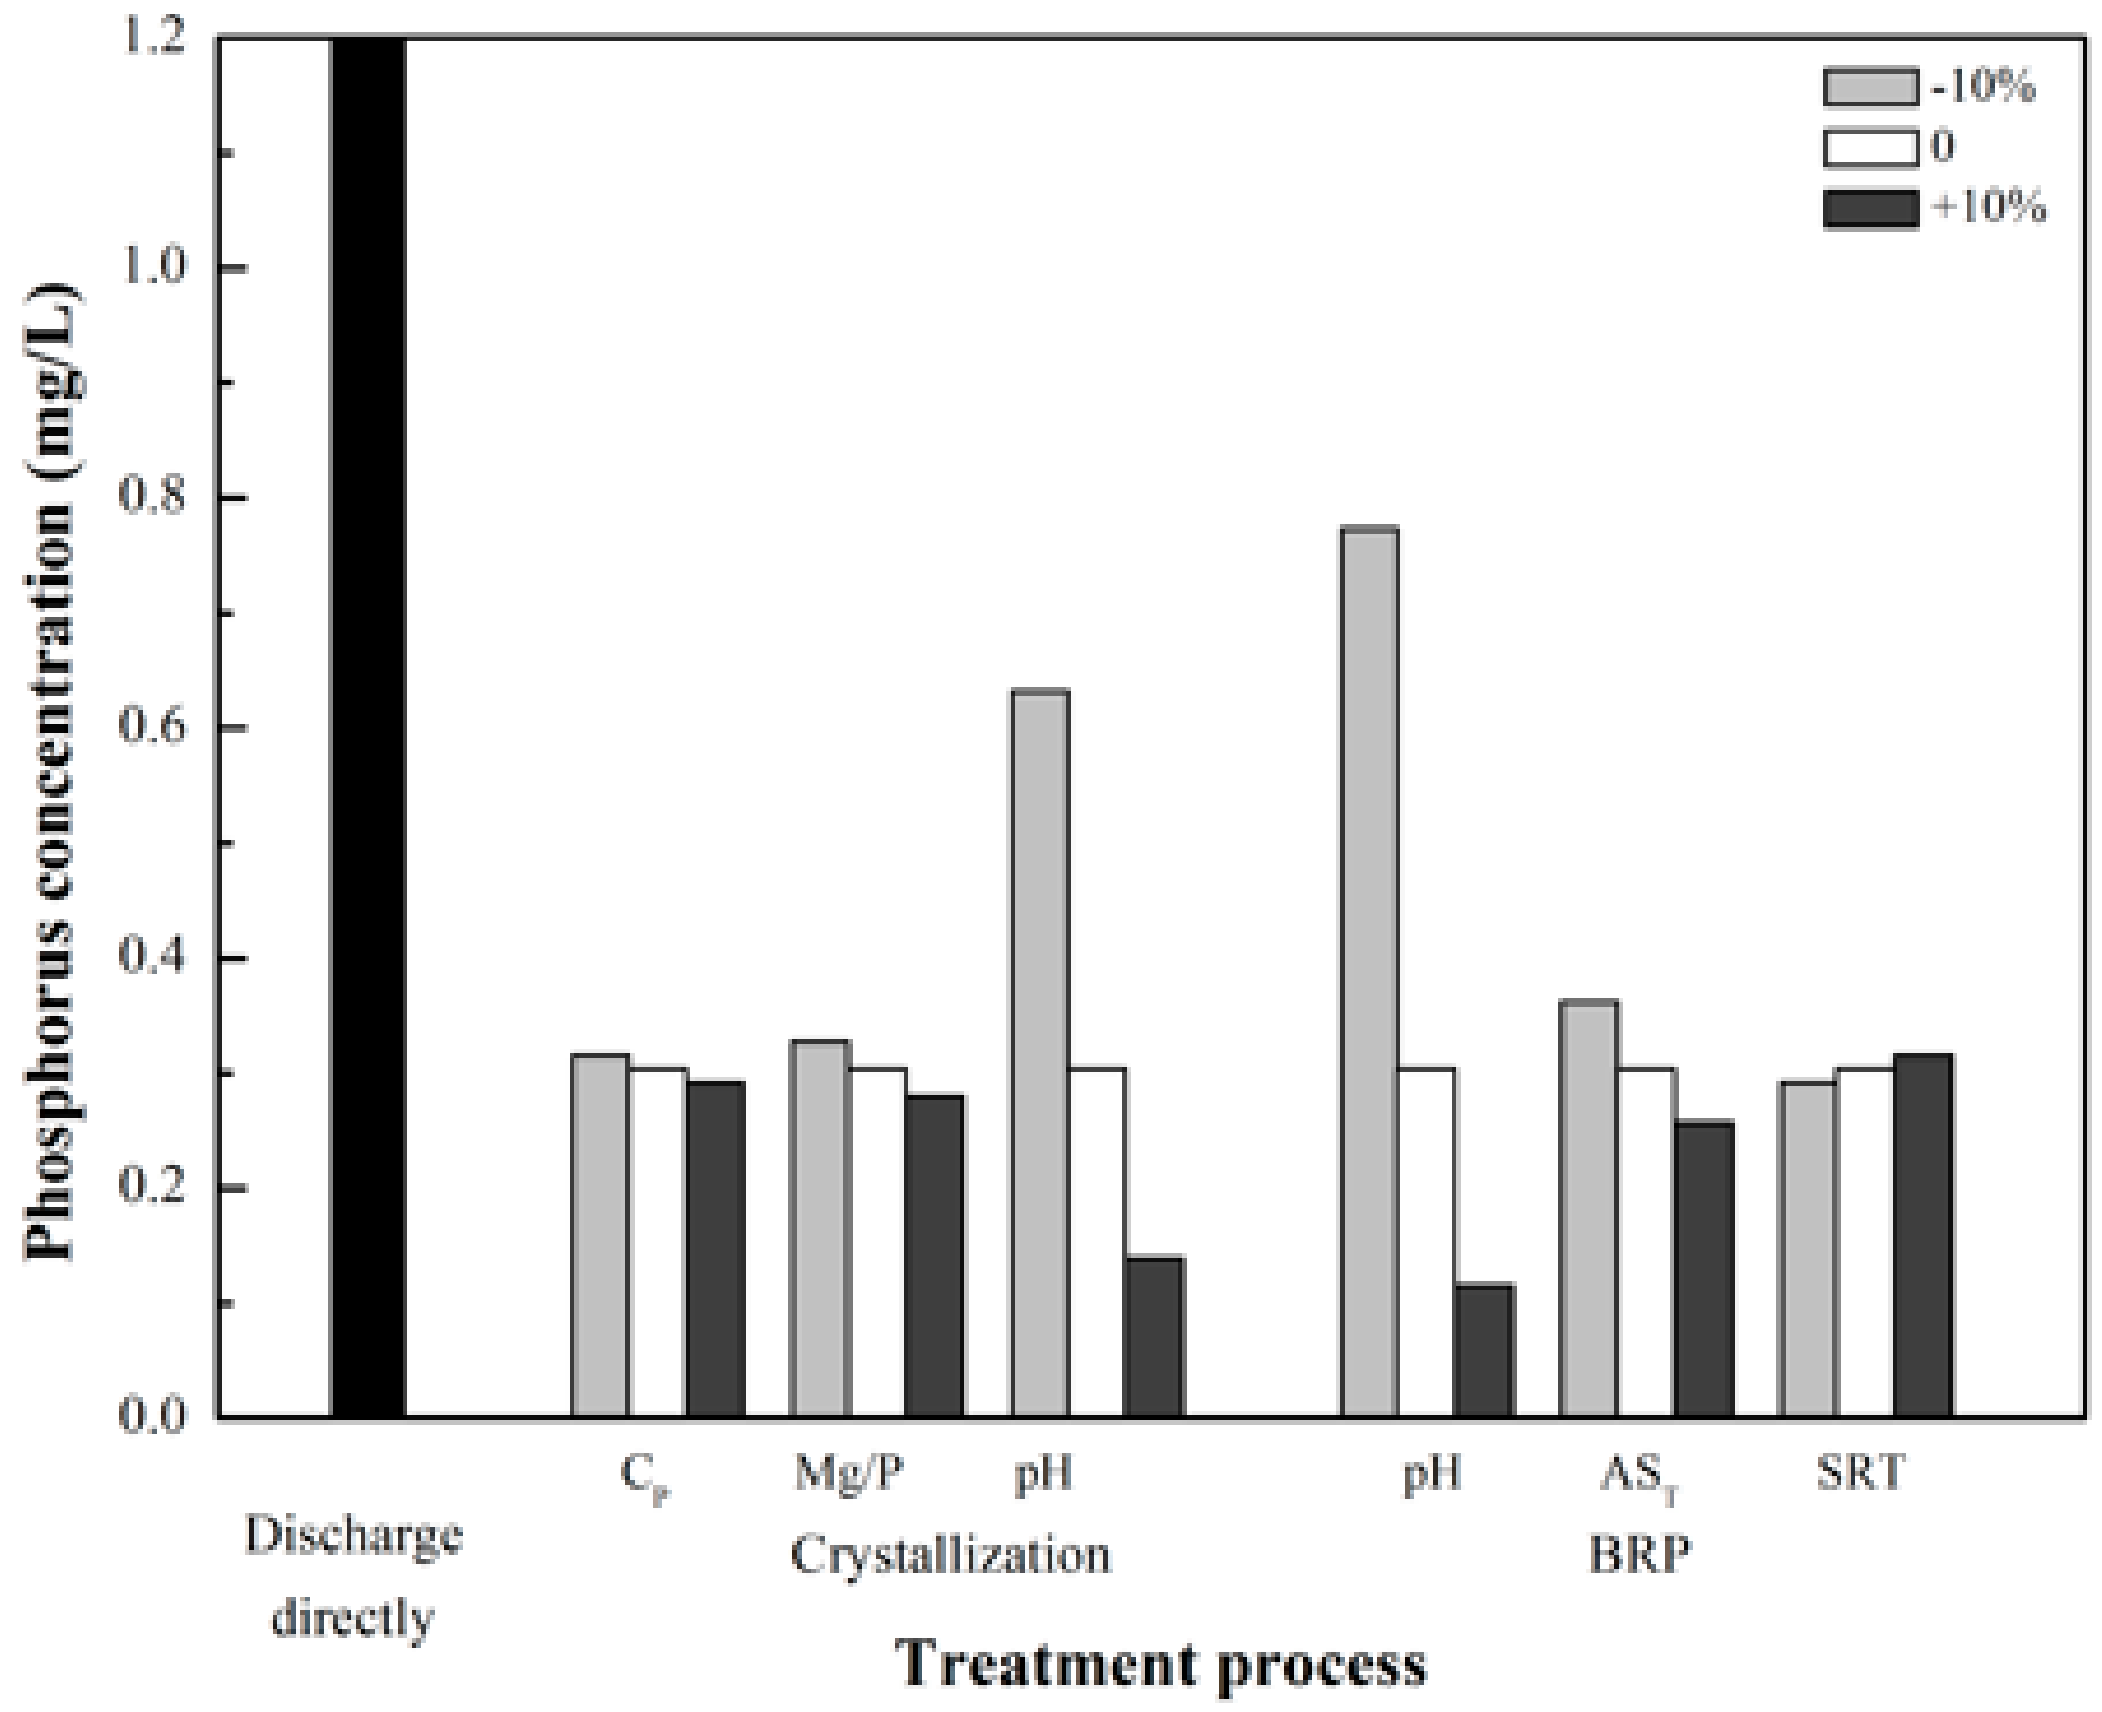
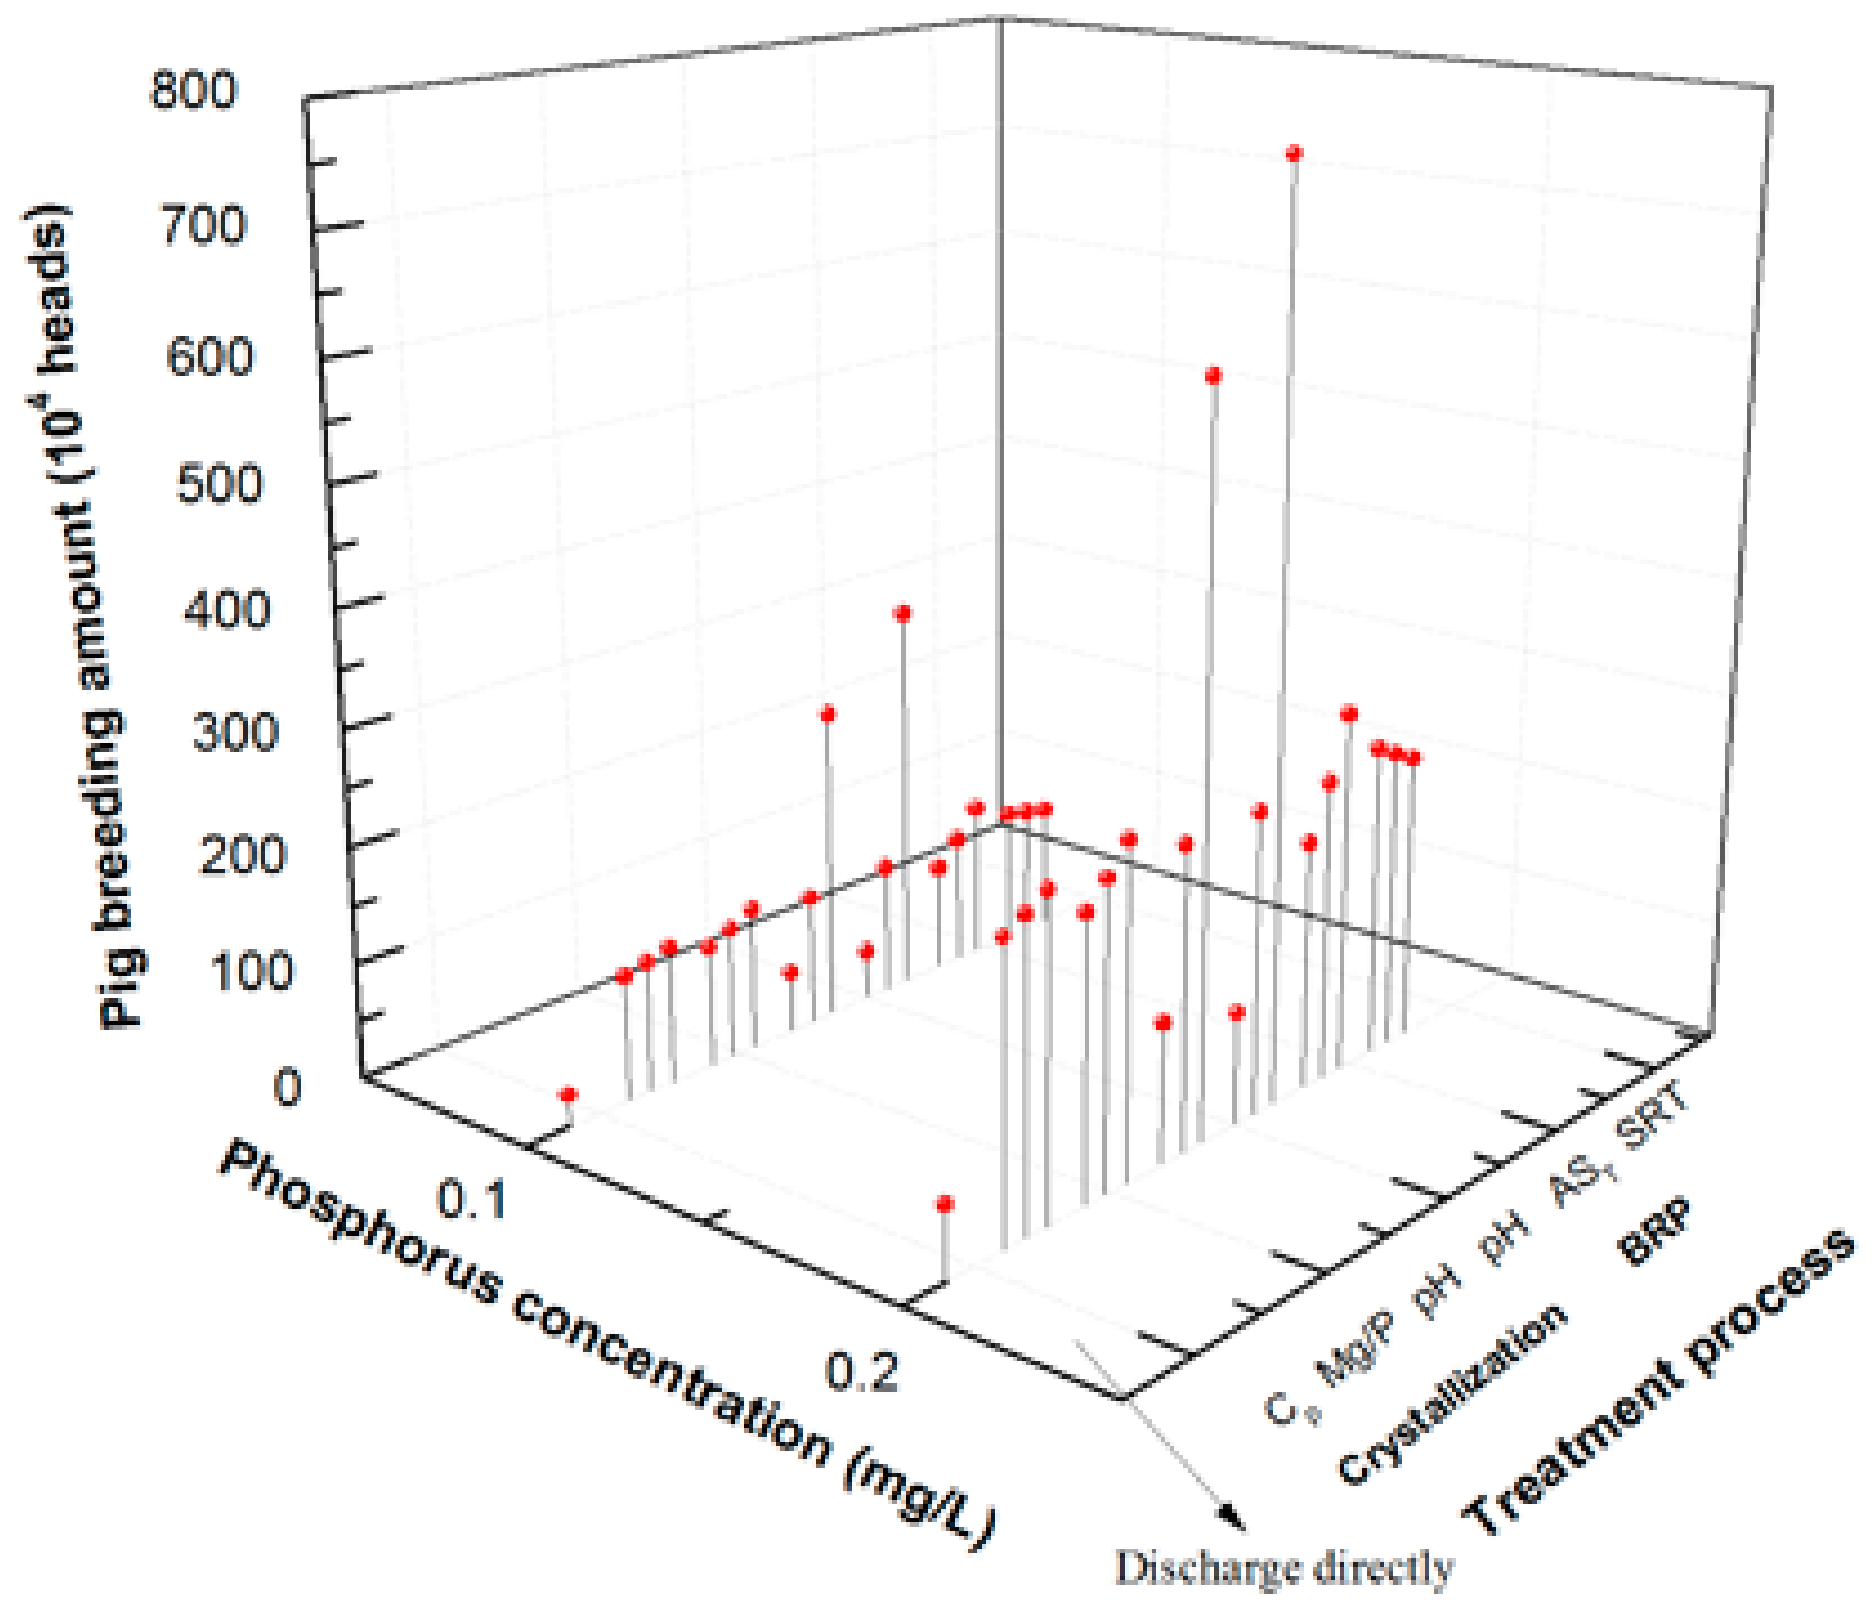
3.3. Water Environment Capacity Calculation

As a large international city, Beijing attracts attention from all over the world. In recent years, environmental protection problems there have become a major issue. Of course, people who live and work in Beijing desire a healthy environment. The government has taken many measures to prevent water pollution. Therefore, it is important to evaluate the water pollution situation caused by intensive pig farming in the area.
Figure 3 shows the water environment situation in the Beijing area as determined by various treatment processes. If there were no treatment of swine wastewater, P concentration in water bodies would be 1.20 mg/L, greatly exceeding the grade V water quality standard (P < 0.4 mg/L) [36]. Thus, treatment is clearly necessary for a better water environment. When swine wastewater was treated, water body quality was effectively improved. With struvite crystallization, a minimum P concentration of 0.14 mg/L was obtained under conditions of 60.6 mg/L for Cp, 1.2 for Mg/P, and 9.7 for pH, and PRE was 90%. With BPR, the lowest P concentration of 0.12 mg/L was obtained under conditions of 8.0 for pH, 1.6 h for AST, and 15 days for SRT. However, in most cases, the P concentration was above 0.2 mg/L, which only meets the Grade IV standard. These results indicate that, although water environment quality may be improved by crystallization or BRP processes for P recovery, the treated swine wastewater still threatened the environment in terms of P. Therefore, the coupled process to treat swine wastewater for P recovery and improve water environmental quality is important. As shown in Table 3, the struvite crystallization and BPR were used in series for this coupled treatment. Under a 10% increase of pH for struvite crystallization and 10% increase of pH for BPR, P concentration in water bodies of the Beijing area was 0.03 mg/L. Generally, if the swine wastewater was treated by the coupled process, the discharged P would be significantly reduced, and alleviate the pressure for water bodies in Beijing.
The initial P concentration (60.6 mg/L) accords with the Chinese situation. However, treatment of swine wastewater could effectively reduce the deterioration of water quality. Once treatment facilities were constructed, discharged wastewater was required to meet relevant regulation levels set by the Discharge Standard of Pollutants for Livestock and Poultry Breeding [37]. The highest P discharge concentration was 8 mg/L, so PRE must exceed 87% if the initial P concentration is 60.6 mg/L. Thus, the simple single technique for wastewater treatment may not be useful to reach the discharge standard. However, the coupled process could almost always make the effluent meet that standard.
Once certain water quality objectives were established, the pig breeding number could be calculated. As shown in Figure 4, if the regulation standard of water quality was set to Grade II (P < 0.1 mg/L), then the pig breeding number was less than 0.27 million heads if no process was used to treat the swine wastewater. If only crystallization was used to treat swine wastewater, the maximum pig raising number only reached 2.69 million heads when 60.6 mg/L, 1.2 and 9.7 were set for Cp, Mg/P, and pH, respectively. The lower the target of water quality, the more pigs could be raised. When the regulation standard was Grade III (P < 0.2 mg/L) with crystallization, the number reached 6.14 million heads under the same conditions as above. When the reaction conditions for BPR were 8.0 for pH, 1.6 h for AST, and 15 days for SRT, the numbers reached 3.37 and 7.67 million heads for the Grade II and III of water quality, respectively.
However, there were different outcomes when the coupled process was used to treat the swine wastewater. When the reaction conditions for crystallization and BPR were 60.6 mg/L for Cp, 1.2 for Mg/P, and 9.7 for pH, and 8.0 for pH, 1.6 h for AST, and 15 days for SRT, the maximum total PRE of 99.36% was attained. For the Grade II and III of water quality, the numbers reached 42.07 and 95.90 million heads, respectively. In general, the coupled treatment process was most suitable for the Chinese situation with regard to the effluent P concentration standard, and avoided concerns about how many pigs can be bred in Beijing to reach a certain target. Although there are many other pig farms in China, long-distance transport costs increase pork prices and food quality and security cannot be assured. Thus, it is very important to treat wastewater containing manure.

3.4. Treatment Cost

Constructing facilities to treat swine wastewater entails substantial additional expense for a pig farm. A simplified treatment cost for a 10,000-pig farm was calculated (Table 4). The core facility is considered the main consumer for various treatments. A bioreactor was considered the core facility in BPR. A fluidized bed reactor was considered the core facility in struvite crystallization. The cost of each reactor was calculated using the Guideline on Construction and Investment for Livestock and Poultry Raising Pollution Prevention Project. Construction investments for struvite crystallization and BPR were 411 (104 Yuan, 604,370 USD) and 301 (104 Yuan, 442,580 USD), respectively, whose prices were averages from several professional companies in China. Running costs for the reactor of struvite crystallization and BPR are 28.907 (104 Yuan, 42,500 USD)) and 15.205 (104 Yuan, 22,360 USD) per year, respectively. Therefore, the coupled process would be costly; construction investment and operating cost would be 551 (104 Yuan, 810,170 USD) and 44.112 (104 Yuan, 64,860 USD), respectively. This would clearly be a great burden for an individual pig farm. However, since 2007, the Chinese government has set aside 0.3823 billion USD (2.5 billion Yuan) for standard pig farm construction. In 2012, another 0.0153 billion USD (1 billion Yuan) was used to build supporting facilities for pig farms, indicating that a number of government subsidies have been allocated for the treatment of agricultural wastes (MOA, 2014). It is believed that more attention will be given and more subsidies allotted to the treatment of swine wastewater.
The use of struvite as a slow release fertilizer is one of the uses of recovered P. About 1000 m3 of wastewater can be crystallized to produce 1 kg of struvite [38]. In a 10,000-pig farm, the total amount of sewage treatment is about 176.5 m3/d. Each year, the amount of struvite generated from the wastewater treatment is enough to feed about 4.6 hm2 of land. At present, struvite is priced from 140 USD/ton (Australia) to 460 USD/ton (Japan). It is still a viable benefit. There are still many uncertainties in this regard, and, for the time being, this does not consider the cost of other uses of recovered P.

4. Conclusions

The P discharge amount in manure wastewater of Beijing has had a volatile growth trend. The P amount in Beijing increased from 11,687 tons in 1980 to 16,237 tons in 2014. It will increase in the near future and ultimately reach a plateau. The P discharge amounts of swine wastewater in Beijing are predicted at 21,481 tons in 2030. P recovery modeling by crystallization, BRP, and coupled processes was established. If there is no treatment of swine wastewater, P concentration will reach a maximum 1.20 mg/L, representing serious pollution of water bodies around Beijing. For an initial P concentration of swine wastewater at 60.6 mg/L, crystallization combined with BPR could achieve a high PRE (>87%); in most cases, the P in effluent could easily meet the Discharge Standard of Pollutants for Livestock and Poultry Breeding. The maximum P recovery ratio was 99.36% under the condition of crystallization and BPR at 60.6 mg/L for Cp, 1.2 for Mg/P, and 9.7 for pH, and 8.0 for pH, 1.6 h for AST, and 15 days for SRT. The P concentration of water quality was 0.03 mg/L to meet the water regulation standard. Under this situation, if the target P concentration were set as Grade II and III, breeding numbers reached 42.07 and 95.90 million heads, respectively. Construction investment for the crystallization, BRP, and coupled processes were 411 (104 Yuan, 604,370 USD), 301 (104 Yuan, 442,580 USD), and 551 (104 Yuan, 810,170 USD), respectively. Running costs for the crystallization, BRP, and coupled methods were 28.907 (104 Yuan/year, 42,500 USD/year), 15.205 (104 Yuan/year, 22,360 USD/year) and 44.112 (104 Yuan/year, 64,860 USD/year), respectively. With the development of urban animal husbandry, it is necessary to adjust agricultural industry structure. To enhance environmental carrying capacity, swine wastewater treatment facilities should be used and the pig breeding number in the Beijing area should be managed within a reasonable range.

Supplementary Materials

The following are available online at www.mdpi.com/2071-1050/9/10/1845/s1.

Acknowledgments

We thank all the anonymous reviewers for their helpful suggestions on the quality improvement of our paper. The work was supported by a grant from the National Natural Science Foundation of China (No. 31401944), the National Key Research and Development Program of China (Nos. 2017YFD0800202 and 2016YFD0501404-6), the China Agricultural University Education Foundation “Da Bei Nong Group Education Foundation” (No. 1031-2415005), and the Beijing Municipal Natural Science Foundation (No. 6144026).

Author Contributions

Qiming Wang and Tao Zhang contributed equally to this work. Qiming Wang, Tao Zhang and Rongfeng Jiang conceived and designed the studies. Qiming Wang, Tao Zhang, and Xinyue He performed the studies and analyzed the data.

Conflicts of Interest

The authors declare no conflict of interest.

References

  1. Huang, H.M.; Zhang, P.; Zhang, Z.; Liu, J.H.; Xiao, J.; Gao, F.M. Simultaneous removal of ammonia nitrogen and recovery of phosphate from swine wastewater by struvite electrochemical precipitation and recycling technology. J. Clean. Prod. 2016, 127, 302–310. [Google Scholar] [CrossRef]
  2. Elser, J.; Bennett, E. Phosphorus cycle: A broken biogeochemical cycle. Nature 2011, 478, 29–31. [Google Scholar] [CrossRef] [PubMed]
  3. Withers, P.J.A.; Elser, J.J.; Julian, H.; Hisao, O.; Schipper, W.J.; Van, D.K.C. Greening the global phosphorus cycle: How green chemistry can help achieve planetary P sustainability. Green Chem. 2015, 17, 2087–2099. [Google Scholar] [CrossRef] [Green Version]
  4. Li, B.; Boiarkina, I.; Young, B.; Yu, W. Substance flow analysis of phosphorous in China. Int. J. Environ. Sci. Dev. 2015, 6, 9–13. [Google Scholar] [CrossRef]
  5. Kazuyo, M.Y.; Hironari, K.; Kenichi, N.; Tetsuya, N. A material flow analysis of phosphorus in Japan. J. Ind. Ecol. 2009, 13, 687–705. [Google Scholar]
  6. Cordell, D.; Jackson, M.; White, S. Phosphorus flows through the Australian food system: Identifying intervention points as a roadmap to phosphorus security. Environ. Sci. Policy 2013, 29, 87–102. [Google Scholar] [CrossRef]
  7. Sattari, S.Z.; Van Ittersum, M.K.; Giller, K.E.; Zhang, F.; Bouwman, A.F. Key role of China and its agriculture in global sustainable phosphorus management. Environ. Res. Lett. 2014, 9, 1–8. [Google Scholar] [CrossRef]
  8. Chadwick, D.; Jia, W.; Tong, Y.; Yu, G.; Shen, Q.; Chen, Q. Improving manure nutrient management towards sustainable agricultural intensification in China. Agric. Ecosyst. Environ. 2015, 209, 34–46. [Google Scholar] [CrossRef]
  9. Jin, Y.; Hu, Z.H.; Wen, Z.Y. Enhancing anaerobic digestibility and phosphorus recovery of dairy manure through microwave-based thermochemical pretreatment. Water Res. 2009, 43, 3493–3502. [Google Scholar] [CrossRef] [PubMed]
  10. Luo, P.; Liu, F.; Liu, X.L.; Wu, X.; Yao, R.; Chen, L.; Li, X.; Xiao, R.L.; Wu, J.S. Phosphorus removal from lagoon-pretreated swine wastewater by pilot-scale surface flow constructed wetlands planted with Myriophyllum aquaticum. Sci. Total Environ. 2017, 576, 490–497. [Google Scholar] [CrossRef] [PubMed]
  11. Vanotti, M.B.; Dube, P.J.; Szogi, A.A.; Garcíagonzález, M.C. Recovery of ammonia and phosphate minerals from swine wastewater using gas-permeable membranes. Water Res. 2017, 112, 137–146. [Google Scholar] [CrossRef] [PubMed]
  12. Ge, S.; Peng, Y.; Wang, S.; Guo, J.; Ma, B.; Zhang, L.; Cao, X. Enhanced nutrient removal in a modified step feed process treating municipal wastewater with different inflow distribution ratios and nutrient ratios. Bioresour. Technol. 2010, 101, 9012–9019. [Google Scholar] [CrossRef] [PubMed]
  13. Obaja, D.; Mace, S.; Costa, J.; Sans, C.; Mata-Alvarez, J. Nitrification, denitrification and biological phosphorus removal in piggery wastewater using a sequencing batch reactor. Bioresour. Technol. 2003, 87, 103–111. [Google Scholar] [CrossRef]
  14. Deng, L.W.; Zheng, P.; Chen, Z.A.; Mahmood, Q. Improvement in post-treatment of digested swine wastewater. Bioresour. Technol. 2008, 99, 3136–3145. [Google Scholar] [CrossRef] [PubMed]
  15. Liu, Y.H.; Kwag, J.H.; Kim, J.H.; Ra, C.S. Recovery of nitrogen and phosphorus by struvite crystallization from swine wastewater. Desalination 2011, 277, 364–369. [Google Scholar] [CrossRef]
  16. Iqbal, M.; Bhuiyan, H.; Mavinic, D.S. Assessing struvite precipitation in a pilot-scale fluidized bed crystallizer. Environ. Technol. 2008, 29, 1157–1167. [Google Scholar] [CrossRef] [PubMed]
  17. Munafò, M.; Cecchi, G.; Baiocco, F.; Mancini, L. River pollution from non-point sources: A new simplified method of assessment. J. Environ. Manag. 2005, 77, 93–98. [Google Scholar] [CrossRef] [PubMed]
  18. Bai, Z.H.; Ma, L.; Qin, W.; Chen, Q.; Oenema, O.; Zhang, F.S. Changes in pig production in China and their effects on nitrogen and phosphorus use and losses. Environ. Sci. Technol. 2014, 48, 12742–12749. [Google Scholar] [CrossRef] [PubMed]
  19. Wei, S.; Ma, L.; Jiang, R.F.; Bai, Z.H.; Wu, D.M.; Xia, L.J. Use efficiency and emission spatial-temporal variability of nitrogen and phosphorus for pig production in Beijing. Trans. Chin. Soc. Agric. Eng. 2016, 32, 190–196. (In Chinese) [Google Scholar]
  20. Zhang, B.; Wang, L.J.; Riddicka, B.; Li, R.; Justin, R.A.; Nana, A.B.; Abolghasem, S. Sustainable production of algal biomass and biofuels using swine wastewater in North Carolina, US. Sustainability 2016, 8, 477. [Google Scholar] [CrossRef]
  21. Jia, W. Studies on the Evaluation of Nutrient Resources Derived from Manure and Optimized Utilization in Arable Land of China. Ph.D. Thesis, China Agriculture University, Beijing, China, 2014. (In Chinese). [Google Scholar]
  22. Pérez-Sangrador, M.P.; León-Cófreces, M.C.; Acítores-Benavente, M.; García-González, M.C. Solids and nutrient removal from flushed swine manure using polyacrylamides. J. Environ. Manag. 2012, 93, 67–70. [Google Scholar] [CrossRef] [PubMed]
  23. Hjorth, M.; Christensen, K.V.; Christensen, M.L.; Sommer, S.G. Solid–liquid separation of animal slurry in theory and practice, a review. Agron. Sustain. Dev. 2010, 30, 153–180. [Google Scholar] [CrossRef]
  24. Riaño, B.; García-González, M.C. On-farm treatment of swine manure based on solid–liquid separation and biological nitrification-denitrification of the liquid fraction. J. Environ. Manag. 2014, 132, 87–93. [Google Scholar] [CrossRef] [PubMed]
  25. Doyle, J.D.; Parsons, S.A. Struvite formation, control and recovery. Water Res. 2002, 36, 3925–3940. [Google Scholar] [CrossRef]
  26. Singh, M.; Srivastava, R.K. Sequencing batch reactor technology for biological wastewater treatment: A review. Asia Pac. J. Chem. Eng. 2011, 6, 3–13. [Google Scholar] [CrossRef]
  27. Beijing Water Affairs Bureau. Beijing Water Resources Bulletin. 2012. Available online: http://www.bjwater.gov.cn/pub/bjwater/zfgk/tjxx/ndbg/201307/P020130731652249528239.doc (accessed on 1 July 2017).
  28. Gao, Y.T. Characteristic Indexes Analysis and Ecosystem Health Evaluation of the Typical Rivers in the Suburb of Beijing. Master’s Thesis, Beijing Forestry University, Beijing, China, 2014. (In Chinese). [Google Scholar]
  29. Feng, S.; Li, S.Y.; Deng, J.C. Pollutants degradation coefficients study of the Taihu Lake upstream rivers. Acta Sci. Circumst. 2016, 36, 3127–3136. (In Chinese) [Google Scholar]
  30. Xiao, H.B. Study on the Growth and Fluctuation of Hog Production in China. Master’s Thesis, Chinese Academy of Agricultural Sciences, Beijing, China, 2010. (In Chinese). [Google Scholar]
  31. Zhang, M.C.; Lawlor, P.G.; Wu, G.X.; Lynch, B.; Zhan, X.M. Partial nitrification and nutrient removal in intermittently aerated sequencing batch reactors treating separated digestate liquid after anaerobic digestion of pig manure. Bioprocess Biosyst. Eng. 2011, 34, 1049–1056. [Google Scholar] [CrossRef] [PubMed]
  32. Ermolieva, P.; Winiwarter, W.; Fischer, G.; Cao, G.-Y.; Klimont, Z.; Schoepp, W.; Li, Y.; Asman, W.A.H. Integrated Nitrogen Management in China (IR-09–005); Interim Report; International Institute for Applied Systems Analysis: Laxenburg, Austria, 2009; p. 54. [Google Scholar]
  33. Corre, K.S.L.; Valsamijones, E.; Hobbs, P.; Parsons, S.A. Phosphorus recovery from wastewater by struvite crystallization: A review. Crit. Rev. Environ. Sci. Technol. 2009, 39, 433–477. [Google Scholar] [CrossRef] [Green Version]
  34. Kuba, T.; Van Loosdrecht, M.C.M.; Heijnen, J.J. Biological dephosphatation by activated sludge under denitrifying conditions pH influence and occurrence of denitrifying dephosphatation in a full-scale waste water treatment plant. Water Sci. Technol. 1997, 36, 75–82. [Google Scholar]
  35. Kuba, T.; Van Loosdrecht, M.C.M.; Brandse, F.A.; Heijnen, J.J. Occurrence of denitrifying phosphorus removing bacteria in modified UCT-type wastewater treatment plants. Water Res. 1997, 31, 777–786. [Google Scholar] [CrossRef]
  36. State Environmental Protection Administration of the P.R. China (SEPA). Environmental Quality Standards for Surface Water GB3838-2002; China Environmental Science Press: Beijing, China, 2002. (In Chinese) [Google Scholar]
  37. State Environmental Protection Administration of the P.R. China (SEPA). Discharge Standard of Pollutants for Livestock and Poultry Breeding GB18596-2001. 2001. Available online: http://kjs.mep.gov.cn/hjbhbz/bzwb/shjbh/swrwpfbz/200301/t20030101_66550.htm (accessed on 1 July 2017).
  38. Su, S.Q.; Chuan, X.Y.; Ma, H.W. Recovery of nitrogen and phosphorus by struvite crystallization and its application as slow-release eco-friendly fertilizers. Inorg. Chem. Ind. 2016, 48, 58–63. (In Chinese) [Google Scholar]
Figure 1. Phosphorus discharge amount estimation in swine wastewater: (a) pig breeding amount and phosphorus discharge amount from swine wastewater; and (b) phosphorus discharge amount estimation from 1980 to 2030 in Beijing.
Sustainability 09 01845 g001
Figure 2. Phosphorus recovery efficiency at different treated process.
Sustainability 09 01845 g002
Figure 3. Water environmental situation of Beijing at different treatment process.
Sustainability 09 01845 g003
Figure 4. Pig breeding amount estimation under different environmental objectives.
Sustainability 09 01845 g004
Table 1. Coefficients of pig amount and phosphorus discharge.
Breeding Cycle (day)Phosphorus Concentration (%)Phosphorus Discharge Coefficient (kg/head·Breeding Cycle)
SolidLiquidSolidLiquid
1805.440.4623.892.66
Table 2. The parameters of average growth rate, linear fit, logistic and G.M. (1.1) gray models.
R2Deviation (%)
average growth rate model 18.61
linear fit model0.4521.21
G.M. (1.1) gray model 22.88
logistic model0.5718.23
Table 3. Phosphorus recovery efficiency for the coupled technique.
Parameters for Struvite CrystallizationParameters for BPRTotal PRE (%)P Concentration in Water Body (mg/L)
ParameterConditionPRE (%)ParameterConditionPRE (%)
Base case076Base case7694.240.0895
pH−10%3684.640.2022
+10%9298.080.0444
AST−10%7193.040.1036
+10%8095.200.0782
SRT−10%7794.480.0867
+10%7594.000.0923
Cp−10%83Base case7695.920.0698
pH−10%3689.120.1496
+10%9298.640.0378
AST−10%7195.070.0797
+10%8096.600.0618
SRT−10%7796.090.0678
+10%7595.750.0718
+10%72Base case7693.280.1008
pH−10%3682.080.2323
+10%9297.760.0482
AST−10%7191.880.1172
+10%8094.400.0876
SRT−10%7793.560.0975
+10%7593.000.1041
Mg/P−10%76Base case7693.520.0979
pH−10%3682.720.2247
+10%9297.840.0472
AST−10%7192.170.1138
+10%8094.600.0853
SRT−10%7793.790.0948
+10%7593.250.1011
+10%73Base case7694.960.0810
pH−10%3686.560.1797
+10%9298.320.0416
AST−10%7193.910.0934
+10%8095.800.0712
SRT−10%7795.170.0786
+10%7594.750.0835
pH−10%79Base case7684.640.2022
pH−10%3659.040.5028
+10%9294.880.0820
AST−10%7181.440.2398
+10%8087.200.1721
SRT−10%7785.280.1947
+10%7584.000.2097
+10%76Base case7698.080.0444
pH−10%3694.880.0820
+10%9299.360.0294
AST−10%7197.680.0491
+10%8098.400.0406
SRT−10%7798.160.0435
+10%7598.000.0453
Table 4. Treatment cost for different techniques (10,000 heads).
Process UnitConstruction Investment /104 YuanRunning Cost/104 Yuan/Year
BuildFacilityInstallationSumManagement Cost/5%Depreciation Cost/2.5%Maintenance Cost/2.5%Energy ChargeChemical CostSum
Storage Pool 9009
Pre-TreatmentGrid3.3756.751.12511.25
Adjustment Pool1839.3753.37560.75
BPR sectionSequencing batch Reactor 1407.03.53.51.205 15.205
Crystallization sectionFluidized Bed Reactor 25012.56.256.252.4631.44428.907
Auxiliary buildingIntegrated Room3640480
Crystallization 411 28.907
BPR 301 15.205
Coupled 551 44.112

