
Voltage Impact of a Wave Energy Converter on an Unbalanced Distribution Grid and Corrective Actions


Escuela Técnica Superior de Ingenieros Industriales, Universidad Politécnica de Madrid, 28006 Madrid, Spain
*
Author to whom correspondence should be addressed.
Sustainability 2017, 9(10), 1844; https://doi.org/10.3390/su9101844
Submission received: 6 September 2017
/
Revised: 2 October 2017
/
Accepted: 9 October 2017
/
Published: 13 October 2017
(This article belongs to the Special Issue Wave Energy Technologies: A Sustainable Energy Source)
Abstract
:Renewable energy is steadily increasing its penetration level in electric power systems. Wind and solar energy have reached a high degree of maturity, and their impacts on the grid are well known. However, this is not the case for emerging sources like wave energy. This work explores the impact of the fluctuating power injected by a wave energy converter on the distribution grid voltage and proposes a strategy for mitigating the induced voltage fluctuations. The paper describes the mechanics of how a fluctuating active power injection leads to grid voltage fluctuations and presents an unbalanced three-phase power flow tool that allows one to quantitatively analyze the voltage evolution at every phase and bus of a distribution grid driven by this power injection. The paper also proposes a corrective action for mitigating the voltage fluctuations that makes use of the hardware resources already available in the wave energy converter, by means of a control strategy on the reactive capability of the grid-side inverter. The use of a STATCOM as additional reactive compensation equipment is also explored. The effectiveness of the proposal is assessed in the IEEE 13-bus test feeder showing that, in some cases, the wave energy converter by itself is able to mitigate the voltage fluctuations that it causes. If not, a STATCOM can provide the extra reactive capability needed.
1. Introduction
Renewable resources of energy have been increasing their penetration level in electrical grids. Some of these, such as wind and solar, have already reached a high degree of maturity. Others, however, are still under development, as the case of wave energy. Many studies on the wave energy resource have been carried out throughout the world [1]. Just to cite some cases: the Atlantic Marine Energy Test Site (AMETS) on the west coast of Ireland [2], the Sicilian coastline [3], Northern Spain [4], the Maltese coasts [5], the Australian southeast shelf [6], the East China Sea [7], the Indian seas [8], Brazil [9], Peru [10] and Uruguay [11]. Therefore, due to the great energy potential of waves, the interest in this topic has been increasing worldwide, and the main challenge is to make it competitive against more affordable generation resources. Unlike wind energy, for example, there are different technologies to convert the wave energy into electricity. These devices, wave energy converters (WEC), are in different development phases, and some of them are even connected to the grid in test sites [12,13,14].
WEC are usually classified according to their working principle, location and orientation; and the grouping of these devices can be found in [12,15] and the references therein. On the working principle, the WEC technologies are divided mainly into: oscillating water column (OWC), submerged pressure differential, overtopping devices, floating structures and impact devices; in terms of location, they can be classified as onshore, nearshore and offshore devices; and finally, according to their orientation: attenuator, point absorber and terminator. Another common classification derived from the working principles is presented in [16], where the devices are divided into three great groups: oscillating water column, oscillating bodies and overtopping, with other subclassifications.
As a consequence of the increasing penetration of renewable energy, the electrical network structure has been changing, and it is migrating from a centralized generation model, where the power is generated in a few, large power plants far from center loads, to a hybrid model with distributed generation (DG), where many smaller plants are closer to the loads. This proximity between generation and consumption brings some benefits such as [17]: the increasing of electric system reliability and the reduction of losses in distribution and transmission systems. DG systems can also aid in the grid support with ancillary services and in environmental issues, since most of these primary sources are non-polluting, as photovoltaic, wind, hydro and wave generation. The latter technology, unlike the others, is still under development, and its impact on the electrical grid and its compliance with the connection requirements are the subjects of current research.
DG systems are mostly connected to distribution grids, which are becoming a little more independent from the transmission networks. In this context, the question arises: is the distribution grid ready for DG systems? There is still much work to be done, since DG covers different types of primary resources, and each one has its singularities, not only in technical issues, but also in the grid codes that define the connection requirements. As stated in [18], despite the advances in the development of adequate grid codes, they are still delayed with respect to the continuous increase in DG penetration levels. Furthermore, the different development stage of DG in different countries results in different grid connection requirements around the world. A review focused on weak power grids can be found in [19], where the differences between the grid codes of interconnected and weak power systems are highlighted. From the point of view of wave energy, as the technical development is in an early stage, there are a few grid codes specifically addressed to it. However, wind energy grid codes can be applied to wave energy with minor changes due to their similarities, as shown in [20]. In addition, grid codes have a strong influence on the WEC’s design and, therefore, on its cost [21].
In relation to the positive impacts of DG on the electrical grid, achieving them is quite a hard task in practice, and other issues arise as voltage regulation, flicker, impact on short-circuit levels, etc. [22]. In the case of WEC, an important point concerning power quality is the fluctuating characteristic of the generated power. The injection of such power into the grid results in voltage fluctuations. For medium and large wave power plants, these fluctuations are naturally smoothed, and they could be seen as flicker. For example, [23] assesses the flicker level of a wave power plant with an installed power of 19.4 MW, and it shows that, for that specific power plant topology, there are some test cases in which the flicker levels exceed the limits recommended by [24]. Thus, a mitigation method is required. On the other hand, in small power plants, the voltage fluctuations are smoothed to a lesser degree. Some approaches to mitigate them are presented in [20,25,26] based on controlling the power take-off (PTO) system and/or using electrical storage systems. Another way is presented in [27], where an initial study has been conducted with a balanced radial distribution grid. In this case, the strategy is to use the reactive power capability of the WEC power electronic converter to mitigate the voltage fluctuations, thus avoiding the need for additional energy storage equipment. Although the idea is interesting as a proof of concept, the implementation described in [27] can only be applied to balanced systems, so it has to be adapted to real distribution grids, where the bus voltages are different in each phase.
This paper presents a control strategy applicable in real unbalanced distribution grids that implements the authors’ idea of exploiting the WEC’s own reactive resources for the mitigation of voltage fluctuations. To develop the proposed strategy, it is necessary to know how the unbalanced grid responds to the active and reactive powers from the WEC. To do so, an unbalanced three-phase load flow that is able to take into account the unbalance of loads, the asymmetry due to un-transposed lines and the presence of single-phase and two-phase lines has been implemented. The performance of the proposed strategy is assessed with a continuation load flow [28] implementing a test distribution grid, coupled to a wave-to-wire model of the WEC [29].
The paper is organized as follows: Section 2 formulates the problem of voltage fluctuations caused by power variations along with some metrics; Section 3 describes the implementation of the three-phase unbalanced load flow; Section 4 presents the wave-to-wire model of the WEC; Section 5 analyzes the voltage impact of the WEC connection; Section 6 presents the proposed control strategy; Section 7 shows the assessment of the strategy with simulation results; and finally, Section 8 draws the main conclusions.
2. Voltage Fluctuations
Assuming in a first approach a distribution grid as a balanced system, it can be represented by its Thévenin equivalent circuit from the point of common coupling (PCC), as shown in Figure 1a. The feeder has two buses connected by a series impedance with resistance R and reactance X. The voltage at the beginning of feeder (infinite bus) is (in this work, the underline variables represent complex quantities), and the voltage at PCC is . The WEC is modeled as a PQload, i.e., the active and reactive powers injected by the WEC ( and ) are independent of voltage. is a nonnegative quantity, while could be both positive or negative. In addition to the WEC, a load that absorbs constant active and reactive powers (P and Q) is connected to the PCC.
The phasor diagram of the equivalent circuit is shown in Figure 1b, where the voltage of the infinite bus is . With and the complex power absorbed at PCC , the voltage at the infinite bus can be expressed in terms of power as follows:
In distribution systems, the load angle (Figure 1b) is usually small. Hence, the imaginary part of Equation (1) is approximately zero, then . As is constant, is only a function of and , which can be expressed as:
Similar to [30], the voltage variation at PCC due to differential variations in active and reactive powers can be calculated as:
In transmission grids, the ratio is high, so the voltage is mainly sensitive to reactive power variations. However, in distribution grids, the ratio is lower, and the PCC voltage is sensitive to variations in both active and reactive powers. Therefore, the natural fluctuations in the active power generated by a WEC lead to voltage fluctuations at the PCC. On the other hand, the sensitivity to the reactive power allows one to use the reactive capability of the WEC converter as a countermeasure to mitigate the voltage fluctuation.
2.1. Voltage Fluctuation Metrics
The voltage fluctuation for balanced networks can be quantified as shown in [31]. This concept can be extended to an unbalanced three-phase system as follows:
where is the voltage fluctuation index at bus k and phase along the T time samples. It is clear that, for a given period, the more the time samples, the lower the index. Therefore, the sampling time must be chosen as high as compatible with no significant loss of information on the voltage fluctuation.
In addition, a global metrics that quantifies the voltage fluctuation of the grid is presented in [32], the system average voltage fluctuation index (SAVFI):
where N is the number of grid buses and is the SAVFI per bus, an intermediate index defined by:
where and are, respectively, the number and set of phases at bus k.
3. Unbalanced Three-Phase Load Flow
The three-phase load flow can be carried out using two different approaches: the phase and the sequence reference frames. The performance of both formulations, in terms of computational effort, depends on the network topology and the unbalance degree. The phase frame approach deals with the a-b-c representation of voltages and currents, while the sequence frame decomposes the system into positive-, negative- and zero-sequence networks, which are decoupled from each other in the case of a balanced system. Unfortunately, if a power system includes elements such as un-transposed lines, the network cannot be fully decoupled by means of symmetrical components. In spite of the absence of total uncoupling, the advantage of applying the sequence component approach instead of the phase component one is that the size of the problem is effectively reduced [33].
3.1. Three-Phase Load Flow Formulation
The load flow approach used in this paper is based on a current residual formulation in the sequence frame as in [34,35]. Its main characteristics are:
- The problem formulation is based on a nodal analysis by application of Kirchhoff’s current law and uses the Newton–Raphson method based on current injection mismatches.
- Voltages and currents are written in rectangular coordinates and in the sequence frame to improve the sparsity of the Jacobian matrix.
- Several types of load are possible: constant power, constant impedance, constant current and rotating load, balanced or unbalanced in the delta or wye grounded configuration.
- The constraints for PV buses are active power and voltage magnitudes, specified in positive sequence.
This formulation assumes that the unknowns are the bus voltage magnitudes. Therefore, there are six unknowns at each node, three real parts and three imaginary parts of positive, negative and zero sequence voltages. Therefore, for a network with N buses, the total unknowns are , corresponding to current mismatch equations for PV buses and current mismatch equations for PQ buses.
Then, the current mismatch equations can be written as:
where:
- are the indices for sequence components 0 (zero), 1 (positive) and 2 (negative).
- are the subscripts for buses i and k, respectively.
- represents the total system current injected into bus i.
- is the demanded current at bus i for sequence j due to the loads and generators connected to the bus.
- represents the complex voltage at bus k and sequence component m.
- is the sequence component admittance matrix element that connect bus i with bus k.
This formulation can be expressed in terms of real and imaginary parts to obtain the problem equations:
The solution of Equations (8) is performed by a Newton–Raphson algorithm where the current mismatch must be forced to zero by means of an iterative process. The currents present a sequence voltage dependence according to the type of load/generator.
This approach represents a compact and flexible formulation, which has been validated in several transmission test systems with unbalanced loads and un-transposed lines [35]. In the case of distribution networks, this approach faces a difficulty when two-phase and single-phase lines must be considered. These unbalanced laterals lead to an ill-conditioned positive sequence problem. To avoid this, two-phase and single-phase lines are modeled as three-phase lines by using one and two dummy lines and dummy nodes, respectively. The dummy nodes do not exist in the real network and are unloaded, so no current flows through the dummy lines, and the voltage drop across them is zero. Hence, there is no coupling between the dummy lines and the other real phases of the line, and the problem is solved by setting the series impedance of the dummy line to any arbitrary value.
4. Wave-To-Wire Model
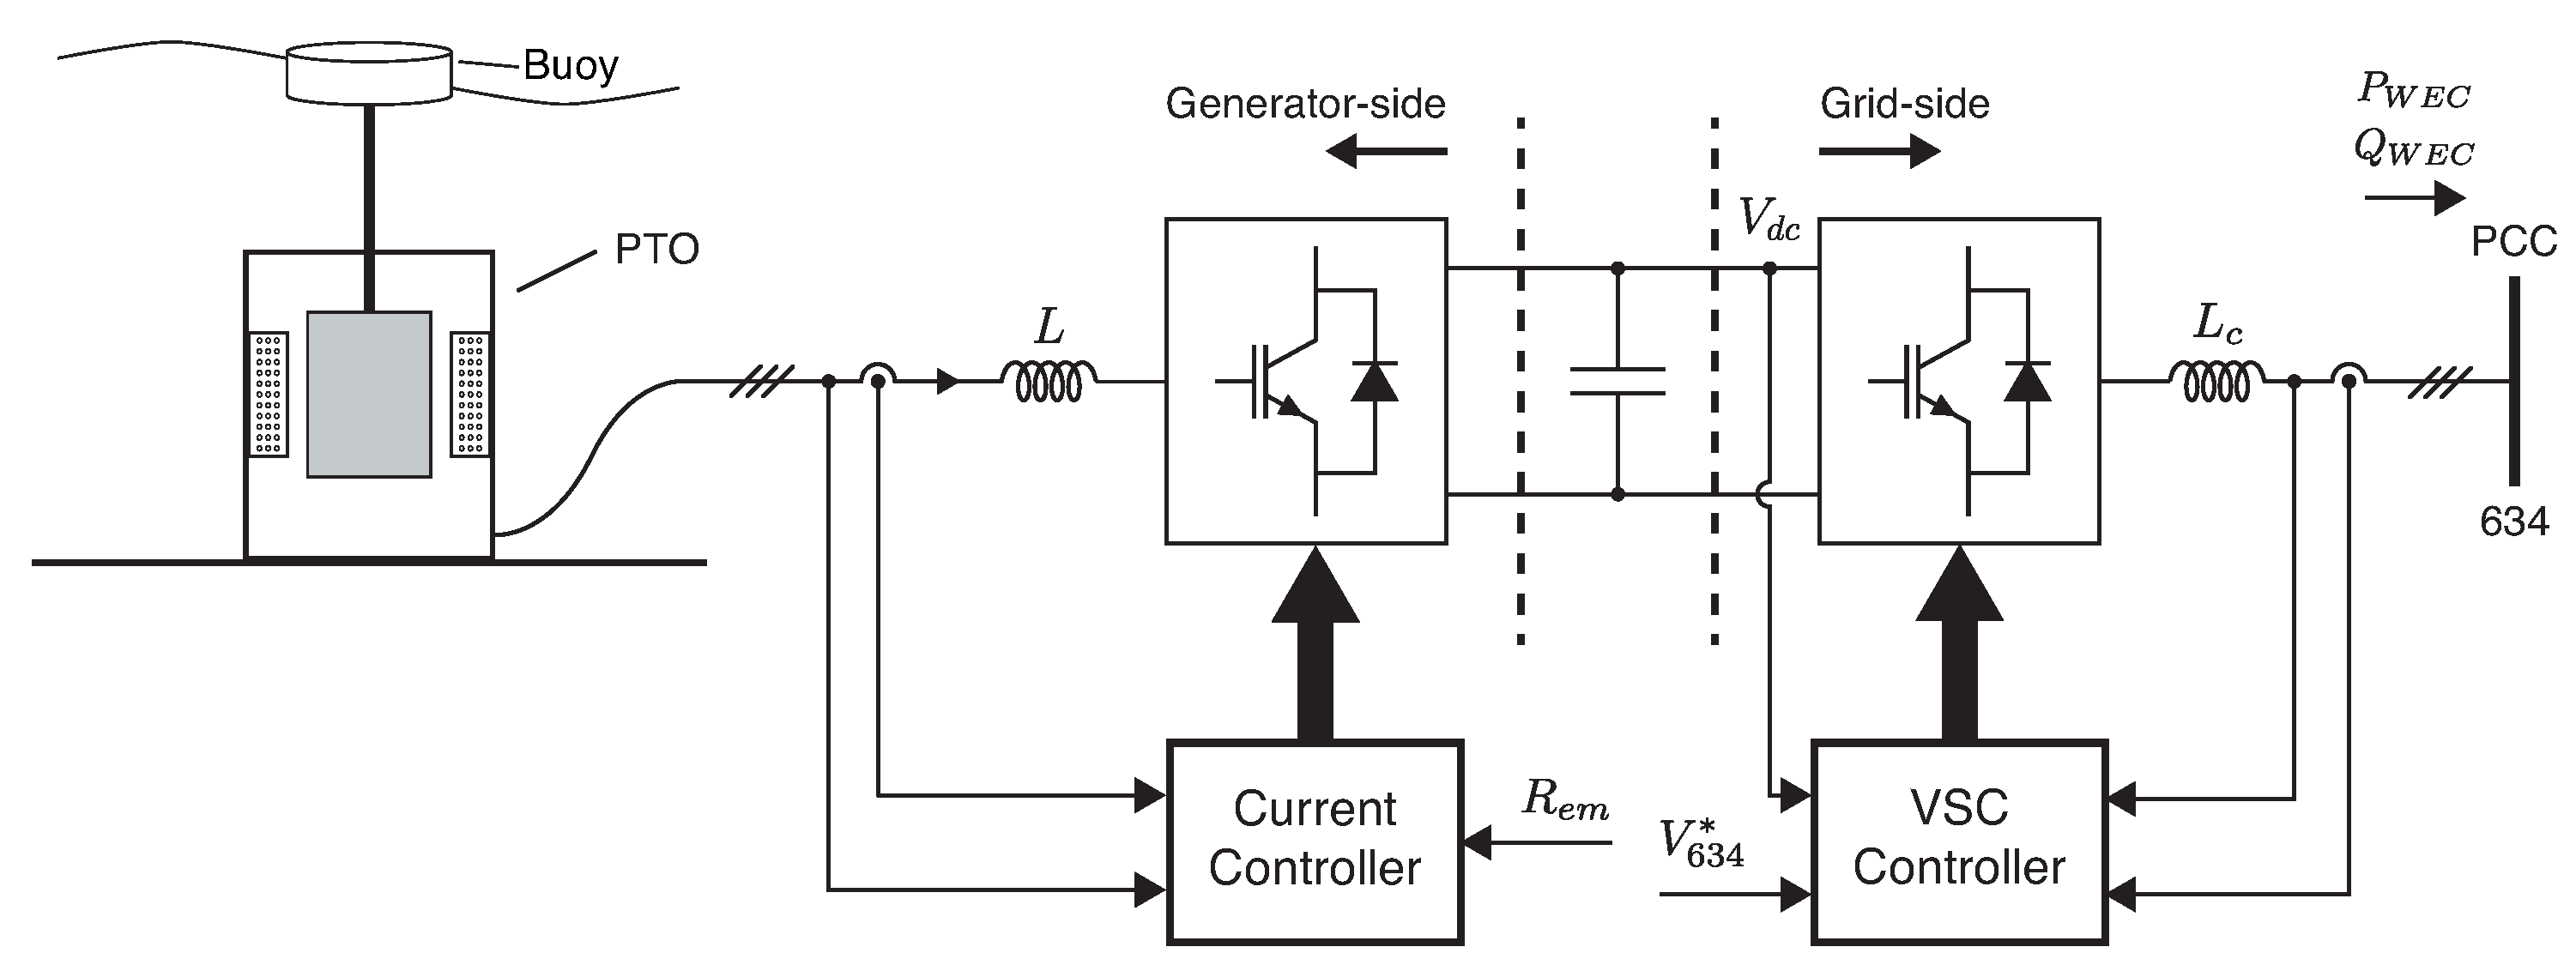
A wave-to-wire model of a WEC is a mathematical model able to simulate or to emulate the whole energy conversion chain, i.e., from the wave energy absorption stage up to the electrical grid connection, as shown in Figure 2, where the WEC is schematically represented by its PTO system and buoy. Particularly, the system in Figure 2 is defined as a direct-drive system, since the mechanical energy from the waves is directly converted into electricity. The Archimedes Wave Swing [36] and the Uppsala/Seabed AB [37] are examples of direct-drive systems.
In this work, according to the classification proposed in [16], a point absorber has been considered, and the details about the WEC dynamics can be found in [29,38]. This absorber is a cylindrical buoy limited to heave motion and rigidly connected to the PTO system. The radius of the cylinder is 5 m; the height is 10 m; and it is submerged 10 m below the free surface. The PTO system is the linear permanent magnet synchronous generator described in [36].
In this system, the wave irregularities both in height and in period are transmitted to the generated electricity. Thus, direct drive systems must be implemented with power electronic converters to interface with the electrical grid. In Figure 2, the generator-side converter is responsible for the AC-DC conversion stage and for the WEC control by means of a current controller. On the other hand, the grid-side converter is responsible for the DC-AC conversion stage, and it can be also used to help to comply with some grid connection requirements by means of a VSC (voltage source converter) controller. The current controller is implemented with the resistance emulation () approach [29], and a strategy to mitigate the voltage fluctuations (described later) is implemented with a PWM-based VSC controller under unbalanced input voltages [39].
5. Voltage Impact
With the three-phase load flow formulation described in Section 3 and the WEC model presented in Section 4, it is possible to study the connection of the WEC to a distribution network and to assess the impact of its power injection on the voltage at different nodes. To illustrate its application, the following is an analysis in which the values of the voltages in all the nodes of a test distribution network are determined in two different cases: null and maximum power injection from the WEC. These cases correspond to extreme operation points that can be reached in just a few seconds.
5.1. Test Distribution Network
The test distribution network is based on the 4.16 kV IEEE 13-bus test feeder [40] shown in Figure 3. The feeder presents an important unbalance not only due to the grid (two three-phase unbalanced laterals, two single-phase laterals and two two-phase laterals), but also to the unbalanced loads of different types (constant power, constant impedance and constant current). The test network includes the following modifications to the original one: the regulator is replaced by the delta-grounded wye three-phase substation transformer with taps in the primary winding adjusted to , in series with the line segment of the original regulator; the distributed load along the line connecting Buses 671 and 632 is modeled as two spot loads of half the total power at Buses 671 and 632; and the WEC described in Section 4 is connected to Bus 634.
It is relevant to mention that in the operation point with no power injection from the WEC, the 500 kVA transformer that connects Buses 633 and 634 is highly loaded with a 494-kVA unbalanced load.
5.2. Network Voltage Profiles
The results of the analysis are shown in Figure 4, where the black bars represent the per unit (p.u.) voltage for each phase at all the network buses when the active and reactive powers injected by the WEC are null. Note that Buses 680 and 692 are not shown, since Bus 680 is unloaded, and a breaker connects Buses 692 and 671. Similar to Equation (3) for the balanced case, an increase in the power injection from the WEC leads to an increase in voltage at the PCC, that also propagates to the rest of the buses. The detail for the unbalanced test network is represented with white bars in Figure 4, which shows the case in which the WEC generates its rated active power (), without reactive injection.
6. Corrective Actions Based on VAR Compensation
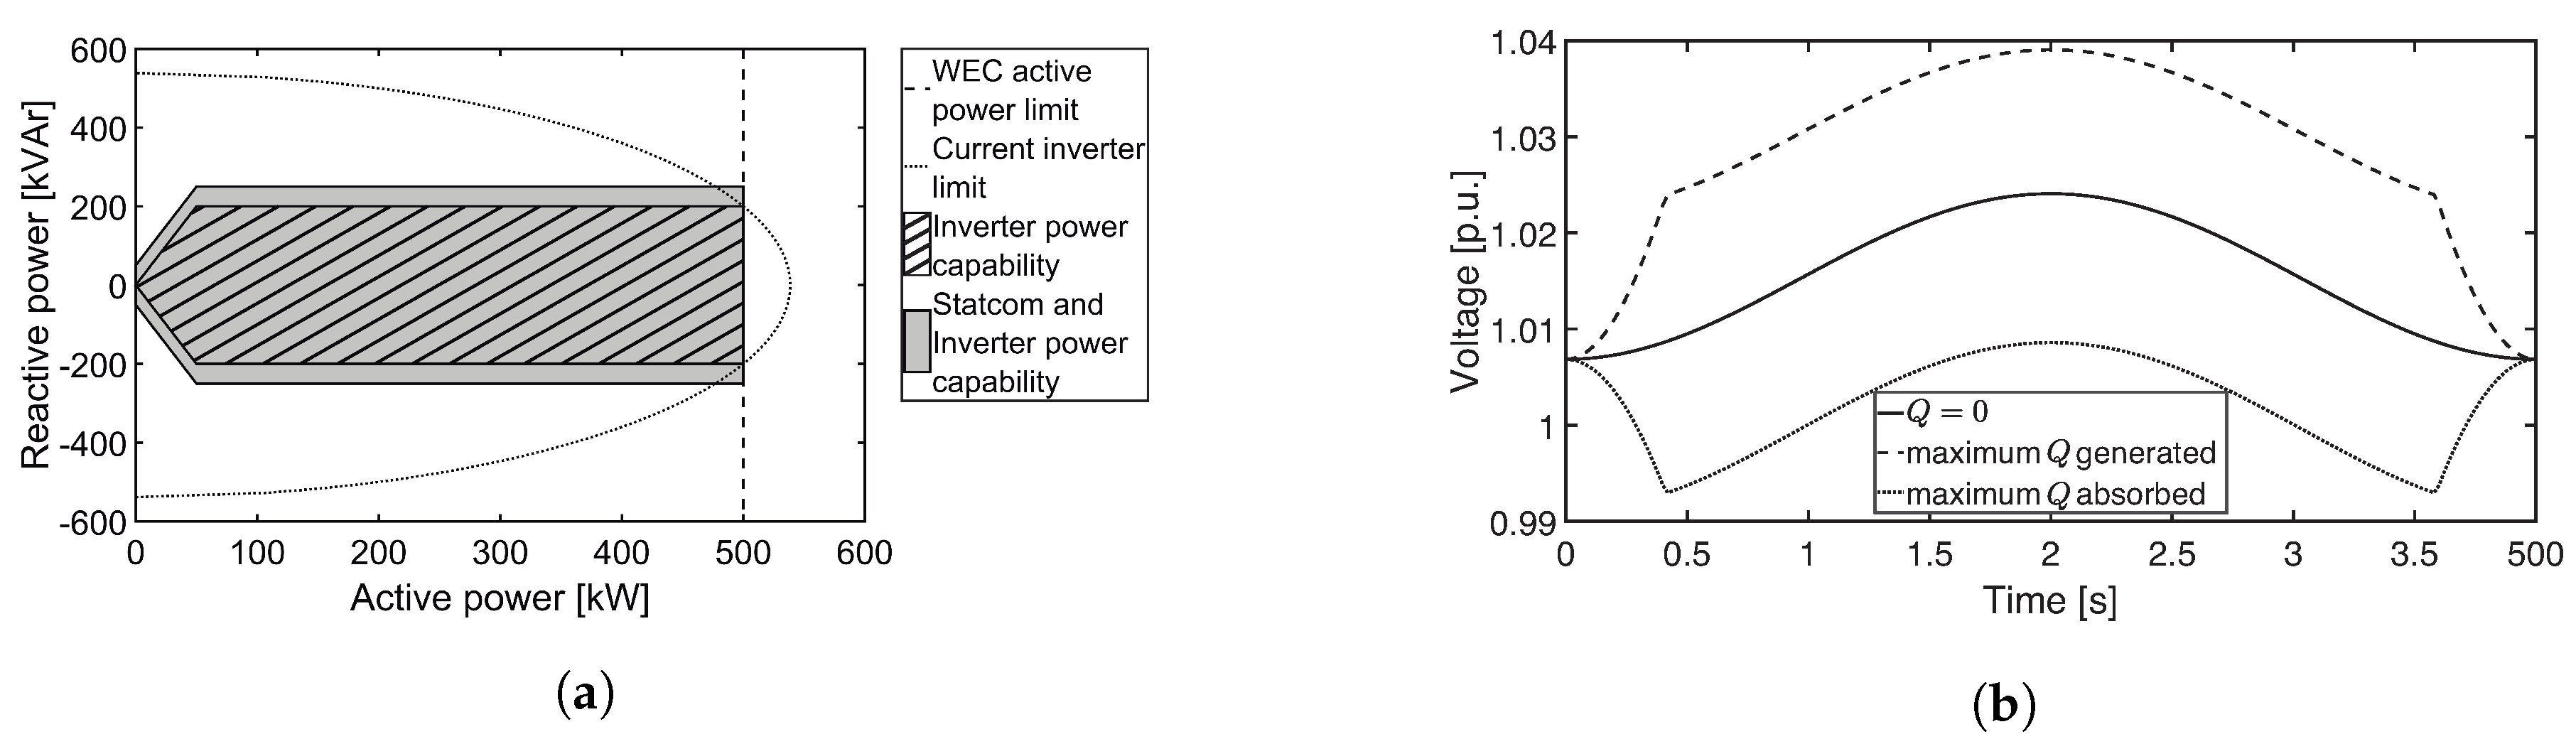
As mentioned in Section 4, the WEC connects to the grid through power electronics. The grid-side converter is responsible for keeping the DC voltage constant by transferring the active power from the electrical generator to the grid. Although this is its main task, it is important to note that the grid-side converter is also capable of interchanging (generating or absorbing) reactive power with the grid, within given limits that are defined by a maximum current, , or a Volt-Ampere (VA) constraint . Thus, the reactive limits depend on the active power injected by the WEC:
The dotted line of Figure 5a represents these limits in the case of the converter used in this work. However, the real active power is bounded by the WEC rating (dashed line). Stability and other practical issues impose other limits on the reactive power, so that the real active and reactive capabilities of the converter are limited to the hatched area of Figure 5a.
To illustrate the inverter’s ability to generate or absorb reactive power according to the generated active power, let us consider the power production from a regular wave:
where (the WEC power rating) and is the power period. The solid line of Figure 5b represents the voltage fluctuation at PCC due to the injection of this fluctuating active power with no interchange of reactive power. The dashed and dotted lines represent the corresponding voltage evolution if the reactive power is set to its maximum and minimum limits, respectively. If the reactive power is set to operate in any other value within these limits, the voltage values would be within the area defined by these lines in Figure 5b for this particular power profile. Therefore, any voltage trajectory within this area (for example, with less fluctuations) is reachable by controlling the reactive power. A desirable situation is to keep the voltage constant. For example, in a balanced system, the control variable is the PCC rms voltage, as in [27].
In real unbalanced systems, as the one described in this paper, the bus voltages are different in each phase. On the other hand, the grid-side converter is composed of one three-phase inverter, which is only able to generate three-phase balanced reactive power from just one control variable. To implement this control, in this work, we propose to use the mean bus voltage defined as the mean of the rms voltage in each phase of a bus. For instance, the mean bus voltage of bus 634 is .
As the electrical grid dynamics is much faster than the generated power dynamics, the distribution grid in Figure 3 can be simulated as a quasi-static model, i.e., the voltage phasors in each bus and phase are calculated in steady state for a given that varies in time. Finally, the amount of reactive power generated by the inverter is calculated in the reactive power control loop inside the VSC controller shown in Figure 6. The plant is the power flow discussed in Section 3, where the outputs are the three-phase rms voltages. The PI controller has been tuned to be as fast as possible. Besides, as the reactive power is bounded, an anti-windup system has been implemented. Note that, in the reactive power control loop, the dynamics is only due to the PI controller and the anti-windup system.
Sometimes, the reactive capability of the inverter is not high enough to completely mitigate the voltage fluctuation. In this case, a STATCOM could be used to provide extra reactive power. In this work, a 50-kVAr STATCOM is implemented as a reactive power load at Bus 634. The combination of both inverter and STATCOM results, in practice, in an expansion of the operating area of the reactive compensation as shown in the grey area in Figure 5a. In this case, the reactive power of the STATCOM is , with . Once the STATCOM reaches its limit, the voltage becomes uncontrolled. The STATCOM is only on when , i.e., the grid requires more reactive power to keep the voltage level than the grid-side converter capability.
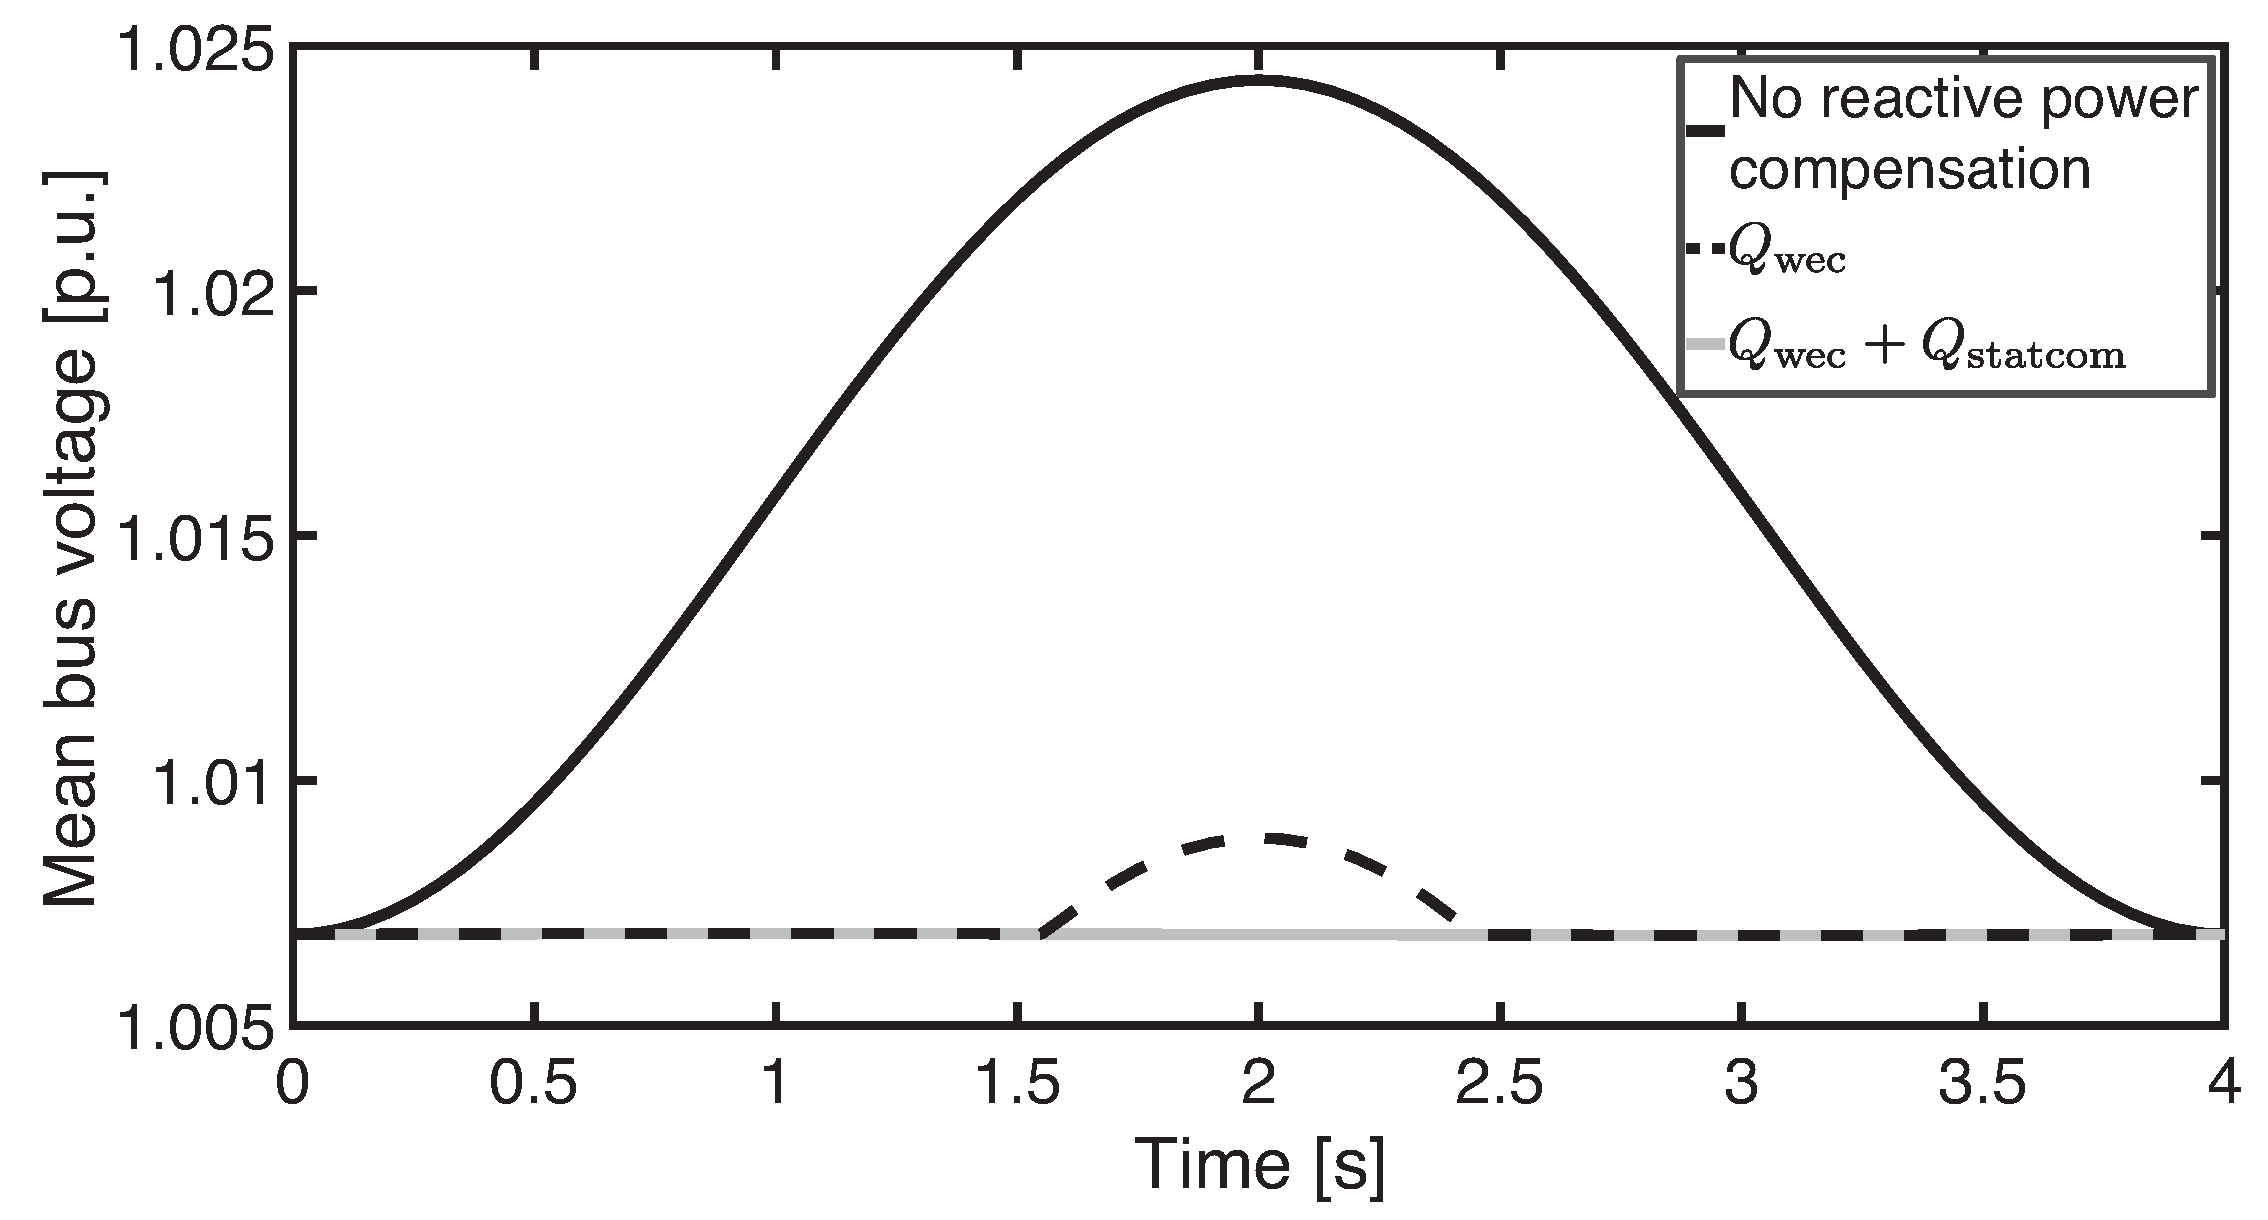
To illustrate this controller behavior, the sinusoidal power in Equation (10) has been injected into Bus 634. The black solid line in Figure 7 is the mean bus voltage fluctuation at this bus (). The reference voltage controller is set to the value of for the default network. If only the inverter is operating and its controller is enabled, is kept at its reference value for almost all the time, as shown in Figure 7 by the dashed line. After about 1.5 s, the inverter reaches its reactive power limit, and therefore, the voltage is uncontrolled and varies according to . On the other hand, when both the inverter and STATCOM are operating, the voltage fluctuation is completely mitigated as shown in Figure 7 by the grey line. In this latter case, , i.e., the STATCOM absorbs 25 kVAr at this instant; therefore, it is half loaded.
7. Simulation Results
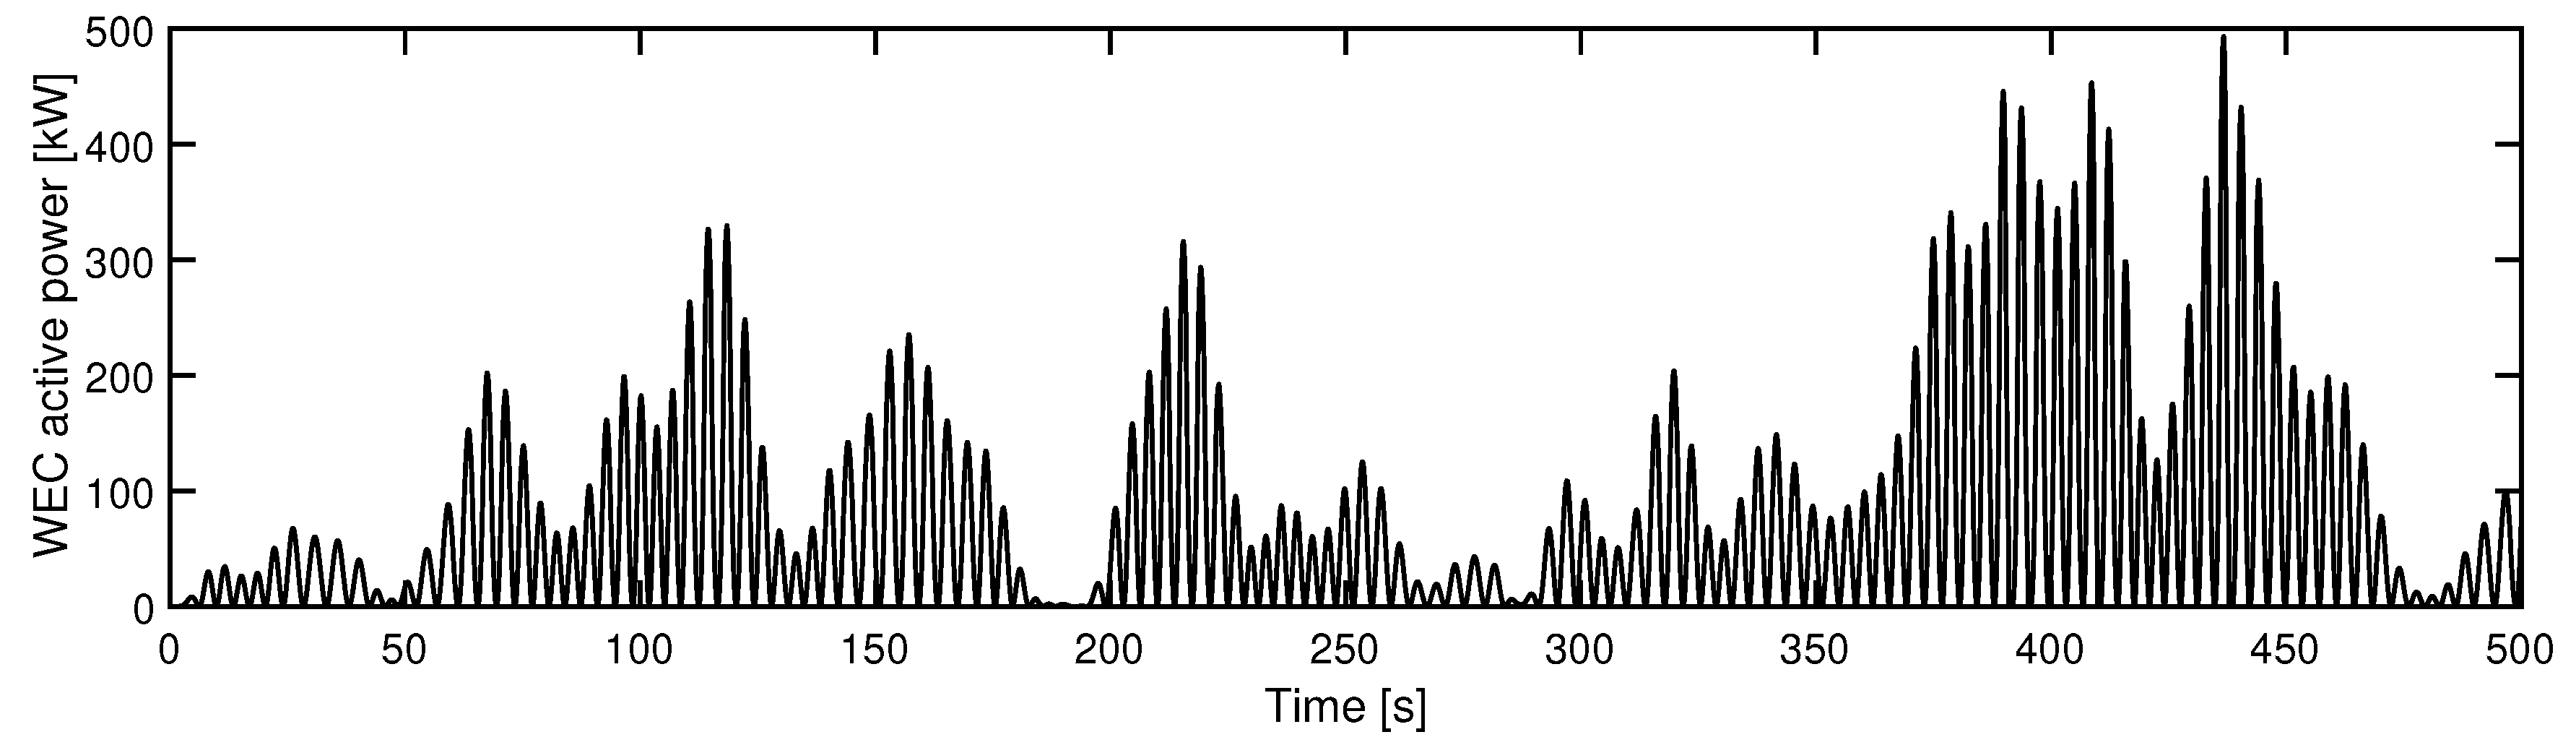
In this section, the voltage fluctuation due to a very variable power injection into the grid, as well as the proposed actions to mitigate this fluctuation are assessed. For this purpose, the WEC is connected to the electrical grid as shown in Figure 2 through Bus 634, and it is excited by an incoming wave mathematically generated from the ITTC spectrum [41], defined by its statistical parameters: significant wave height () and energy period (). The electrical power delivered to the grid is shown in Figure 8. As described in Section 6, the correction actions assessed are based on the generation or absorption of reactive power by the grid-side converter or the combination of both grid-side converter and STATCOM.
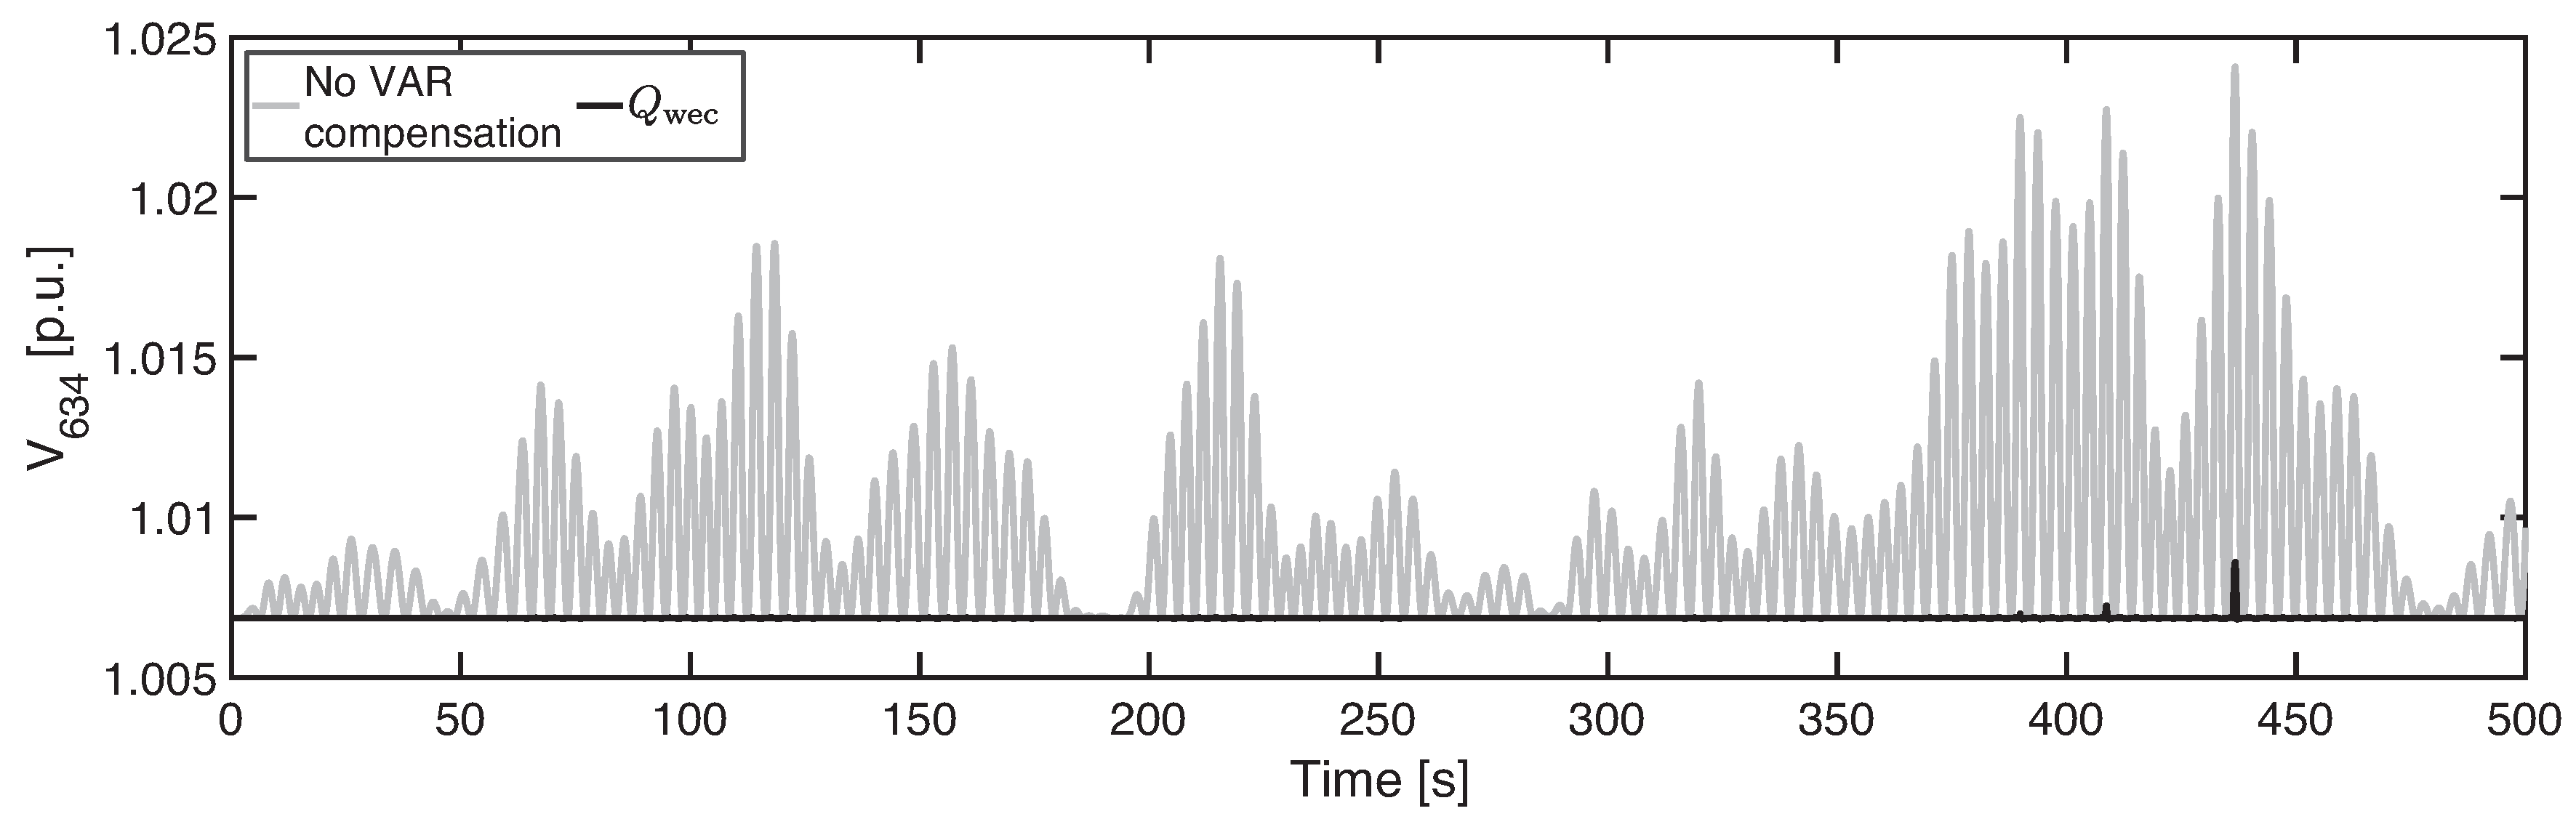
The fluctuation of the mean bus voltage caused by the WEC on the PCC without VAR compensation is shown in Figure 9 (grey line). The waveform of the voltage fluctuation follows the injected power waveform. When the injected power reaches its highest value, the voltage is about 1.7% higher than the default case. This value may seem low, and in addition, it is within permissible deviation ranges. However, areas with greater waves generate higher fluctuations. Furthermore, according to the first term in Equation (3), the voltage increment depends on the the grid stiffness. Therefore, in weaker grids, with higher R, these effects are amplified. Figure 9 also shows the mitigation effectiveness with the use of VAR compensation by the grid-side converter according to the proposed control strategy. The corrected mean bus voltage (black line) is kept constant almost all the time. Only when the power excursion experiments high values, as between 400 and 450 s, the WEC is not able to keep at its reference value.
The detail of the the mean bus voltage within the interval between 400 and 450 s and the VAR compensation is shown in Figure 10a. The black line is , and the grey line is the amount of reactive power injected by the grid-side converter. As the active power generated by the WEC drives above its reference value, the grid-side converter operates absorbing (negative injection) more or less reactive power to mitigate the fluctuations. As previously commented, in this interval, the grid-side converter has reached its limit twice; then, during these short periods, the voltage is no longer controllable, and it varies according to the WEC active power. On the other hand, if, in addition to the grid-side converter, the VAR compensation is complemented by the STACOM, the voltage fluctuations are completely mitigated as shown in Figure 10b. It is clear that the greater reactive power contribution is done by the grid-side converter, and the STATCOM just occasionally complements the VAR compensation. Indeed, in this scenario, the STATCOM is practically not necessary, since the variation in Figure 10a is negligible.
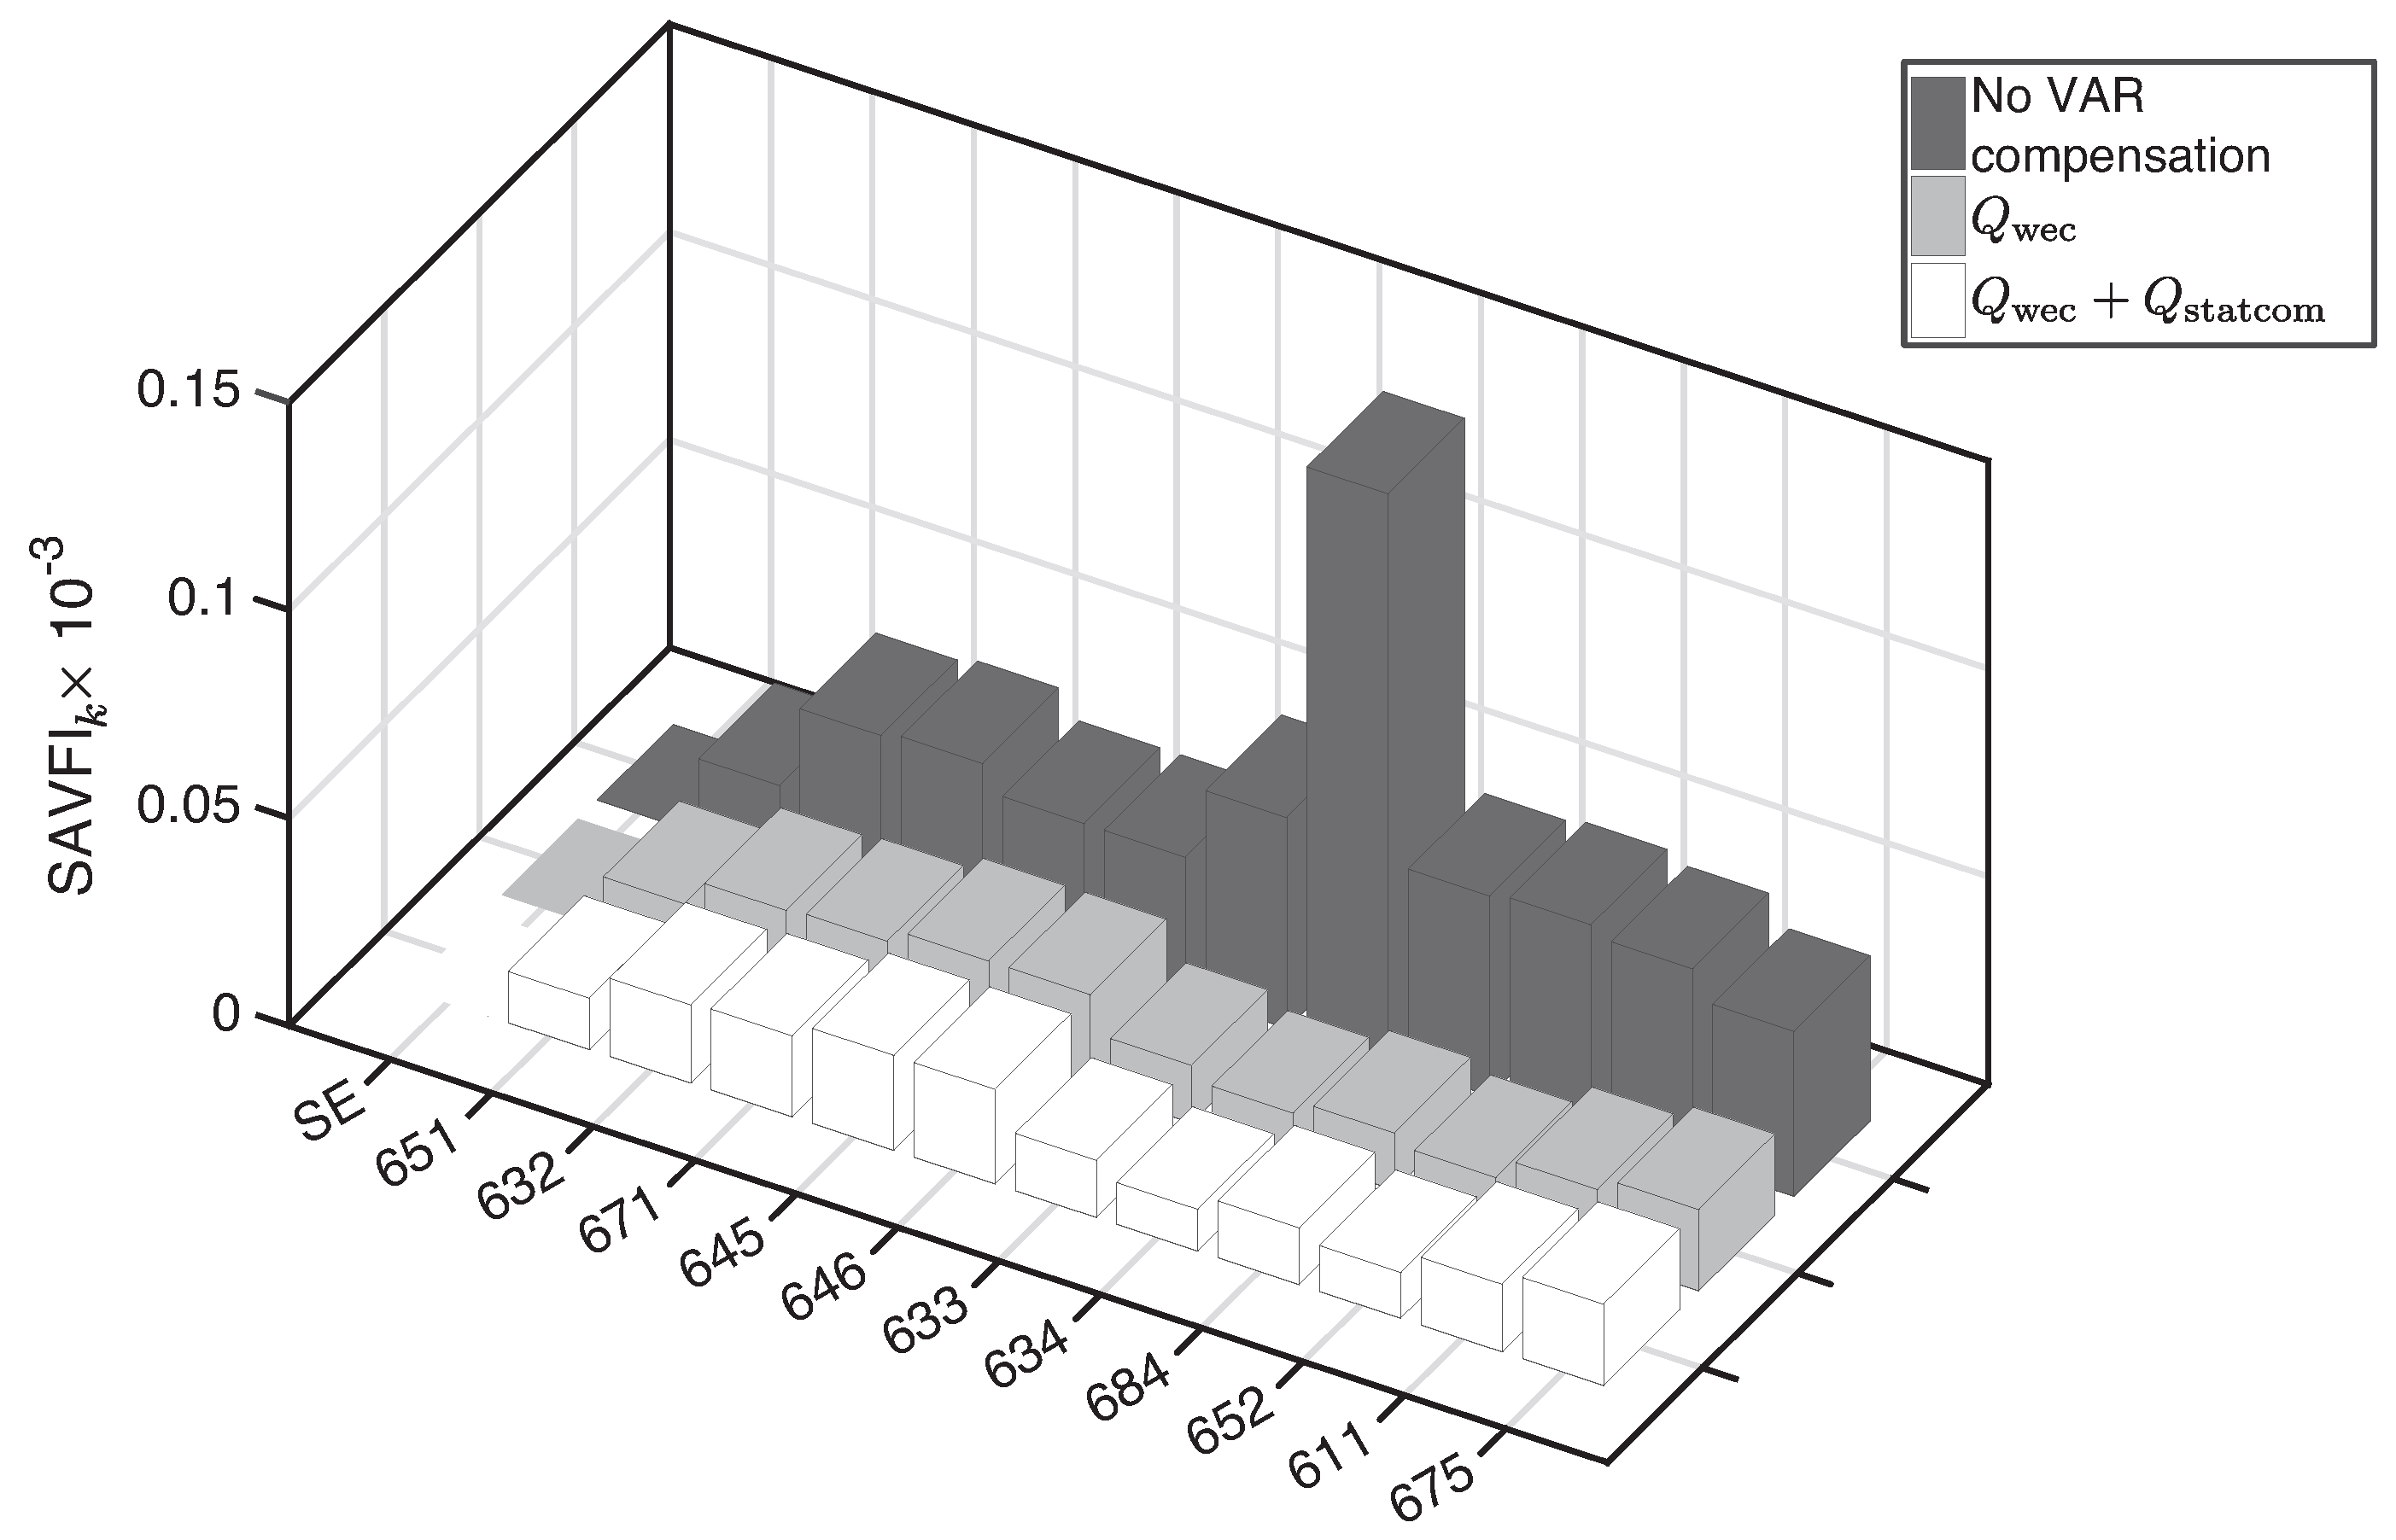
So far, only the mitigation of the mean bus voltage has been assessed. However, this is not the real voltage. As an unbalanced system has been considered, each phase at each bus may have different fluctuations depending on the grid topology and the load level per phase. The voltage fluctuation may be assessed by the SAVFI per bus (Equation (6)) as shown in Figure 11, where it is possible to see how the voltage fluctuation propagates along the buses. As expected, the PCC (Bus 634) presents the highest fluctuations, and the combination of grid-side converter and STATCOM does not represent a significant improvement for the grid. However, it is interesting to have its usage in mind, since the WEC reactive capability may be reduced by the WEC commitment with some other grid requirements [19], for example to comply with low-voltage ride-through requirements. It is also easy to see that the buses farther from the infinite bus are more susceptible to fluctuations, and at the same time, they present a much better response to VAR compensation. Table 1 summarizes the SAVFI reduction per bus after VAR compensation. Only Buses 651, 645 and 646 present a reduction lower than 50% due to a stiffer connection to the infinite bus. The global SAVFI, in turn, is reduced by 65.95%.
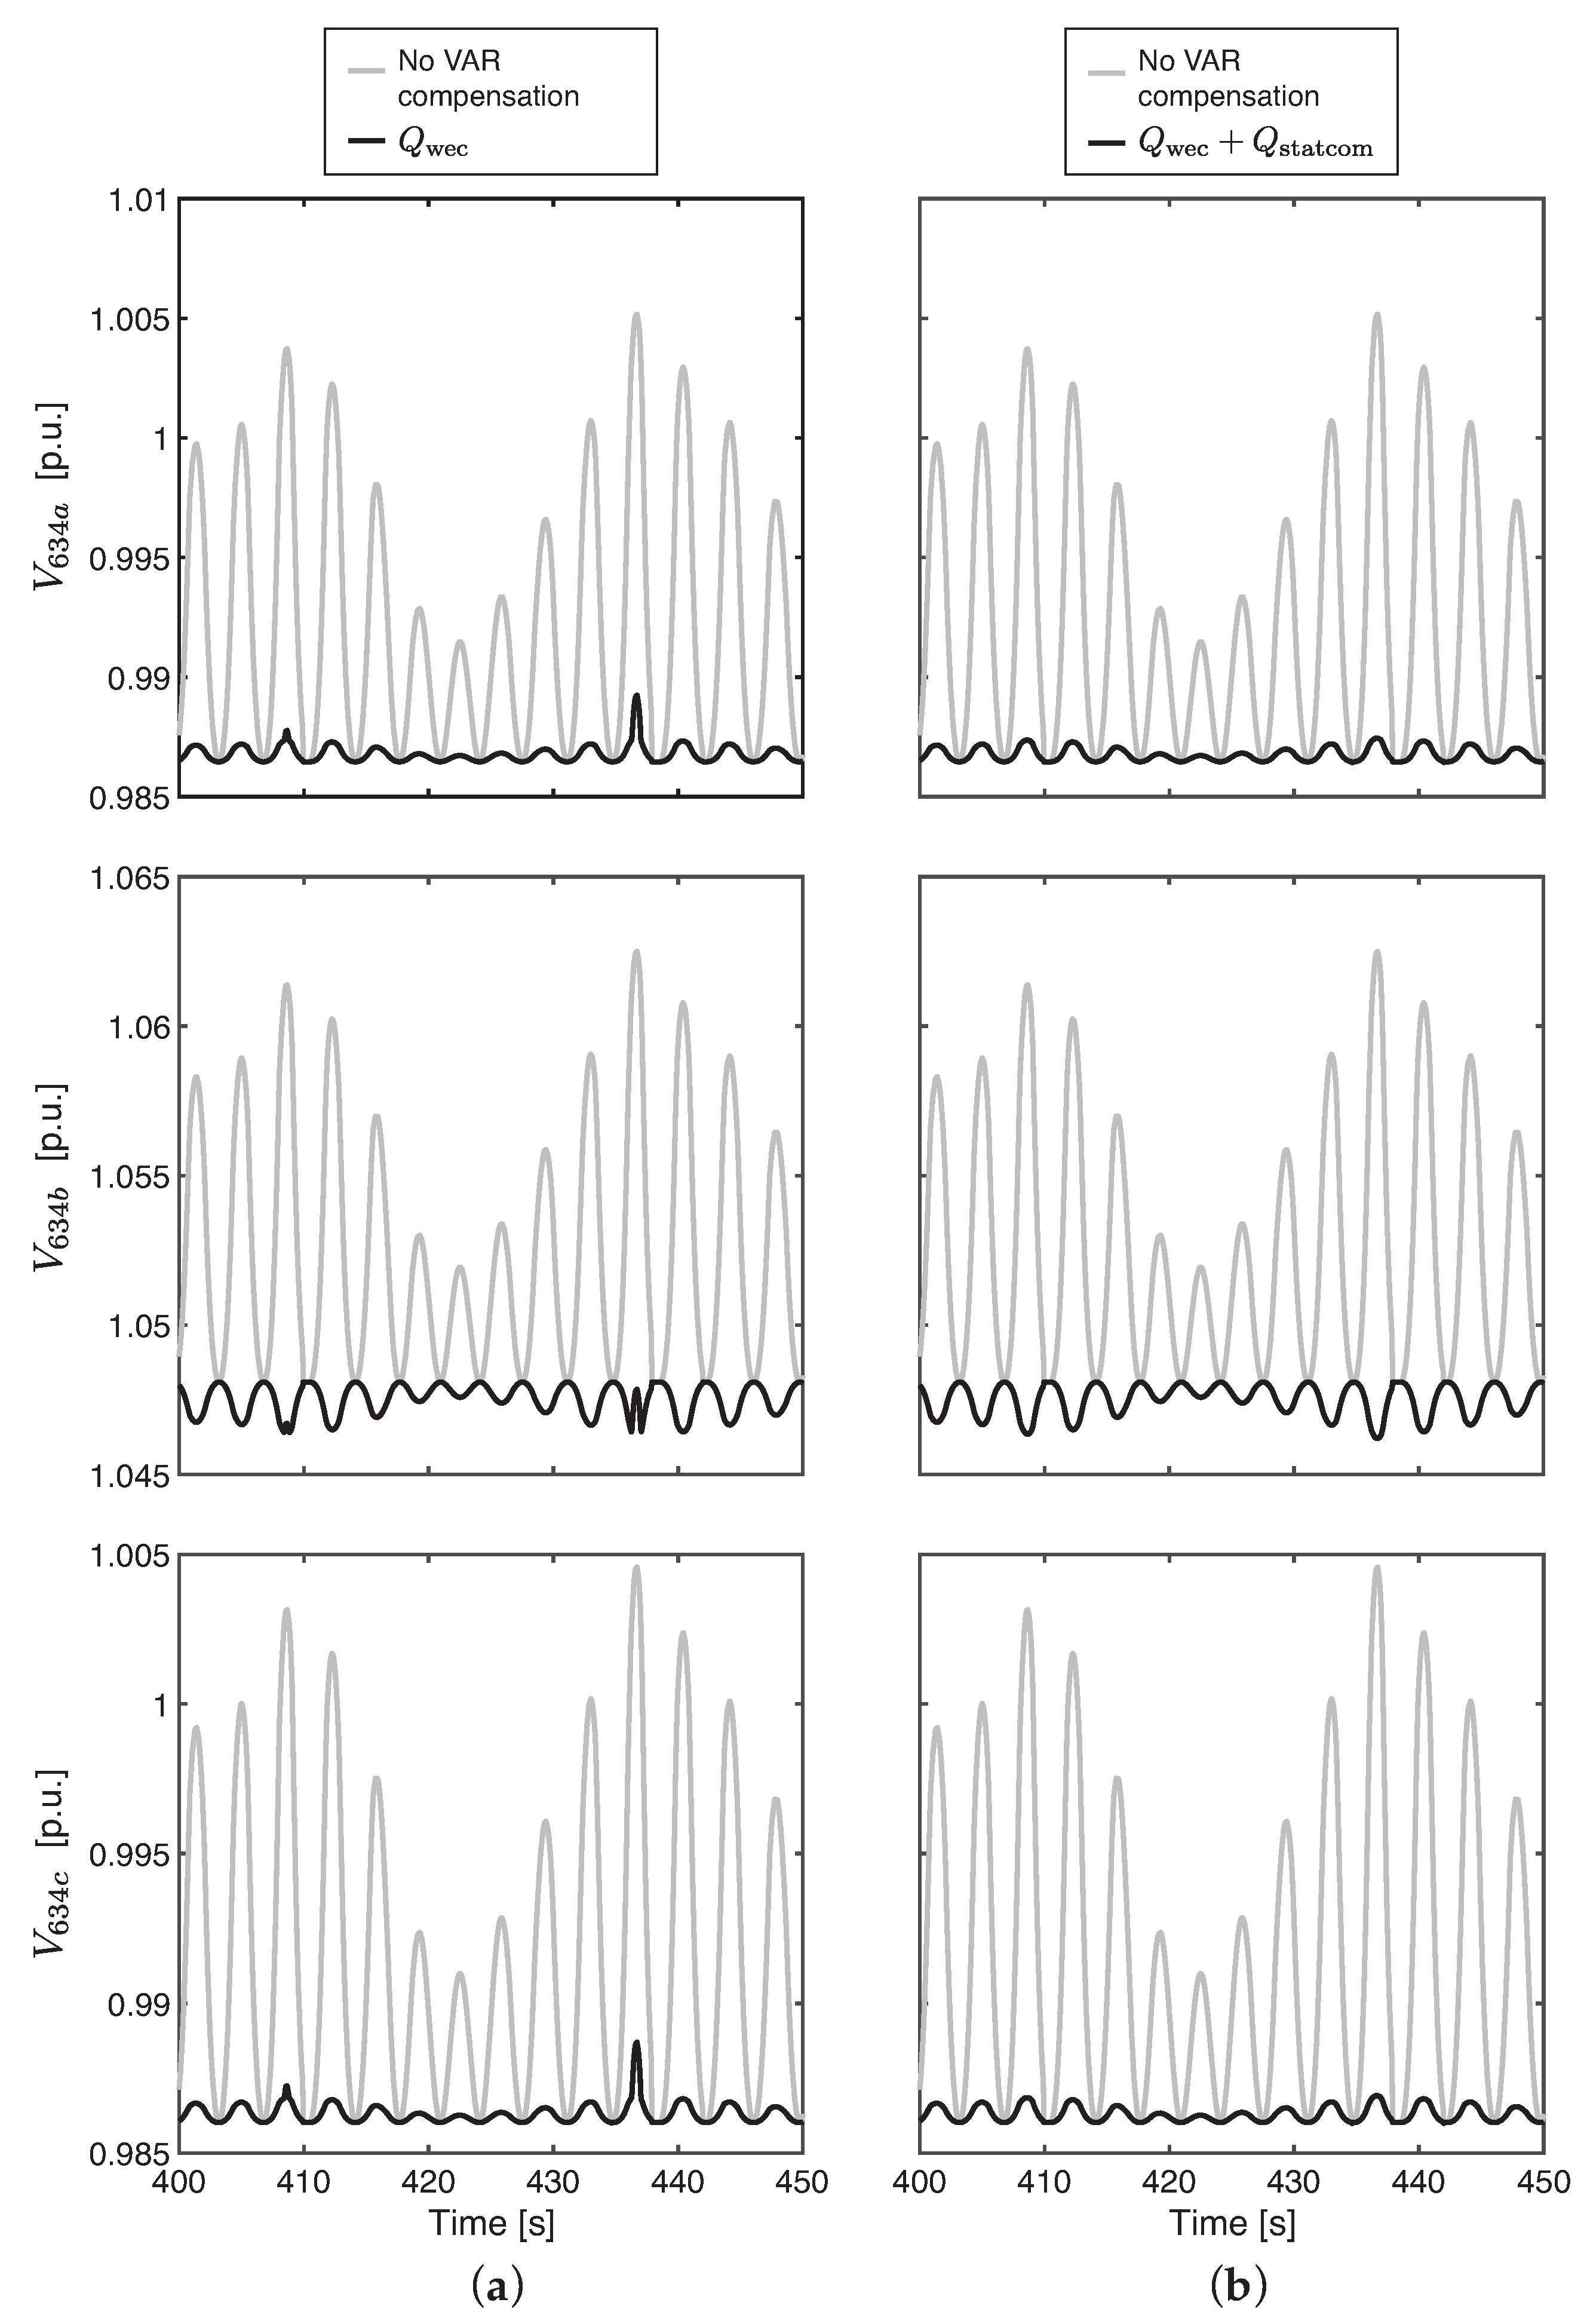
Figure 12 shows the per-phase voltage fluctuation at Bus 634 without and with VAR compensation, where the left column is for the grid-side converter and the right one is for both the grid-side converter and STATCOM. As was verified for the mean bus voltage, the STATCOM backs the grid-side converter up just during high peaks of power. In addition, the fluctuation reduction in phase-b is lower than phase-a and -c. In any case, the VFindex achieves a great reduction. For example, at Bus 634, the VF is reduced by 94.43%, 86.50% and 94.73% in phase-a, -b and -c, respectively.
Finally, to quantify the voltage unbalance in the test grid, the percent voltage unbalance factor defined as the ratio of the negative sequence voltage component to the positive sequence voltage component is used [42]. Figure 13 shows the voltage unbalance factor in each bus of the test grid for null active power injected by the WEC and for the maximum active power injected by the WEC. In addition, for the latter case, three different scenarios are shown: no VAR compensation, VAR compensation by the grid-side converter and by the combination of grid-side converter and STATCOM.
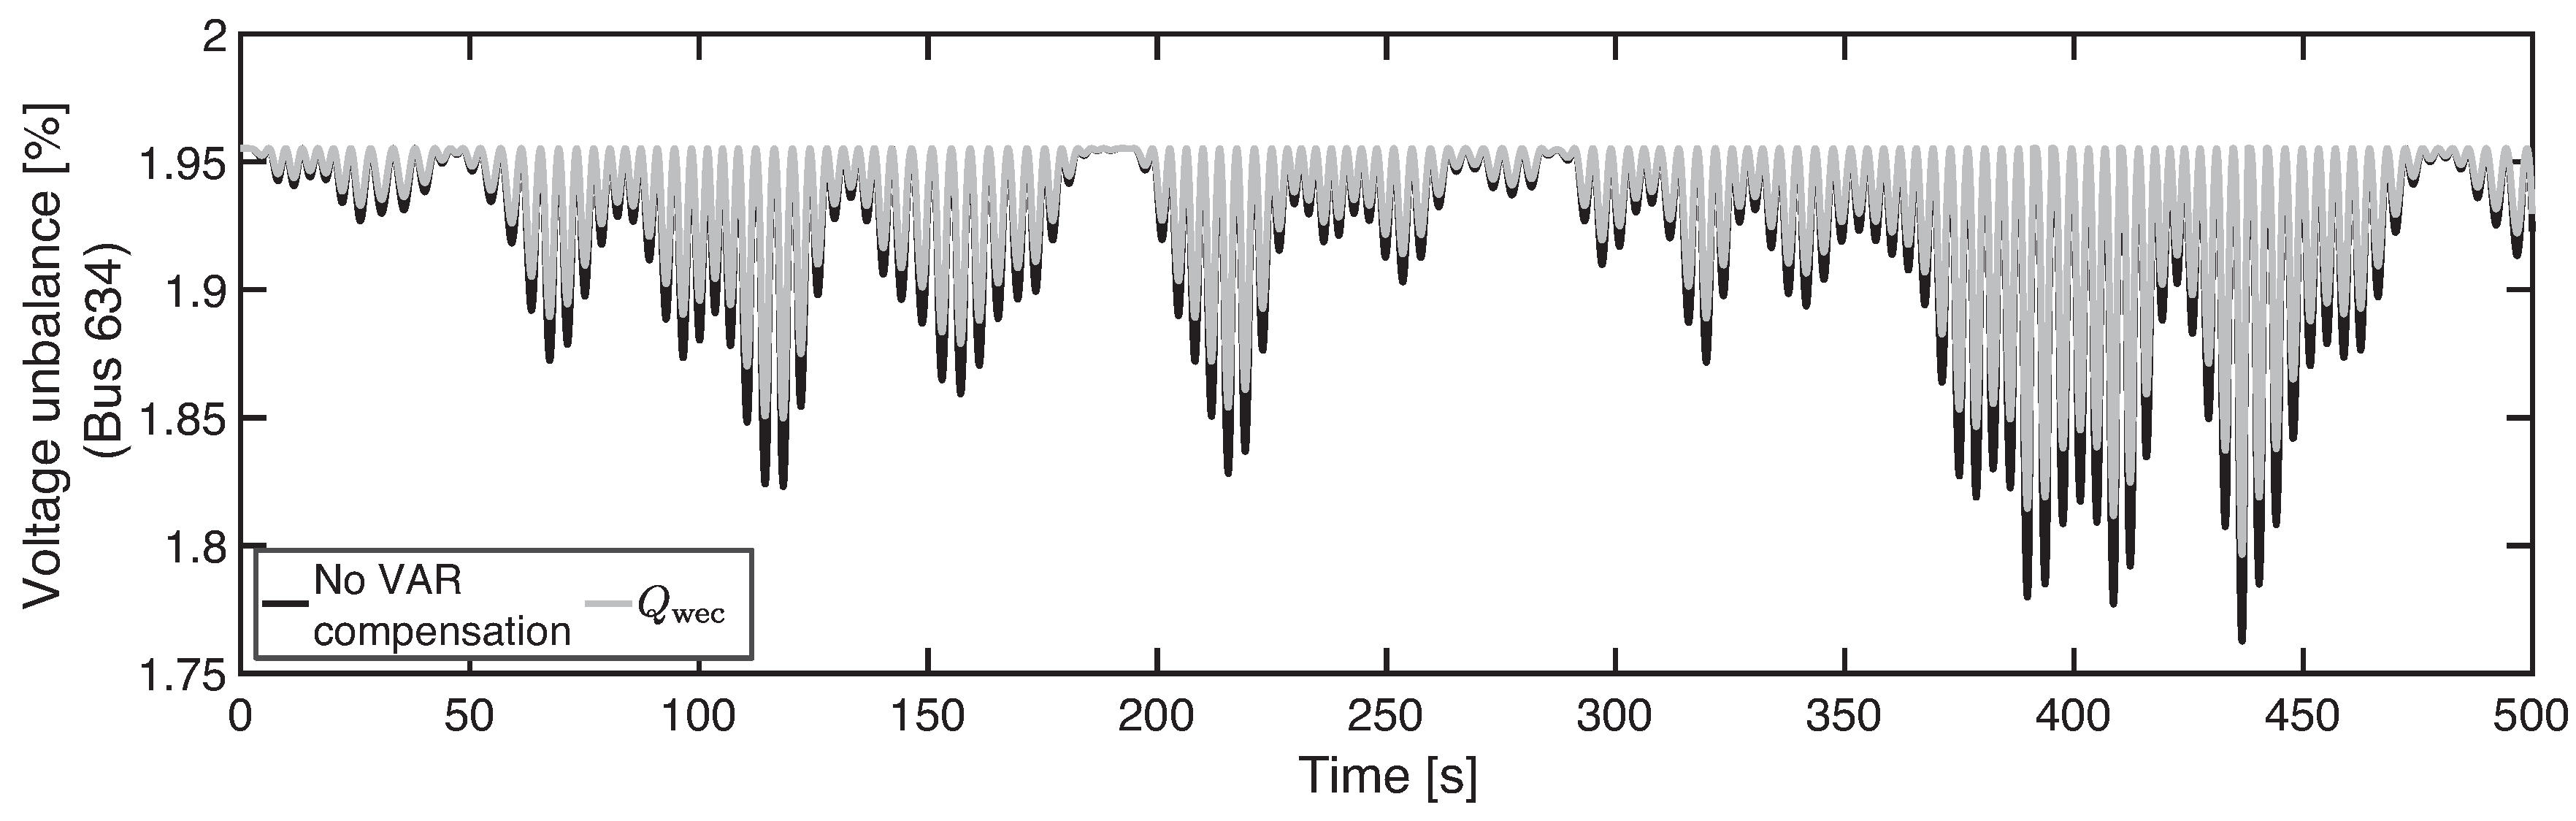
It can be seen that the test grid has an important voltage unbalance for , even with values exceeding the typical ones: 0.5–2% [43]. The injection of a balanced active power by the WEC contributes to a small reduction of the voltage unbalance as shown in Figure 13 for the maximum . The consumption of reactive power by the grid-side converter due to the corrective action adopted to mitigate voltage fluctuations results in a very small increase of the unbalance voltage factor with respect to the case without VAR compensation. Furthermore, the effect of an extra VAR compensation by the STATCOM on the unbalance voltage is insignificant in this case. Considering the unbalance voltage along time, Figure 14 shows the behavior of the unbalance voltage factor at PCC according to the injection of active and reactive powers by the WEC. The mean of the voltage unbalance factor within the period (500 s) is 1.928% without VAR compensation, whereas it slightly increases to 1.933% if the proposed fluctuation compensation technique is applied. As conclusion, the technique is effective at compensating voltage fluctuations without practically affecting the unbalance. Further research is suggested to expand the capability of the technique to incorporate improvements on the voltage unbalance.
8. Conclusions
Despite the incipient development status of WEC technologies, some of them have been already connected to the electrical grid in test sites and more are expected in the near future. Thus, studies on the impact of their connection and compliance with grid requirements are needed. The WEC locations and their power level lead to a connection to distribution grids, which are normally unbalanced and more sensitive to active power variations than transmission grids.
In this work, the connection of a WEC to an unbalanced distribution grid has been analyzed showing that the oscillating active power injection from the WEC leads to a similar fluctuation in the voltage of the different phases and buses. A strategy for mitigating these fluctuations based on using the VAR capability of the grid-side converter of the WEC has been proposed. As grid-connected converters are typically three phase, the reactive power control is made by means of just one control variable. The proposed mean bus voltage has been demonstrated to be a simple yet effective choice.
In some cases, as the one presented in this paper, the WEC converter is able to mitigate the voltage fluctuations. In other cases, a STATCOM can be used to provide an extra VAR support that, in addition, might be useful if the WEC is committed to other grid requirements that would reduce the WEC reactive capability.
Acknowledgments
This work was supported in part by CAPES, Coordination for the Improvement of Higher Level Personnel (Brazil) under Grant BEX-9376135, in part by the Spanish Ministry of Economy and Competitivity under Grant ENE2012-36981 and in part by the project 2015-EU-TM-0417 OPSMaster Plan for Spanish Ports that is co-financed by the Connecting Europe Facility (CEF) for the building of the European Union’s TEN-T.
Author Contributions
H.M. and S.M.conceived of and designed the research idea. H.M., R.M.d.C. and D.M. developed the analysis tools. H.M., R.M.d.C. and S.M. analyzed the results and wrote the paper.
Conflicts of Interest
The authors declare no conflict of interest.
References
- Rusu, L.; Onea, F. The performance of some state-of-the-art wave energy converters in locations with the worldwide highest wave power. Renew. Sustain. Energy Rev. 2017, 75, 1348–1362. [Google Scholar]
- Atan, R.; Goggins, J.; Nash, S. A Detailed Assessment of the Wave Energy Resource at the Atlantic Marine Energy Test Site. Energies 2016, 9, 967. [Google Scholar] [CrossRef]
- Franzitta, V.; Catrini, P.; Curto, D. Wave Energy Assessment along Sicilian Coastline, Based on DEIM Point Absorber. Energies 2017, 10, 376. [Google Scholar] [CrossRef]
- Bento, A.R.; Martinho, P.; Soares, C.G. Wave Energy Resource Assessment for Northern Spain from a 13-Year Hindcast; Taylor & Francis Group: London, UK, 2015. [Google Scholar]
- Franzitta, V.; Curto, D.; Rao, D. Energetic sustainability using renewable energies in the Mediterranean Sea. Sustainability 2016, 8, 1164. [Google Scholar]
- Morim, J.; Cartwright, N.; Etemad-Shahidi, A.; Strauss, D.; Hemer, M. Wave energy resource assessment along the Southeast coast of Australia on the basis of a 31-year hindcast. Appl. Energy 2016, 184, 276–297. [Google Scholar] [CrossRef]
- Wu, S.; Liu, C.; Chen, X. Offshore wave energy resource assessment in the East China Sea. Renew. Energy 2015, 76, 628–636. [Google Scholar] [CrossRef]
- Kumar, V.S.; Anoop, T. Wave energy resource assessment for the Indian shelf seas. Renew. Energy 2015, 76, 212–219. [Google Scholar] [CrossRef]
- Contestabile, P.; Ferrante, V.; Vicinanza, D. Wave energy resource along the coast of Santa Catarina (Brazil). Energies 2015, 8, 14219–14243. [Google Scholar] [CrossRef]
- López, M.; Veigas, M.; Iglesias, G. On the wave energy resource of Peru. Energy Convers. Manag. 2015, 90, 34–40. [Google Scholar] [CrossRef]
- Alonso, R.; Solari, S.; Teixeira, L. Wave energy resource assessment in Uruguay. Energy 2015, 93, 683–696. [Google Scholar] [CrossRef]
- López, I.; Andreu, J.; Ceballos, S.; de Alegría, I.M.; Kortabarria, I. Review of wave energy technologies and the necessary power-equipment. Renew. Sustain. Energy Rev. 2013, 27, 413–434. [Google Scholar] [CrossRef]
- EMEC—The European Marine Energy Centre. Available online: http://www.emec.org.uk/marine-energy/wave-developers/ (accessed on 26 September 2017).
- National Renewable Energy Laboratory. Marine and Hydrokinetic Technology Database. Available online: https://openei.org/wiki/Marine_and_Hydrokinetic_Technology_Database (accessed on 26 September 2017).
- Lehmann, M.; Karimpour, F.; Goudey, C.A.; Jacobson, P.T.; Alam, M.R. Ocean wave energy in the United States: Current status and future perspectives. Renew. Sustain. Energy Rev. 2017, 74, 1300–1313. [Google Scholar] [CrossRef]
- Falcão, A.F.O. Wave energy utilization: A review of the technologies. Renew. Sustain. Energy Rev. 2010, 14, 899–918. [Google Scholar] [CrossRef]
- Momoh, J.A.; Meliopoulos, S.; Saint, R. Centralized and Distributed Generated Power Systems—A Comparison Approach; Future Grid Initiative White Paper; Power Systems Engineering Research Center: Tempe, AZ, USA, 2012; pp. 1–10. [Google Scholar]
- Braun, M.; Stetz, T.; Bründlinger, R.; Mayr, C.; Ogimoto, K.; Hatta, H.; Kobayashi, H.; Kroposki, B.; Mather, B.; Coddington, M.; et al. Is the distribution grid ready to accept large-scale photovoltaic deployment? State of the art, progress, and future prospects. Prog. Photovolt. Res. Appl. 2012, 20, 681–697. [Google Scholar] [CrossRef]
- Etxegarai, A.; Eguia, P.; Torres, E.; Iturregi, A.; Valverde, V. Review of grid connection requirements for generation assets in weak power grids. Renew. Sustain. Energy Rev. 2015, 41, 1501–1514. [Google Scholar] [CrossRef]
- Santos-Mugica, M.; Robles, E.; Endegnanew, A.G.; Tedeschi, E.; Giebhardt, J. Grid integration and power quality testing of Marine Energy Converters: Research Activities in the MARINET project. In Proceedings of the IEEE 2014 Ninth International Conference on Ecological Vehicles and Renewable Energies (EVER), Monte-Carlo, Monaco, 25–27 March 2014; pp. 1–9. [Google Scholar]
- O’Sullivan, D.; Dalton, G. Challenges in the grid connection of wave energy devices. In Proceedings of the 8th European Wave and Tidal Energy Conference, Uppsala, Sweden, 7–10 September 2009. [Google Scholar]
- Barker, P.P.; De Mello, R.W. Determining the impact of distributed generation on power systems. I. Radial distribution systems. In Proceedings of the IEEE 2000 Power Engineering Society Summer Meeting, Seattle, WA, USA, 16–20 July 2000; Volume 3, pp. 1645–1656. [Google Scholar]
- Blavette, A.; O’Sullivan, D.L.; Alcorn, R.; Lewis, T.W.; Egan, M.G. Impact of a medium-size wave farm on grids of different strength levels. IEEE Trans. Power Syst. 2014, 29, 917–923. [Google Scholar] [CrossRef]
- IEC 61400-21—Wind Turbine Generator Systems—Part 21: Measurement and Assessment of Power Quality Characteristics of Grid Connected Wind Turbines; International Electrotechnical Commission: Geneva, Switzerland, 2008.
- Lafoz, M.; Blanco, M.; Ramirez, D. Grid connection for wave power farms. In Proceedings of the IEEE 2011—14th European Conference on Power Electronics and Applications (EPE 2011), Birmingham, UK, 30 August–1 September 2011; pp. 1–10. [Google Scholar]
- Moreno-Torres, P.; Blanco, M.; Navarro, G.; Lafoz, M. Power smoothing system for wave energy converters by means of a supercapacitor-based energy storage system. In Proceedings of the IEEE 2015 17th European Conference on Power Electronics and Applications (EPE’15 ECCE-Europe), Geneva, Switzerland, 8–10 September 2015; pp. 1–9. [Google Scholar]
- Medina, A.; Mendonça, H.; Martinez, S. Study of Voltage Fluctuations Caused in a Distribution Grid by the Connection of a Wave Energy Converter and Corrective Actions Based on Reactive Power Compensation. Procedia Comput. Sci. 2016, 83, 832–838. [Google Scholar] [CrossRef]
- Ajjarapu, V.; Christy, C. The continuation power flow: A tool for steady state voltage stability analysis. IEEE Trans. Power Syst. 1992, 7, 416–423. [Google Scholar] [CrossRef]
- Mendonça, H.; Martinez, S. A Resistance Emulation Approach to Optimize the Wave Energy Harvesting for a Direct Drive Point Absorber. IEEE Trans. Sustain. Energy 2016, 7, 3–11. [Google Scholar] [CrossRef]
- Weedy, B.M.; Cory, B.J.; Jenkins, N.; Ekanayake, J.B.; Strbac, G. Electric Power Systems; John Wiley & Sons: Chichester, UK, 2012. [Google Scholar]
- Viawan, F.A.; Karlsson, D. Combined local and remote voltage and reactive power control in the presence of induction machine distributed generation. IEEE Trans. Power Syst. 2007, 22, 2003–2012. [Google Scholar] [CrossRef]
- Ding, F.; Nagarajan, A.; Baggu, M.; Chakraborty, S.; Nguyen, A.; Walinga, S.; McCarty, M.; Bell, F. Application of Autonomous Smart Inverter Volt-VAR Function for Voltage Reduction Energy Savings and Power Quality in Electric Distribution Systems: Preprint; Technical Report; National Renewable Energy Laboratory (NREL): Golden, CO, USA, 2017.
- Balamurugan, K.; Srinivasan, D. Review of power flow studies on distribution network with distributed generation. In Proceedings of the IEEE 2011 IEEE Ninth International Conference on Power Electronics and Drive Systems (PEDS), Singapore, 5–8 December 2011; pp. 411–417. [Google Scholar]
- Mayordomo, J.; Izzeddine, M.; Martinez, S.; Asensi, R.; Exposito, A.G.; Xu, W. Compact and flexible three-phase power flow based on a full Newton formulation. IEE Proc. Gener. Transm. Distrib. 2002, 149, 225–232. [Google Scholar] [CrossRef]
- Expósito, A.G.; Gomez-Exposito, A.; Conejo, A.J.; Canizares, C. Electric Energy Systems: Analysis and Operation; CRC Press: Boca Raton, FL, USA, 2016. [Google Scholar]
- Polinder, H.; Damen, M.E.; Gardner, F. Linear PM generator system for wave energy conversion in the AWS. IEEE Trans. Energy Convers. 2004, 19, 583–589. [Google Scholar] [CrossRef]
- Leijon, M.; Boström, C.; Danielsson, O.; Gustafsson, S.; Haikonen, K.; Langhamer, O.; Strömstedt, E.; Stålberg, M.; Sundberg, J.; Svensson, O.; et al. Wave energy from the North Sea: Experiences from the Lysekil research site. Surv. Geophys. 2008, 29, 221–240. [Google Scholar] [CrossRef]
- Mendonça, H.; Martinez, S. Energy conversion efficiency assessment of a direct drive wave energy converter with different current controllers. In Proceedings of the 2016 IEEE International Energy Conference (ENERGYCON), Leuven, Belgium, 4–8 April 2016; pp. 1–6. [Google Scholar]
- Yazdani, A.; Iravani, R. A unified dynamic model and control for the voltage-sourced converter under unbalanced grid conditions. IEEE Trans. Power Deliv. 2006, 21, 1620–1629. [Google Scholar] [CrossRef]
- Kersting, W.H. Radial distribution test feeders. In Proceedings of the 2001 IEEE Power Engineering Society Winter Meeting, Columbus, OH, USA, 28 January–1 February 2001; Volume 2, pp. 908–912. [Google Scholar]
- The Specialist Committee on Waves (chaired by C. T. Stansberg). Final Report and Recommendations to the 23rd ITTC. In Proceedings of the 23rd International Towing Tank Conference, Venice, Italy, 8–14 September 2002; Volume II, pp. 505–551. [Google Scholar]
- Pillay, P.; Manyage, M. Definitions of voltage unbalance. IEEE Power Eng. Rev. 2001, 21, 50–51. [Google Scholar] [CrossRef]
- IEEE Std 1159™-2009—IEEE Recommended Practice for Monitoring Electric Power Quality; IEEE: New York, NY, USA, 2009.
Figure 1.
(a) Thévenin’s equivalent circuit. (b) Resulting phasor diagram of the Thévenin’s equivalent circuit.
Figure 1.
(a) Thévenin’s equivalent circuit. (b) Resulting phasor diagram of the Thévenin’s equivalent circuit.
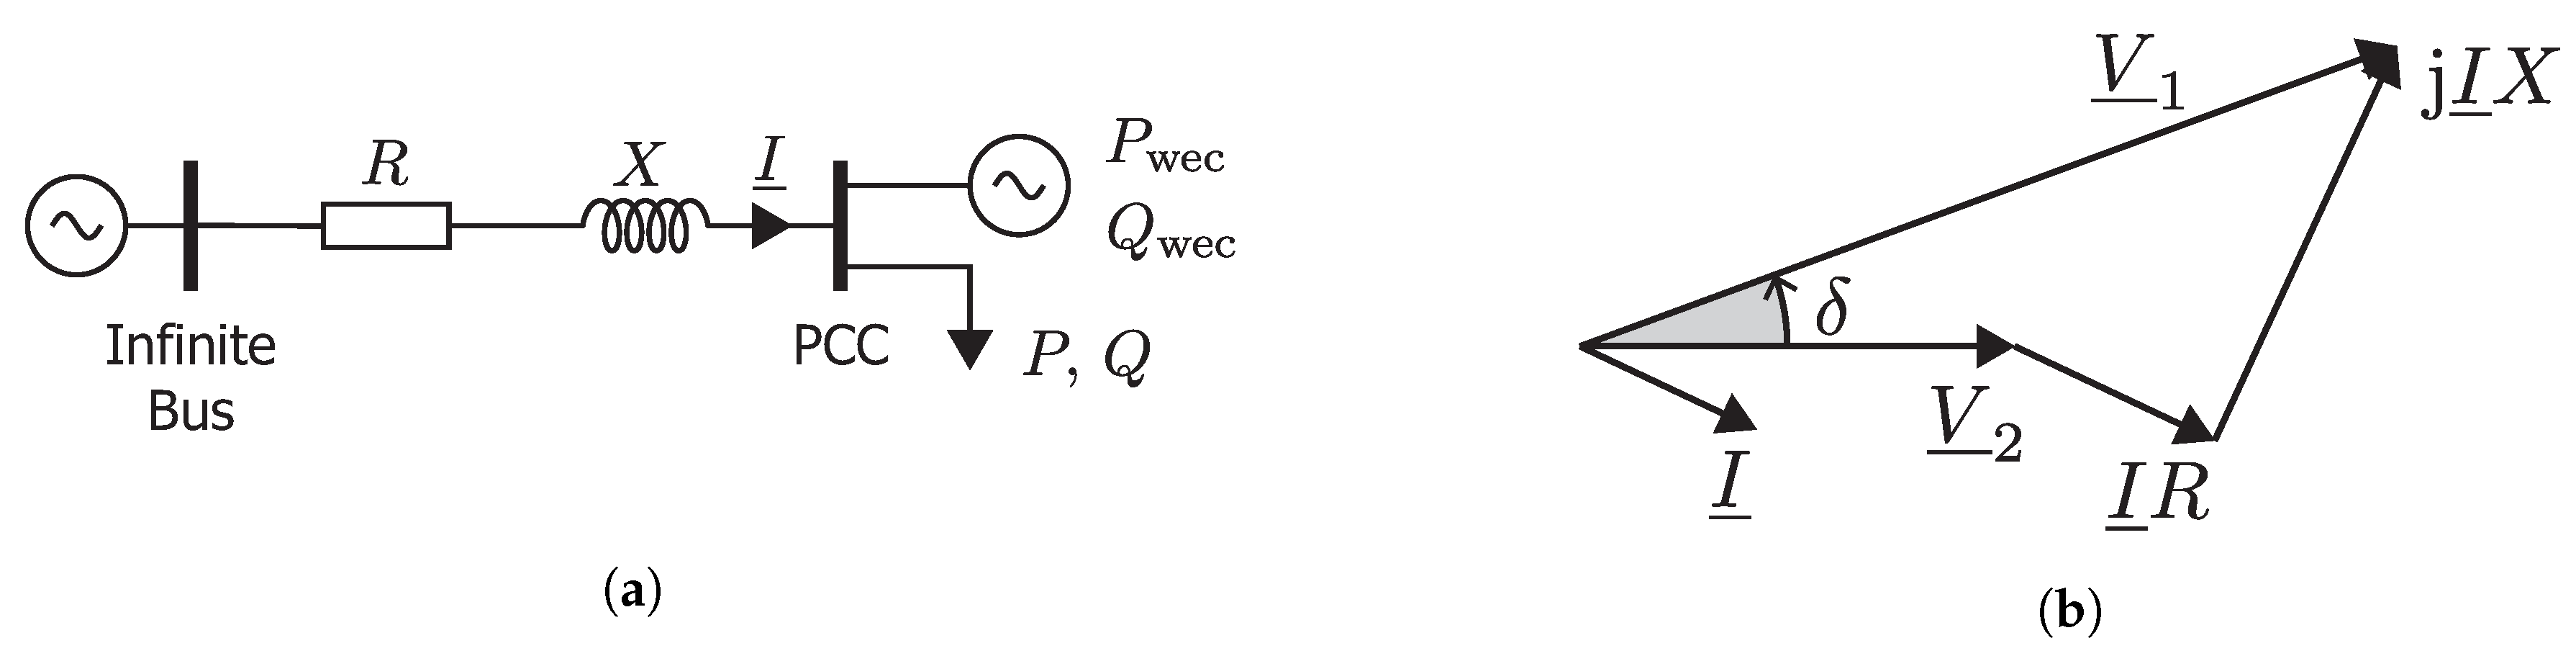
Figure 2.
Wave-to-wire model.

Figure 3.
Modified IEEE 13-bus radial distribution feeder [40].
Figure 3.
Modified IEEE 13-bus radial distribution feeder [40].
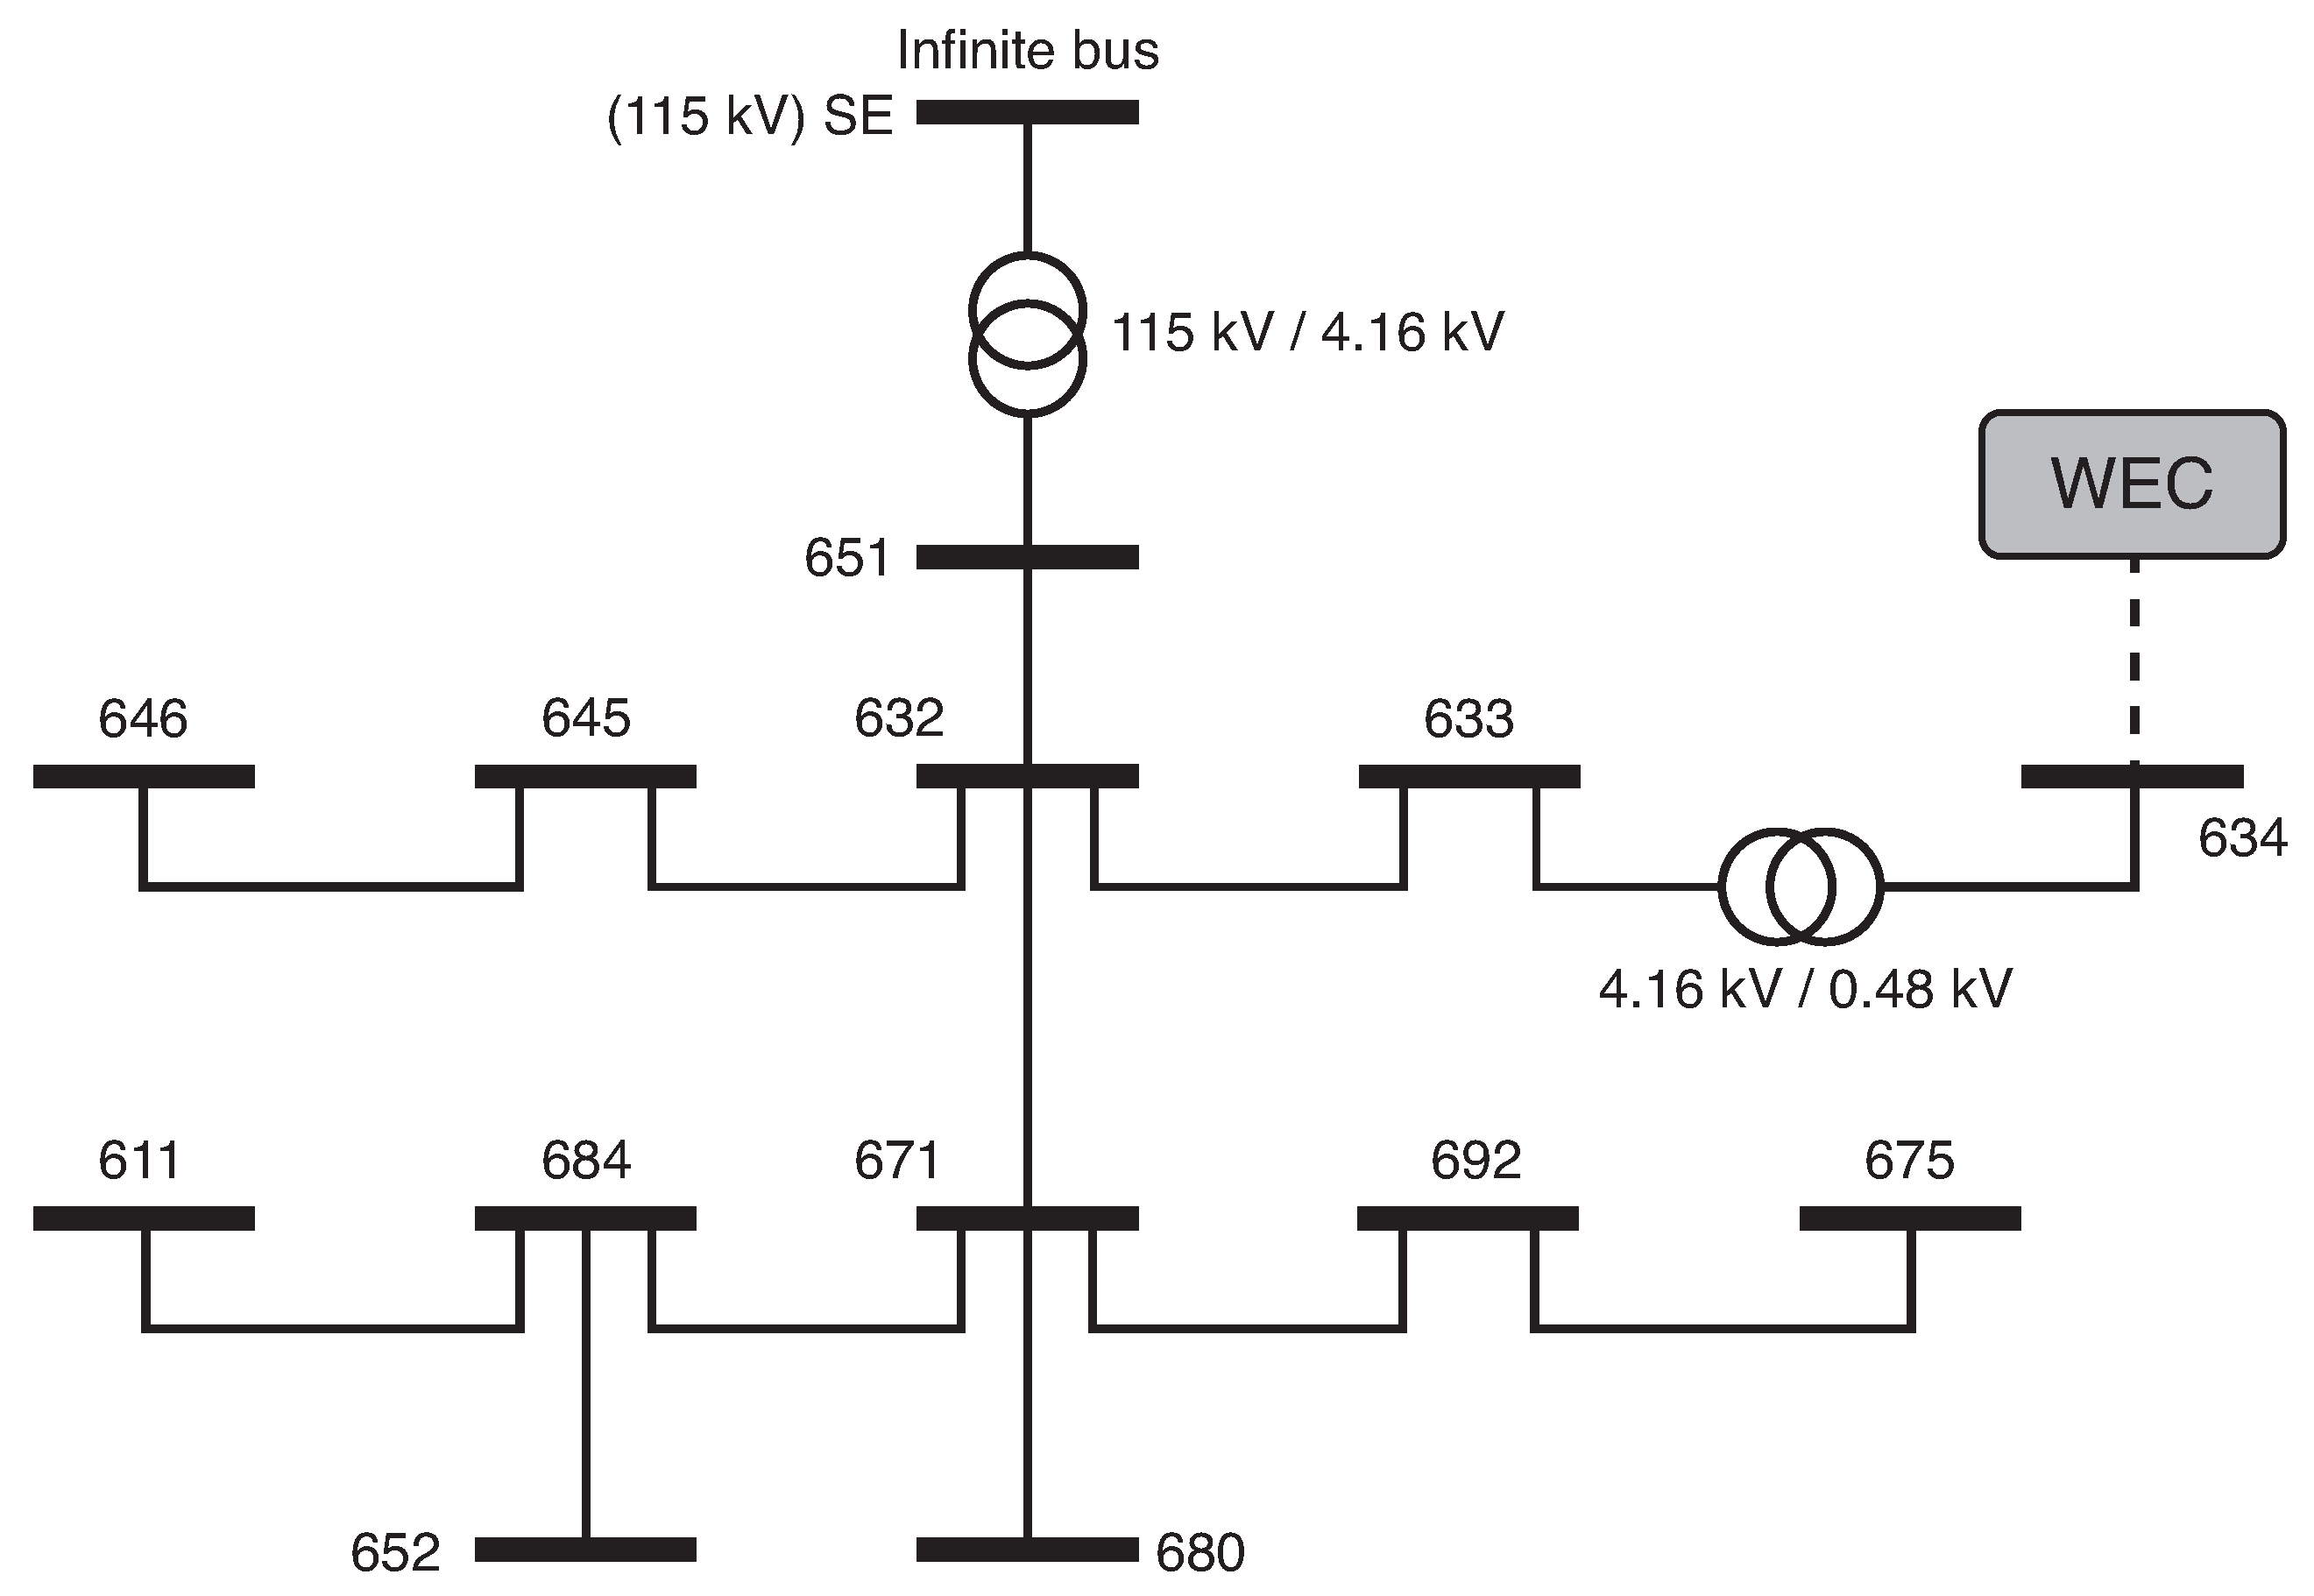
Figure 4.
Voltage profiles of the test network with 0- and 500-kW injections from the WEC.
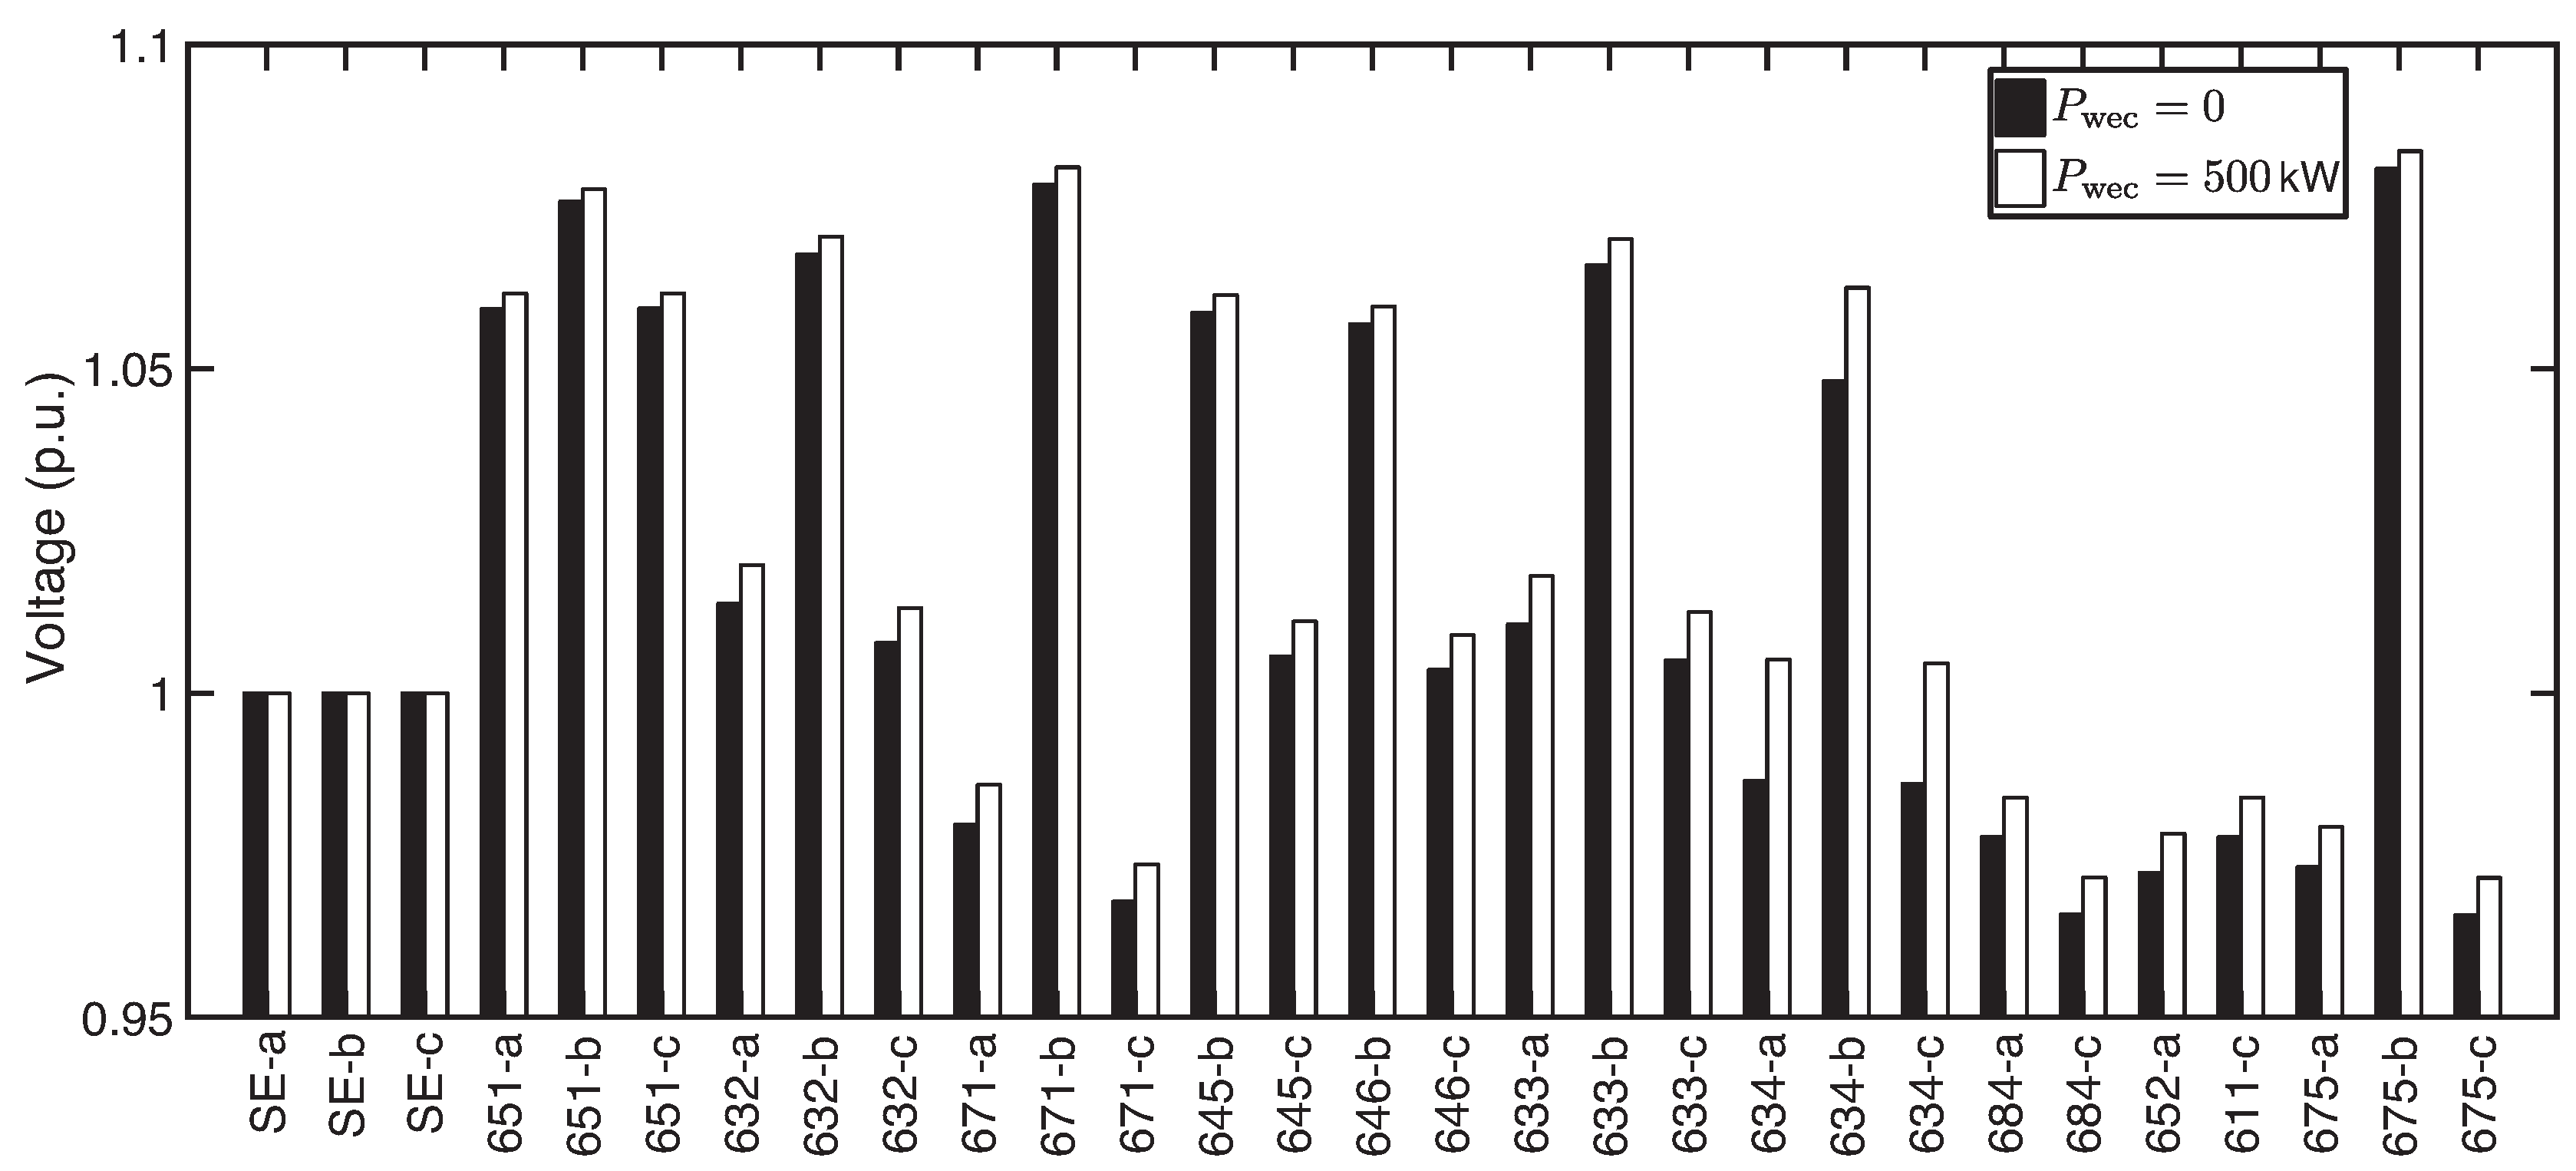
Figure 5.
(a) Active and reactive power operational limits of the the grid-side electronic converter of the WEC. (b) Voltage fluctuation at Bus 634.
Figure 5.
(a) Active and reactive power operational limits of the the grid-side electronic converter of the WEC. (b) Voltage fluctuation at Bus 634.

Figure 6.
Reactive power control loop.
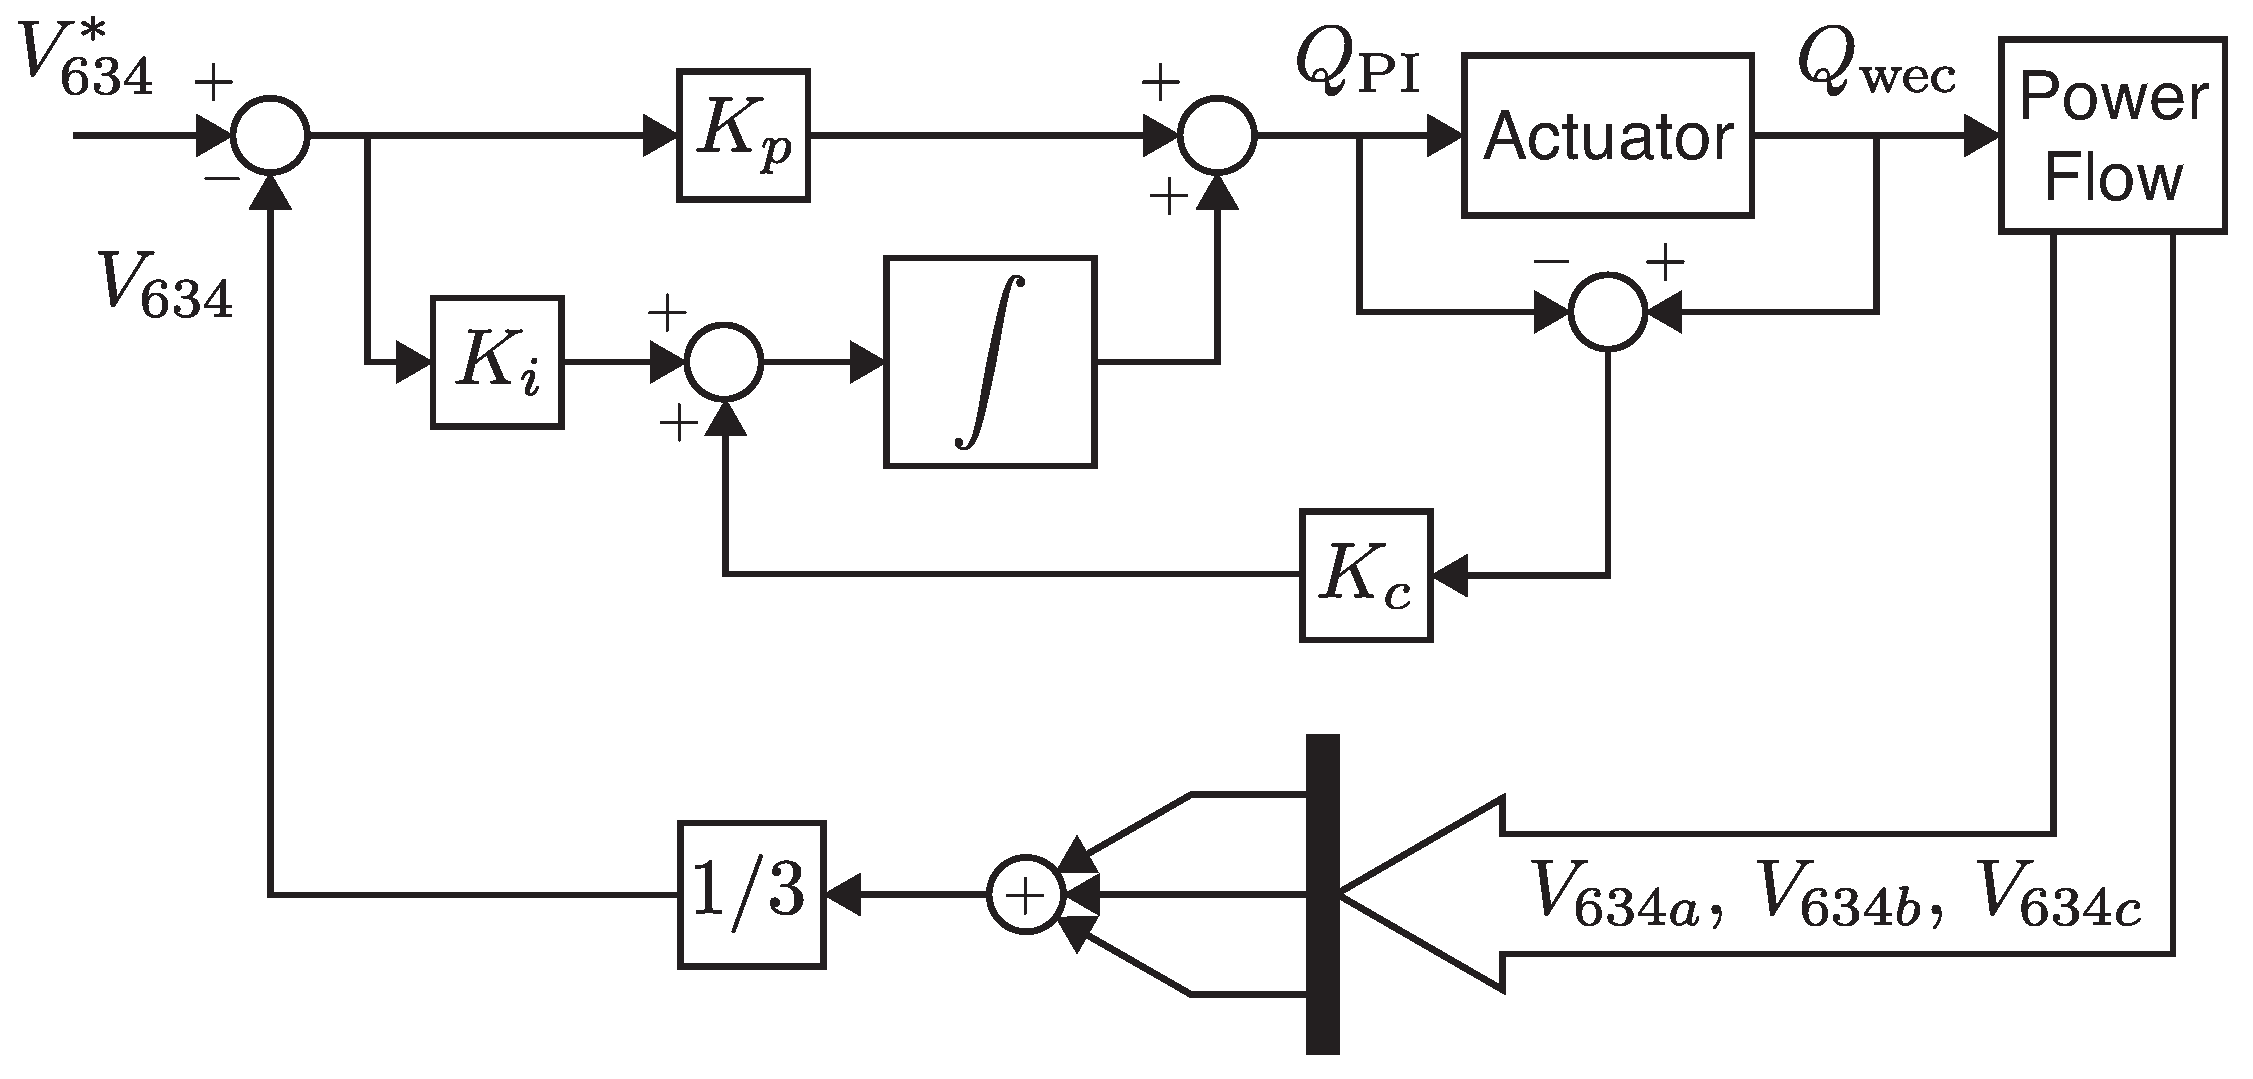
Figure 7.
Mitigation of the mean bus voltage for a sinusoidal power generated by the WEC.

Figure 8.
Active power injected into the grid by the WEC.

Figure 9.
Mitigation of the mean bus voltage with VAR compensation by the grid-side converter.

Figure 10.
Mean bus voltage fluctuation with VAR compensation: (a) by the grid-side converter; and (b) by a combination of the grid-side converter and STATCOM.
Figure 10.
Mean bus voltage fluctuation with VAR compensation: (a) by the grid-side converter; and (b) by a combination of the grid-side converter and STATCOM.
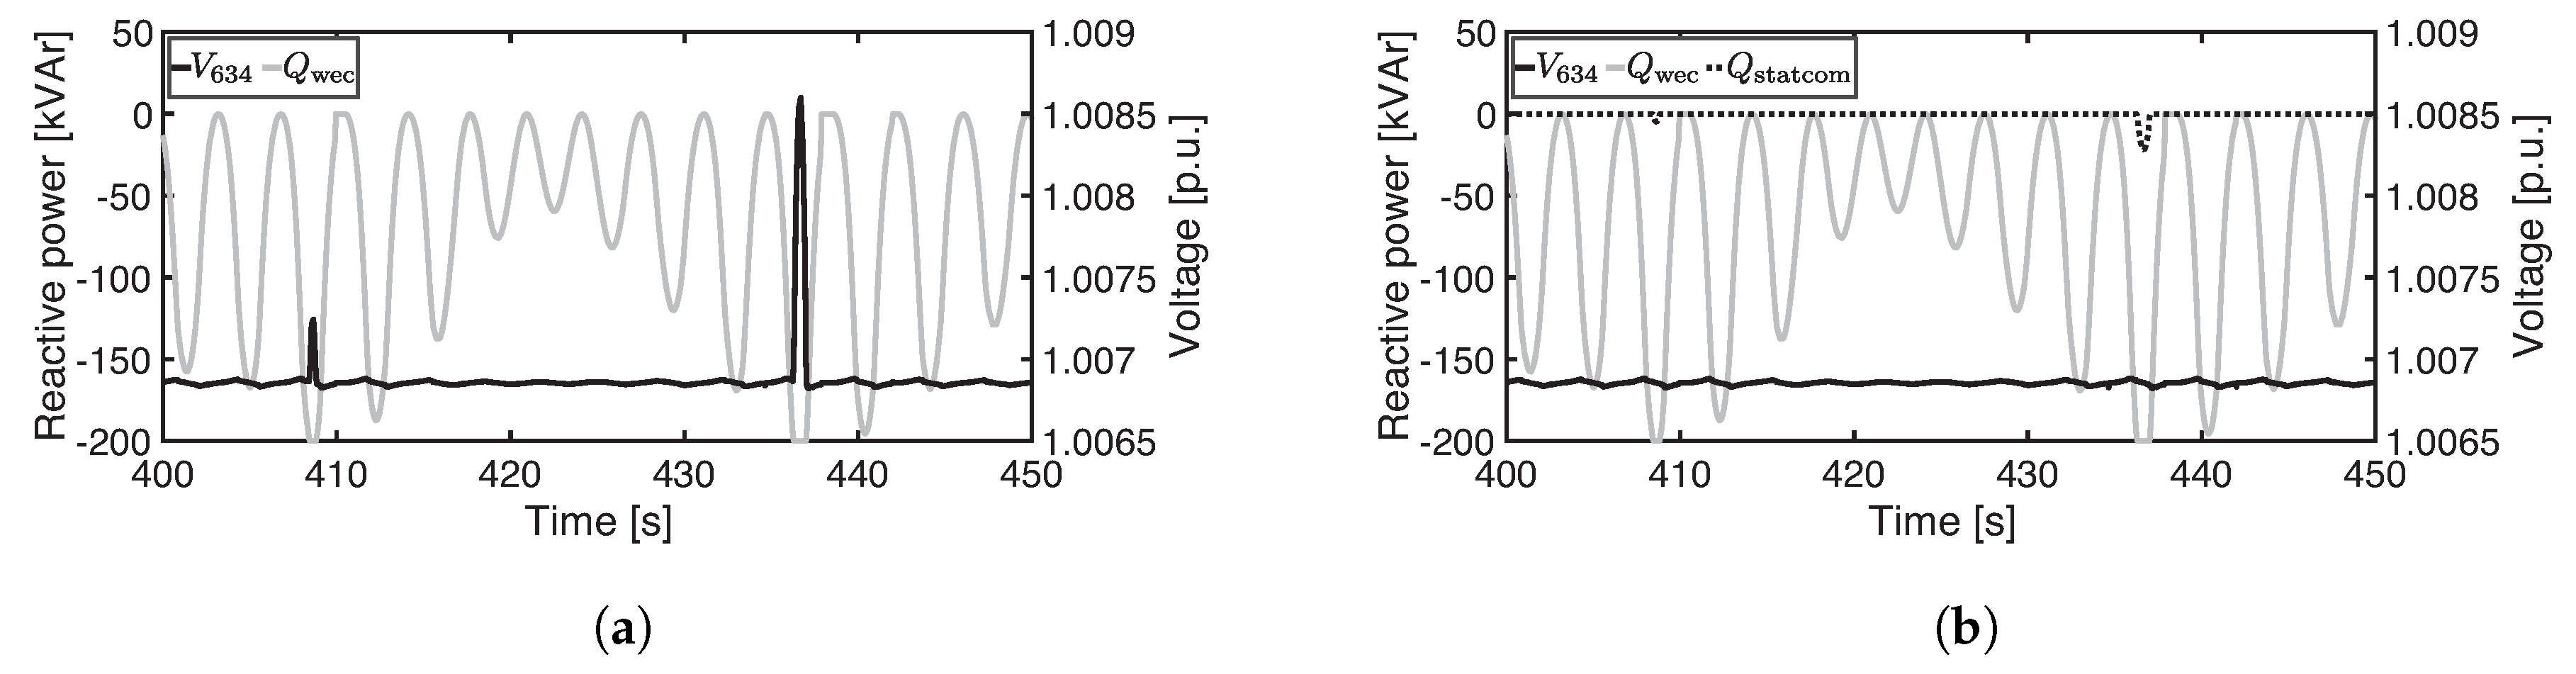
Figure 11.
SAVFI per bus for the grid without VAR compensation, with VAR compensation by the grid-side converter and with VAR compensation by the combination of grid-side converter and STATCOM.
Figure 11.
SAVFI per bus for the grid without VAR compensation, with VAR compensation by the grid-side converter and with VAR compensation by the combination of grid-side converter and STATCOM.

Figure 12.
Voltage fluctuations per-phase at Bus 634 with VAR compensation: (a) by the grid-side converter and (b) by the combination of the grid-side converter and STATCOM.
Figure 12.
Voltage fluctuations per-phase at Bus 634 with VAR compensation: (a) by the grid-side converter and (b) by the combination of the grid-side converter and STATCOM.

Figure 13.
Voltage unbalance factor for and maximum active power injection from the WEC with: no VAR compensation, VAR compensation by the grid-side converter and by the combination of grid-side converter and STATCOM.
Figure 13.
Voltage unbalance factor for and maximum active power injection from the WEC with: no VAR compensation, VAR compensation by the grid-side converter and by the combination of grid-side converter and STATCOM.
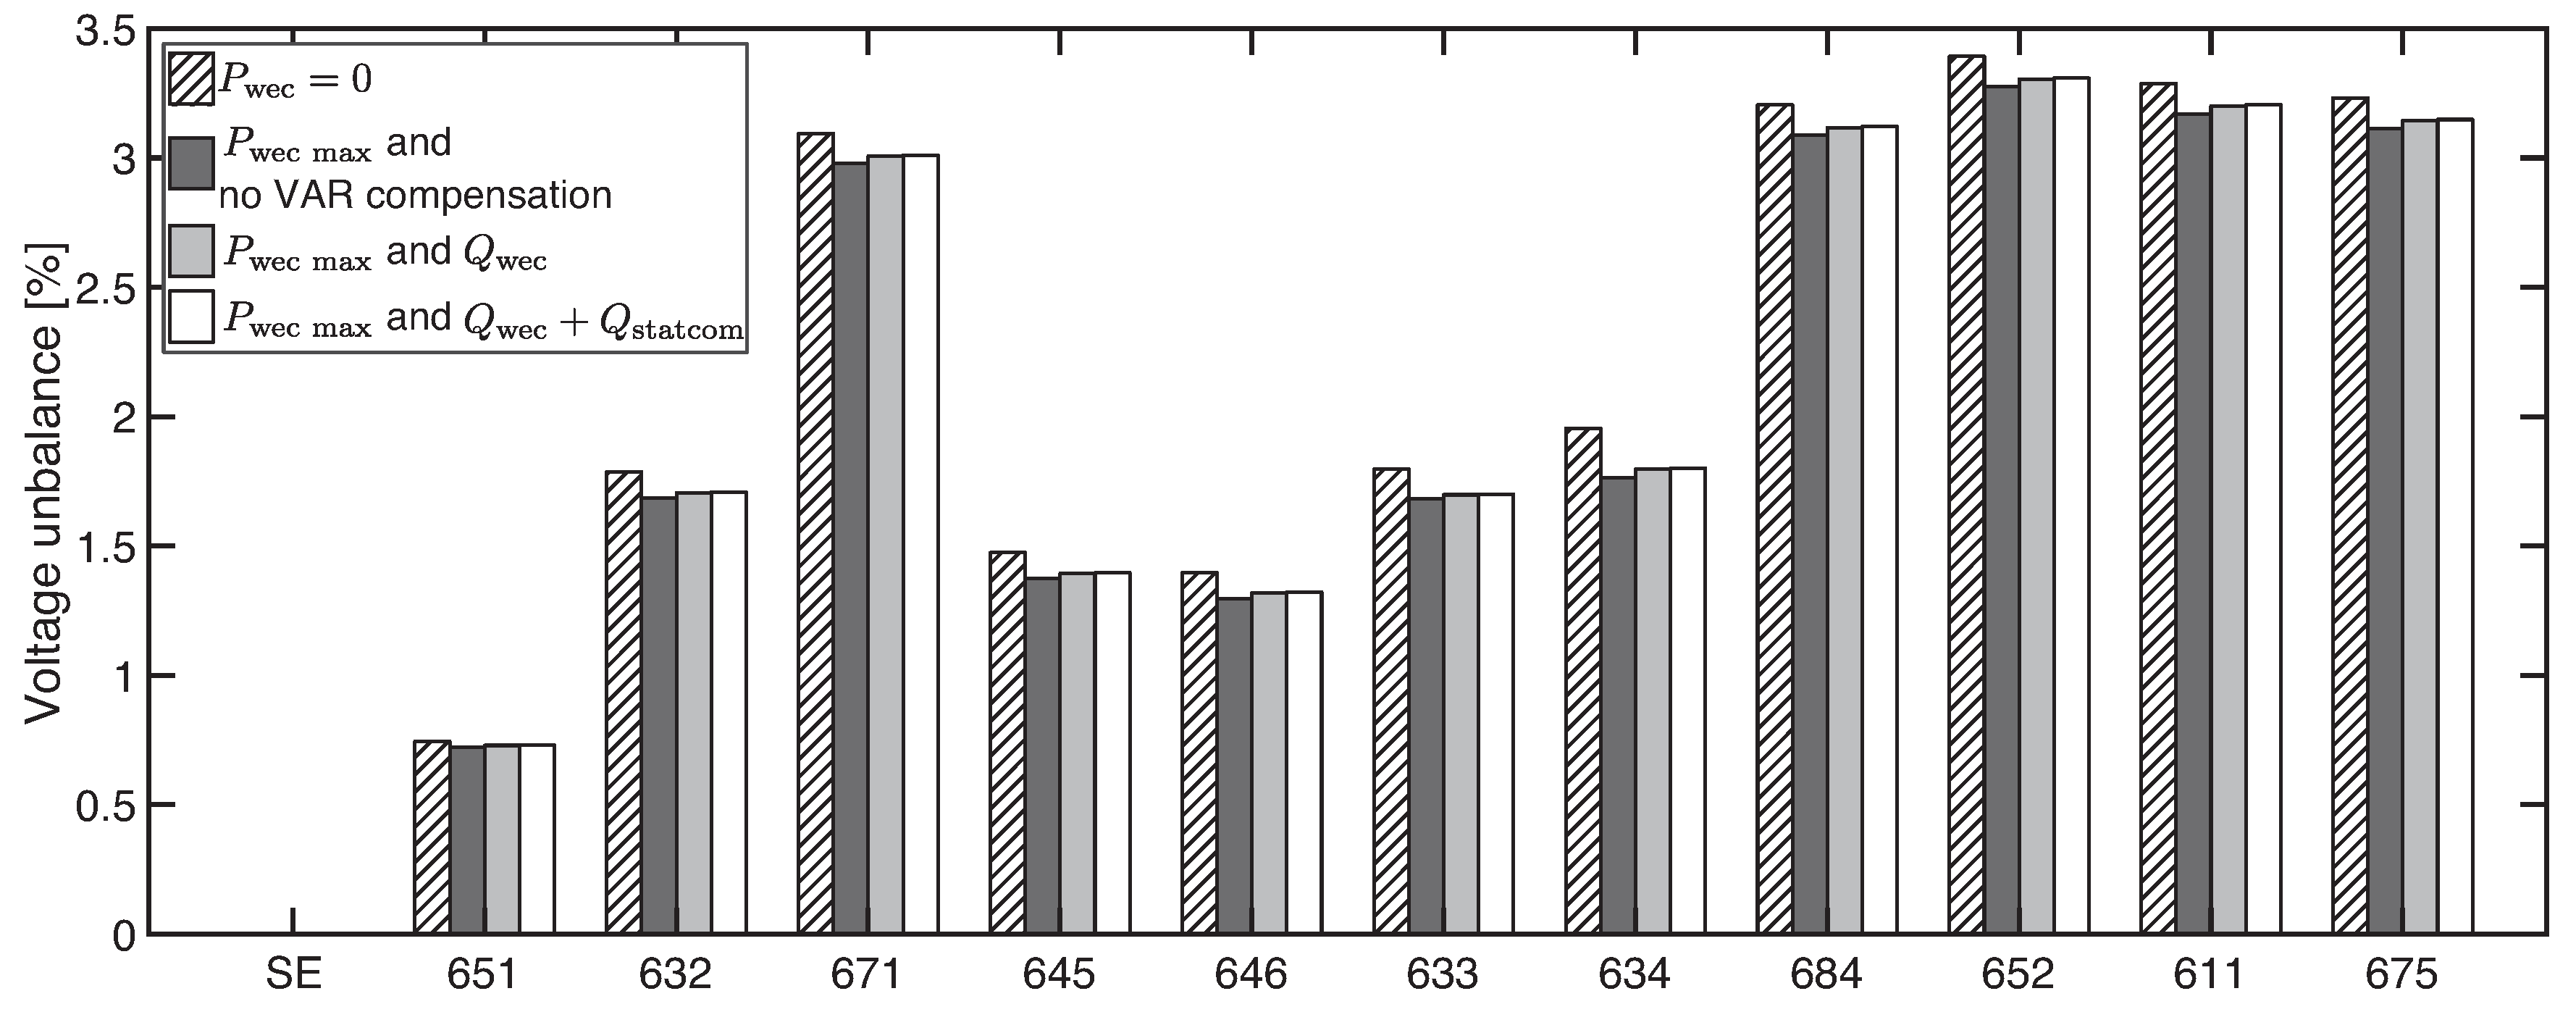
Figure 14.
Instantaneous voltage unbalance factor at Bus 634.


Table 1.
(system average voltage fluctuation index) reduction after VAR compensation.
| Buses | ||||||||||
|---|---|---|---|---|---|---|---|---|---|---|
| 651 | 632 | 671 | 645 | 646 | 633 | 634 | 684 | 652 | 611 | 675 |
| 31.47% | 50.61% | 50.63% | 31.20% | 31.26% | 72.65% | 92.33% | 71.35% | 77.33% | 65.01% | 50.73% |
© 2017 by the authors. Licensee MDPI, Basel, Switzerland. This article is an open access article distributed under the terms and conditions of the Creative Commons Attribution (CC BY) license (http://creativecommons.org/licenses/by/4.0/).
Share and Cite
MDPI and ACS Style
Mendonça, H.; De Castro, R.M.; Martínez, S.; Montalbán, D. Voltage Impact of a Wave Energy Converter on an Unbalanced Distribution Grid and Corrective Actions. Sustainability 2017, 9, 1844. https://doi.org/10.3390/su9101844
AMA Style
Mendonça H, De Castro RM, Martínez S, Montalbán D. Voltage Impact of a Wave Energy Converter on an Unbalanced Distribution Grid and Corrective Actions. Sustainability. 2017; 9(10):1844. https://doi.org/10.3390/su9101844
Chicago/Turabian StyleMendonça, Hugo, Rosa M. De Castro, Sergio Martínez, and David Montalbán. 2017. "Voltage Impact of a Wave Energy Converter on an Unbalanced Distribution Grid and Corrective Actions" Sustainability 9, no. 10: 1844. https://doi.org/10.3390/su9101844
Note that from the first issue of 2016, this journal uses article numbers instead of page numbers. See further details here.