Stormwater Treatment Evaluation of a Constructed Floating Wetland after Two Years Operation in an Urban Catchment


Abstract
:1. Introduction
2. Materials and Methods
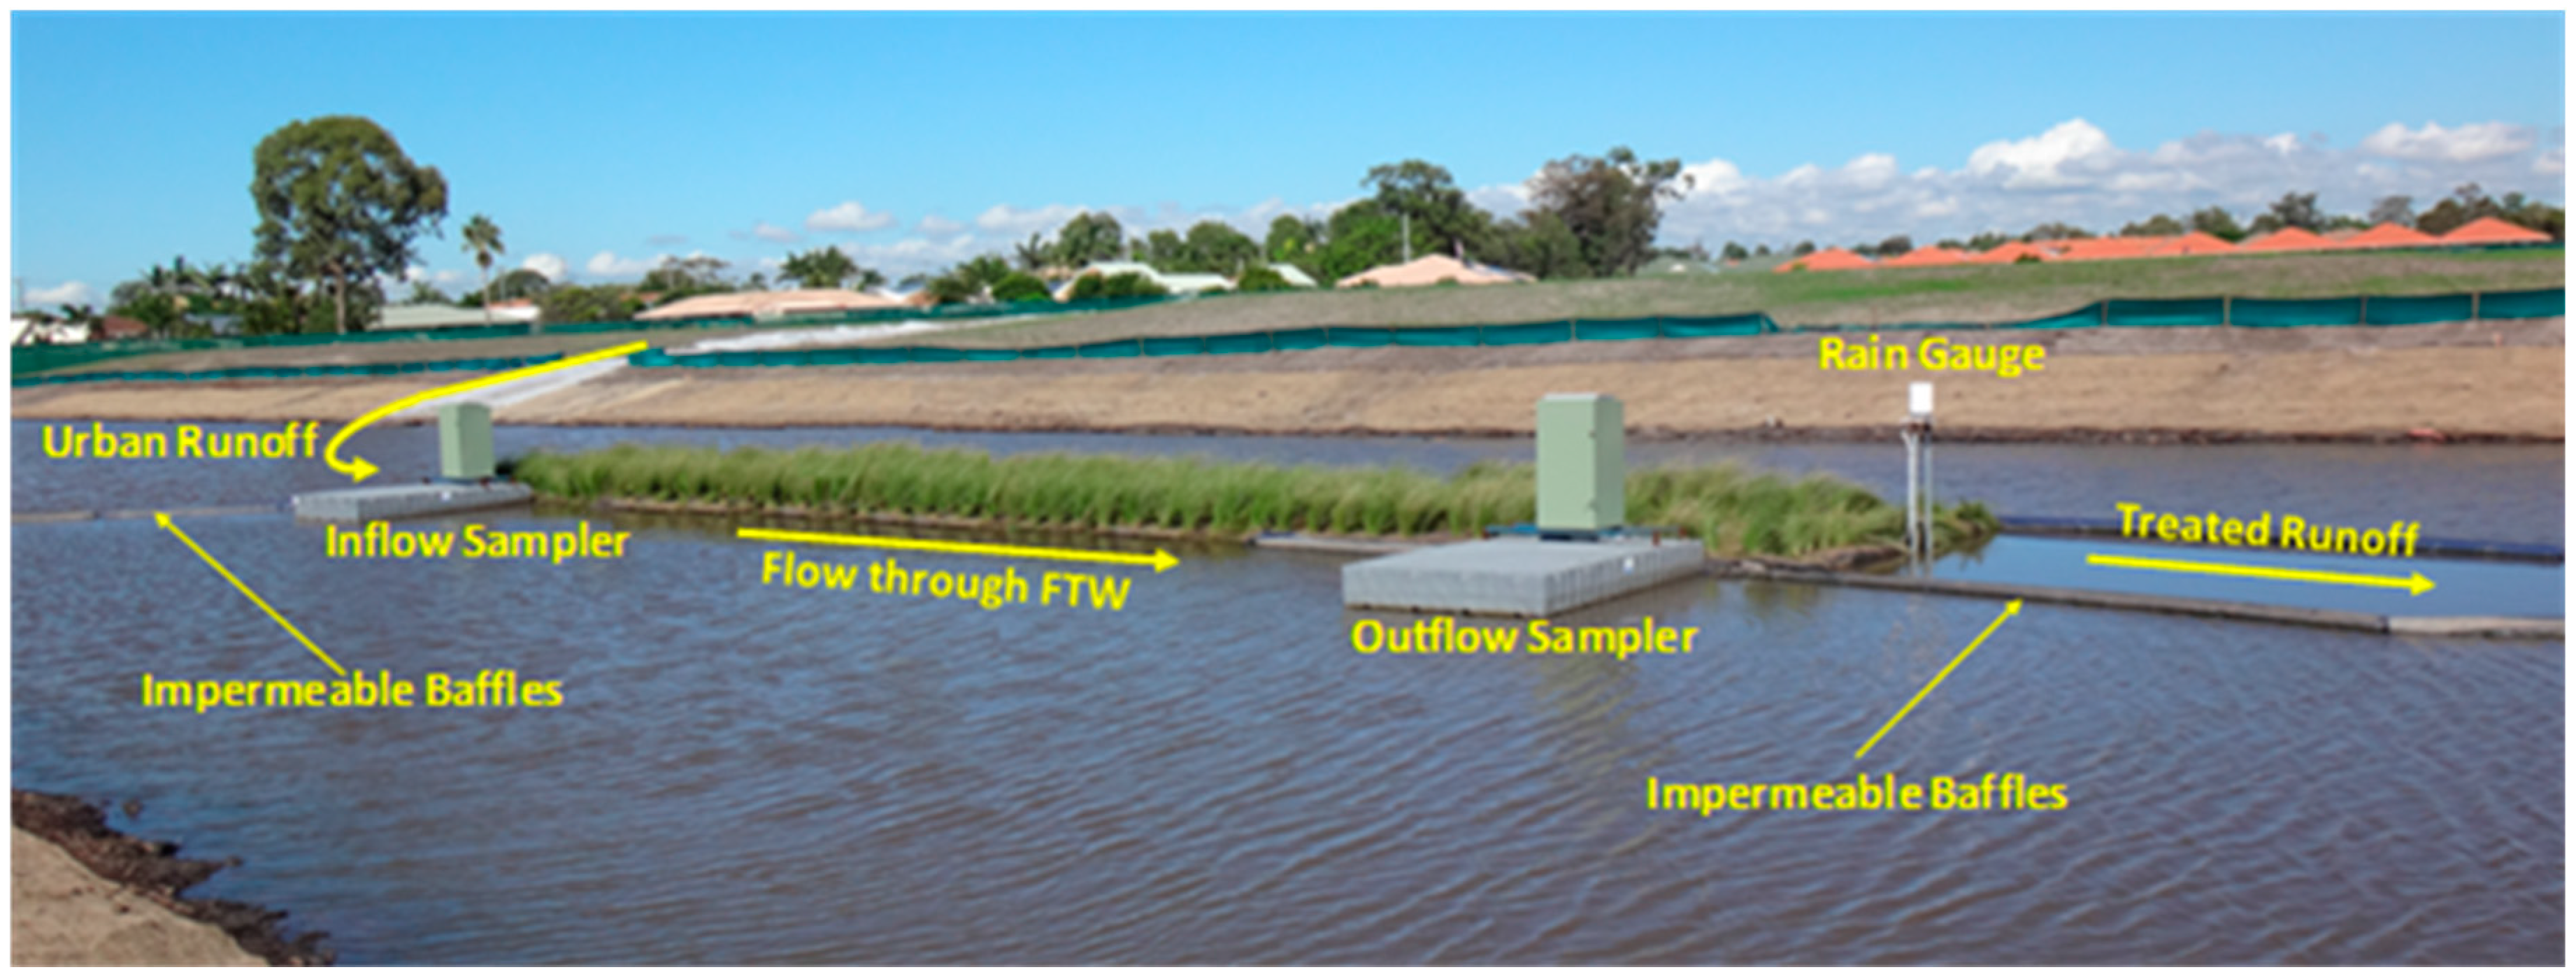
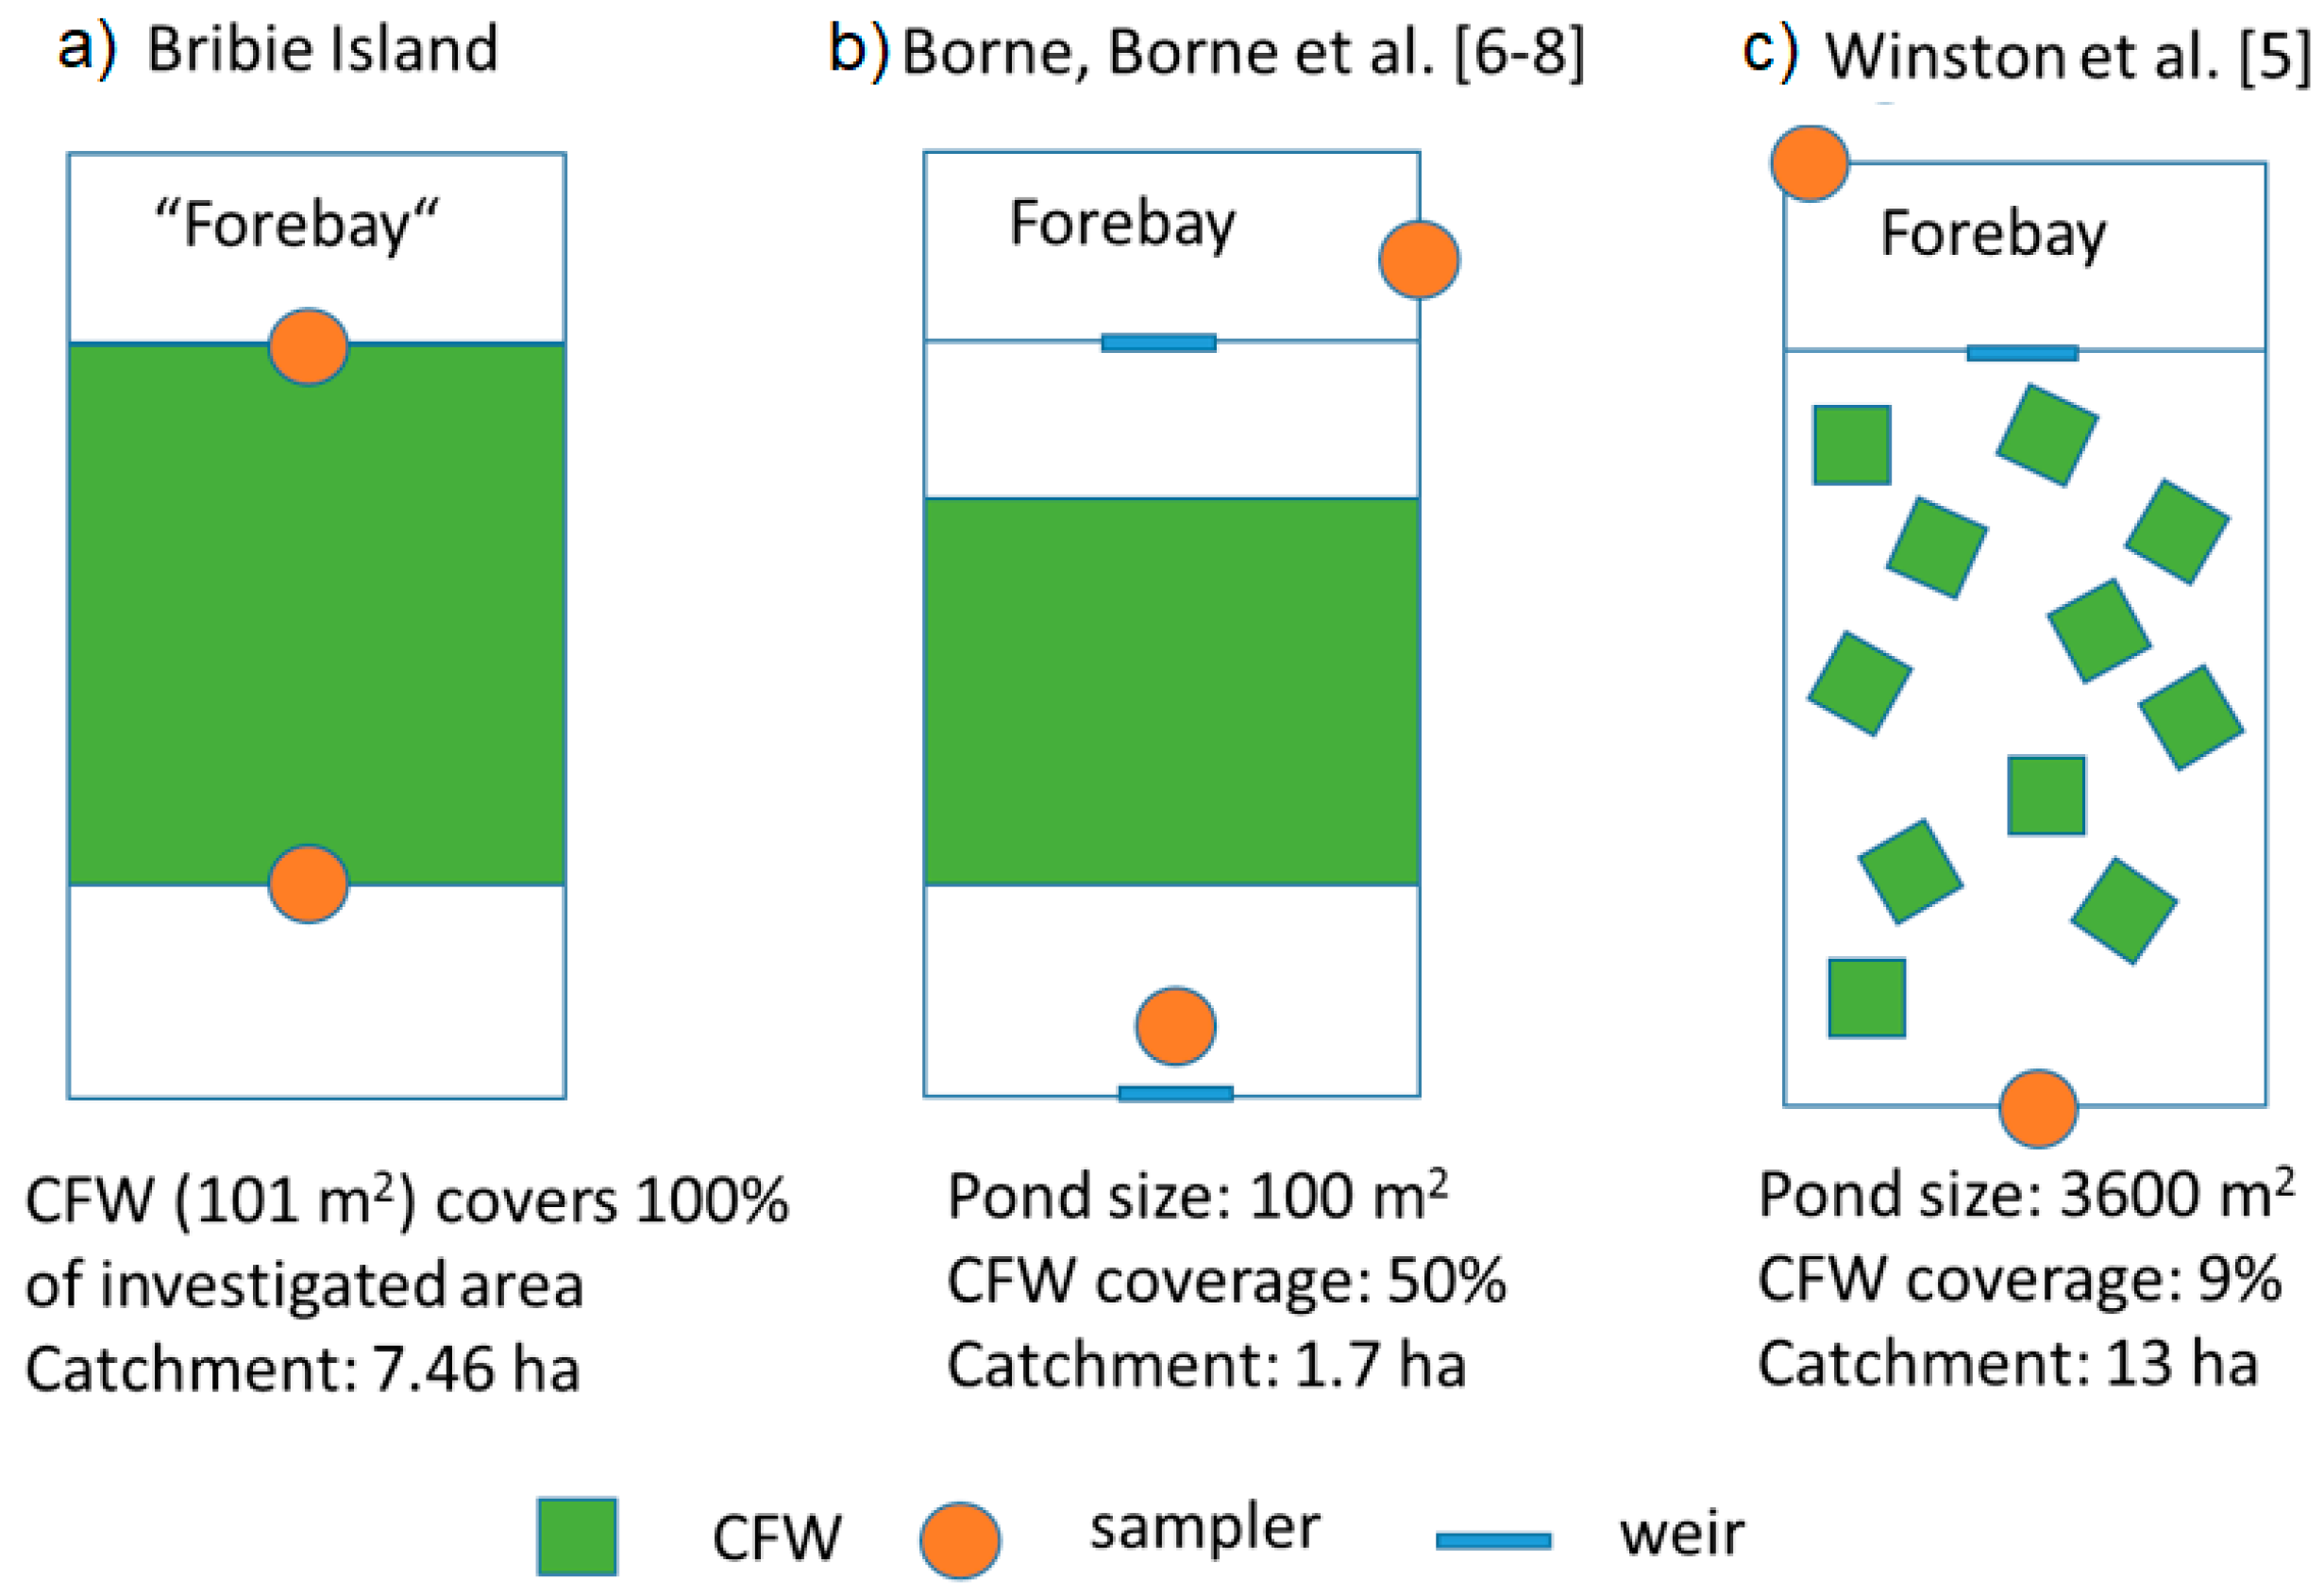
2.1. Site Description
2.2. Sampling Protocol and Methodology
2.3. Statistical Significance
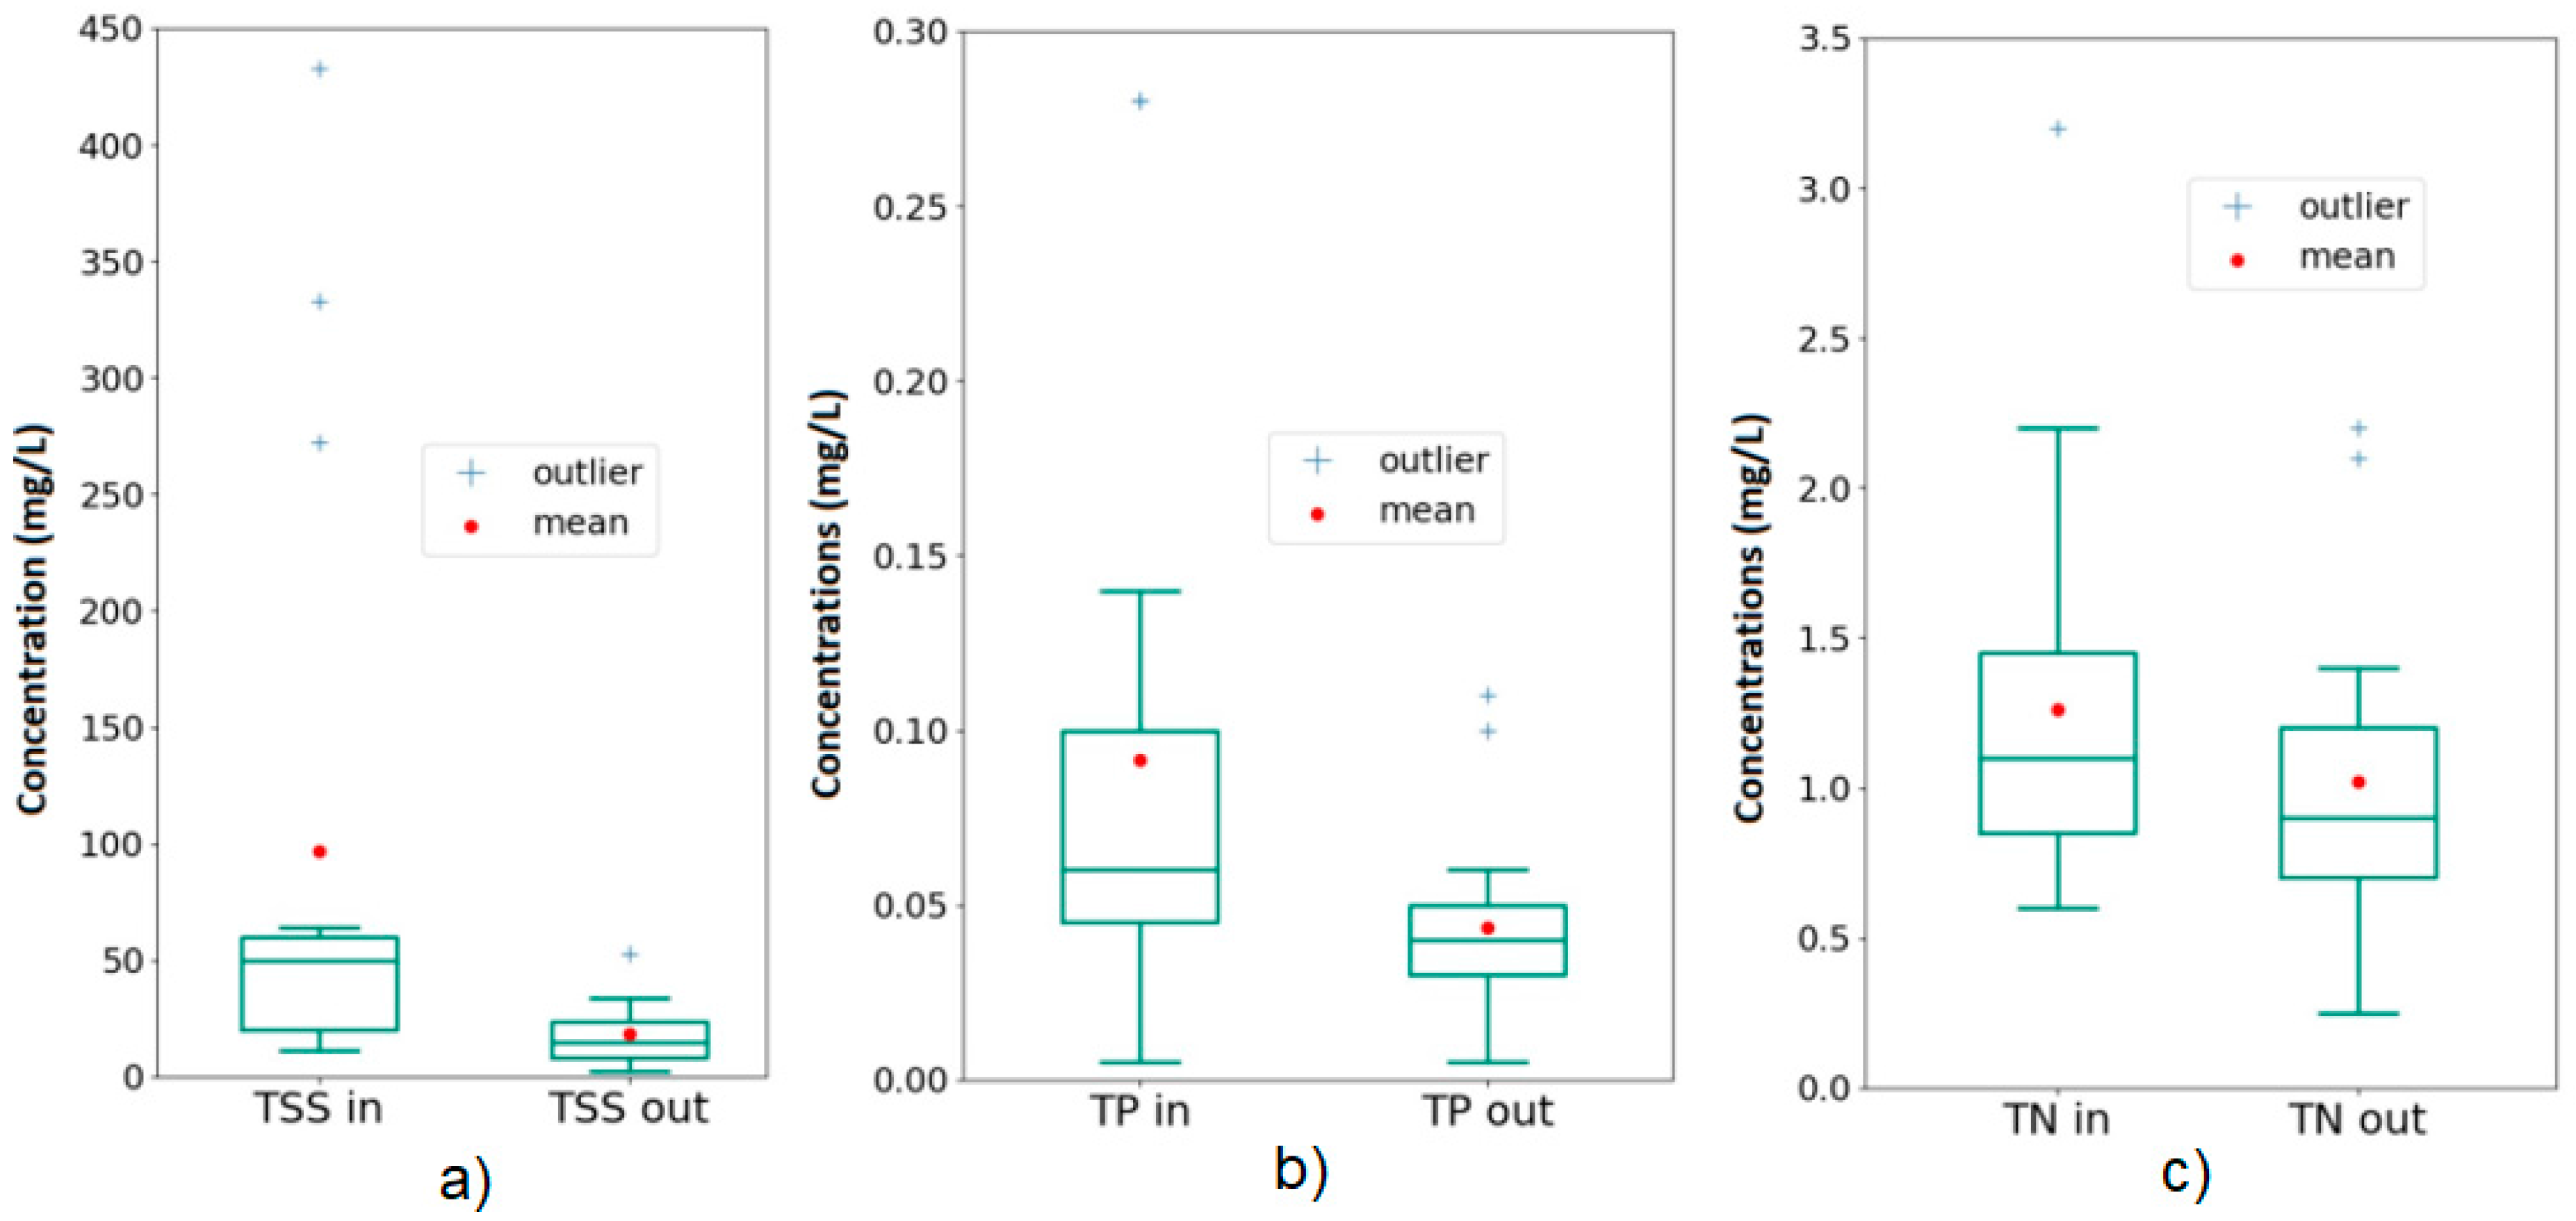
3. Results
4. Discussion
5. Conclusions
Acknowledgments
Author Contributions
Conflicts of Interest
References
- Hogg, E.H.; Wein, R.W. The contribution of Typha components to floating mat buoyancy. Ecology 1988, 69, 1025–1031. [Google Scholar] [CrossRef]
- Mitsch, W.J.; Gosselink, J.G. Wetlands; Van Nostrand Reinhold: New York, NY, USA, 1993. [Google Scholar]
- Hoeger, S. Schwimmkampen: Germany's artificial floating islands. J. Soil Water Conser. 1988, 43, 304–306. [Google Scholar]
- Stewart, F.M.; Mulholland, T.; Cunningham, A.B.; Kania, B.G.; Osterlund, M.T. Floating islands as an alternative to constructed wetlands for treatment of excess nutrients from agricultural and municipal wastes-results of laboratory-scale tests. Land Cont. Reclam. 2008, 16, 25–33. [Google Scholar] [CrossRef]
- Winston, R.J.; Hunt, W.F.; Kennedy, S.G.; Merriman, L.S.; Chandler, J.; Brown, D. Evaluation of floating treatment wetlands as retrofits to existing stormwater retention ponds. Ecol. Eng. 2013, 54, 254–265. [Google Scholar] [CrossRef]
- Borne, K.; Tanner, C.C.; Fassman-Beck, E. Stormwater nitrogen removal performance of a floating treatment wetland. Water Sci. Technol. 2013, 68, 1657–1664. [Google Scholar] [CrossRef] [PubMed]
- Borne, K.E.; Fassman, E.A.; Tanner, C.C. Floating treatment wetland retrofit to improve stormwater pond performance for suspended solids, copper and zinc. Ecol. Eng. 2013, 54, 173–182. [Google Scholar] [CrossRef]
- Borne, K.E. Floating treatment wetland influences on the fate and removal performance of phosphorus in stormwater retention ponds. Ecol. Eng. 2014, 69, 76–82. [Google Scholar] [CrossRef]
- Chang, N.B.; Wanielista, M.P.; Marimon, Z. Comparative Evaluation of Floating Treatment Wetlands for Nutrient Removal and Algal Toxin Control in Wet Detention Ponds. In Proceedings of the International Low Impact Development Conference 2015: It Works in All Climates and Soils, Houston, TX, USA, 19–21 January 2015. [Google Scholar]
- Hartshorn, N.; Marimon, Z.; Xuan, Z.M.; Chang, N.B.; Wanielista, M.P. Effect of floating treatment wetlands on control of nutrients in three stormwater wet detention ponds. J. Hydrol. Eng. 2016, 21. [Google Scholar] [CrossRef]
- Nichols, P.; Lucke, T.; Drapper, D.; Walker, C. Performance evaluation of a floating treatment wetland in an urban catchment. Water 2016, 8, 244. [Google Scholar] [CrossRef]
- Schwammberger, P.; Walker, C.; Lucke, T. Using floating wetland treatment systems to reduce stormwater pollution from urban developments. Int. J. GEOMATE 2017, 12, 45–50. [Google Scholar] [CrossRef]
- Water by Design, Deemed to Comply Solutions—Stormwater Quality Management, South East Queensland, 2010. Available online: http://healthywaterways.org/u/lib/mob/20141110115217_fbbe727dfdc426363/2009_deemedtocomplysolutions_v1short.pdf (accessed on 21 September 2017).
- United States Environmental Protection Agency. Technical Guidance Manual for Evaluating Emerging Stormwater Treatment Technologies, Technology Assessment Protocol-Ecology (TAPE); Washington Department of Ecology: Washington, WA, USA, 2011.
- Burton, A.G., Jr.; Pitt, R. Stormwater Effects Handbook: A Toolbox for Watershed Managers, Scientists and Engineers; Lewis Publishers: Boca Raton, FL, USA, 2001. [Google Scholar]
- SQIDEP—Stormwater Quality Improvement Devices Evaluation Protocol. Draft in Response to Initial Phase of Consultation. Available online: https://www.stormwater.asn.au/images/publications/SQIDEP_v1_0_2a.pdf (accessed on 21 September 2017).
- Van Buren, M.A.; Watt, W.E.; Marsalek, J. Application of the log-normal and normal distributions to stormwater quality parameters. Water Res. 1997, 31, 95–104. [Google Scholar] [CrossRef]
- Pelosi, M.K.; Sandifer, M.S. Elementary Statistics: From Discovery to Decision; John Wiley & Sons: Hoboken, NJ, USA, 2003. [Google Scholar]
- State Planning Policy, Department of Infrastructure, Local Government and Planning, Queensland Government. Available online: https://planning.dilgp.qld.gov.au/planning/better-planning/state-planning (assessed 30 August 2017).
- Fletcher, T.; Duncan, H.; Poelsma, P.; Lloyd, S. Stormwater Flow and Quality, and the Effectiveness of Non-Proprietary Stormwater Treatment Measures: A Review and Gap Analysis; eWater CRC: Canberra, Australia, 2005. [Google Scholar]
- Headley, T.; Tanner, C.C. Constructed wetlands with floating emergent macrophytes: An innovative stormwater treatment technology. Crit. Rev. Environ. Sci. Technol. 2012, 42, 2261–2310. [Google Scholar] [CrossRef]


| Parameter | Bribie Lakes |
|---|---|
| Minimum storm duration | 5 min |
| Catchment type | Urban Residential |
| Stormwater treatment device type | Constructed Floating Wetland (variable water depth, 1.5 m) |
| Desired number of valid sampling events | 15 |
| Minimum rainfall depth | 2.0 mm |
| Minimum antecedent dry period | 6 h, depending on influent concentrations |
| Minimum hydrograph sampling | 6 h, depending on influent concentrations |
| Minimum hydrograph sampling | First 60% of hydrograph |
| Desired number of water sub-samples | Minimum 8 influent and 8 effluent subsamples per event |
| Sampling method | Auto-sampler (ISCO), flow-weighted in 5000 L intervals |
| Data management | Campbell Scientific CR800 Data logger with Ethernet Modem |
| Total suspended solids (TSS) | APHA (2005) 2540 D |
| Total Nitrogen and species | APHA (2005) 4500 N, APHA (2005) 4500 NH3, APHA (2005) 4500 NO3 |
| Total Phosphorous and Orthophosphate | APHA (2005) 4500 P |
| Laboratory Certification | NATA registered for all parameters |
| QA/QC | Random duplicates and blanks in accordance with the relevant Australian Standard |
| Date | Rainfall (mm) | Sample | TSS (mg/L) | TN (mg/L) | TP (mg/L) | TKN (mg/L) | NH3-N (mg/L) | NOX-N (mg/L) | NO3-N (mg/L) |
|---|---|---|---|---|---|---|---|---|---|
| 29 September 2015 | 9.2 | Inlet | 323 | 1 | 0.28 | 0.6 | 0.01 | 0.36 | 0.36 |
| Outlet | 51 | 0.5 1 | 0.1 | 0.5 1 | 0.02 | 0.26 | 0.26 | ||
| 22–23 September 2015 | 3.8 | Inlet | 11 | 0.7 | 0.03 | 0.6 | 0.08 | 0.1 | 0.1 |
| Outlet | 4 | 0.3 | 0.02 | 0.3 | 0.05 | 0.01 | 0.01 | ||
| 7 November 2015 | 13.2 | Inlet | 433 | 3.2 | 0.28 | 2.9 | 0.06 | 0.29 | 0.28 |
| Outlet | 21 | 0.7 | 0.03 | 0.6 | 0.05 | 0.09 | 0.08 | ||
| 14 November 2015 | 16.6 | Inlet | 22 | 1.1 | 0.05 | 0.8 | 0.07 | 0.32 | 0.31 |
| Outlet | 15 | 0.7 | 0.05 | 0.7 | 0.03 | 0.04 | 0.04 | ||
| 29 November 2015 | 12.4 | Inlet | 272 | 2.2 | 0.14 | 2.2 | 0.11 | 0.05 | 0.05 |
| Outlet | 29 | 1.3 | 0.02 | 1.3 | 0.11 | 0.02 | 0.02 | ||
| 30 January 2016 | 3.4 | Inlet | 50 | 1.1 | 0.04 | 1.0 | 0.02 | 0.12 | 0.12 |
| Outlet | 26 | 2.2 | 0.04 | 2.2 | 0.11 | 0.02 | 0.02 | ||
| 06 February 2016 | 10.8 | Inlet | 19 | 0.6 | 0.05 | 0.6 | 0.01 2 | 0.04 | 0.04 |
| Outlet | 24 | 0.8 | 0.03 | 0.8 | 0.01 | 0.01 2 | 0.01 2 | ||
| 13 February 2016 | 25.6 | Inlet | 37 | 1.4 | 0.06 | 1.3 | 0.06 | 0.05 | 0.05 |
| Outlet | 19 | 2.1 | 0.04 | 2.1 | 0.13 | 0.01 | 0.01 | ||
| 6 March 2016 | 6.2 | Inlet | 56 | 1.2 | 0.1 | 1.2 | 0.08 | 0.04 | 0.04 |
| Outlet | 15 | 1.1 | 0.11 | 1.1 | 0.06 | 0.02 | 0.02 | ||
| 15 July 2016 | 6.2 | Inlet | 54 | 1.5 | 0.1 | 1.4 | 0.15 | 0.12 | 0.12 |
| Outlet | 10 | 1.1 | 0.03 | 1 | 0.1 | 0.1 | 0.1 | ||
| 24 August 2016 | 5.8 | Inlet | 21 | 1.0 | 0.06 | 1 | 0.08 | 0.02 | 0.02 |
| Outlet | 11 | 1.4 | 0.05 | 1.4 | 0.26 | 0.02 | 0.02 | ||
| 7 December 2016 | 10.0 | Inlet | 10 | 0.6 | 0.04 | 0.6 | 0.04 | 0.01 | 0.01 |
| Outlet 3 | 7 | 0.8 | 0.03 | 0.7 | 0.08 | 0.14 | 0.14 | ||
| 13 February 2016 | 18.4 | Inlet | 61 | 1.5 | 0.06 | 1.3 | 0.09 | 0.18 | 0.18 |
| Outlet | 29 | 1.1 | 0.06 | 1 | 0.08 | 0.13 | 0.13 | ||
| 1–2 March 2017 | 18.0 | Inlet | 66 | 1.1 | 0.08 | 1 | 0.03 | 0.08 | 0.08 |
| Outlet 3 | 13 | 0.9 | 0.04 | 0.8 | 0.02 | 0.06 | 0.06 | ||
| 18 May 2017 | 13.8 | Inlet | 19 | 0.7 | 0.01 2 | 0.6 | 0.33 | 0.01 | 0.01 |
| Outlet | 5 2 | 0.6 | 0.01 2 | 0.6 | 0.01 | 0.01 2 | 0.01 2 |
| TSS | TN | TP | NH3-N | NO3-N | NOx-N | ||
|---|---|---|---|---|---|---|---|
| CRE ± std. dev. [%] | 58 ± 29 | 7 ± 48 | 33 ± 33 | 45 ± 140 | 50 ± 33 1 | 49 ± 33 1 | |
| ER [%] | 81 | 17 | 52 | 8 | 47 | 47 | |
| p-value (Two-tailed) | assumption of normal distribution | 0.0312 2 | 0.311 | 0.0296 2 | 0.8094 | 0.0331 2 | 0.0341 |
| assumption of lognormal distribution | 0.0001 2 | 0.183 | 0.0072 | 0.8012 | 0.0403 2 | 0.0411 | |
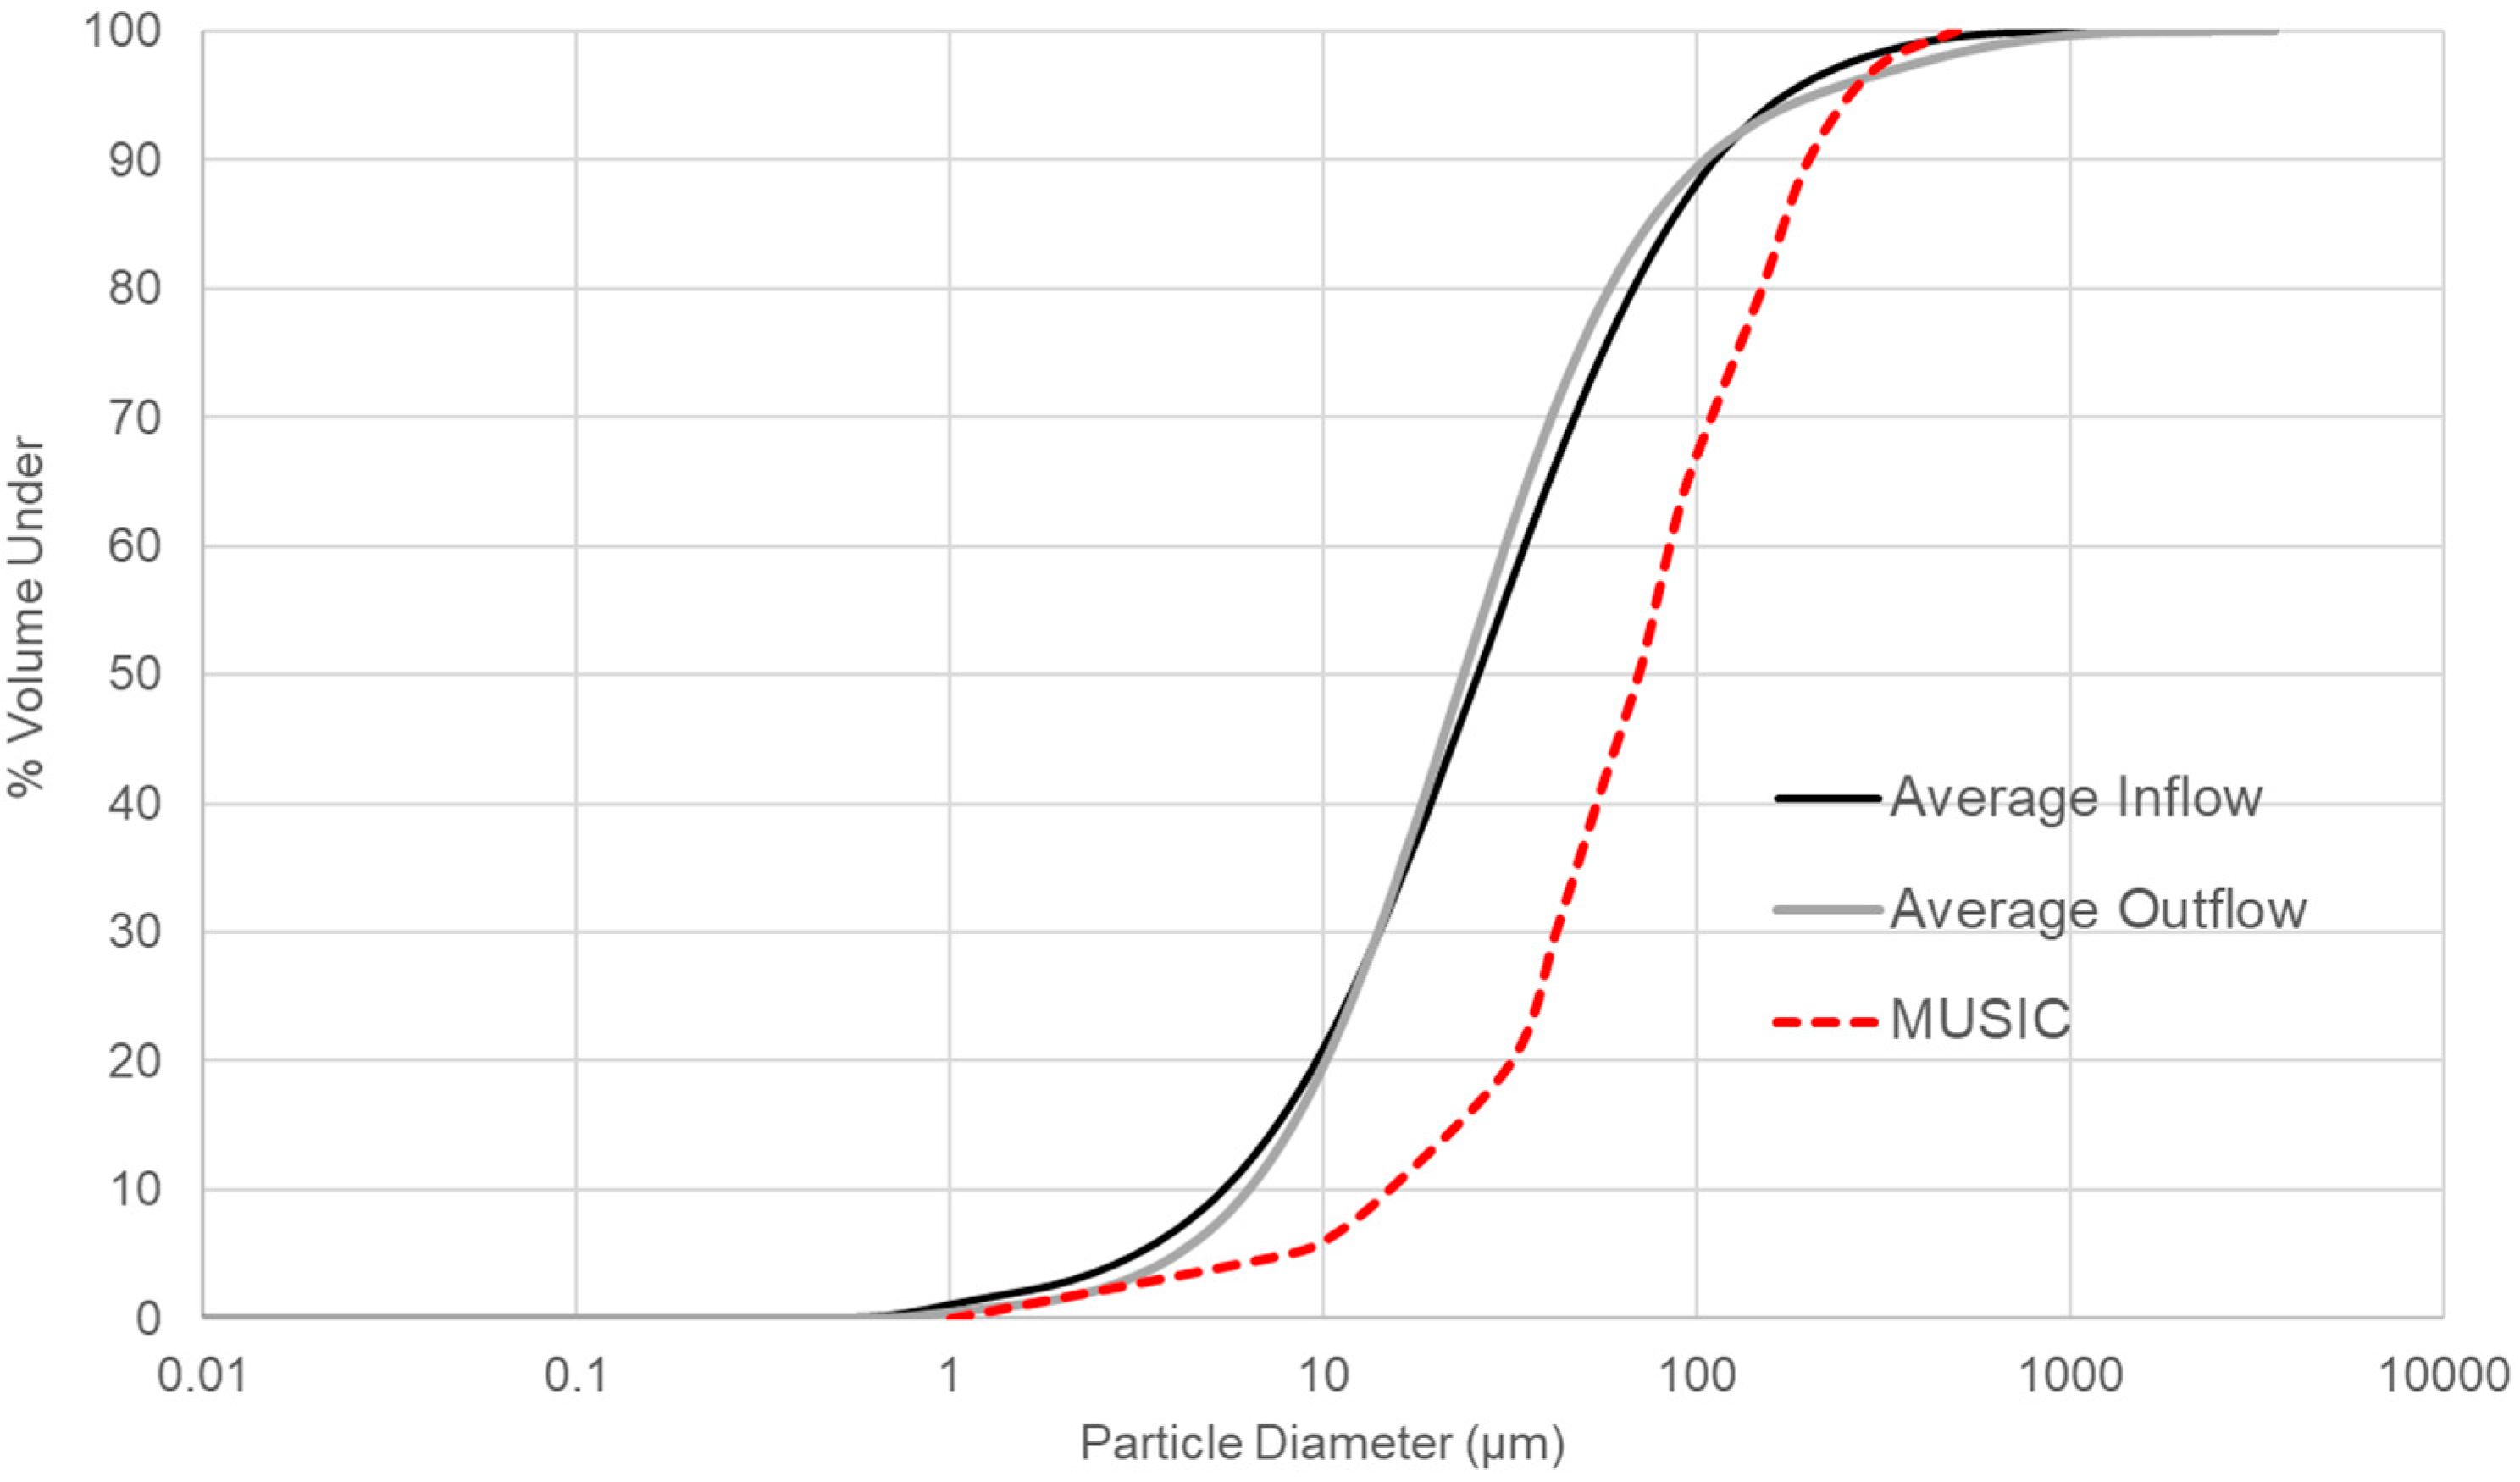
| Mass Diameter | Inflow Particle Size (µm) | Outflow Particle Size (µm) |
|---|---|---|
| D10 | 6.07 | 6.08 |
| D50 | 23.8 | 21.4 |
| D90 | 96.2 | 95.5 |
© 2017 by the authors. Licensee MDPI, Basel, Switzerland. This article is an open access article distributed under the terms and conditions of the Creative Commons Attribution (CC BY) license (http://creativecommons.org/licenses/by/4.0/).
Share and Cite
Walker, C.; Tondera, K.; Lucke, T. Stormwater Treatment Evaluation of a Constructed Floating Wetland after Two Years Operation in an Urban Catchment. Sustainability 2017, 9, 1687. https://doi.org/10.3390/su9101687
Walker C, Tondera K, Lucke T. Stormwater Treatment Evaluation of a Constructed Floating Wetland after Two Years Operation in an Urban Catchment. Sustainability. 2017; 9(10):1687. https://doi.org/10.3390/su9101687
Chicago/Turabian StyleWalker, Christopher, Katharina Tondera, and Terry Lucke. 2017. "Stormwater Treatment Evaluation of a Constructed Floating Wetland after Two Years Operation in an Urban Catchment" Sustainability 9, no. 10: 1687. https://doi.org/10.3390/su9101687
APA StyleWalker, C., Tondera, K., & Lucke, T. (2017). Stormwater Treatment Evaluation of a Constructed Floating Wetland after Two Years Operation in an Urban Catchment. Sustainability, 9(10), 1687. https://doi.org/10.3390/su9101687